enclosure 2 calculation number 10-4310.02-f-22 eswems ... · 1. were the design inputs correctly...
TRANSCRIPT

March 22, 2013 BNP-2013-036 Enclosure 2
Enclosure 2
Calculation Number 10-4310.02-F-22 "ESWEMS Retention Pond Spillway Overflow Analysis"

March 22, 2013
iD CQHI•II 4l[~]li ikgL
BNP-2013-036 Enclosure 2
CALCULATION COVER PAGE
Part 1 - GeneralCalculation Number: 10-4310.02-F22 Revision No.: 0
Calculation Title: ESWEMS Retention Pond Spillway Overflow AnalysisProject Number: 10-4310 Project Name: Bell Bend Relocation Effort - Hydrology 2.4
Number of Pages in Calculation: 30If this is a revision to a calculation, explain reason for revision: N/A
Have superseded versions of the calculation been stamped VOID or destroyed as required by Paragraph 8.2?E-Yes El No MN/A
If answer is No.. explain:
Part 2 - Completed by Originator1. Does the calculation contain the information required by Section 4.4 of QP-15? NYes [I No
If Answer is No. explain:
2. Has design or analysis software been used for the calculation? [Yes El NoIf Yes, complete the following:Software Name: HEC-HMS Version Number: 3.1.0
V&V Revision Number: I V&V Date: 11/14/2008
Printed Name of Originator: David Wallner
Signature: ,d•• •"L&&C. Date: 1/:23.2.0 13
Part 3 - Completed by Checker
1. Were the design inputs correctly selected and appropriately documented? Yes EJ No
2. Has the appropriate calculation methodology been used? L[2Yes C] No
3. Are assumptions described and justified? [EkYes [E No
4. Has the input been correctly selected and incorporated into the calculation? 0 Yes E] No
5. Is information and equations from external sources referenced and appropriate? El Yes [0 No
6. Are numerical calculations correct and have they been completely documented? rl Yes C] No
7. Are resultts reasonable considering the input? 5Yes EQ No
Printed Name of Checker- \ 4 mrjt -qdr--'0"
Signature . Date: lo
Part 4 - Approval (Completed by Project Manager or Principal-in-Charge)
Printed Name: G1 (A44
Signature______________ ____ Date:_____________
Page 1 of 31

March 22, 2013 BNP-2013-036
ENGINEERSICONSULTANTSJICIM
By: DJW Date: 01/23/13 Subject: ESWEMS Retention Pond SpillwayChecked By: • Date: jjj:jIM n|m. Overflow Analysis
Enclosure 2
Sheet No. I of 30Project No. 10-4310
TABLE OF CONTENTS
PAGE
1.0
2.0
3.0
4.0
5.0
6.0
7.0
8.0
9.0
STATEM ENT OF PURPOSE ............................................................................ 2
DESCRIPTION OF M ETHODOLOGY USED .................................................. 2
ASSUM PTIONS AND JUSTIFICATION ........................................................ 5
INPUT ...................................................................................................................... 7
NUM ERICAL CALCULATIONS .................................................................... 7
COM PUTER OUTPUT .................................................................................... 8
RESULTS ................................................ 8
CONCLUSION/SUM M ARY .............................................................................. 9
REFERENCES ................................................................................................... 9
APPENDICESAppendix A: 72-hr PMP Hyetograph (RIZZO, 2010b)Appendix B: Site Drainage AreasAppendix C: ESWEMS Retention Pond Elevation-Storage Curve (Response to RFI PCR-BER-
007)Appendix D: Swale Reach and Cross-SectionAppendix E: HEC-HMS Output
Page 2 of 31

March 22, 2013 BNP-2013-036 Enclosure 2
ENGINEERS/CONSULTANTSICIM
By: JW Date: 0j/13 Subject: ESWEMS Retention Pond Spillway Sheet No. 2 of 30Checked By: Date: Overflow Analysis Project No. 10-4310
1.0 STATEMENT OF PURPOSEThe purpose of this calculation is to determine the peak water level, flow rate andvelocity in the Essential Service Water Emergency Makeup System (ESWEMS)Retention Pond spillway and apron channels, and in the swale channel east of theESWEMS Retention Pond resulting from the spillway overflow that occurs duringthe 72-hour Probable Maximum Precipitation (PMP) event at the Bell BendNuclear Power Plant (BBNPP) site. Based on this analysis, a conclusion will bemade as to whether additional flood protection is required for the ESWEMSRetention Pond, which must be operational at all times since it is classified as asafety-related facility under Nuclear Regulatory Commission (NRC) RegulatoryGuide 1.27 (NRC, 1976).
2.0 DESCRIPTION OF METHODOLOGY USEDHEC-HMS is a software published by the U.S. Army Corps ofEngineers (USACE) Hydrologic Engineering Center (HEC). Version3.1.0 (RIZZO, 2008) will be used to model the ESWEMS RetentionPond spillway overflow and the routing of the overflow. Note that thesame HEC-HMS Version 3.1.0 model that was developed to evaluatethe effect of the 72-hour PMP event on the ESWEMS Retention Pond(see RIZZO, 2010a) was used to perform this analysis, but only the"Reach" elements were added in order to determine the peak waterlevel, flow rate and velocity in the ESWEMS Retention Pond spillwayand apron channels, and in the swale channel east of the ESWEMSRetention Pond.
Parameters needed for the HEC-HMS model are as follows:
1. Specified hyetograph for the rainfall event2. Drainage area of the ESWEMS Retention Pond3. SCS Loss Parameters
o SCS Curve Numbero Initial Abstractiono Percentage of drainage area that is impervious
4. Elevation-storage curve for the ESWEMS Retention Pond drainagearea and the starting Water Surface Elevation (WSE)
5. Discharge structure lengths, elevations, and coefficients6. Reach Element Input: reach length, cross-section, slope and
Manning's n coefficients.
Page 3 of 31

March 22, 2013 BNP-2013-036 Enclosurn
ENGINEERS/CONSULTANTS/CM
By: DJW Date: 0l/23/13 Subject: ESWEMS Retention Pond Spillway Sheet No. 3Checked By: jVZ Date: LH},• Overflow Analysis Project No. 14
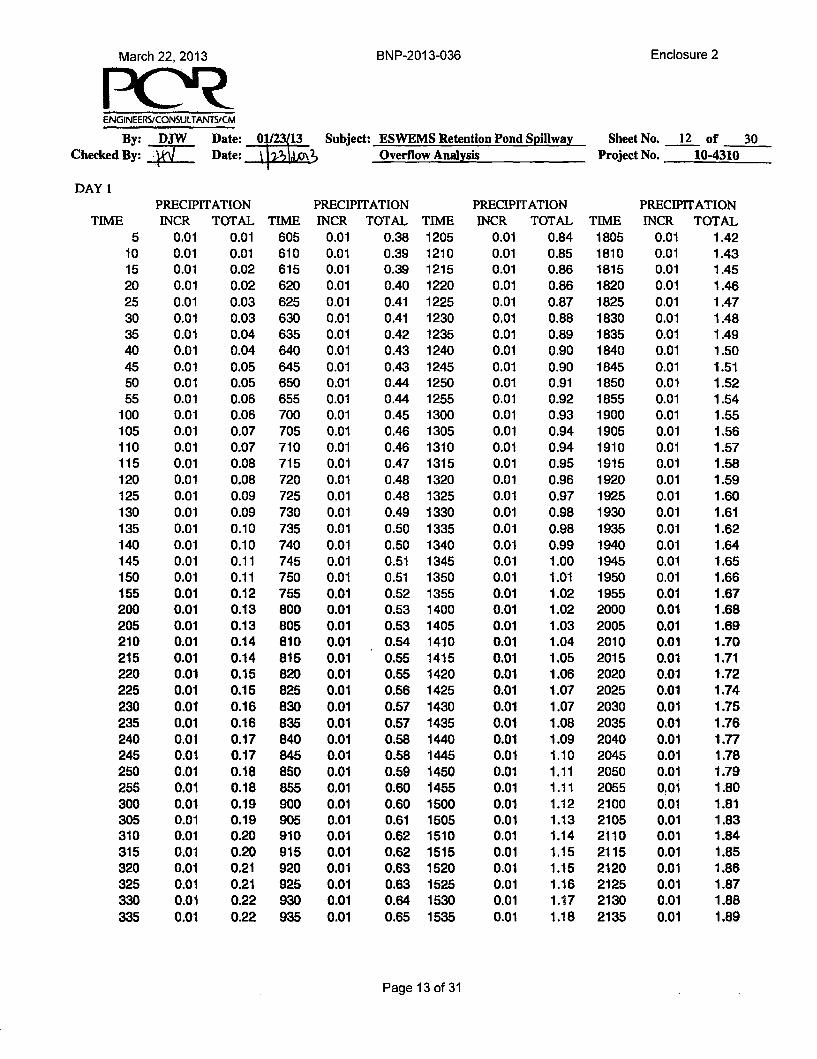
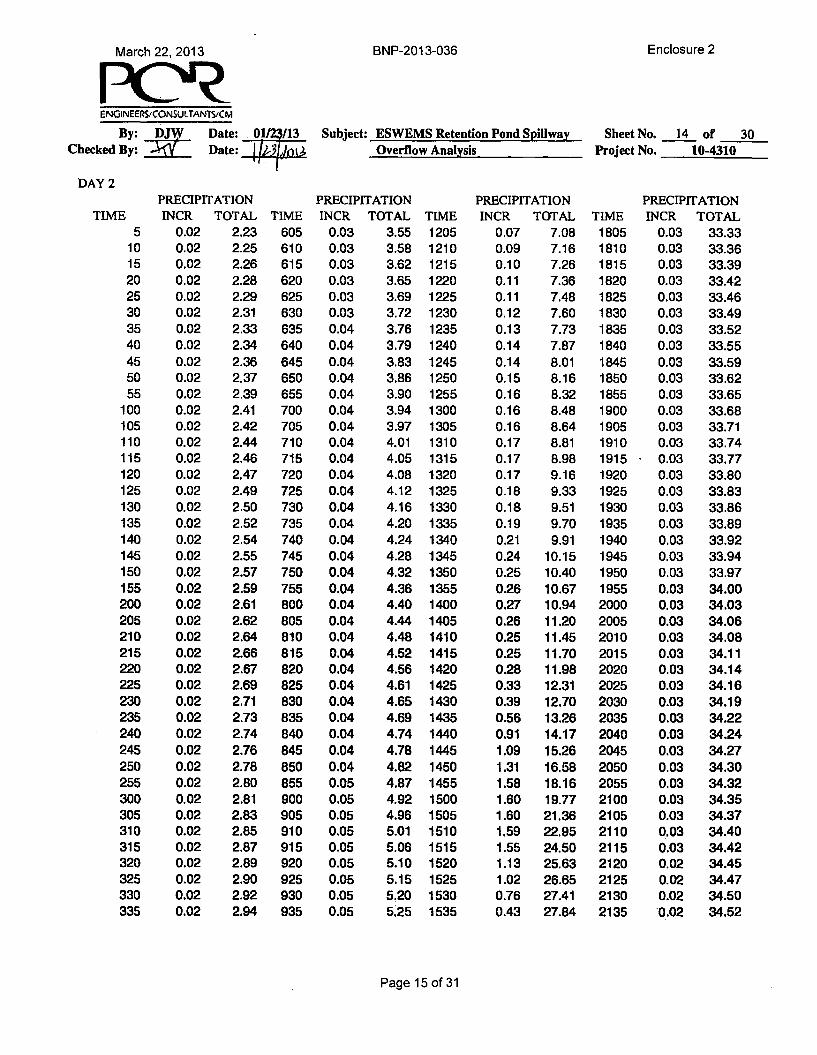
1. 72-hr PMP Hyetograph
The 72-hr PMP hyetograph was determined in RIZZO, 2010b and is provided inAppendix A.
e2
of 300-4310
2. Drainage Areas
The delineations of the drainage areas that make up the BBNPP siteare taken from RIZZO, 2011 and presented in Appendix B. Thedrainage area of the ESWEMS Retention Pond is presented in Table 2-1.
TABLE 2-1AREA AREA AREA
SuB-BASIN (ACRES) (M2)
ESWEMS Pond 312,271.28 7.169 0.01120
3. SCS Loss Parameters
Refer to Assumption I in Section 3.0 for the assumed SCS loss parameters thatwere used in the HEC-HMS model.
4. Elevation-Storage Curve
The ESWEMS Retention Pond was modeled as a storage reservoir inHEC-HMS. The storage capacity of the ESWEMS Retention Pondwas defined within the model using the "Elevation-Storage" method;the Elevation-Storage curve for the ESWEMS Retention Pond isprovided in Response to RFI PCR-BER-007 (see Appendix C). Thedimensions and elevations of the ESWEMS Retention Pond can besummarized as follows per the Response to RFI PCR-BER-007:
* Bottom elevation = 678 ft NAVD 88* Top elevation = 700 ft NAVD 88* The dimensions of the reservoir top elevation (700 ft NAVD
88) are 700 ft long and 400 ft wide* All sides have a slope of 3H:IV
The assumed starting Water Surface Elevation (WSE) within the HEC-HMS model (see Assumption 2) is shown in Table 2-2.
Page 4 of 31

March 22, 2013 BNP-2013-036 Enclosure 2
F C?ENGINEERS/CONSULTANTS/CM
By: DJW Date: 01/23/13 Subject: ESWEMS Retention Pond Spillway Sheet No. 4 of 30Checked By: tJW Date: Overflow Analysis Project No. 10-4310
TABLE 2-2
STARTING WSERESERVOIR ELEMENT (yr NAVD 88)
ESWEMS Pond Storage 695.0
5. Discharge Structures
Spillway overflow and top-of-berm overflow from the ESWEMSRetention Pond was modeled using the "Outflow Structures" routingmethod in HEC-HMS. The ESWEMS Retention Pond dischargestructures are labeled as Spillway 1 and Dam Top 1 (i.e., top-of-berm)according to their names in the HEC-HMS model, and are defined asfollows:
a Spillway I" El. = 698 ft NAVD 88 (Response to RFI PCR-BER-007)" Spillway Length (L) = 6 ft (Response to RFI PCR-BER-007)" Discharge Coefficient (C) = 2.65 (see Assumption 3)
9 Dam Top I" El. = 700 ft NAVD 88 (top-of-berm elevation, Response to RFI
PCR-BER-007)" Berm Length (L) = 2,153.26 ft (2,159.26' - 6'; see Appendix B)" Discharge Coefficient (C) = 2.63 (see Assumption 4)
6. Reach Element Input: Reach Length and Cross-Section
Three reach elements (Spillway Channel, Apron Channel, and Swale) wereincorporated into the HEC-HMS model in order to determine the peakwater level, flow rate and velocity in the ESWEMS Retention Pondspillway and apron channels, and in the swale channel east of theESWEMS Retention Pond.
The ESWEMS Retention Pond design was developed by Black & Veatch,and design details including the spillway design were provided to RIZZOin the Response to RFI PCR-BER-007. The Muskingum-Cunge methodwas used in HEC-HMS to define the routing characteristics of the SpillwayChannel reach, and all HEC-HMS inputs for the reach including thespillway channel dimensions and elevations from the Response to RFIPCR-BER-007 are identified as part of Assumption 5.
The design details for the Apron Channel, which receives discharge fromthe Spillway Channel and allows for the dissipation of energy before
page 5 of 31
March 22, 2013 BNP-2013-036 Enclosure 2
ENGINEERS!CONSULTANTS/CrM
By: DJW Date: Q1/23113 Subject: ESWEMS Retention Pond Spillway Sheet No. 5 of 30Checked By: f Date:]\ .- Overflow Analysis Project No. 10-4310
reaching the rip-rap lined portion of the channel, were provided in theResponse to RFI PCR-BER-030. The Muskingum-Cunge method wasused in HEC-HMS to define the routing characteristics of the ApronChannel reach, and all HEC-HMS inputs for the reach including the apronchannel dimensions and elevations from the Response to RFI PCR-BER-030 are identified as part of Assumption 6.
The Swale reach length and cross-section were determined based on theproposed grading plan (Response to RFI PCR-BER-0.19) and Assumption7. The Muskingum-Cunge method and the eight-point method were usedin HEC-HMS to define the routing characteristics of the reach and thegeometry of the reach, respectively. The Manning's n coefficient wasassumed to be 0.011, and the reach slope (or energy gradient) is 1.479percent as per Assumption 8. All HEC-HMS inputs for the Swale reachare shown in Appendix D. 1
3.0 ASSUMPTIONS AND JUSTIFICATION
1. The SCS Runoff Method parameters are as follows:a. The curve number (CN) is assumed to be 98 (NRCS, 1986).b. The initial abstraction is assumed to be 0 inches.c. The site is assumed to be 100% impervious.
These parameters represent a worst case scenario in which allrainfall is converted to runoff.
2. The assumed starting Water Surface Elevation (WSE) is El. 695,which is the specified normal water elevation in the ESWEMSRetention Pond (Response to RFI PCR-BER-007).
3. The spillway at the ESWEMS Retention Pond is a 6-foot longbroad-crested weir at El. 698 ft NAVD 88 (Response to RFI PCR-BER-007). Overflow of the spillway can be modeled as a broad-crested weir with a discharge coefficient of 2.65 (Table 5-3 inBrater and King, 1976; weir discharge coefficient correspondingto a spillway crest length of 5 ft and a head of 2 ft (698 ft - 700ft)).
4. Overflow of the berm can be modeled as a broad crested weir witha discharge coefficient of 2.63 (Table 5-3 in Brater and King,1976; weir discharge coefficient corresponding to spillway crestlengths greater than 15 ft). However, it is not acceptable for eitherthe ESWEMS Retention Pond pool elevation or the wave runup toexceed the dike at El. 700 ft NAVD 88 since the ESWEMSRetention Pond complex (i.e., the water supply and pump house) isclassified as a safety-related facility and must be able to perform
Page 6 of 31

March 22, 2013 BNP-2013-036 Enclosure 2
ENGINEERS/CONSULTANTS/CM
By: DJW Date: 01/23/13 Subject: ESWEMS Retention Pond Spillway Sheet No. 6 of 30Checked By: j Date: A-1:d4. Overflow Analysis Project No. 10-4310
its safety-related function in the event of severe natural phenomenaincluding Probable Maximum Flood (PMF) (NRC, 1976).
5. The Spillway Channel is trapezoidal in shape with an invertelevation of 698 ft NAVD 88, a bottom width of 6 ft, a side slopeof 3H: IV, a slope of 0.333 ft/ft, and a length of 9 ft (Response toRFI PCR-BER-OOT). Since the Spillway Channel is made up ofconcrete (see Response to RFI PCR-BER-007), the Manning's ncoefficient was assumed to be 0.011, which is representative ofsmooth surfaces such as concrete, asphalt, gravel, or bare soil(NRCS, 1986).
6. The Apron Channel is trapezoidal in shape with an invert elevationof 695 ft NAVD 88, a bottom width of 6 ft, a side slope of 3H: IV,a slope of 0.00010 ft/ft, and a length of 5 ft (Response to RFI-PCR-BER-030). Since the Apron Channel is partially made up ofconcrete and partially lined with rip-rap (see Response to RFI-PCR-BER-030), the Manning's n coefficient was assumed to be0.011, which is representative of smooth surfaces such as concrete,asphalt, gravel, or bare soil (NRCS, 1986).
7. The CAD file "xpGrad.dwg" that was provided in Response toRFI PCR-BER-019, which contains the post-constructioncontours for the site grading, was converted to a Digital ElevationModel (DEM) using ArcGIS as described in RIZZO, 2011. Smalldiscrepancies exist between the generated DEM and the AutoCADfile. For instance, a vertical wall in the CAD file is not vertical onthe DEM, but rather a very steep slope. Additionally, grading onroads not fully developed and represented in the CAD file result inan interpretation of the provided information to generate the DEM.These interpretations may or may not align with the final gradingplan. However, it is assumed that this DEM is an accurate inputfor the purpose of this analysis. For more information regardingthese discrepancies and inconsistencies, please refer to RIZZO,2011.
8. The Manning's n coefficient was assumed to be 0.011 for the"Swale" reach element defined within the HEC-HMS model,which is representative of smooth surfaces such as concrete,asphalt, gravel, or bare soil (NRCS, 1986). The reach slope (orenergy gradient) is 1.479 percent ([(695 ft - 690 ft) / 338.12 ft] *100 = 1.479 percent, or 0.01479).
9. As a worst-case scenario, the make-up pump at the ESWEMSRetention Pond is assumed to be unusable during this storm event.
10. The ESWEMS Retention Pond catchment is assumed to storerunoff with no time lag (T1,8 = 0); therefore, no runoff transformmethod was used.
Page 7 of 31

March 22, 2013 BNP-2013-036 Enclosure 2
E NGWNEERSCONSULTANTS/CM
By: DJW Date: 1AA 3_ Subject: ESWEMS Retention Pond Spillway Sheet No. 7 of 30Checked By: W Date: J4•L Overflow Analysis Project No. 10-4310
11. All elevations are referenced to North American Vertical Datum 1988 (NAVD88), unless otherwise noted
4.0 INPUT[All HEC-HMS model inputs are listed and provided in Section 2.0.
A Screenshot of the HEC-HMS model is shown below in Figure 4-1.
FIGURE 4-1
1 Pond Runoff
Pond Storage
SwaleSpillway Channel
Apron Channel
"44
5.0 NUMERICAL CALCULATIONSThe velocity corresponding to the peak flow over the ESWEMS Retention Pondspillway, the peak flow within the Spillway Channel, the peak flow within theApron Channel and the peak flow within the Swale will be calculated usingequations based on the HEC-HMS model output.
Since the ESWEMS Retention Pond spillway is modeled as a broad-crestedspillway in HEC-HMS, the weir equation will be used to calculate the velocity ofthe peak overflow:
Page 8 of 31

March 22, 2013 BNP-2013-036 Enclosure /
ENGINEERSiCONSULTANTS/CM
By: DJW Date: - 1W/13 Subject: ESWEMS Retention Pond Spillway Sheet No. 8 of 30Checked By: L Date: I J..L7|i Overflow Analysis Project No. 10-4310
V CLh3/ 2 (Equation 1)Where V - velocity, ft/s
A = area, ft2 (= Lh)C = weir discharge coefficient, C = 2.65 (see Assumption 3)L = length of the spillway crest, ft (L = 6 ft; see Assumption 3)h head on the spillway (vertical distance from the crest of the spillway to
the reservoir level), ft
Since the Spillway Channel, Apron Channel and Swale are modeled using theMuskingum-Cunge routing method in HEC-HMS, Manning's equation will beused to calculate the velocity of the peak flow:
V = L.49 R3S1/2 (Equation 2)n
Where V velocity, ft/sn = Manning's n coefficient, n = 0.011 (see Assumptions 5, 6 and 8)R = hydraulic radius (cross-sectional area divided by the wetted perimeter)S = energy gradient, ft/ft (see Assumptions 5, 6 and 8)
6.0 COMPUTER OUTPUT'Output from HEC-HMS is provided in Appendix E.
7.0 RESULTSThe peak WSE for each reservoir and reach element within the HEC-HMSmodel is presented in Table 7-1.
TABLE 7-1
RESERVOIR ELEMENT PEAK WSEREACH ELEMENT (Fr NAVD 88)
ESWEMS Pond Storage 698.36Spillway Channel 698.05Apron Channel 695.56
Swale 692.12
The peak flow over the ESWEMS Retention Pond spillway was calculated byHEC-HMS to be 3.42 cfs, and since the HEC-HMS model assumes no channellosses a peak flow rate of 3.42 cfs also occurs in the Spillway Channel, ApronChannel, and Swale.
Page 9 of 31

P----I ...... PI......... •A
March 22, 2013 BNP-2013-U036 -nclosure L
ENGINEERSICONSULTANTSICM
By: DJW Date: 01/23/13 Subject: ESWEMS Retention Pond Spillway Sheet No. 9 of 30Checked By: • Date: ý , Overflow Analysis Project No. 10-4310
Using Equation 1 and the peak spillway head of 0.36 ft (698.36 ft - 698 ft = 0.36ft) computed by HEC-HMS, the velocity of the peak flow over the ESWEMSRetention Pond spillway was calculated to be 1.59 ft/s.
Using Equation 2 and the peak water depth within the Spillway Channel of 0.05 ft(698.05 ft - 698 ft = 0.05 ft) computed by HEC-HMS, the velocity of the peakflow within the Spillway Channel was calculated to be 10.42 ft/s.
Using Equation 2 and the peak water depth within the Apron Channel of 0.56 ft(695.56 ft - 695 ft = 0.56 ft) computed by HEC-HMS, the velocity of the peakflow within the Apron Channel was calculated to be 0.80 ft/s.
Using Equation 2 and the peak water depth within the Swale of 0.12 ft (692.12 ft- 692 ft = 0.12 ft) computed by HEC-HMS, the velocity of the peak flow withinthe Swale was calculated to be 3.04 ft/s.
8.0 CONCLUSION/SUMMARYThe peak flow over the ESWEMS Retention Pond spillway was calculated to be3.42 cfs, which is significantly less than the 30 cfs that the spillway was designedto accommodate (Response to RFI-PCR-BER-030).
The Apron Channel receives discharge from the Spillway Channel and allows forthe dissipation of energy before reaching the rip-rap lined portion of the channel,and the rip-rap is adequate for turbulent flow of approximately 9 ft/s (Response toRFI-PCR-BER-030). The velocity of the peak flow within the Apron Channelwas calculated to be 0.80 ft/s, which is significantly less than 9 ft/s. Note thatalthough the velocity of the peak flow within the Spillway Channel was calculatedto be 10.42 ft/s, the Spillway Channel is made up of concrete not lined with rip-rap.
Flow from the Apron Channel discharges to a swale channel east of the ESWEMSRetention Pond. The peak WSE within the Swale was estimated to be 692.12 ftNAVD 88, so there are no flood impacts to the ESWEMS Retention Pond. TheSwale conveys surface runoff down and away from the BBNPP site.
Therefore, no additional flood protection is required for the ESWEMS RetentionPond.
9.0 REFERENCES1. Brater and King, 1976, Brater, Ernest F. and King, Horace W. (1976),
Handbook of Hydraulics: Sixth Edition.
Page 10 of 31

March 22, 2013 BNP-2013-036
ENGINEERSI'CONSULTANTSJCM
By: DJW Date: O123113 Subject: ESWEMS Retention Pond SpillwayChecked By: 1W Date: i,2i i11• Overflow Analysis
Enclosure 2
Sheet No. 10 of 30Project No. 10-4310
2. NRC, 1976, "Ultimate Heat Sink for Nuclear Power Plants," RegulatoryGuide 1.27, Nuclear Regulatory Commission (NRC), Office of StandardsDevelopment, Revision 2, January 1976.
3. NRCS, 1986, "Urban Hydrology for Small Watersheds, Technical Release 55(TR-55)," Natural Resource Conservation Service (NRCS; formerly SoilConservation Service (SCS)), June 1986.
4. RIZZO, 2011, "Site Layout CAD File Pre-processing and Elevation-Area IElevation-Storage," RIZZO Calculation, Calculation No. 10-4310.02-F7,Calculation Revision No.: 1.
5. RIZZO, 2010a, "Probable Maximum Flood (PMF) for Bell Bend NPPESWEMS Pond," RIZZO Calculation, Calculation No. 10-4310.02-F1O,Calculation Revision No.: 1.
6. RIZZO, 2010b, "Probable Maximum Storm Event for Walker Run Watershed(BBNPP)," RIZZO Calculation, Calculation No. 07-3891.02-Fl lh,Calculation Revision No.: 1.
7. RIZZO, 2008, "HEC-HMS Version 3.1.0 Verification and Validation(V&V)," V&V Revision No.: 1, V&V Revision Date: 11/14/2008, Project No.08-9006.
8. Response to RFI PCR-BER-0079. Response to RFI-PCR-BER-01910. Response to RFI-PCR-BER-030.
Page 11 of 31
March 22, 2013 BNP-2013-036
ENGINEERSCONSULTANTS/CM
By: DJW Date: • 01/3/13 Subject: ESWEMS Retention Pond SpillwayChecked By: Date: 411it Overflow Analysis
Appendix A
72-hr PMP Hyetograph (RIZZO, 2010b)
Enclosure 2
Sheet No. 11 of 30Project No. 10-4310
Page 12 of 31
March 22, 2013 BNP-2013-036 Enclosure 2
ENGINEERSCONSULTANTS9CM
By: DJW Date: 01/23113 Subject: ESWEMS Retention Pond Spillway Sheet No. 12 of 30
Checked By: , Date: -LU F•Eý Overflow Analysis Project No. 10-4310
DAY IPRECIPITATION PRECIPITATION
TIME INCR TOTAL TIME INCR TOTAL TIMEPRECIPITATION PRECIPITATION
INCR TOTAL TIME INCR TOTAL
510152025303540455055
100105110115120125130135140145150155200205210215220225230235240245250255300305310315320325330335
0.010.010.010.010.010.010.010.010.010.010.010.010.010.010.010.010.010.010.010.010.010.010.010.010.010.010.010.010.010.010.010,010.010.010.010.010.010.010.010.010.010.010.01
0.01 605 0.010.01 610 0.010.02 615 0.010.02 620 0.010.03 625 0.010.03 630 0.010.04 635 0.010.04 640 0.010.05 645 0.010.05 650 0.010.06 655 0.010.06 700 0.010.07 705 0.010.07 710 0.010.08 715 0.010.08 720 0.010.09 725 0.010.09 730 0.010.10 735 0.010.10 740 0.010.11 745 0.010.11 750 0.010.12 755 0.010.13 800 0.010.13 805 0.010.14 810 0.010.14 815 0.010.15 820 0.010.15 825 0.010.16 830 0.010.16 835 0.010.17 840 0.010.17 845 0.010.18 850 0.010.18 855 0.010.19 900 0.010.19 905 0.010.20 910 0.010.20 915 0.010.21 920 0.010.21 925 0.010.22 930 0.010.22 935 0.01
0.38 12050.39 12100.39 12150.40 12200.41 12250.41 12300.42 12350.43 12400.43 12450.44 12500.44 12550.45 13000.46 13050.46 13100.47 13150.48 13200.48 13250.49 13300.50 13350.50 13400.51 13450.51 13500.52 13550.53 14000.53 14050.54 14100.55 14150.55 14200.56 14250.57 14300.57 14350.58 14400.58 14450.59 14500.60 14550.60 15000.61 15050.62 15100.62 15150.63 15200.63 15250.64 15300.65 1535
0.010.010.010.010.010.010.010.010.010.010.010.010.010.010.010.010.010.010.010.010.010.010.010.010.010.010.010.010.010.010.010.010.010.010.010.010.010.010.010.010.010.010.01
0.84 1805 0.010.85 1810 0.010.86 1815 0.010.86 1820 0.010.87 1825 0.010.88 1830 0.010.89 1835 0.010.90 1840 0.010.90 1845 0.010.91 1850 0.010.92 1855 0.010.93 1900 0.010.94 1905 0.010.94 1910 0.010.95 1915 0.010.96 1920 0.010.97 1925 0.010.98 1930 0.010.98 1935 0.010.99 1940 0.011.00 1945 0.011.01 1950 0.011.02 1955 0.011.02 2000 0.011.03 2005 0.011.04 2010 0.011.05 2015 0.011.06 2020 0.011.07 2025 0.011.07 2030 0.011.08 2035 0.011.09 2040 0.011.10 2045 0.011.11 2050 0.011.11 2055 0.0i1.12 2100 0.011.13 2105 0.011.14 2110 0.011.15 2115 0.011.15 2120 0.011.16 2125 0.011.17 2130 0.011.18 2135 0.01
1.421.431.451.461.471.481 A91.501.511.521.541.551.561.571.581.591.601.611.621.641.651.661.671.681.691.701.711.721.741.751.761.771.781.791.801.811.831.841.851.861.871.881.89
Page 13 of 31

March 22, 2013 BNP-2013-036 Enclosure 2
ENGINEERS/CONSULTANTS/CM
By: DJW Date: 01/23/13 Subject: ESWEMS Retention Pond Spillway Sheet No. 13 of 30
Checked By: Id Date: 1 1 ; 31am Overflow Analysis Project No. 10-4310
DAY 1PRECIPITATION PRECIPITATION
TIME INCR TOTAL TIME INCR TOTAL TIMEPRECIPITATION PRECIPITATIONINCR TOTAL TIME INCR TOTAL
340345350355400405410415420425430435440445450455500505510515520525530535540545550555600
6-HRTOTAL
0.010.010.010.010.010.010.010.010.010.010.010.010.010.010.010.010.010.010.010.010.010.010.010.010.010.010.010.010.01
0.38
0.23 940 0.010.23 945 0.010.24 950 0.010.24 955 0.010.25 1000 0.010.26 1005 0.010.26 1010 0.010.27 1015 0.010.27 1020 0.010.28 1025 0.010.28 1030 0.010.29 1035 0.010.29 1040 0.010.30 1045 0.010.30 1050 0.010.31 1055 0.010.31 1100 0.010.32 1105 0.010.32 1110 0.010.33 1115 0.010.33 1120 0.010.34 1125 0.010.34 1130 0.010.35 1135 0.010.35 1140 0.010.36 1145 0.010.36 1150 0.010.37 1155 0.010.38 1200 0.01
0.65 15400.66 15450.67 15500.67 15550.68 16000.69 16050.69 16100.70 16150.70 16200.71 16250.72 16300.72 16350.73 16400.74 16450.74 16500.75 16550.76 17000.76 17050.77 17100.77 17150.78 17200.79 17250.79 17300.80 17350.81 17400.81 17450.82 17500.82 17550.83 1800
0.010.010.010.010.010.010.010.010.010.010.010.010.010.010.010.010.010.010.010.010.010.010.010.010.010.010.010.010.01
0.58
1.19 2140 0.011.19 2145 0.011.20 2150 0.011.21 2155 0.011.22 2200 0.011.23 2205 0.011.23 2210 0.011.24 2215 0.011.25 2220 0.011.26 2225 0.011.27 2230 0.011.28 2235 0.011.28 2240 0.011.29 2245 0.011.30 2250 0.011.31 2255 0.011.32 2300 0.011.32 2305 0.011.33 2310 0.011.34 2315 0.011.35 2320 0.011.36 2325 0.011.36 2330 0.011.37 2335 0.011.38 2340 0.011.39 2345 0.011.40 2350 0.011.40 2355 0.011.41 2400 0.01
1.901.911.931.941.951.961.971.981.992.002.012.032.042.052.062.072.082.092.102.122.132.142.152.162.172.182.192.202.22
0.46 0.80
Page 14 of 31
March 22, 2013 BNP-2013-036
ENGINEERSICONSULTANTS/CMl
By: DJW Date: .01123/13 Subject: ESWEMS Retention Pond SpillwayChecked By: Date: _ -.WraI Overflow Analysis
DAY 2
Enclosure 2
Sheet No. 14 of 30Project No. 10-4310
PRECIPITATION PRECIPITATIONTIME INCR TOTAL TIME INCR TOTAL TIME
PRECIPITATIONINCR TOTAL TIME
510152025303540455055
100105110115120125130135140145150155200205210215220225230235240245250255300305310315320325330335
0.020.020.020.020.020.020.020.020.020.020.020.020.020.020.020.020.020.020.020.020.020.020.020.020.020.020.020.020.020.020.020.020.020.020.020.020.020.020.020.020.020.020.02
2.23 605 0.032.25 610 0.032.26 615 0.032.28 620 0.032.29 625 0.032.31 630 0.032.33 635 0.042.34 640 0.042.36 645 0.042.37 650 0.042.39 655 0.042.41 700 0.042.42 705 0.042.44 710 0.042.46 715 0.042.47 720 0.042.49 725 0.042.50 730 0.042.52 735 0.042.54 740 0.042.55 745 0.042.57 750 0.042.59 755 0.042.61 800 0.042.62 805 0.042.64 810 0.042.66 815 0.042.67 820 0.042.69 825 0.042.71 830 0.042.73 835 0.042.74 840 0.042.76 845 0.042.78 850 0.042.80 855 0.052.81 900 0.052.83 905 0.052.85 910 0.052.87 915 0.052.89 920 0.052.90 925 0.052.92 930 0.052.94 935 0.05
3.55 12053.58 12103.62 12153.65 12203.69 12253.72 12303.76 12353.79 12403.83 12453.86 12503.90 12553.94 13003.97 13054.01 13104.05 13154.08 13204.12 13254.16 13304.20 13354.24 13404.28 13454.32 13504.36 13554.40 14004.44 14054.48 14104.52 14154.56 14204.61 14254.65 14304.69 14354.74 14404.78 14454.82 14504.87 14554.92 15004.96 15055.01 15105.06 15155.10 15205.15 15255.20 15305.25 1535
0.070.090.100.110.110.120.130.140.140.150.160.160.160.170.170.170.180.180.190.210.240.250.260.270.260.250.250.280.330.390.560.911.091.311.581.601.601.591.551.131.020.760.43
7.08 18057.16 18107.26 18157.36 18207.48 18257.60 18307.73 18357.87 18408.01 18458.16 18508.32 18558.48 19008.64 19058.81 19108.98 19159.16 19209.33 19259.51 19309.70 19359.91 1940
10.15 194510.40 195010.67 195510.94 200011.20 200511.45 201011.70 201511.98 202012.31 202512.70 203013.26 203514.17 204015.26 204516.58 205018.16 205519.77 210021.36 210522.95 211024.50 211525.63 212026.65 212527.41 213027.84 2135
PRECIPITATIONINCR TOTAL
0.03 33.330.03 33.360.03 33.390.03 33.420.03 33.460.03 33.490.03 33.520.03 33.550.03 33.590.03 33.620.03 33.650.03 33.680.03 33.710.03 33.740.03 33.770.03 33.800.03 33.830.03 33.860.03 33.890.03 33.920.03 33.940.03 33.970.03 34.000.03 34.030.03 34.060.03 34.080.03 34.110.03 34.140.03 34.160.03 34.190.03 34.220.03 34.240.03 34.270.03 34.300.03 34.320.03 34.350.03 34.370.03 34.400.03 34.420.02 34.450.02 34.470.02 34.50'0.02 34.52
Page 15 of 31

March 22, 2013 BNP-2013-036
ENGINEERSICONSULTANTSICM
By: DJW . Date: .1/23/13 Subject: ESWEMS Retention Pond SpillwayChecked By: Z Date: J4 DA34ji Overflow Analysis
DAY 2
Enclosure 2
PRECIPITATION PRECIPITATION PRECIPITATIONINCR TOTALTIME INCR TOTAL TIME INCR TOTAL TIME
340345350355400405410415420425430435440445450455500505510515520525530535540545550555600
6-HRTOTAL
0.020.020.020.020.020.020.020.020.020.020.020.020.020.020.020.020.020.020.020.020.020.020.020.020.020.020.020.020.02
1.30
2.96 9402.98 9453.00 9503.01 9553.03 10003.05 10053.07 10103.09 10153.11 10203.13 10253.15 10303.17 10353.19 10403.21 10453.23 10503.25 10553.27 11003.29 11053.31 11103.33 11153.35 11203.37 11253.39 11303.41 11353.43 11403.45 11453.47 11503.49 11553.51 1200
0.050.050.050.050.050.050.050.050.060.060.060.060.060.060.060.060.060.060.060.060.060.070.070.070.070.070.070.070.07
3.49
5.30 15405.35 15455.41 15505.46 15555.51 16005.56 16055.62 16105.67 16155.73 16205.79 16255.84 16305.90 16355.96 16406.02 16456.08 16506.14 16556.20 17006.26 17056.33 17106.39 17156.45 17206.52 17256.59 17306.65 17356.72 17406.79 17456.86 17506.93 17557.00 1800
0.360.300.260.250.250.270.270.260.250.230.200.180.180.170.170.170.170.160.160.150.150.140.130.130.120.110.100.090.08
26.29
28.1928.4928.7629.0129.2629.5329.8030.0630.3030.5330.7330.9131.0831.2631.4331.6031.7731.9332.0932.2432.3932.5332.6632.7932.9133.0233.1233.2133.29
Sheet No. 15 of 30Project No. 10-4310
PRECIPITATIONTIME INCR TOTAL2140 0.02 34.552145 0.02 34.572150 0.02 34.592155 0.02 34.622200 0.02 34.642205 0.02 34.662210 0.02 34.692215 0.02 34.712220 0.02 34.732225 0.02 34.762230 0.02 34.782235 0.02 34.802240 0.02 34.832245 0.02 34.852250 0.02 34.872255 0.02 34.892300 0.02 34.922305 0.02 34.942310 0.02 34.962315 0.02 34.982320 0.02 35.002325 0.02 35.032330 0.02 35.052335 0.02 35.072340 0.02 35.092345 0.02 35.112350 0.02 35.132355 0.02 35.152400 0.02 35.18
1.88
Page 16 of 31

March 22, 2013 BNP-2013-036
ENGINEERSICONSULTANTn/CM
By: DJW Date: 01/23113 Subject: ESWEMS Retention Pond Spillway
Checked By: ) Date: Overflow Analysis
Enclosure 2
Sheet No. 16 of 30Project No. 104310
DAY 3PRECIPITATION PRECIPITATION
TIME INCR TOTAL TIME INCR TOTAL TIMEPRECIPITATIONINCR TOTAL TIME
510152025303540455055
100105110115120125130135140145150155200205210215220225230235240245250255300305310315320325330335
0.010.010.010.010.010.010.010.010.010.010.010.010.010.010.010.010.010.010.010.010.010.010.010.010.010.010.010.010.010.010.010.010.010.010.010.010.010.010.010.010.010.010.01
35.19 60535.20 61035.22 61535.23 62035.24 62535.26 63035.27 63535.29 64035.30 64535.31 65035.33 65535.34 70035.36 70535.37 71035.38 71535.40 72035.41 72535.42 73035.44 73535.45 74035.47 74535.48 75035.49 75535.51 80035.52 80535.53 81035.55 81535.56 82035.58 82535.59 83035.60 83535.62 84035.63 84535.64 85035.66 85535.67 90035.69 90535.70 91035.71 91535.73 92035.74 92535.75 93035.77 935
0.010.010.010.010.010.010.010.010.010.010.010.010.010.010.010.010.010.010.010.010.010.010.010.010.010.010.010.010.010.010.010.010.010.010.010.010.010.010.010.010.010.010.01
36.18 120536.19 121036.20 121536.21 122036.22 122536.22 123036.23 123536.24 124036.25 124536.26 125036.27 125536.28 130036.29 130536.30 131036.31 131536.32 132036.33 132536.34 133036.35 133536.36 134036.37 134536.37 135036.38 135536.39 140036.40 140536.41 141036.42 141536.43 142036.44 142536.45 143036.46 143536.47 144036.48 144536.49 145036.50 145536.51 150036.51 150536.52 151036.53 151536.54 152036.55 152536.56 153036.57 1535
0.010.010.010.010.010.010.010.010.010.010.010.010.010.010.010.010.010.010.010.010.010.010.010.010.010.010.010.010.010.010.010.010.010.010.010.010.010.010.010.010.010.010.01
36.85 180536.86 181036.86 181536.87 182036.88 182536.89 183036.89 183536.90 184036.91 184536.91 185036.92 185536.93 190036.94 190536.94 191036.95 191536.96 192036.96 192536.97 193036.98 193536.98 194036.99 194537.00 195037.01 195537.01 200037.02 200537.03 201037.03 201537.04 202037.05 202537.06 203037.06 203537.07 204037.08 204537.08 205037.09 205537.10 210037.11 210537.11 211037.12 211537.13 212037.13 212537.14 213037.15 2135
PRECIPITATIONINCR TOTAL
0.01 37.360.01 37.370.01 37.370.01 37.380.01 37.380.01 37.390.01 37.390.01 37.400.01 37.410.01 37.410.01 37.420.01 37.420.01 37.430.01 37.430.01 37.440.01 37.450.01 37.450.01 37.460.01 37.460.01 37.470.01 37.470.01 37.480.01 37.490.01 37.490.01 37.500.01 37.500.01 37.510.01 37.510.01 37.520.01 37.530.01 37.530.01 37.540.01 37.540.01 37.550.01 37.550.01 37.560.01 37.570.01 37.570.01 37.580.01 37.580.01 37.590.01 37.590.01 37.60
Page 17 of 31

March 22, 2013 BNP-2013-036
ENGINEERS/CONSULTANTSOCM
By: DJW Date: 01/23/13 Subject: ESWEMS Retention Pond SpillwayChecked By: j Date: Overflow Analysis
Enclosure 2
Sheet No. 17 of 30Project No. 10-4310
DAY 3
PRECIPITATION PRECIPITATIONTIME INCR TOTAL TIME INCR
340345350355400405410415420425430435440445450455500505510515520525530535540545550555600
6-HRTOTAL
0.010.010.010.010.010.010.010.010.010.010.010.010.010.010.010.010.010.010.010.010.010.010.010.010.010.010.010.010.01
0.99
35.78 94035.80 94535.81 95035.82 95535.84 100035.85 100535.87 101035.88 101535.89 102035.91 102535.92 103035.93 103535.95 104035.96 104535.98 105035.99 105536.00 110036.02 110536.03 111036.04 111536.06 112036.07 112536.09 113036.10 113536.11 114036.13 114536.14 115036.15 115536.17 1200
0.010.010.010.010.010.010.010.010.010.010.010.010.010.010.010.010.010.010.010.010.010.010.010.010.010.010.010.010.01
0.67
TOTAL TIME36.58 154036.59 154536.60 155036.61 155536.62 160036.63 160536.64 161036.65 161536.66 162036.66 162536.67 163036.68 163536.69 164036.70 164536.71 165036.72 165536.73 170036.74 170536.75 171036.76 171536.77 172036.78 172536.79 173036.80 173536.81 174036.81 174536.82 175036.83 175536.84 1800
PRECIPITATIONINCR TOTAL TIME
0.01 37.16 21400.01 37.16 21450.01 37.17 21500.01 37.18 21550.01 37.18 22000.01 37.19 22050.01 37.20 22100.01 37.20 22150.01 37.21 22200.01 37.22 22250.01 37.23 22300.01 37.23 22350.01 37.24 22400.01 37.25 22450.01 37.25 22500.01 37.26 22550.01 37.27 23000.01 37.28 23050.01 37.28 23100.01 37.29 23150.01 37.30 23200.01 37.30 23250.01 37.31 23300.01 37.32 23350.01 37.33 23400.01 37.33 23450.01 37.34 23500.01 37.35 23550.01 37.35 2400
0.51
PRECIPITATIONINCR TOTAL
0.01 37.610.01 37.610.01 37.620.01 37.620.01 37.630.01 37.630.01 37.640.01 37.650.01 37.650.01 37.660.01 37.660.01 37.670.01 37.670.01 37.680.01 37.690.01 37.690.01 37.700.01 37.700.01 37.710.01 37.710.01 37.720.01 37.730.01 37.730.01 37.740.01 37.740.01 37.750.01 37.750.01 37.760.01 37.77
0.41
Page 1.8 of 31

March 22, 2013 BNP-2013-036 Enclosure 2
ENGINEERS/CONSULTAN'rSCM
By: DJW Date: 01/2-/13 Subject: ESWEMS Retention Pond Spillway Sheet No. 18 of 30Checked By: _ Date: J3 Overflow Analysis Project No. 10-4310
Figure A-i: Incremental 72-hr PMP Rainfall Hyetograph
1.0,,
1.6.
1.4.
1.2-
1.0,
o.
0.6"
0.4"
0.2-
0.0*00:00 12:00 00:00 12:00 00:00 12:00 00:00 12:00
1 01Jun2010 1 02Jun2010 I 03Jun2010 04Jun2010-ESWB'IS POND RUNOFF RUN:ESWBAS POND PMF PRECIP-INC
Page 19 of 31

March 22, 2013 BNP-2013-036
ENGINEERSICONSULTANTS/CM
By: DJW Date: 01/23/13 Subject: ESWEMS Retention Pond Spilway
Checked By: A Date: [N.311,w, Overflow AnalysisI I
Enclosure 2
Sheet No. 19 of 30Project No. 10-4310
Figure A-2: Cumulative 72-hr PMP Rainfall Hyetograph
z
a-•ft.
12:00 00:00 12:00 00:00 12:00
I olJun2010 I 02Jun2010 I Oun201072.HR PW GAGE PRECIP-CUM
00:00
Page 20 of 31

March 22, 2013 BNP-2013-036
ENGINEERS/CONSULTANTS/CM
By: DJW Date: 01/23/13 Subject: ESWEMS Retention Pond SpillwayChecked By: J Date: Overflow Analysis
Enclosure 2
Sheet No. 20 of 30Project No. 10-4310
Appendix B
Site Drainage Areas
Page 21 of 31

March 22, 2013 BNP-2U13-U36
ENGINEERS/CONSULTANTSCM
By: DJW Date: 01/23113 Subject: ESWEMS Retention Pond SpillwayChecked By: _4L Date: !! ;]JOv• Overflow Analysis
Figure B-i: BBNPP Site Drainage Areas (RIZZO, 2011)
Enclosure 2
Sheet No. 21 of 30Project No. 10-4310
I 1ý I" - :;iý
w
Page 22 of 31

March 22, 2013 BNP-2013-036
ENGINEERSCONSULTANTrCCM
By: D Date: 0 3 Subject: ESWEMS Retntlon Pond SpiliwayChecked By: W Date: I I O 'Overflow Analysis
Enclosure 2
SheetNo. 22 of 30Project No. 10-4310
Figure B-2: ESWEMS Retention Pond Drainage Area (RIZZO, 2011)
,Y! ItI A,.--Ai, ,
Be & W b~wisUmdSobbn pdFW UDisge a f: F -- -J
*0 5Wdm...RIad.0 ov~row_
.0 Bmsn l0.4C+0 Basb10MB+ 03 EusL04A
- a
Luow: 472.02
494
A.
. . ..... . . ...i u w ii J ni (O E i l
6
D~ft
2407M982 339M, t ,, u
v !
Page 23 of 31

March 22, 2013 BNP-2013-036
ENGINEERSICONSULTANrSICM
By: DJW Date: / Subject: ESWEMS Retention Pond SpillwayChecked By: - A Date: Overflow Analysis
Enclosure 2
Sheet No. 23 of 30Project No. 10-4310
Appendix C
ESWEMS Retention Pond Elevation-Storage Curve (Response to RFI PCR-BER-007)
Page 24 of 31

ENGINEERS CONSULTANTS CM
By: DJW Date: 01/23/13 Subject: ESWEMS Retention Pond Spillway
Checked By: f Date: Overflow AnalysisSheet No. 24 of 30
Project No. 10-4310
0)0
o,N,
Calcilation 161642.51.2001 Rev. 1 Attachmert 1:Pond Vo uire to Depth Table
Page 1 of I
Elevation First Second
Depth Freeboard 4Ms.14 Total Volume Total Volume Trapezoidal Trapezoidal Cone Volume
(tt) (ft) (NGVD 88) (ftA3) (acre-ft) Volume (ftA3) Volume (ftA3) (ft-3)0 22 678 0.000E-00 2020 0.200E+00 0.OOOE-00 0.200E+00
1 21 679 1.543E-05 3 543 1.431E+05 9.604E-03 1,455E+03
2 2. 680 3.137E-05 72.1 2.893E+05 2.09SE-D4 3.343E+03
3 19 68, 4.780E-05 10973 4.386E+05 3.352E-04 5.721E+03
4 1s 682 6.474E-05 14 8E3 5.914E+05 4.742E-04 8.e46E+03
5 17 683 8.220E-05 16 870 7.'-71E+05 6.270E-04 1,217E+04
6 16 684 1.002E-06 229,97 9.260E+05 7.934E-04 1.636E+04
7 1. 685 1.187E-06 27244 i.268E+06 9.736E-04 2.127E+04
a 1 686 1.37 7 E-06 31 614 1.233E+06 1.167E-05 2.e94E+04
9 13 687 1.573E-06 36.-1 .6 1 .02E+06 1.375E-05 3.345E+04
"00o
CII1Z111213'1,
is1519
2"2122
121112
7E
321
68868969069.692693694695696697698699700
1 .774E-061.980E-062.193E-062.410E-062.634E-062.663E-063.09;JE-063.338E-063.Sa5E-063.637E-064.096E-064.360E-064.631 E-06
40723 1.!73E+06 1.596E-0545465 1.748E+06 1.631E-0550335 1.,•26E+06 2.079E-0555333 2.I07E+06 2.342E-0560A4eI 2.292E+06 2.617E-0565719 2.a79E+06 2..%7E-0571 110 2.E70E+06 3.210E-0576 635 2863E+06 3.527E-0582294 3.060E+06 3.658E-0586019 3.260E+06 4.202E-0594 022 3.464E+06 4.560E-05
120 094 3.f70E+06 4.932E-051^6.326 3.980E+06 5.317E-05
4 .64E+044.918E+045.851E+046.5-J0E+048.:40E+049.307E+04I ."70E+051.221E+051.367E+051.566E+051.759E+051 .968E+052.192E+05
Margin
-120 02% At grade lengtq: 70C-92-52%-84.81% At grade width: 406-76.85%-6a&64% S ope: 0.33-60.19%-51.48% Bottom Radius: 20-42.52%-33.30% Minitrum VolJrre: 2.06E-06-23.82% (fft3)-14.0I%-4.08%620%
16 74%27.56%38&65%5 030%67 68%73 62%85+85%9H 37%Ili 18%124-28%
COZ"0
0
m00"-hC9
o,

March 22, 2013 BNP-2013-036
ENGNEERS/ CONSULTANTS/CM
By: DJW Date: 01/23/13 Subject: ESWEMS Retention Pond Spillway
Checked By: W Date: Overflow Analysis
Enclosure 2
Sheet No. 25 of 30Project No. 10-4310
Appendix DSwale Reach and Cross-Section
Page 26 of 31

March 22, 2013 BNP-2013-036
ENGINEERSICONSULTANTS/CM
By: DJW Date: 91/23/13 Subject: ESWEMS Retention Pond SpillwayChecked By: jj/ Date: Overflow Analysis
Enclosure 2
Sheet No. 26 of 30Project No. 10-4310
Figure D-1: Swale Reach Length and Cross-Section
==m - F_ _73 [ _-
*0 BAM6JtMC e0 BZo,4IOAC
0* 0 BaVijAA
NO ti 149•0.4 5
- 2 e•'apAo~
is Low! 47O2OD
& !,# A6, a in I - W? 61 a m. , '. et db 4D tp Ik db A it a,
2M . 339=667 . .. A-ed
2lG77lt3.W :9Z33667 Pint
Page 27 of 31

March 22, 2013 BNP-2013-036
ENGINEERSICONSULTANTSCM
By: DJW Date: U23/13 Subject: ESWEMS Retention Pond SpillwayChecked By: Abt Date: Overflow Analysis
Table D-1: Reach Length Input
Enclosure 2
Sheet No. 27 of 30Project No. 10-4310
Assumed Manning's
Reach Length (ft) Slope (ft/ft)* n*Swale 338.12 0.01479 0.011
*See Assumption 6.
Figure D-2: "Swale" Cross-Section
z2
700
699
698
697
696
695
694
693
692
691
-4-Cross-Section Data from DEM
-3--8-Point Cross-Section
695 S
1694.06402$
T T
0 50 100 150 200 250
Distance (fit)
Page 28 of 31

March 22, 2013 BNP-2013-036
ENGIANEERSCONSULTAMTSiCM
By: DJW Date: 91/213 Subject: ESWEMS Retention Pond SpillwayChecked By: . Date: 14;J 1" 03 Overflow Analysis
Appendix EHEC-IMS Output
Enclosure 2
Sheet No. 28 of 30Project No. 10-4310
Page 29 of 31

March 22, 2013 BNP-2013-036
ENGINEERS!CONSULTANTS/CM
By: DJW Date: 01/23/13 Subject: ESWEMS Retention Pond SpillwayChecked By: Date: 3 kV!• Overflow AnalysisChecked By
Enclosure 2
Sheet No. 29 of 30Project No. 10-4310
Figure E-1: ESWEMS Retention Pond Spillway and Reach Hydrographs
U-
12:00 (. 00 12:00 (1Q00 12:00 00.102Jun2010 I 03Jun2010 I 04Jun2{10
-- ESWSA POND STORAGiESPILL-I RUNESWEMS POND PMF FLOW SPILLWAY CHANNEL RUN:ESWES POND PW FLOW
APRON CHANNEL RUNMESWBWS POND PMF FLOW SWALE RUN:EBS POND PMF FLOW
Page 30 of 31

March 22, 2013 BNP-2013-036 Enclosure 2
ENGINEERSICONSULrANTSICM
By: DJW Date: 01/23113 Subject: ESWEMS Retention Pond Spillway Sheet No. 30 of 30Checked By: Date: Overflow Analysis Project No. 10-4310
Figure E-2: ESWEMS Retention Pond Elevation and Reach Stage Elevations
698.5-698.,0697.5-
i.697.0-
696.5-wu 696.0-
695.5"695.0"694.5-
699698.697"
p 696"~. 695 . .. . ..... .... .. . . .. . .. . ./ - -
Cm 694-rn 693-
692691,
00:00 12.00 00:00 12:00 00:00 12:00 00:00 12:00 00:00I 01Jun2010 I 02Jun2010 03Jun2010 04Jun2010
- ESWBA POND STORAGE RUN:ESWEIAS POND PMF ELEVATION
-- SPILLWAY CHANNEL RUN:ESWBhS POND PWF STAGE.SWlAPRON CHANNEL RUN:ESWWBS POND PMF STAGE-SIASWALE RUN:ESWEMS POND PMF STAGE-SPA
Page 31 of 31