endesa amÉricas s.a
TRANSCRIPT

ENDESA AMÉRICAS S.A. Independent Appraiser report on the merger between Enersis Américas S.A., Endesa Américas S.A. and Chilectra Américas S.A. August 5th, 2016 M$ - Chilean pesos in thousands

CONTENTS PAGE I Scope of the report 1 II Background information 1 III Criteria considered in determining the book equity value of the merged company 2 IV Pro-forma values of the merger at June 30 th, 2016 3 V Considerations regarding the share exchange ratio 4 VI Legal, tax, and accounting considerations 5 VII Conclusion 5 VIII Independent Appraiser declaration 6 ANNEXES I Pro-forma balance sheet resulting from the merger between Enersis Américas S.A., Endesa
Américas S.A. and Chilectra Américas S.A., as adjusted by the Independent Appraiser. II Share exchange ratio, determined by the Independent Appraiser at June 30th, 2016. III Consolidated financial statements of Enersis Américas S.A. at June 30th, 2016 and the auditor’s
report. IV Consolidated financial statements of Endesa Américas S.A. at June 30th, 2016 and the auditor’s
report. V Consolidated financial statements of Chilectra Américas S.A. at June 30th, 2016 and the auditor’s
report. VI Valuation report on Enersis Américas S.A., Endesa Américas S.A. and Chilectra Américas S.A.,
prepared by PwC Chile.

INDEPENDENT APPRAISER REPORT ON THE MERGER BY INCORPORATION BETWEEN ENERSIS AMÉRICAS S.A., ENDESA AMÉRICAS S.A. AND CHILECTRA AMÉRICAS S.A. Santiago, August 5th, 2016 Directors and Shareholders Endesa Américas S.A. I Scope of the report This independent Appraiser report is issued in connection with the proposed merger by incorporation of Endesa Américas S.A. and Chilectra Américas S.A. into Enersis Américas S.A., with the objective of:
a) Obtaining an independent view on the reasonableness of the merged pro-forma balance sheet as at June 30th, 2016 that has been prepared by the Management of Enersis Américas S.A. and the adjustments made to reflect the capital increase based on the share exchange ratio determined by the Independent Appraiser, in compliance with Chile legislation.
b) Determine the share exchange ratio of the shares of Enersis Américas S.A., Endesa Américas
S.A. and Chilectra Américas S.A. and the number of new shares to be issued by Enersis Américas
S.A., which should be delivered in exchange for each of the shares of Endesa Américas S.A. and
Chilectra Américas S.A. once the merger is consummated.
II Background information The following documents have been used as a basis for the determining the merged pro-forma balance sheet as at June 30th, 2016, the share exchange ratio and the number of shares to be issued by Enersis Américas S.A. for the shares of Endesa Américas S.A. and Chilectra Américas S.A.:
The essential facts of the merger communicated to the Superintendencia de Valores y Seguros
(SVS) on May 6th, 2016 by Enersis Américas S.A., Endesa Américas S.A. and Chilectra Américas S.A.
Minutes from the board meetings (N° 07/2016) of Enersis Américas S.A., Endesa Américas S.A. and Chilectra Américas S.A. held on May 6th, 2016.
Minutes from the Extraordinary Shareholders’ Meeting of Enersis Américas S.A. on December 18th, 2015.
Minutes from the Extraordinary Shareholders’ Meeting of Endesa Américas S.A. on December 18th, 2015.
Minutes from the Extraordinary Shareholders’ Meeting of Chilectra Américas S.A. on December 18th, 2015.
Consolidated interim financial statements of Enersis Américas S.A. as at June 30th, 2016, audited by EY Chile.
Consolidated interim financial statements of Endesa Américas S.A. as at June 30th, 2016, audited by EY Chile.

Santiago, August 5th, 2016
Endesa Américas S.A. 2
Consolidated interim financial statements of Chilectra Américas S.A. as at June 30th, 2016, audited by EY Chile.
Spreadsheets with of Enersis Américas S.A., Endesa Américas S.A. and Chilectra Américas S.A., with consolidation adjustments and other adjustments made in order to generate the merged pro-forma balance sheet as at June 30th, 2016.
Consolidation spreadsheets of Enersis Américas S.A., Endesa Américas S.A. and Chilectra Américas S.A. and their respective subsidiaries.
Share exchange ratio proposed by the Board of the Companies dated on November 24th, 2015, in accordance to the provisions of the fourth paragraph of Article No. 156 of the Regulation of Share Corporations and the corresponding provisions of the General Rule No. 30 issued by the Superintendence of Share Corporations and Insurance Companies (“SVS”). The Board of Directors of Enersis Américas S.A., Endesa Américas S.A. and Chilectra Américas S.A. proposed a share exchange ratio of 2.8 shares of Enersis Américas for each share of Endesa Américas and 5.0 Enersis Américas shares for each share of Chilectra Américas.
Valuation report of Enersis Américas S.A, Endesa Américas S.A. and Chilectra Américas S.A., prepared by PwC Chile.
III Criteria considered in determining the book equity value of the merged company The Extraordinary Shareholders’ Meetings of Enersis Américas S.A., Endesa Américas S.A. and Chilectra Américas S.A. will decide whether or not to approve the merger by incorporation of Endesa Américas S.A. and Chilectra Américas S.A. into Enersis Américas S.A. Should the merger be approved, all the assets, liabilities, rights and obligations of Endesa Américas S.A. and Chilectra Américas S.A. will be incorporated into Enersis Américas S.A., which will then become the legal and reporting entity of Endesa Américas S.A. and Chilectra Américas S.A. In view of the aforementioned and as required for the purposes of the merger, I have reviewed the pro-forma balance sheet of Enersis Américas S.A. that has been prepared by Management assuming that the merger will be approved (Annex I) and which incorporates the assets, liabilities, rights and obligations of Endesa Américas S.A. and Chilectra Américas S.A. at their book values as at June 30th, 2016. The aforementioned pro-forma balance sheet is attached in Annex I and is based on the version prepared by Management, but includes an adjustment resulting from the difference between the share exchange ratio proposed by the Board and the share exchange ratio determined by the Independent Appraiser. The adjustment to the share exchange ratio does not impact Enersis Americas S.A.’s total merged shareholders’ equity. The above is based on the interim financial statements of Enersis Américas S.A., Endesa Américas S.A. and Chilectra Américas S.A. as at June 30th, 2016, audited by EY Chile, who issued an unqualified opinion on July 27th, 2016. The consolidated financial statements of Enersis Americas S.A. as at June 30th, 2016 audited EY Chile, include all the assets and liabilities of Endesa Américas S.A. and Chilectra Américas S.A. at that date. The non-controlling interests in Endesa Américas S.A. and Chilectra Américas S.A. that does not belong to Enersis Américas S.A. is disclosed within shareholders’ equity as Minority Shareholders’ Interest.

Santiago, August 5th, 2016
Endesa Américas S.A. 3 IV Pro-forma values of the merger at June 30th, 2016 In relation to the assets, liabilities and equity included in the pro-forma balance sheet of Enersis Américas S.A. (refer to Annex I), I am able to report that the value of these assets, liabilities and equity equate to the values included in the financial statements of the absorbed companies (Endesa Américas S.A. and Chilectra Américas S.A.) as at June 30th, 2016, audited by EY Chile, and include the appropriate consolidation and merger adjustments (see Annex I). The interim consolidated balance sheets used in the preparation of the merged balance sheet pro-forma included in Annex I are the responsibility of the Companies’ management. The Independent Appraiser has carried the following procedures with regards to the merged pro-forma balance sheet: a) Verify the amounts of the assets, liabilities and equity included in the merged pro-forma balance
sheet from each company involved in the merger, to the interim financial statements as at June 30th,
2016 audited by EY Chile.
b) Verify the sum of the asset and liability values in the absorbed companies’ financial statements as at
June 30th, 2016, to the sum of assets and liabilities included in the pro-forma interim balance sheet.
c) Verify that the necessary intercompany transactions and investments in the absorbed companies are
eliminated and duly explained by Company’s management in the notes of the pro-forma balance
sheet.
d) Verify that the non-controlling interests in Endesa Américas S.A. and Chilectra Américas S.A., are
included in the minority shareholders’ interest in Enersis Américas S.A.
e) Ensure that the adjustments to the consolidated financial statements of Enersis Américas S.A.
(resulting from the merger) to arrive at merged pro-forma balance sheet, are properly explained by
the Company’s management.
Based on the aforementioned, I am able to conclude that the financial information presented in Annexes III, IV and V, represent the entirety of the assets and liabilities of Endesa Américas S.A. and Chilectra Américas S.A. that are included in the merged pro- forma balance sheet of Enersis Américas S.A. (Annex I).

Santiago, August 5th, 2016 Endesa Américas S.A. 4 V Considerations regarding the share exchange ratio The Board of Directors of Enersis Américas S.A., Endesa Américas S.A. and Chilectra Américas S.A. held on November 24th, 2015 proposed a share exchange ratio of 2.8 shares of Enersis Américas for each share of Endesa Américas and 5.0 Enersis Américas shares for each share of Chilectra Américas. To determine the share exchange ratio of the companies involved, I have used as a reference the results of the economic valuation of the equity of Enersis Américas S.A., Endesa Américas S.A. and Chilectra Américas S.A. at June 30th, 2016, prepared by PwC Chile (see Annex VII), in addition to the information provided by the Management of each company that I considered relevant to the issuance of this report. The economic valuations of Chilectra Américas S.A. and Enersis Américas S.A. at June 30th, 2016 include the impact of a distribution of an extraordinary dividend to be paid by Chilectra Américas in 2016 for a total of CLP M 120,000, prior to the merger being legally consummated. The proposed dividend will be submitted by the Board of Directors for approval by the Chilectra Américas S.A.’s Extraordinary Shareholders’ Meeting that is scheduled to analyse the merger. The proposed dividend is not reflected in the audited financial statements of Chilectra Américas S.A. and Enersis Américas at June 30th, 2016. In consideration of the aforementioned dividend, the Companies’ management informed us that the Board of Directors of Enersis Américas S.A. will propose a modified share exchange ratio to the Extraordinary Shareholders’ Meeting of 4.0 Enersis Américas shares for each share of Chilectra Américas. Based on the review of this Independent Appraiser in view of the abovementioned merger by incorporation, the share exchange ratios determined by me based on the Economic Valuation report of Enersis Américas, Endesa Américas and Chilectra Américas prepared by PwC Chile (Annex VI), are as follows:
2.5979 (two point five nine seven nine) shares of Enersis Américas S.A. for each share of Endesa Américas S.A.
3.2431 (three point two four three one) shares of Enersis Américas S.A. for each share of Chilectra
Américas S.A.
Based on the share exchange ratio determined by this Independent Appraiser, the shares to be issued in exchange are as follows:
Enersis Américas
Endesa
Américas
Chilectra
Américas
Controlling shareholder (Enel) 29,762,213,531 4,919,488,794 1,140,277,555
Minority shareholders 19,330,559,231 3,282,265,786 10,464,606
Total number of shares 49,092,772,762 8,201,754,580 1,150,742,161
Share exchange ratio for Enersis shares 2.5979 3.2431
Number of new Enersis Américas shares to be issued 8,527,100,484 33,937,653
Total number of new Enersis Américas shares to be issued 8,561,038,137

Santiago, August 5th, 2016
Endesa Américas S.A. 5 The above will require an increase in the number of shares and share capital based on the market value of the new shares to be issued by Enersis Américas, since each share of Endesa Américas S.A. and Chilectra Américas S.A. will be replaced by shares of Enersis Américas S.A. based on the share exchange ratio proposed at the Extraordinary Shareholders’ Meeting. This merger is subject to the terms of the resolutions adopted at the aforementioned Extraordinary Shareholders’ Meeting of the companies, particularly with regard to compliance of the suspensive condition that refers to the right of withdrawal that could be exercised by the shareholders of Enersis Américas SA, Endesa Américas SA and Chilectra Américas S.A. as a result of the merger, limiting those withdrawals to 10.0%, 10.0% and 0.91% respectively, as well as to the extent that the right to withdraw of Enersis Américas S.A. does not lead to any shareholder exceeding the maximum concentration of 65% shareholding of Enersis Américas S.A. post-merger. VI Legal, tax, and accounting considerations The merger by incorporation of Enersis Américas S.A. RUT No. 94271000-3, (surviving company), Endesa Américas S.A., RUT No. 76536351-9 and Chilectra Américas S.A., RUT No. 76532379-7 (absorbed companies), will materialize and be perfected once approved by the respective Extraordinary Shareholders’ Meetings to be held to analyze the merger and compliance of all formalities required by the relevant legal standards. VII Conclusion This Independent Appraiser declares that I have reviewed the reasonableness of the consolidated pro-forma balance sheet of Enersis Américas S.A., Endesa Américas S.A. and Chilectra Américas S.A. as at June 30th, 2016, originally prepared by the Companies’ management, in addition to the attestation report prepared by EY Chile (with respect to the consolidated balance sheet of Enersis Américas S.A. and its subsidiaries), and declare that the pro-forma balance sheet is consistent with the notes and with the accounting standards applied by Enersis Américas S.A., Endesa Américas S.A. and Chilectra Américas S.A., detailed in the interim consolidated financial statements as at June 30th, 2016 for the purpose of this merger. In the opinion of the Independent Appraiser:
A share exchange ratio of 2.5979 shares of Enersis Américas S.A. for each share of Endesa
Américas S.A. as outlined in Annex II, is a reasonable basis for determining the amount of new
shares to be issued by Enersis Américas S.A. to those minority shareholders who do not exercise
the right of withdrawal.
An exchange ratio of 3.2431 shares of Enersis Américas S.A. for each share of Chilectra Américas
S.A. as outlined in Annex II, is a reasonable basis for determining the amount of new shares to
be issued by Enersis Américas S.A. to those minority shareholders who do not exercise the right
of withdrawal.

Santiago, August 5th, 2016 Endesa Américas S.A. 6 In my capacity as an Independent Appraiser, I have calculated the exchange ratio of shares of Endesa Américas S.A. and Chilectra Américas S.A. for each share of Enersis Américas S.A., based on the economic valuation of the companies performed by PwC Chile (Annexes II and VI, respectively). For the information and consideration of the respective Boards of Directors and Shareholders of the companies, the consolidated balance sheet of the merger between Endesa Américas S.A. and Chilectra Américas S.A. into Enersis Américas S.A. as at June 30th, 2016 is included in Annex I (adjusted by the Independent Appraiser). Additionally, we have included the interim consolidated balance sheets of these companies, which were obtained from the interim consolidated financial statements of these companies, audited by EY Chile that are included in Annexes III, IV and V. VIII Independent Appraiser declaration The signing Independent Appraiser of this report declares that: i) According to Article No. 168 of the Regulation of Share Corporations, the Independent Appraiser
is responsible for all the findings contained within this report; and ii) This report has been prepared in accordance with the provisions of Article No. 156 of the
Regulation of Share Corporations; and iii) This report has been made available to the management of Endesa Américas S.A. before being
sent to the board of directors. This report is for the exclusive use and knowledge of management, the board of directors and shareholders of Endesa Américas S.A. and has been prepared with the aforementioned single objective and, therefore, should not be used for any other purpose without the express knowledge of the Independent Appraiser.
Colin S. Becker Chilean Identification N° 14.583.193-8

ANNEX I Pro-forma balance sheet resulting from the merger between Enersis Américas
S.A., Endesa Américas S.A. and Chilectra Américas S.A. as at June 30th, 2016, as adjusted by the Independent Appraiser

The English version of this consolidated pro-forma balance sheet is provided solely for the convenience of non-Spanish readers as a free translation from the Spanish language original, which is the official and binding version.
ENERSIS AMERICAS S.A. AND ITS SUBSIDIARIES
Pro Forma Statement of Financial Position as of June 30, 2016
(In thousands of Chilean pesos)
Enersis Américas
Consolidated
Historical
Less:
Desconsolidation of
Chilectra Américas,
Endesa Américas
and consolidation
adjustments
Enersis
Américas
Combined
Chilectra
Américas
Consolidated
Endesa
Américas
Consolidated
Consolidation
AdjustmentsNote
Enersis
Américas
Consolidated
Historical
Pro-Forma
Adjustments
Note
Pro Forma
Enersis
Américas
Merged
M$ M$ M$ M$ M$ M$ M$ M$ M$
(1) (2) (3) (4) (5) (6) (7) (8) (9)
Current Assets
Cash and equivalents 1,113,569,619 (133,223,343) 980,346,276 19,585,660 113,637,683 - 1,113,569,619 - 1,113,569,619
Other current financial assets 142,620,909 (3,351,615) 139,269,294 20,656 3,330,959 - 142,620,909 - 142,620,909
Other current non-financial assets 89,840,199 (8,182,421) 81,657,778 - 8,182,421 - 89,840,199 - 89,840,199
Trade and other current receivables 1,189,121,678 (228,346,902) 960,774,776 25,417 228,027,444 294,041 (i) 1,189,121,678 - 1,189,121,678
Account receivables from related parties 144,502,911 53,209,545 197,712,456 16,145,750 66,707,642 (136,062,937) (i) 144,502,911 - 144,502,911
Inventories 75,897,505 (27,095,115) 48,802,390 - 27,095,115 - 75,897,505 - 75,897,505
Current tax assets 87,722,866 (3,044,045) 84,678,821 1,557,509 1,486,536 - 87,722,866 - 87,722,866
2,843,275,687 (350,033,896) 2,493,241,791 37,334,992 448,467,800 (135,768,896) 2,843,275,687 - 2,843,275,687
TOTAL CURRENT ASSETS 2,843,275,687 (350,033,896) 2,493,241,791 37,334,992 448,467,800 (135,768,896) 2,843,275,687 - 2,843,275,687
NON-CURRENT ASSETS
Other non-current financial assets 609,738,969 (1,491,012) 608,247,957 - 1,491,012 - 609,738,969 - 609,738,969
Other non-current non-financial assets 88,622,505 (1,130,895) 87,491,610 - 1,130,895 - 88,622,505 - 88,622,505
Trade and other non-current receivables 350,128,561 (218,201,571) 131,926,990 - 218,201,571 - 350,128,561 - 350,128,561
Non-current account receivables from related parties 270,698 - 270,698 - - - 270,698 - 270,698
Investments accounted for using the equity method 31,241,693 1,587,466,011 1,618,707,704 504,243,419 534,850,522 (2,626,559,952) (ii) 31,241,693 - 31,241,693
Intangible assets other than goodwill 1,153,454,168 (31,531,661) 1,121,922,507 - 31,531,661 - 1,153,454,168 - 1,153,454,168
Goodwill 479,483,670 (264,848,570) 214,635,100 - 96,566,275 168,282,295 (iii) 479,483,670 - 479,483,670
Property, plant and equipment 5,024,807,458 (2,632,392,915) 2,392,414,543 - 2,632,392,915 - 5,024,807,458 - 5,024,807,458
Deferred tax assets 137,434,192 (15,792,255) 121,641,937 60,489 15,731,766 - 137,434,192 - 137,434,192
TOTAL NON-CURRENT ASSETS 7,875,181,914 (1,577,922,868) 6,297,259,046 504,303,908 3,531,896,617 (2,458,277,657) 7,875,181,914 - 7,875,181,914
TOTAL ASSETS 10,718,457,601 (1,927,956,764) 8,790,500,837 541,638,900 3,980,364,417 (2,594,046,553) 10,718,457,601 - 10,718,457,601
Assets
Current assets other than assets or disposal groups classified as held for
sale or as held for distribution to owners

.
ENERSIS AMERICAS S.A. AND ITS SUBSIDIARIES
Pro Forma Statement of Financial Position as of June 30, 2016
(In thousands of Chilean pesos)
Enersis
Américas
Consolidated
Historical
Less:
Desconsolidation of
Chilectra Américas,
Endesa Américas
and consolidation
adjustments
Enersis
Américas
Combined
Chilectra
Américas
Consolidated
Endesa
Américas
Consolidated
Consolidation
AdjustmentsNote
Enersis
Américas
Consolidated
Historical
Pro-Forma
Adjustments
Note
Pro Forma
Enersis
Américas
Merged
M$ M$ M$ M$ M$ M$ M$ M$ M$
(1) (2) (3) (4) (5) (6) (7) (8) (9)
CURRENT LIABILITIES
Other current financial liabilities 819,420,506 (250,675,372) 568,745,134 389,761 250,285,611 - 819,420,506 - 819,420,506
Trade and other current payables 1,396,855,255 (268,343,809) 1,128,511,446 205,621 268,138,188 - 1,396,855,255 18,499,833 (a) 1,415,355,088
Accounts payable to related parties 40,131,196 70,221,572 110,352,768 549,710 59,695,554 (130,466,836) (i) 40,131,196 - 40,131,196
Other current provisions 103,068,360 (41,732,172) 61,336,188 3,595 41,728,577 - 103,068,360 - 103,068,360
Current tax liabilities 68,867,984 (43,364,451) 25,503,533 - 43,364,451 - 68,867,984 - 68,867,984
Other current non-financial liabilities 35,420,253 (1,806,926) 33,613,327 - 1,806,926 - 35,420,253 - 35,420,253
2,463,763,554 (535,701,158) 1,928,062,396 1,148,687 665,019,307 (130,466,836) 2,463,763,554 18,499,833 2,482,263,387
TOTAL CURRENT LIABILITIES 2,463,763,554 (535,701,158) 1,928,062,396 1,148,687 665,019,307 (130,466,836) 2,463,763,554 18,499,833 2,482,263,387
NON-CURRENT LIABILITIES
Other non-current financial liabilities 1,964,388,249 (925,445,179) 1,038,943,070 - 925,445,179 - 1,964,388,249 - 1,964,388,249
Trade and other non-current payables 293,476,435 (35,396,432) 258,080,003 - 35,396,432 - 293,476,435 - 293,476,435
Non-current accounts payable to related parties - 5,302,060 5,302,060 - - (5,302,060) (i) - - -
Other long-term provisions 237,782,799 (58,871,199) 178,911,600 - 58,871,199 - 237,782,799 - 237,782,799
Deferred tax liabilities 226,689,740 (150,982,120) 75,707,620 - 150,982,120 - 226,689,740 - 226,689,740
Non-current provisions for employee benefits 206,274,254 (22,515,863) 183,758,391 - 22,515,863 - 206,274,254 - 206,274,254
Other non-current non-financial liabilities 19,085,817 (17,730,977) 1,354,840 - 17,730,977 - 19,085,817 - 19,085,817
TOTAL NON-CURRENT LIABILITIES 2,947,697,294 (1,205,639,710) 1,742,057,584 - 1,210,941,770 (5,302,060) 2,947,697,294 - 2,947,697,294
TOTAL LIABILITIES 5,411,460,848 (1,741,340,868) 3,670,119,980 1,148,687 1,875,961,077 (135,768,896) 5,411,460,848 18,499,833 5,429,960,681
EQUITY
Issued capital 3,575,339,010 - 3,575,339,010 137,790,702 778,936,764 (916,727,466) (iv) 3,575,339,010 970,393,673 (b) 4,545,732,683
Retained earnings 2,148,192,728 - 2,148,192,728 530,028,911 1,329,144,560 (1,859,173,471) (iv) 2,148,192,728 - 2,148,192,728
Share premium - - - 212,082 120,497,065 (120,709,147) (iv) - - -
Other reserves (1,976,890,178) - (1,976,890,178) (127,541,482) (946,124,191) 1,073,665,673 (iv) (1,976,890,178) (470,740,232) (c) (2,447,630,410)
3,746,641,560 - 3,746,641,560 540,490,213 1,282,454,198 (1,822,944,411) 3,746,641,560 499,653,441 4,246,295,001
Non-controlling interests 1,560,355,193 (186,615,896) 1,373,739,297 - 821,949,142 (635,333,246) (v) 1,560,355,193 (518,153,274) (d) 1,042,201,919
TOTAL EQUITY 5,306,996,753 (186,615,896) 5,120,380,857 540,490,213 2,104,403,340 (2,458,277,657) 5,306,996,753 (18,499,833) 5,288,496,920
10,718,457,601 (1,927,956,764) 8,790,500,837 541,638,900 3,980,364,417 (2,594,046,553) 10,718,457,601 - 10,718,457,601
EQUITY AND LIABILITIES
Current liabilities other than liabilities included in disposal groups classified
as held for sale
Equity attributable to owners of parent
TOTAL EQUITY AND LIABILITIES

Below are presented an extraction of the notes to the consolidated pro-forma balance sheet that were provided by the management of Enersis Américas S.A.: 1. Historical Enersis Américas
Corresponds to consolidated historical, audited financial information of Enersis Américas S.A. and its subsidiaries as at June 30th, 2016.
2. Deconsolidation of Chilectra Américas and Endesa Américas and consolidation adjustments Corresponds to deconsolidation of the Chilectra Américas S.A. and Endesa Américas S.A groups as at June 30th, 2016, including the related consolidation adjustments.
3. Enersis Américas combination
Represents the consolidation of Enersis Américas S.A. (parent company) with its subsidiaries and the following subgroups: Grupo Distrilima, Grupo Enel Brasil, Grupo Codensa, Grupo Dock Sud, Grupo Caboblanco, Edesur, Generalima, Cemsa and Compañía Eléctrica Veracruz S.A., recorded as investments in associate companies of Enersis Américas S.A. in the Chilectra Américas group, the Endesa Américas group, Grupo Generandes Perú and Grupo Emgesa, using the equity method.
4. Consolidation of Chilectra Américas
Corresponds to the consolidated financial information of Chilectra Américas S.A. and its subsidiaries as at June 30th, 2016, audited and presented to Superintendencia de Valores y Seguros (SVS).
5. Consolidation of Endesa Américas Corresponds to the consolidated financial information of Endesa Américas S.A. and its subsidiaries as at June 30th, 2016, audited and presented to Superintendencia de Valores y Seguros (SVS).
6. Consolidation adjustments
(i) Elimination of intercompany balances of Enersis Américas with Chilectra Américas S.A. and Endesa Américas S.A.;
(ii) Elimination of investments accounted under the equity method, belonging to companies consolidated under Enersis Américas, reported by Chilectra Américas and Endesa Américas as at June 30th, 2016, as well as the elimination of investments in related companies recorded under the equity method, of Chilectra Américas, Endesa Américas, Generandes Perú and Emgesa;
(iii) Reclassification of goodwill amounts belonging to companies consolidated under Enersis Américas, which have been recognized as part of the carrying amount of investments accounted for using the equity method in Chilectra Américas and Endesa Américas;
(iv) Elimination of the consolidated equity of Chilectra Américas and Endesa Américas; (v) Recognition of the non-controlling interests of Enersis Américas in the consolidated equities of
Chilectra Américas and Endesa Américas, neto of the non-controlling interests recorded directly in Enersis Américas.
7. Consolidation of Enersis Américas
Corresponds to consolidated historical financial information of Enersis Américas S.A. and its subsidiaries as at June 30th, 2016, audited and presented to Superintendencia de Valores y Seguros (SVS). (Please refer to Point N°1)
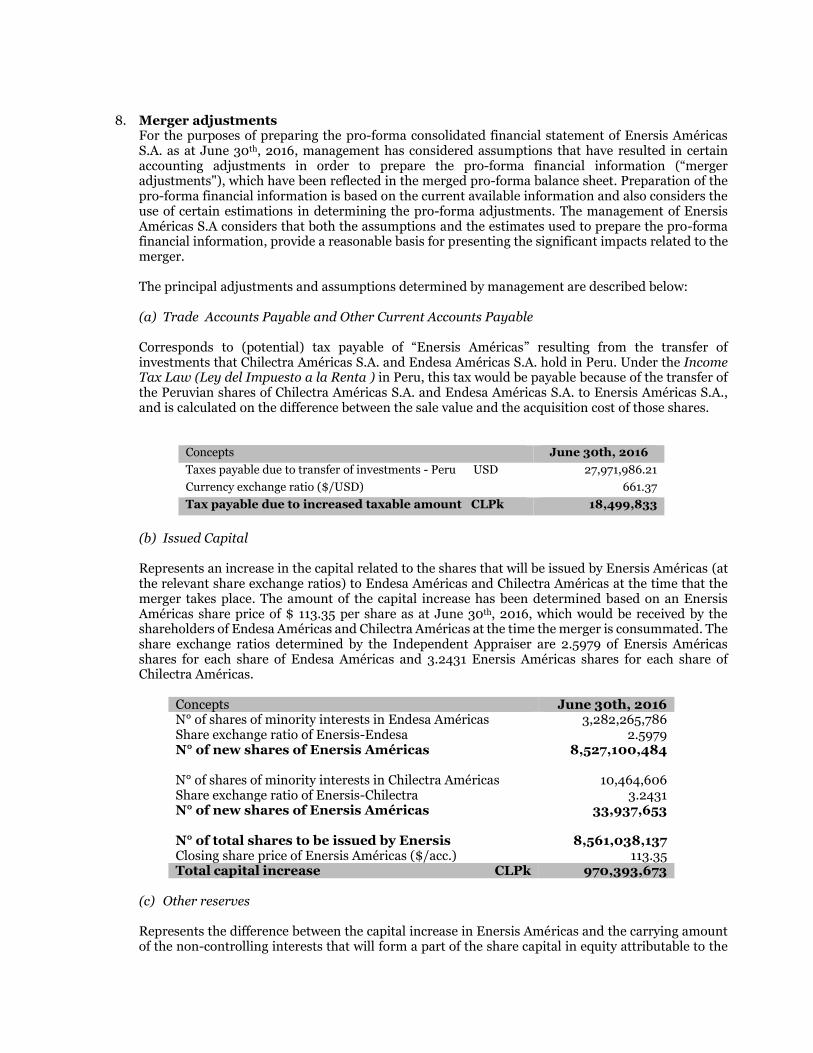
8. Merger adjustments For the purposes of preparing the pro-forma consolidated financial statement of Enersis Américas S.A. as at June 30th, 2016, management has considered assumptions that have resulted in certain accounting adjustments in order to prepare the pro-forma financial information (“merger adjustments"), which have been reflected in the merged pro-forma balance sheet. Preparation of the pro-forma financial information is based on the current available information and also considers the use of certain estimations in determining the pro-forma adjustments. The management of Enersis Américas S.A considers that both the assumptions and the estimates used to prepare the pro-forma financial information, provide a reasonable basis for presenting the significant impacts related to the merger. The principal adjustments and assumptions determined by management are described below:
(a) Trade Accounts Payable and Other Current Accounts Payable Corresponds to (potential) tax payable of “Enersis Américas” resulting from the transfer of investments that Chilectra Américas S.A. and Endesa Américas S.A. hold in Peru. Under the Income Tax Law (Ley del Impuesto a la Renta ) in Peru, this tax would be payable because of the transfer of the Peruvian shares of Chilectra Américas S.A. and Endesa Américas S.A. to Enersis Américas S.A., and is calculated on the difference between the sale value and the acquisition cost of those shares.
Concepts June 30th, 2016
Taxes payable due to transfer of investments - Peru USD 27,971,986.21
Currency exchange ratio ($/USD) 661.37
Tax payable due to increased taxable amount CLPk 18,499,833
(b) Issued Capital Represents an increase in the capital related to the shares that will be issued by Enersis Américas (at the relevant share exchange ratios) to Endesa Américas and Chilectra Américas at the time that the merger takes place. The amount of the capital increase has been determined based on an Enersis Américas share price of $ 113.35 per share as at June 30th, 2016, which would be received by the shareholders of Endesa Américas and Chilectra Américas at the time the merger is consummated. The share exchange ratios determined by the Independent Appraiser are 2.5979 of Enersis Américas shares for each share of Endesa Américas and 3.2431 Enersis Américas shares for each share of Chilectra Américas.
Concepts June 30th, 2016 N° of shares of minority interests in Endesa Américas 3,282,265,786 Share exchange ratio of Enersis-Endesa 2.5979 N° of new shares of Enersis Américas 8,527,100,484 N° of shares of minority interests in Chilectra Américas 10,464,606 Share exchange ratio of Enersis-Chilectra 3.2431 N° of new shares of Enersis Américas 33,937,653 N° of total shares to be issued by Enersis 8,561,038,137 Closing share price of Enersis Américas ($/acc.) 113.35 Total capital increase CLPk 970,393,673
(c) Other reserves Represents the difference between the capital increase in Enersis Américas and the carrying amount of the non-controlling interests that will form a part of the share capital in equity attributable to the

owners of Enersis Americas after the merger has taken place. The difference between the market value of the consideration received or paid and the amount at which the non-controlling interests have been recognized in equity attributable to shareholders of Enersis Américas has been adjusted for.
The table below summarizes the merger adjustments that have been recorded as Other Reserves:
Concepts CLPk Pooling-of-interest interest reserve (452,240,399) Tax payable due to transfer of investments -Peru (a) (18,499,833) Other Reserves (470,740,232)
(d) Non- controlling Interests participation Represents the elimination of the carrying amount of non-controlling interests that will become direct shareholders of Enersis Américas once the merger has taken place.
Concepts CLPk Share capital of Endesa Américas – controlling interests 1,282,454,198 Share participation of Enersis Américas (%) 40.020% N° of new shares of Enersis Américas 513,238,170 Share capital of Chilectra Américas – controlling interests 540,490,213 Share participation of Enersis Américas (%) 0.9094% N° of new shares of Enersis Américas 4,915,104 Non-controlling Interest Participation - Enersis Américas
518,153,274
9. Enersis Américas merged pro-forma financial information Contains the consolidated financial information of Enersis Américas S.A. and its subsidiaries assuming the merger with Chilectra Américas and Endesa Américas was effective as at June 30th, 2016.

ANNEX II Share exchange ratio determined by the Independent Appraiser at June 30th,
2016

The estimated equity of Enersis Américas S.A., Chilectra Américas S.A. and Endesa Américas S.A. at June
30th, 2016, as set out in the valuation report prepared by PwC Chile, was used to determine the share
exchange ratio of the issue of Enersis Américas S.A. shares to the minority shareholders of Endesa
Américas S.A. and Chilectra Américas S.A., as a baseline estimate.
Based on information provided by Management, the results of the valuation of the companies as at June
30th, 2016 estimated by PwC Chile, and considering Enersis Américas S.A. has issued, subscribed and paid
49,092,772,762 shares, Endesa Américas S.A. 8,201,754,580 shares and Chilectra Américas S.A.
1,150,742,161 shares, and the analysis performed within this this Independent Appraiser report, the
share exchange ratio is as follows:
Note that the amount of shares indicated above is for reference purposes, so as to comply with the rules
of the Companies Act and its regulations. The amount may be subject to variations depending on whether
the shareholders exercise their right of withdrawal.
Based on the issued, subscribed and paid shares of Enersis Américas S.A., Endesa Américas S.A. and Chilectra Américas S.A. at June 30th, 2016, and the valuation performed by PwC Chile, I conclude that in the event of merger between the companies, it is reasonable to apply an exchange ratio of 2.5979 shares of Enersis Américas S.A. for each share of Endesa Américas S.A. and 3.2431 Enersis Américas S.A. shares for each share of Chilectra Américas S.A. Based on the share exchange ratio estimated by this Independent Appraiser at June 30th, 2016 and
considering that Enersis Américas S.A. absorbs Endesa Américas S.A. and Chilectra Américas S.A., the
minority shareholders of Endesa Américas S.A. and Chilectra Américas S.A. have 3,282,265,786 shares
and 10,464,606 shares, respectively, to exchange. The number of shares that will be held by the minority
shareholders of the merged company amounts to 8,561,038,137, as shown in the following table:
Share exchange ratio
Enersis
Américas
Endesa
Américas
Chilectra
Américas
Equity value (CLP k) 3,850,306,414 2,515,487,718 440,579,968
Ownership of Endesa Américas (59.980931%) (CLP k) 1,508,812,964
Ownership of Chilectra Américas (99.090621%) (CLP k) 436,573,427
Total Equity (CLP k) 5,795,692,805 2,515,487,718 440,579,968
N° Shares (N°) 49,092,772,762 8,201,754,580 1,150,742,161
Share price (CLP/share) 118.06 306.70 382.87
Share exchange ratio - shares Enersis Américas (1) 2.5979 3.2431
Share exchange ratio
(1) Refers to the number of shares of Enersis Américas that should be delivered to the non-controlling shareholders of Endesa
Américas and Chilectra Américas as a result of the merger.
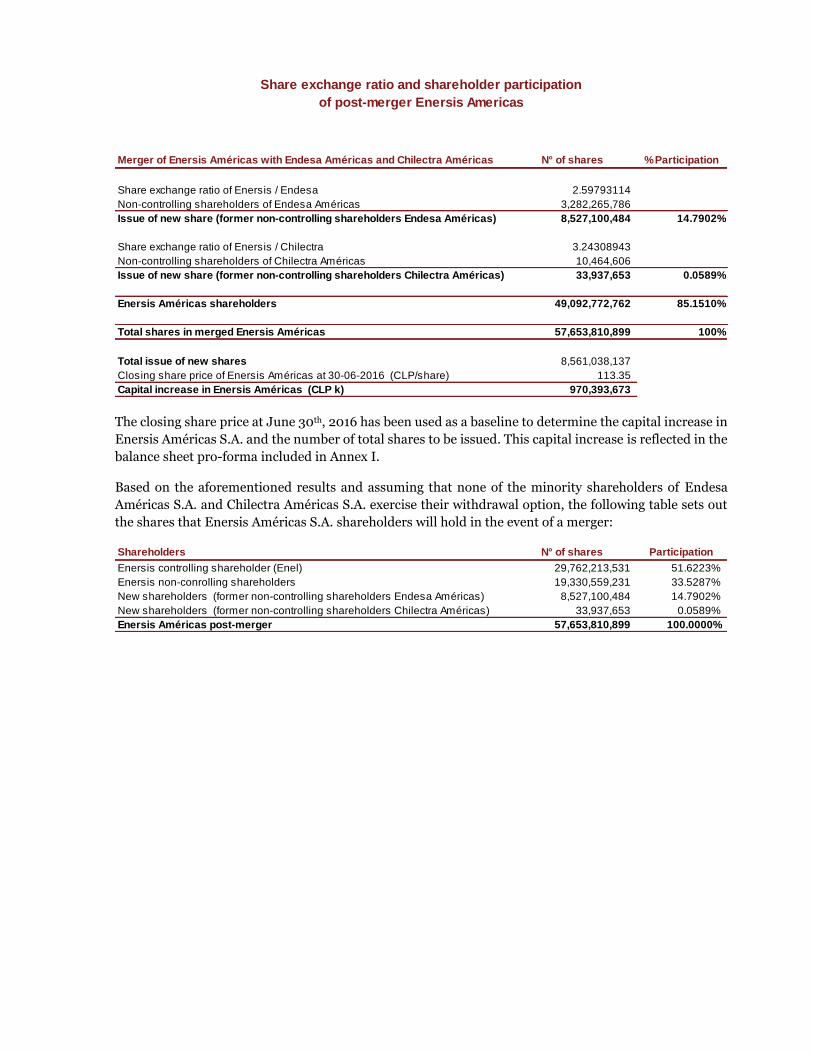
The closing share price at June 30th, 2016 has been used as a baseline to determine the capital increase in
Enersis Américas S.A. and the number of total shares to be issued. This capital increase is reflected in the
balance sheet pro-forma included in Annex I.
Based on the aforementioned results and assuming that none of the minority shareholders of Endesa
Américas S.A. and Chilectra Américas S.A. exercise their withdrawal option, the following table sets out
the shares that Enersis Américas S.A. shareholders will hold in the event of a merger:
Merger of Enersis Américas with Endesa Américas and Chilectra Américas N° of shares % Participation
Share exchange ratio of Enersis / Endesa 2.59793114
Non-controlling shareholders of Endesa Américas 3,282,265,786
Issue of new share (former non-controlling shareholders Endesa Américas) 8,527,100,484 14.7902%
Share exchange ratio of Enersis / Chilectra 3.24308943
Non-controlling shareholders of Chilectra Américas 10,464,606
Issue of new share (former non-controlling shareholders Chilectra Américas) 33,937,653 0.0589%
Enersis Américas shareholders 49,092,772,762 85.1510%
Total shares in merged Enersis Américas 57,653,810,899 100%
Total issue of new shares 8,561,038,137
Closing share price of Enersis Américas at 30-06-2016 (CLP/share) 113.35
Capital increase in Enersis Américas (CLP k) 970,393,673
Share exchange ratio and shareholder participation
of post-merger Enersis Americas
Shareholders N° of shares Participation
Enersis controlling shareholder (Enel) 29,762,213,531 51.6223%
Enersis non-conrolling shareholders 19,330,559,231 33.5287%
New shareholders (former non-controlling shareholders Endesa Américas) 8,527,100,484 14.7902%
New shareholders (former non-controlling shareholders Chilectra Américas) 33,937,653 0.0589%
Enersis Américas post-merger 57,653,810,899 100.0000%

The following table sets out the range of share exchange ratio shares that Enersis Américas S.A., Endesa
Américas S.A. and Chilectra S.A., based on the sensitivity analysis of estimated equity of the Companies
at June 30th, 2016, as set out in the valuation report prepared by PwC Chile.
Economic ValueAs at 30 June 2016
Min. Max. Min. Max. Min. Max.
Equity Value (USD M) 8,361 9,225 3,756 3,846 571 774
Share price (CLP/share) 113 124 303 310 328 445
Share exchange ratio 2.6892 2.4954 2.9143 3.5801
Equity Value (USD M) 8,173 8,756 3,490 3,705 606 703
Share price (CLP/share) 110 118 281 299 349 404
Share exchange ratio 2.5558 2.5328 3.1657 3.4265
Equity Value (USD M) 7,087 8,667 3,453 3,901 773 776
Share price (CLP/share) 95 117 278 315 444 446
Share exchange ratio 2.9161 2.6942 4.6502 3.8202
Propose of Board Director to shareholders
Market Multiple
Market Cap
2.8 4.0
Enersis Américas Endesa Américas Chilectra Américas
DCF

ANNEX III Consolidated financial statements of Enersis Américas S.A. at June 30th, 2016

The English version of this balance sheet is provided solely for the convenience of non-Spanish readers as a free translation from the Spanish
language original, which is the official and binding version.
ENERSIS AMÉRICAS S.A. AND SUBSIDIARIES
Interim Consolidated Statements of Financial Position
at June 30, 2016
(In thousands of Chilean pesos)
30-06-2016
M$
CURRENT ASSETS
Cash and cash equivalents 1,113,569,619
Other current financial assets 142,620,909
Other current non-financial assets 89,840,199
Trade and other current receivables 1,189,121,678
Current accounts receivable from related companies 144,502,911
Inventories 75,897,505
Current tax assets 87,722,866
2,843,275,687
Non-current assets or groups of assets for disposal classified as held for sale -
-
2,843,275,687
NON-CURRENT ASSETS
Other non-current financial assets 609,738,969
Other non-current non-financial assets 88,622,505
Trade and other non-current receivables 350,128,561
Non-current accounts receivable from related companies 270,698
Investments accounted for using the equity method 31,241,693
Intangible assets other than goodwill 1,153,454,168
Goodwill 479,483,670
Property, plant and equipment 5,024,807,458
Investment property -
Deferred tax assets 137,434,192
7,875,181,914
10,718,457,601
ASSETS
Total current assets other than assets or groups of assets for disposal classified as held for
sale or as held for distribution to owners
Non-current assets or groups of assets for disposal classified as held for sale or as held for
distribution to owners
TOTAL CURRENT ASSETS
TOTAL NON-CURRENT ASSETS
TOTAL ASSETS
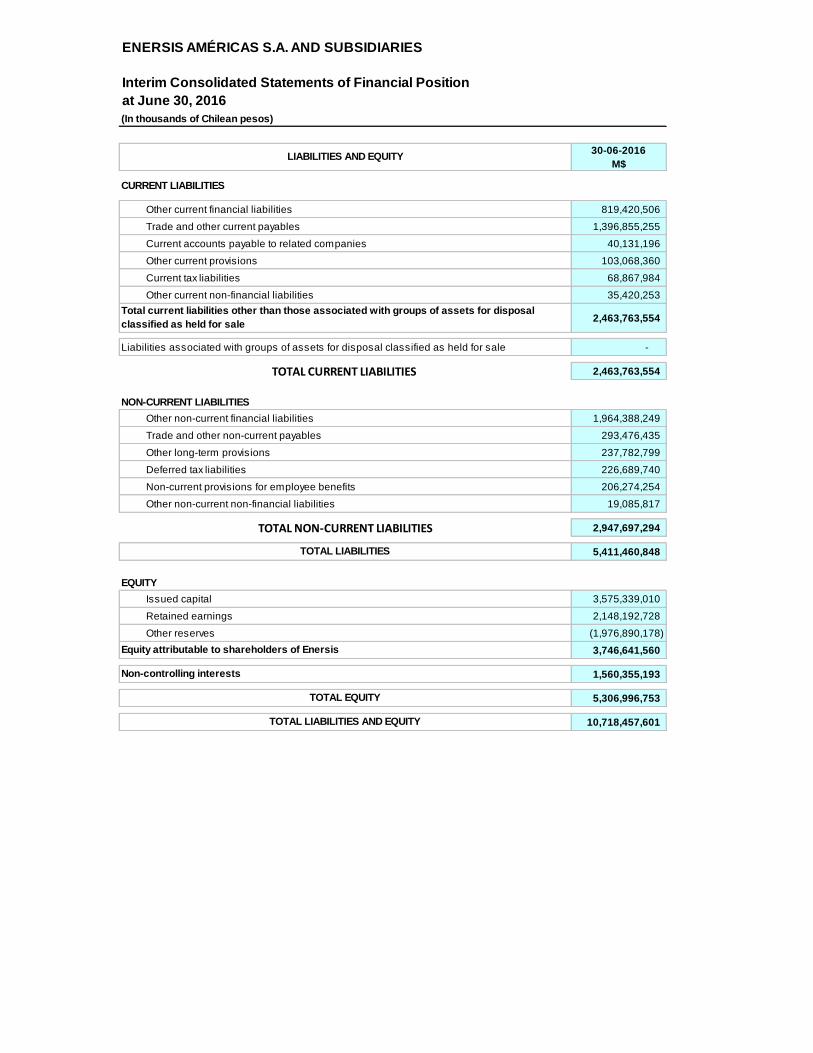
ENERSIS AMÉRICAS S.A. AND SUBSIDIARIES
Interim Consolidated Statements of Financial Position
at June 30, 2016
(In thousands of Chilean pesos)
30-06-2016
M$
CURRENT LIABILITIES
Other current financial liabilities 819,420,506
Trade and other current payables 1,396,855,255
Current accounts payable to related companies 40,131,196
Other current provisions 103,068,360
Current tax liabilities 68,867,984
Other current non-financial liabilities 35,420,253
2,463,763,554
Liabilities associated with groups of assets for disposal classified as held for sale -
2,463,763,554
NON-CURRENT LIABILITIES
Other non-current financial liabilities 1,964,388,249
Trade and other non-current payables 293,476,435
Other long-term provisions 237,782,799
Deferred tax liabilities 226,689,740
Non-current provisions for employee benefits 206,274,254
Other non-current non-financial liabilities 19,085,817
2,947,697,294
5,411,460,848
EQUITY
Issued capital 3,575,339,010
Retained earnings 2,148,192,728
Other reserves (1,976,890,178)
3,746,641,560
1,560,355,193
5,306,996,753
10,718,457,601
Equity attributable to shareholders of Enersis
Non-controlling interests
TOTAL EQUITY
TOTAL LIABILITIES AND EQUITY
LIABILITIES AND EQUITY
Total current liabilities other than those associated with groups of assets for disposal
classified as held for sale
TOTAL CURRENT LIABILITIES
TOTAL NON-CURRENT LIABILITIES
TOTAL LIABILITIES

ANNEX IV Consolidated financial statements of Endesa Américas S.A. at June 30th, 2016
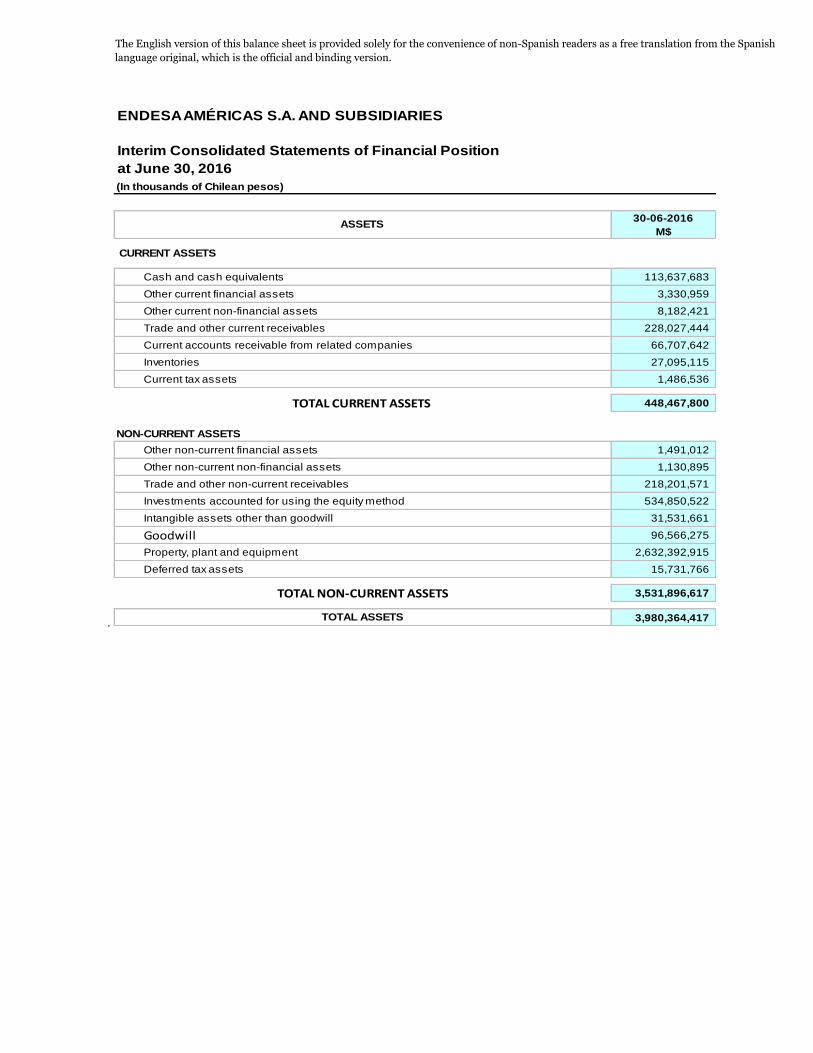
The English version of this balance sheet is provided solely for the convenience of non-Spanish readers as a free translation from the Spanish
language original, which is the official and binding version.
.
ENDESA AMÉRICAS S.A. AND SUBSIDIARIES
Interim Consolidated Statements of Financial Position
at June 30, 2016
(In thousands of Chilean pesos)
30-06-2016
M$
CURRENT ASSETS
Cash and cash equivalents 113,637,683
Other current financial assets 3,330,959
Other current non-financial assets 8,182,421
Trade and other current receivables 228,027,444
Current accounts receivable from related companies 66,707,642
Inventories 27,095,115
Current tax assets 1,486,536
448,467,800
NON-CURRENT ASSETS
Other non-current financial assets 1,491,012
Other non-current non-financial assets 1,130,895
Trade and other non-current receivables 218,201,571
Investments accounted for using the equity method 534,850,522
Intangible assets other than goodwill 31,531,661
Goodwill 96,566,275
Property, plant and equipment 2,632,392,915
Deferred tax assets 15,731,766
3,531,896,617
3,980,364,417
ASSETS
TOTAL CURRENT ASSETS
TOTAL NON-CURRENT ASSETS
TOTAL ASSETS

ENDESA AMÉRICAS S.A. AND SUBSIDIARIES
Interim Consolidated Statements of Financial Position
at June 30, 2016
(In thousands of Chilean pesos)
30-06-2016
M$
CURRENT LIABILITIES
Other current financial liabilities 250,285,611
Trade and other current payables 268,138,188
Current accounts payable to related companies 59,695,554
Other current provisions 41,728,577
Current tax liabilities 43,364,451
Other current non-financial liabilities 1,806,926
665,019,307
NON-CURRENT LIABILITIES
Other non-current financial liabilities 925,445,179
Trade and other non-current payables 35,396,432
Other long-term provisions 58,871,199
Deferred tax liabilities 150,982,120
Non-current provisions for employee benefits 22,515,863
Other non-current non-financial liabilities 17,730,977
1,210,941,770
1,875,961,077
EQUITY
Issued capital 778,936,764
Retained earnings 1,329,144,560
Share premium 120,497,065
Other reserves (946,124,191)
1,282,454,198
821,949,142
2,104,403,340
3,980,364,417
Non-controlling interests
TOTAL EQUITY
TOTAL LIABILITIES AND EQUITY
LIABILITIES AND EQUITY
TOTAL CURRENT LIABILITIES
TOTAL NON-CURRENT LIABILITIES
TOTAL LIABILITIES
Equity attributable to shareholders of Enersis

ANNEX V Consolidated financial statements of Chilectra Américas S.A. at June 30th, 2016

The English version of this balance sheet is provided solely for the convenience of non-Spanish readers as a free translation from the Spanish
language original, which is the official and binding version.
CHILECTRA AMÉRICAS S.A. AND SUBSIDIARIES
Interim Consolidated Statements of Financial Position
at June 30, 2016
(In thousands of Chilean pesos)
30-06-2016
M$
CURRENT ASSETS
Cash and cash equivalents 19,585,660
Other current financial assets 20,656
Trade and other current receivables 25,417
Current accounts receivable from related companies 16,145,750
Current tax assets 1,557,509
37,334,992
NON-CURRENT ASSETS
Investments accounted for using the equity method 504,243,419
Deferred tax assets 60,489
504,303,908
541,638,900
30-06-2016
M$
CURRENT LIABILITIES
Other current financial liabilities 389,761
Trade and other current payables 205,621
Current accounts payable to related companies 549,710
Other current provisions 3,595
1,148,687
1,148,687
EQUITY
Issued capital 137,790,702
Retained earnings 530,028,911
Share premium 212,082
Other reserves (127,541,482)
540,490,213
540,490,213
541,638,900
TOTAL EQUITY
TOTAL LIABILITIES AND EQUITY
LIABILITIES AND EQUITY
TOTAL CURRENT LIABILITIES
TOTAL LIABILITIES
Equity attributable to shareholders of Enersis
ASSETS
TOTAL CURRENT ASSETS
TOTAL NON-CURRENT ASSETS
TOTAL ASSETS
ANNEX VI
Valuation report on Enersis Américas, Endesa Américas and Chilectra Américas as at June 30th, 2016
DC3 - Highly confidential information
Deals & Valuations
Endesa Américas S.A.Economic Valuation Report
Strictly private and confidential
July 27th, 2016
Please note that this report is a translation of the original report issued in Spanish. In
the event of doubt of misinterpretation, the information as provided in the Spanish
report will prevail.

DC3 - Highly confidential information
Important message to any person not authorised to have access to this report
Should any unauthorized person obtain access to and read this report, by reading this report such person accepts and agrees to the followingterms:
1. The reader of this report understands that the work performed by PwC Chile was performed in accordance with instructions provided by ouraddressee client and was performed exclusively for our addressee client’s sole benefit and use.
2. The reader of this report acknowledges that this report was prepared at the direction of our addressee client and may not include allprocedures deemed necessary for the purposes of the reader.
3. This report is a translation of the original report issued in Spanish.
4. The reader agrees that PwC Chile, its partners, employees and agents neither owe nor accept any duty or responsibility to it, whether incontract or in tort (including without limitation, negligence and breach of statutory duty), and shall not be liable in respect of any loss, damageor expense of whatsoever nature which is caused by any use the reader may choose to make of this report, or which is otherwise consequentupon the gaining of access to the report. Further, the reader agrees that this report is not to be referred to or quoted, in whole or in part, inany prospectus, registration statement, offering circular, public filing, loan, other agreement or document and not to distribute the reportwithout PwC Chile’s prior written consent.
GlossaryAppendicesResults of the valuationExecutive summaryContents

PwC
July 27th, 2016
DC3 - Highly confidential information
Santiago, July 27th, 2016Chairman of the Board and ShareholdersEndesa Chile S.A.
Economic Valuation Report for Enersis Américas, Endesa Américas and ChilectraAméricas
We are pleased to submit our report on the economic valuation of Enersis Américas, Endesa Américas andChilectra Américas (collectively referred to as “the Group” and “the Companies”) as of 30 June 2016,relating to the generation, transmission and distribution businesses developed and operated by thedifferent companies of the Group outside of Chile.
This report has been prepared in accordance with our letter of engagement dated 28 April 2016 and theattached terms and conditions. This report has been prepared solely for the purposes stated herein andshould not be relied upon for any other purpose. This economic valuation is based on the financialprojections provided by Management, prepared on information generated from internal operatingmodels, to which PwC Chile did not have access to. However, PwC Chile did have access to Management’stechnical teams and were able to analyse these financial projections.
Events and circumstances frequently do not occur as expected, so there could be differences betweenprojected and actual results and those differences may be material. Accordingly, we express no opinion asto how close the actual results achieved correspond to those projected by the Group's management, andassume no responsibility or accept any obligations of compliance with the projected results.
Yours faithfully
PricewaterhouseCoopers Chile
Colin S. Becker - Partner
3
Endesa Américas S.A.
Empresa Nacional de Electricidad S.A. (hereafter “Endesa Chile S.A.”, “Endesa” or the “Compañía”)Santa Rosa 76Santiago, Chile
Colin BeckerPartnerT: +(56-2) [email protected]
PricewaterhouseCoopers Consultores, Auditores y CompañíaLimitada(hereafter ‘PwC Chile’)Av. Andrés Bello 2711, floor 5, Las Condes, Santiago, ChileT: +56 (2) 2940 0000
GlossaryAppendicesResults of the valuationExecutive summaryContents

PwC
July 27th, 2016
DC3 - Highly confidential information
Executive summary 5
1 General aspects 6
2 Valuation summary 9
Results of the valuation 13
3 Argentina 15
4 Brazil 30
5 Colombia 43
6 Peru 53
Appendices 64
1 Discount Rate 65
2 Market Multiples 66
3 Methodology 68
Glossary 72
Contents
4
Endesa Américas S.A.
GlossaryAppendicesResults of the valuationExecutive summaryContents

PwC
July 27th, 2016
DC3 - Highly confidential information
Executive summary
5
Endesa Américas S.A.
Executive summary 5
1 General aspects 6
2 Valuation summary 9
GlossaryAppendicesResults of the valuationExecutive summaryContents

PwC
July 27th, 2016
DC3 - Highly confidential information
Scope and process
6
Endesa Américas S.A.
1 General aspects
Term Description
Scope of work - The Board of Directors of Endesa Chile S.A. contracted PricewaterhouseCoopers Chile to prepare an economicvaluation of the equity of Enersis Américas, Endesa Américas and Chilectra Américas (collectively referred to as the“Group”) at 3o June 2016. This economic valuation refers to the Group's generation, transmission and distributionoperations outside of Chile.
- This economic valuation is based on the financial projections provided by Group’s Management, based oninformation generated from internal operating models, to which PwC did not have access. However, was able toanalyse these financial projections in meetings with the Companies’ technical teams.
- It has been specifically understood and agreed in the Service Agreement that the Independent Expert is notresponsible for verifying the integrity and accuracy of the information provided by the Company or the publiclyavailable information used in the analysis and conclusions in the Report. The Independent Expert does not assumeany responsibility related to errors or omissions that may exist in the information provided, or the impact that theseerrors or omissions could have directly or indirectly on the analysis or the conclusions.
General limiting conditions - The economic valuation was prepared based on information provided in a virtual dataroom and included: Historicalfinancial information, Macroeconomic assumptions, Budget 2016, Capex, Business plans and Financial projections,and certain operating information on new generation plants, concession termination and renewals, generatingcapacity, energy sold and tariffs.
- Management coordinated presentations on the financial projections, capex, tax implications and were available torespond to queries and provide additional information as required.
- In preparing the economic valuation, PwC Chile has relied upon the completeness, accuracy and fair presentation ofall the financial information, data, advice, opinions or representations obtained by it from public sources, the Boardand Management, as well as other parties (collectively, the “Information”), some of which is detailed above. Theeconomic valuation is conditional upon such completeness, accuracy and fair presentation of the Information. PwCChile has not independently verified the completeness, accuracy and fair presentation of the Information.
- The economic valuation has been prepared on the basis of economic, financial and general business conditionsexisting on or about the Valuation Date. Management has provided financial projections based on their bestunderstanding of current and expected business conditions.
GlossaryAppendicesResults of the valuationExecutive summaryContents
PwC
July 27th, 2016
DC3 - Highly confidential information
Scope and process
7
Endesa Américas S.A.
1 General aspects
Term Description
General limiting conditions (cont.)
- The Economic Valuation should be read in its entirety by the reader, as selecting and relying on only specific sectionsof the analyses or factors considered by PwC Chile could be misleading. Our Economic Valuation is based on theTransaction alone and does no refer to any activities subsequent to the Transaction.
- PwC Chile’s Economic Valuation is limited to the Transaction from a financial point of view and does not refer to thestrategic merits of the Transaction. The Economic Valuation does not provide assurance that the best possible optionfor the Transaction was obtained. It represents an impartial expert judgment, not a statement of facts.
- The Economic Valuation is prepared for the Board as one factor, among others, that the Board will consider indetermining whether it deems the Transaction convenient. The Economic Valuation is not to be construed as arecommendation to Management, the Special Committee or the Board, as to how to vote on, or whether to proceedwith the Transaction.
- The Economic Valuation does not constitute a calculation, estimate or comprehensive valuation (also known as avaluation opinion) of the Group companies or its shares.
- Nothing contained herein is to be construed as a legal interpretation, an opinion on any contract or document, or arecommendation to invest or divest. The individuals that prepared the Economic Valuation did so to the best of theirknowledge, acting independently and objectively.
General aspects of the work - The Group economic valuation is based on the sum of the corresponding investments in Generation, Transmissionand Distribution operations in Peru, Colombia, Brazil and Argentina, under the DCF model and the unauditedfinancial statements at June 30th, 2016.
- As instructed by the management of Chilectra Américas S.A. and Enersis Américas S.A., the economic valuation ofthese companies at 30 June 2016 also includes the impact of a distribution of an extraordinary dividend to be paid byChilectra Américas in 2016 for a total of CLP M 120,000, before the merger is legally consummated.
- The economic valuation is based on the operational cash flows from each of the operating companies controlled,either directly or indirectly by the Group.
- The macroeconomic assumptions used in the financial projections include the relevant country’s GDP, Inflation,Exchange rate and Commodity prices obtained from various sources (see section “Business overview and valuationresults per country"”).
GlossaryAppendicesResults of the valuationExecutive summaryContents

PwC
July 27th, 2016
DC3 - Highly confidential information
Scope and process
8
Endesa Américas S.A.
1 General aspects
Term Description
General aspects of the work(cont.)
- The financial projections consider periods that are consistent with the underlying concession periods and theoperating capacity of each plant, and type of business in each market.
- The financial projections related to the operations CIEN, Fortaleza, Cachoeira de Brasil and Chocón in Argentina, areprojected to the end of the current concession periods that are expected not to be renewed. In the cases of CIEN andCachoeira, the residual value is expected to be equivalent to the net book value of the assets at the end of theconcession.
- The financial projections related to Codensa include the E.E. Cundinamarca operations, as a result of the currentmerger of both companies that is expected will be completed by the end of 2016.
- The financial projections only include those projects currently being developed or approved for start up ordevelopment during the projection period. All other potential projects are assumed to be net zero value projects.
- The financial projections for each company are prepared in local currency.- In addition to the DCF method, a sample of comparable market multiples was obtained in order to corroborate
values. These market multiples were obtained from MILA (Chile, Colombia y Peru) and Latam.- The EV/EBITDA multiple was selected to compare the DCF values.- The market cap values of Enersis Américas, Endesa Américas and Chilectra Américas were obtained in order to
compare DCF values, considering that the share price began trading on the Santiago Stock Exchange in April 2016 forEndesa and Enersis, respectively, and in June 2016 for Chilectra Américas.
- A sensitivity analysis has been prepared for the DCF valuation based on a maximum and minimum scenario throughthe adjustment of the growth and discount rates by business. For the maximum scenario a 0.2% increase wasconsidered to the long-term growth rate for the distribution business in Colombia and Peru and for the distributionand transmission Business in Brazil. This sensitivity analysis also considers a 0.6% decrease in the local discount ratein the referred Business, as an improvement on the economic perspectives of those countries would normally imply alower risk of the Business, thereby lower discount rates. For the minimum scenario, a 0.8% decrease in the long-termgrowth rate was considered for the distribution and transmission Business in Brazil, while holding unchanged thereal long-term growth rate for Colombia and Peru of 0%. This decrease in the growth rate in Brazil relates to theactual high volatility in the growth of the economy. A 0.6% increase on the local discount rate in Brazil for thetransmission Business and the distribution business in Brazil, Colombia and Peru were also considered in thisscenario.
- The sensitivity analysis was prepared considering an adjustment of +/- 0.2x to the EV/EBITDA multiples. Market capsensitivity considers the change of the Group share price from the beginning of stock trading up until June 30th, 2016.
GlossaryAppendicesResults of the valuationExecutive summaryContents

PwC
July 27th, 2016
DC3 - Highly confidential information
USD k
Economic valueEnersis Américas, Endesa Américas and Chilectra Américas
9
Endesa Américas S.A.
2 Valuation summary
DCF: USD 3,803,450 k
EV/EBITDA multiple: USD 3,597,480 k
Market cap: USD 3,678,025 k
DCF: USD 666,163 k
EV/EBITDA multiple: USD 654,885 k
Market cap: USD 775,758 k
The charts to the left illustrate the economic valuation ofEnersis Americas, Endesa Americas and ChilectraAmericas based on the DCF, EV/EBITDA multiple andmarket cap methodologies, under the base scenario:
DCF: USD 8,763,163 k
EV/EBITDA multiple: USD 8,464,716 k
Market cap: USD 8,125,363 kEn
ers
isA
mé
ric
as
En
de
sa
Am
éri
ca
sC
hile
ctr
aA
mé
ric
as
GlossaryAppendicesResults of the valuationExecutive summaryContents

PwC
July 27th, 2016
DC3 - Highly confidential information
Economic valueEnersis Américas, Endesa Américas and Chilectra Américas
The table below sets out the economic valuation of Enersis Américas S.A., Endesa Américas S.A. and Chilectra Américas S.A. (in USD and in Chilecurrency equivalent considering a FX rate of CLP 661.37/USD). The economic valuation includes the investments in Generation, Transmissionand Distribution in Brazil, Argentina, Colombia and Peru.
10
Endesa Américas S.A.
2 Valuation summary
(USD in k)Enersis
Americas
Endesa
Americas
Chilectra
Americas
Net cash (1)
1,244,981 61,663 (136,081)
Investments (2)
7,730,653 3,644,030 822,203
Total Equity 8,975,634 3,705,693 686,123
Corporate cost adjustment (3)
(308,492) (34,243) (36,960)
Other adjustments (4)
96,020 132,000 17,000
Equity adjustments (212,472) 97,757 (19,960)
Total adjusted equity 8,763,163 3,803,450 666,163
Total adjusted equity (CLP) 5,795,692,805 2,515,487,718 440,579,968
(4) Refers to economic compensatio included in the share exchange ratio, for the incremental tax cost triggered
in Peru. that w ill be bourne by Enersis Americas and Chilectra Americas, as reported in the VDR and informed my
Management. The amount corresponding to Enersis Americas relates to its investments in Endesa Americas
(59.980931%) and Chilectra Americas (99,090621%).
(2) Refers to ow nership interests that each company holds in Peru, Colombia, Brazil and Argentina. Enersis
Americas investments includes Endesa Americas interests by USD 2,281,345 k (equivalent to 59.980931%) and
Chilectra Americas interests by USD 660,105 k (equivalent to 99.090621%).
(3) Refers to NPV of projected corporate costs.
(1) Refers to cash & cash equivalent less f inancial debt as of 30 June 2016, as informed by Management. Cash
& cash equivalents of Chilectra Américas consider CLP 120.000 M (equivalent to USD 181 M) in dividends to be
distributed to its shareholders around September - October 2016.
GlossaryAppendicesResults of the valuationExecutive summaryContents

PwC
July 27th, 2016
DC3 - Highly confidential information
Economic valueEnersis Américas, Endesa Américas and Chilectra Américas
The table below sets out the results of the economic valuation of Enersis Américas S.A., Endesa Américas S.A. and Chilectra Américas S.A. as at 30June 2016, grouped by country:
11
Endesa Américas S.A.
2 Valuation summary
Enersis
Americas
Endesa
Americas
Chilectra
Americas
Colombia 2,965,514 1,280,011 225,714
Peru 2,662,747 1,581,512 218,905
Brazil 2,053,707 730,547 372,061
Argentina 48,687 51,960 5,524
Subtotal 7,730,653 3,644,030 822,203
Net cash (1) 1,244,981 61,663 (136,081)
Corporate costs allocation (2) (308,492) (34,243) (36,960)
Otros adjustments (3) 96,020 132,000 17,000
Total equity 8,763,163 3,803,450 666,163
Total equity (CLP k) 5,795,692,805 2,515,487,718 440,579,968
(3) Refers to economic compensation included in the share exchange ratio, for the incremental tax cost
triggered in Peru that w ill be bourne by Endesa americas and Chilectra Americas, as reported in the
dataroom and informed by management. The amount corresponding to Enersis Américas relates to its
investments in Endesa Américas (59.980931%) and Chilectra Américas (99.090621%).
(USD k)
Co
un
try
O
the
rs
(1) Refers to cash & cash equivalent less f inancial debt as of 30 June 2016. Cash & cash equivalents of
Chilectra Américas consider CLP 120.000 M (equivalent to USD 181 M) in dividends to be distributed to its
shareholders around September - October 2016.
(2) Refers to NPV of projected corporate costs
GlossaryAppendicesResults of the valuationExecutive summaryContents

PwC
July 27th, 2016
DC3 - Highly confidential information
Economic value (DCF)Enersis Américas, Endesa Américas and Chilectra Américas
12
Endesa Américas S.A.
2 Valuation summary
The table below sets out the results of the economic valuation of the investments of the Group per business line (Generation, Distribution,Transmission, and others), in USDk.
Company Min Max Min Max Min Max Min Max
Emgesa S.A. Gx 10.94% 1,028,721 1,028,721 1,279,448 1,279,448 - - 1,796,146 1,796,146
Codensa S.A. Dx 10.27% 858,624 1,060,055 - - 205,101 253,218 1,061,859 1,310,970
Sociedad Portuaria Central Cartagena S.A. Other 9.88% 495 495 563 563 10 10 843 843
1,887,839 2,089,271 1,280,011 1,280,011 205,111 253,228 2,858,848 3,107,959
Chinango S.A.C. Gx 9.28% 66,861 66,861 197,555 197,555 - - 185,357 185,357
Edegel S.A. Gx 9.28% 468,272 468,272 1,383,600 1,383,600 - - 1,298,168 1,298,168
Empresa Electrica De Piura S.A. Gx 9.28% 201,729 201,729 - - - - 201,729 201,729
Edelnor S.A. Dx 8.67% 723,893 927,312 - - 187,718 240,469 909,905 1,165,594
Inversiones Distrilima S.A. Other 8.33% 20,304 20,304 - - 8,766 8,766 28,990 28,990
Generandes Perú S.A. Other 8.33% 228 228 357 357 - - 442 442
Generalima S.A. Other 8.33% (78,733) (78,733) - - - - (78,733) (78,733)
Empresa Electrica Caboblanco S.A. Other 8.33% 8,212 8,212 - - - - 8,212 8,212
1,410,768 1,614,187 1,581,512 1,581,512 196,484 249,234 2,554,070 2,809,760
Ampla Energia e Servicos S.A. Dx 12.97% 162,622 270,747 62,555 104,146 131,673 219,220 330,618 550,441
Coelce S.A. Dx 12.97% 373,249 464,231 180,645 224,678 54,820 68,182 535,923 666,557
C.G.T Fortaleza S.A. Gx 13.71% 172,617 172,617 125,845 125,845 38,190 38,190 285,942 285,942
Cachoeira Dourada S.A. Gx 13.71% 219,155 219,155 159,773 159,773 48,486 48,486 363,034 363,034
CIEN S.A. Tx 12.57% 156,415 162,095 114,033 118,174 34,605 35,862 259,104 268,513
Enel Brasil S.A Holding 12.54% (27,109) (27,109) (19,763) (19,763) (5,997) (5,997) (44,906) (44,906)
En-Brasil Comercio e Serviços S.A. Other 16.98% 82,696 82,696 60,295 60,295 18,291 18,291 136,986 136,986
1,139,646 1,344,432 683,382 773,148 320,067 422,233 1,866,701 2,226,567
Hidroeléctrica El Chocón S.A. Gx 25.86% - - 55,678 55,678 - - 33,396 33,396
Southern Cone Power Argentina S.A. Gx 25.86% (0) (0) (13) (13) - - (8) (8)
Endesa Costanera S.A. Gx 25.86% 0 0 2,914 2,914 - - 1,748 1,748
Endesa Cemsa S.A. Other 29.51% 1,344 1,344 1,100 1,100 - - 2,004 2,004
Central Dock Sud S.A. Gx 25.86% 13,485 13,485 - - - - 13,485 13,485
Edesur S.A. Dx 24.88% 9,038 9,038 120 120 8,189 8,189 17,225 17,225
Yacilec S.A. Tx 170 170 - - - - 170 170
Transportadora de Energía del Mercosur S.A. Tx 24.17% (5,895) (5,895) (4,298) (4,298) (1,304) (1,304) (9,765) (9,765)
Cía. de Transmisión del Mercosur S.A. (CTM) Tx 24.17% (6,076) (6,076) (4,430) (4,430) (1,344) (1,344) (10,065) (10,065)
Distrilec S.A. Holding 24.30% (19) (19) (1) (1) (17) (17) (36) (36)
Endesa Argentina S.A. Other 24.30% 0 0 960 960 - - 576 576
Hidroinvest S.A. Other 24.30% - - (70) (70) - - (42) (42)
12,047 12,047 51,960 51,960 5,524 5,524 48,687 48,687
4,450,300 5,059,937 3,596,865 3,686,631 727,186 930,219 7,328,306 8,192,972
Argentina
Total
(1) For the Argentinian companies' valuation, only 50% of equity value has been assigned.
Business
line
Colombia
WACC
Direct Investment
Endesa Americas
(Direct and Indirect)
Chilectra Americas
(Direct and Indirect)
Enersis Americas
(Direct and Indirect)
Peru
Brazil
GlossaryAppendicesResults of the valuationExecutive summaryContents

PwC
July 27th, 2016
DC3 - Highly confidential information
Results of the valuation
13
Endesa Américas S.A.
Results of the valuation 13
3 Argentina 15
4 Brazil 30
5 Colombia 43
6 Peru 53
GlossaryAppendicesResults of the valuationExecutive summaryContents

PwC
July 27th, 2016
DC3 - Highly confidential information
Economic valuationEnterprise Value of the companies by line of business
The following graphs show the enterprise value of companies operating in the generation, distribution and transmission businesses, based on the DCF model; the implied EV/EBITDA multiple and the comparative with the Latin America multiples (for more details, please refer to the description of each company).
14
Endesa Américas S.A.
110,198 55,422 49,451 395,808 339,742
6,448,622
2,371,193
252,119
425,818
2.86x
0.72x 1.32x
3.89x4.65x
10.03x9.49x
5.58x
9.05x
7.60x
0.00x
3.00x
6.00x
9.00x
12.00x
-
2,000,000
4,000,000
6,000,000
8,000,000
El
Ch
oc
ón
Co
sta
ne
ra
Do
ck S
ud
Cach
oe
ira
Fo
rta
leza
Em
ge
nsa
Ed
eg
el S
.A.
EE
PS
A
Ch
ina
ng
o
EV and implicit EV/EBITDA multiple (Generation business)
EV EV/EBITDA Multiple Market Multiple (Gx Latam)
215,560 2,482 978 1,524,576 1,263,003 328,183 3,075,397 1,755,988
1.18x 1.90x0.80x
9.72x6.07x 5.72x 7.22x
8.38x
7.13x
8.21x
0.00x
3.00x
6.00x
9.00x
12.00x
-
1,000,000
2,000,000
3,000,000
Ed
esu
r
TE
SA
CT
M
Am
pla
Co
elc
e
Cie
n
Co
den
sa
S.A
.
Ed
eln
or
S.A
.
EV and implicit EV/EBITDA multiples (Distribution and Transmission businesses)
EV EV/EBITDA Multiple Market Multiple (Dx Latam) Market Multiple (Tx Latam)
GlossaryAppendicesResults of the valuationExecutive summaryContents
PwC
July 27th, 2016
DC3 - Highly confidential information
Argentina
15
Endesa Américas S.A.
3 Argentina GlossaryAppendicesResults of the valuationExecutive summaryContents

PwC
July 27th, 2016
DC3 - Highly confidential information
Economic valuation Argentina
The table below sets out the results of the economic valuation of Enersis Américas S.A., Endesa Américas S.A. and Chilectra Américas S.A.’s operations in Argentina as at 30 June 2016:
16
Endesa Américas S.A.
3 Argentina
USD k
Country Company
Line of
business
Equity
value
Equity value
with 50%
adjustment (1)
Direct Investment
Enersis
Américas
Investment
Endesa
Américas
Investment
Chilectra
Américas
Investment
Enersis
Américas
Hidroeléctrica El Chocón S.A. Gx 170,359 85,180 - 55,678 - 33,396
Southern Cone Power Argentina S.A. Gx (27) (13) (0) (13) - (8)
Endesa Costanera S.A. Gx 7,702 3,851 0 2,914 - 1,748
Endesa Cemsa S.A. Gx 4,889 2,444 1,344 1,100 - 2,004
Central Dock Sud S.A. Gx 67,015 33,507 13,485 - - 13,485
Termoeléctrica Manuel Belgrano S.A. Gx - - - - - -
Termoeléctrica José de San Martín S.A. Gx - - - - - -
Central Vuelta de Obligado S.A. Gx - - - - - -
Edesur S.A. Dx 48,106 24,053 9,038 120 8,189 17,225
Yacilec S.A. Tx 1,526 763 170 - - 170
Transportadora de Energía del Mercosur S.A. (Tesa) Tx (23,146) (11,573) (5,895) (4,298) (1,304) (9,765)
Cía. de Transmisión del Mercosur S.A. (CTM) Tx (23,857) (11,929) (6,076) (4,430) (1,344) (10,065)
Distrilec S.A. Holding (142) (71) (19) (1) (17) (36)
Inversora Dock Sud S.A. Others - - - - - -
Endesa Argentina S.A. Others 1,920 960 0 960 - 576
Sacme S.A. Others - - - - - -
Hidroinvest S.A. Others (145) (73) - (70) - (42)
Total Argentina 254,200 127,100 12,047 51,960 5,524 48,687
(1) Considering the high degree of project uncertainty together w ith the serious economic challenges and currency restrictions, the resulting DCF in Argentina has been
assigned a 50% discount for purposes of valuing the Group.
Arg
entina
GlossaryAppendicesResults of the valuationExecutive summaryContents

PwC
July 27th, 2016
DC3 - Highly confidential information
Description of the operationsBackground
Economic perspectives
GDP growth projection for Argentina is -0.9% in FY16 and the expectedannual average growth rate over the period 2017 – 2021 is 2.6%.Inflation is expected to be 31.5% in FY16, thereafter it is projected todecrease annually to 11.5% in FY21.
Energy Sector
In the Wholesale Electricity Market (MEM in Spanish) there are fourcategories of local agents (generators, transmitters, distributors andgrand customers) and foreign agents (generation dealers and dealers ondemand) whom are authorized to trade electricity and related products.
17
Endesa Américas S.A.
3 Argentina
- The generation business is subject to a remuneration scheme basedon average costs and obliges all energy generated to be deliveredCompañía Administradora del Mercado Eléctrico Mayorista, S.A.(CAMMESA).
- The transmission business includes a number of companies thatoperate based on the concessions granted by the FederalGovernment grants.
- The distribution business operates through companies that aregranted concessions and have the responsibility of delivering energyto the customers located in the concession area.
During December 2015, a national energy emergency was declared for aperiod of two years until December 2017. The Ministry of Energy hasbeen instructed to implement measures in order to adjust the qualityand security of the energy supply.
Source: Management Presentations
-0.9
1.8
2.3
2.9 3.0 3.0
2016 2017 2018 2019 2020 2021
GDP (%)31.5
23.020.0
17.014.0
11.5
2016 2017 2018 2019 2020 2021
Inflation (%)
15.95 16.58 17.1018.31
19.6921.17
2016 2017 2018 2019 2020 2021
Exchange Rate year-end ARS/USD
GlossaryAppendicesResults of the valuationExecutive summaryContents

PwC
July 27th, 2016
DC3 - Highly confidential information
Description of the operationsBackground
Current Regulatory Framework – Generation
According to the Resolution SEN N° 482/2015, all the generator agentsof the MEM must be connected to the Sistema Nacional Interconectado(SIN) and are obliged to comply with the delivery order in order togenerate and provide energy. All the energy is sold in the spot andfuture markets (Mercado a Termino – MAT in Spanish). Due to thisresolution, the remuneration system of the generators that was in placesince 2014 has now been updated.
The generation price is determined every 6 months by the Secretary ofEnergy (once the CAMMESA has made its spot price projections for theperiod under consideration) and any existing differences between theprice and the real cost are compensated through a compensation fund.
Current Regulatory Framework – Distribution
Distribution companies have to supply all the electricity demand in theconcession area exclusively at prices and conditions established byRegulation. Concessions’ agreements include penalties in the event of alack of supply.
Resolutions ENRE 6/2016 y 7/2016:
- Terminate the subsidies to the distribution business and designatenew wholesale prices per consumption segment.
- Instruct the ENRE to increase the value added of distribution (VAD),set new tariffs with monthly payments. Create a Social Tariff and aStimulation Plan for Consumption Savings (without affecting theVAD).
- Instruct the ENRE to conduct a comprehensive rate review (RTI inSpanish) in the period up until the end of 2016.
18
Endesa Américas S.A.
3 Argentina
- The necessity to present an investments’ plan (Resolutions ENRE1/2016 y 2/2016).
- Fixed new rates with increases of between 250% and 500%,depending on the type of user and creation of a Social Tariff.
Financial performance Enersis Group
Total Group EBITDA from its operations in Argentina during FY15amounted to ARS 2,352 million, 51% of which was from theDistribution business, 48% from the Generation business and 1% fromthe Transmission business.
The Group’s distribution business has a presence in Argentina throughEdesur, with total sales of 18,492 GWh and 2.5 million customers. Thegeneration business operates through Hidroeléctrica El Chocón, EndesaCostanera and Central Dock Sud with a total installed capacity inhydropower and thermal power plants of 4,522 MW, during FY15.
Gx. 48%Dx. 51%
Tx. 1%
EBITDA FY15 per business line
Source: PwC Analysis
GlossaryAppendicesResults of the valuationExecutive summaryContents

PwC
July 27th, 2016
DC3 - Highly confidential information
Description of the operationsGeneration Business
Ownership Structure The generation of electricity in Argentina is held throughEndesa Costanera, Hidroeléctrica El Chocón and Central DockSud. These companies have a total installed capacity of 3,650MW (representing 10.9% of market share).
Generation reached 11,406 GWh during FY15 (8.3% of totalgeneration in Argentina).
Costanera and Chocón have ownership interests in companiesthat operate combined cycles through FONINVEMEN, and theproject Vuelta de Obligado (VOSA), which are agreementswith the Energy Secretary.
At present, the development of new projects is not beingconsidered in Argentina.
19
Endesa Américas S.A.
3 Argentina
Enersis
Américas
Endesa
Américas
Endesa
Argentina
Endesa
Costanera
Term. José
de San
Martín
59.98%
39.00
%99.99%
49.68%24.85%
Hidroinvest
41.94%
Southern
Cone Power
Hidroeléctric
a El Chocón
59.00
%
100.00%
Term.
Manuel
Brelgrano
Central
Vuelta de
Obligado
54.15%
6.19%
18.85%
18.85%
33.20%
1.15%
Inversora
Dock Sud
57.14%
Central Dock
Sud
69.99%0.25%
1.30%
6.40%
5.33%
1.42%
5.37%
1.42%
Source: Financial Statements FY14 and FY15
Generation
Distribution
Transmission
Others
Source: Management presentations
Installed Capacity (MW) 2014 2015
Endesa Costanera (combined cycle) 2,324 2,324
El Chocón (hydro) 1,328 1,328
Central Dock Sud 870 870
Total 4,522 4,522
Generation of Electrical Energy (GWh)
Endesa Costanera 6,972 8,167
El Chocón 2,632 3,239
Central Dock Sud 4,786 3,799
Total 14,390 15,205
Sales of Electrical Energy (GWh)
Endesa Costanera 7,051 8,168
El Chocón 3,391 3801
Central Dock Sud 4,834 3,802
Total 15,276 15,771
GlossaryAppendicesResults of the valuationExecutive summaryContents

PwC
July 27th, 2016
DC3 - Highly confidential information
Description of the operationsDistribution and Transmission Business
Ownership structure – Distribution and Transmission Business
20
Endesa Américas S.A.
3 Argentina
Generation
Distribution
Transmission
Others
Distribution Transmission
Enersis
Américas
Endesa
Américas
Chilectra
Américas
Distrilec
Edesur
SACME
59.98% 99.09%
27.19% 0.89%
100.00%
50.00%
Edenor 50,00%
22.25%
23.42%
22.25%
Yacilec
22.22%
Enersis
Américas
Endesa
Américas
Enel Brasil
Cien
CTM
59.98% 55.00%
50.93% 47.14%
100.00%
99.99%
Endesa
Argentina
Tesa
99.99%
99.99%
CEMSA45.00
%
0.001%
Source: Management presentations
GlossaryAppendicesResults of the valuationExecutive summaryContents

PwC
July 27th, 2016
DC3 - Highly confidential information
Description of the operationsDistribution and Transmission Business
Distribution Business
Edesur provides distribution and marketing services of electrical energyin the district of Buenos Aires and 12 additional districts of the BuenosAires province, spanning 3,309 km2, over a period of 95 years, startingon 31st August 1992.
Edesur customers amount to 2.5 million (15% of total customers in thecountry based on physical sales). It registered an energy losses index of12.28% in FY15.
During the current year, the Edesur’s receivables collectabilityamounted to 99.26%.
21
Endesa Américas S.A.
3 Argentina
Transmission Business
For more information, please refer to the Operational background ofthe transmission business in Brazil.
Source: Company’s Annual Reports FY14 and FY15
Operating Information 2014 2015
Electrical Energy Sales (GWh) 17,971 18,492
Total clients (k) 2,465 2,480
Annual rate of energy losses 10.76% 12.28%
GlossaryAppendicesResults of the valuationExecutive summaryContents
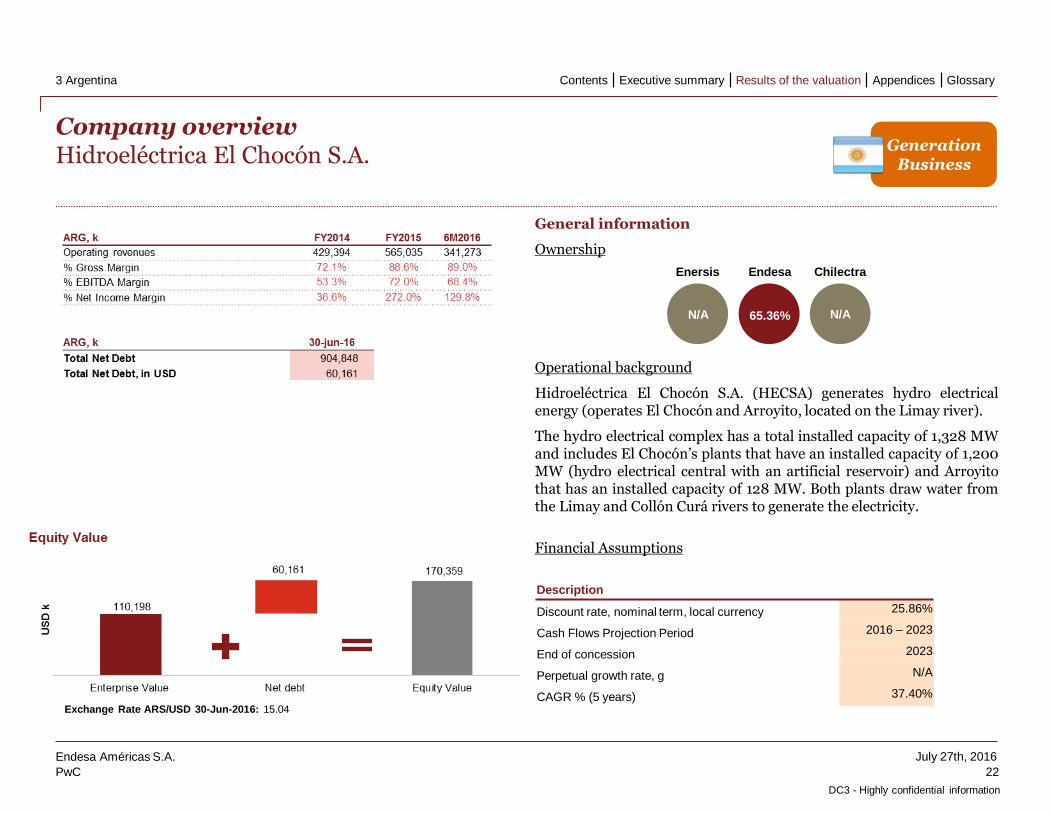
PwC
July 27th, 2016
DC3 - Highly confidential information
Company overviewHidroeléctrica El Chocón S.A.
General information
Ownership
Operational background
Hidroeléctrica El Chocón S.A. (HECSA) generates hydro electricalenergy (operates El Chocón and Arroyito, located on the Limay river).
The hydro electrical complex has a total installed capacity of 1,328 MWand includes El Chocón’s plants that have an installed capacity of 1,200MW (hydro electrical central with an artificial reservoir) and Arroyitothat has an installed capacity of 128 MW. Both plants draw water fromthe Limay and Collón Curá rivers to generate the electricity.
Financial Assumptions
22
Endesa Américas S.A.
3 Argentina
N/A 65.36% N/A
Enersis Endesa Chilectra
Description
Discount rate, nominal term, local currency 25.86%
Cash Flows Projection Period 2016 – 2023
End of concession 2023
Perpetual growth rate, g N/A
CAGR % (5 years) 37.40%
Exchange Rate ARS/USD 30-Jun-2016: 15.04
Generation Business
GlossaryAppendicesResults of the valuationExecutive summaryContents

PwC
July 27th, 2016
DC3 - Highly confidential information
Company overview Endesa Costanera S.A.
23
Endesa Américas S.A.
3 Argentina
General information
Ownership
Operational background
This company is located in the city of Buenos Aires and owns 6 turbovapor units for a total of 1,138 MW, which can be operated usingnatural gas and fuel oil. It also operates 2 combined cycles of 859 MWand 327 MW, respectively, with a total installed capacity of 2,324 MW.
During FY15 net generation amounted to 8,167 GWh and sold energyreached 8,168 GWh.
Financial Assumptions
N/A 75.67% N/A
Enersis Endesa Chilectra
Description
Discount rate, nominal term, local currency 25.86%
Cash Flows Projection Period 2016 – 2023
End of concession 2023
Perpetual growth rate, g N/A
CAGR % (5 years) 25.85%
Generation Business
Exchange Rate ARS/USD 30-Jun-2016: 15.04
GlossaryAppendicesResults of the valuationExecutive summaryContents

PwC
July 27th, 2016
DC3 - Highly confidential information
Company overview Central Dock Sud S.A.
24
Endesa Américas S.A.
3 Argentina
General information
Ownership
Operational background
Located in the neighborhood of Avellaneda, in the city of Buenos Aires,Dock Sud owns and operates two generating plants with a total capacityof 870 MW. Dock Sud’s plant has four gas turbines and a steam turbine.Two of the gas turbines and the steam turbine include a combined cycleplant.
The energy generated by Dock Sud during 2015 was 3,799 GWh,contributing 2.8% to the system, while energy sales amounted 3,802GWh, representing 2.9% of the country’s total sales.
Financial Assumptions
40.25% N/A N/A
Enersis Endesa Chilectra
Description
Discount rate, nominal term, local currency 25.86%
Cash Flows Projection Period 2016 – 2025
End of concession 2025
Perpetual growth rate, g N/A
CAGR % (5 years) 11.98%
Generation Business
Exchange Rate ARS/USD 30-Jun-2016: 15.04
GlossaryAppendicesResults of the valuationExecutive summaryContents

PwC
July 27th, 2016
DC3 - Highly confidential information
Company overview Empresa Distribuidora Sur S.A. (Edesur)
25
Endesa Américas S.A.
3 Argentina
General information
Ownership
Operational background
Edesur distributes electrical energy in the region of Buenos Aires,including within two thirds of the city of Buenos Aires and twelvedistricts of the province of Buenos Aires, spanning 3,309 km2, for aperiod of 95 years starting on 31 August 1992.
During 2015, Edesur delivered electrical energy to 2,479,559customers, representing a 0.63% growth in comparison with theprevious year. Energy sales amounted 18,492 GWh, representing a2.9% growth in comparison with the previous year.
Financial Assumptions
37.58% 0.50% 34.05%
Enersis Endesa Chilectra
Description
Discount rate, nominal term, local currency 24.88%
Cash Flows Projection Period 2016 – 2020
End of concession N/A
Perpetual growth rate, g 11.50%
CAGR % (5 years) 44.15%
Distribution Business
Exchange Rate ARS/USD 30-Jun-2016: 15.04
GlossaryAppendicesResults of the valuationExecutive summaryContents

PwC
July 27th, 2016
DC3 - Highly confidential information
Company overview Cía. de transmission del Mercosur S.A. (CTM)
26
Endesa Américas S.A.
3 Argentina
General information
Ownership
Operational background
An energy transmission Company (and subsidiary of CIEN S.A.) thatconnects the systems in Brazil and Argentina.
Financial Assumptions
50.94% 37.14% 11.27%
Enersis Endesa Chilectra
Description
Discount rate, nominal term, local currency 24.17%
Cash Flows Projection Period 2016 – 2020
End of concession N/A
Perpetual growth rate, g 11.50%
CAGR % (5 years) 11.10%
Transmission Business
Exchange Rate ARS/USD 30-Jun-2016: 15.04
GlossaryAppendicesResults of the valuationExecutive summaryContents

PwC
July 27th, 2016
DC3 - Highly confidential information
Company overview Transportadora de Energía del Mercosur S.A. (TESA)
27
Endesa Américas S.A.
3 Argentina
General information
Ownership
Operational background
An energy transmission Company (and subsidiary of CIEN S.A.) thatconnects the systems in Brazil and Argentina.
Financial Assumptions
50.94% 37.14% 11.27%
Enersis Endesa Chilectra
Description
Discount rate, nominal term, local currency 24.17%
Cash Flows Projection Period 2016 – 2020
End of concession N/A
Perpetual growth rate, g 11.50%
CAGR % (5 years) 13.30%
Transmission Business
Exchange Rate ARS/USD 30-Jun-2016: 15.04
GlossaryAppendicesResults of the valuationExecutive summaryContents

PwC
July 27th, 2016
DC3 - Highly confidential information
Company overview Endesa Cemsa S.A.
28
Endesa Américas S.A.
3 Argentina
General information
Ownership
Operational background
The Company markets electric energy in local and foreign markets.
Financial Assumptions
55.00% 44.99% N/A
Enersis Endesa Chilectra
Description
Discount rate, nominal term, local currency 29.51%
Cash Flows Projection Period 2016 - 2020
End of concession N/A
Perpetual growth rate, g 11.50%
CAGR % (5 years) 41.16%
Others
Exchange Rate ARS/USD 30-Jun-2016: 15.04
GlossaryAppendicesResults of the valuationExecutive summaryContents

PwC
July 27th, 2016
DC3 - Highly confidential information
Other companies in Argentina
29
Endesa Américas S.A.
3 Argentina
Based on the information provided in the dataroom and Management comments, the following Argentinian-based companies are not currentlyoperating and do not hold significant assets (other than investments in other Group companies that are already included in the valuation) orliabilities:
(a) Information requested to Management but not provided
(b) Financial Projections only include operating expenses
Company Sector Description Ownership (%)
Termoeléctrica Manuel BelgranoS.A. (a)
Gx Part of government investment fund -FONINVEMEM.
Enersis (0.57%); Endesa (16.35%)
Termoeléctrica José de San Martín S.A. (a)
Gx Part of government investment fund -FONINVEMEM.
Enersis (0.57%); Endesa (16.35%)
Central Vuelta de Obligado S.A. (a) Gx The construction of new thermal plant is awaiting approval.
Enersis (2.58%); Endesa (22.68%)
Endesa Argentina S.A. (b) Others Owns a minority interest in Hidroeléctrica ElChocón S.A.
Enersis (0.01%); Endesa (99.9%)
Inversora Dock Sud S.A. (a) Others Holds an investment in Central Dock Sud S.A. Enersis (57.14%)
Hidroinvest S.A. (b) Others Holds a majority interest Hidroeléctrica ElChocón S.A
Endesa (96.09%)
Southern Cone Power Argentina S.A. (b)
Gx Energy wholesaler. Enersis (0.08%); Endesa (99.92%)
Sacme S.A. (a) Others Supervises remote control systems. Enersis (18.79%); Chilectra (7.02%); Endesa (0.25%)
Distrilec S.A. (b) Others Holds interest in Edesur S.A Enersis (27.19%); Chilectra(23.42%); Endesa (0.89%)
GlossaryAppendicesResults of the valuationExecutive summaryContents

PwC
July 27th, 2016
DC3 - Highly confidential information
Brazil
30
Endesa Américas S.A.
4 Brazil GlossaryAppendicesResults of the valuationExecutive summaryContents

PwC
July 27th, 2016
DC3 - Highly confidential information
Economic valuation Brazil
The table below sets out the results of the economic valuation of Enersis Américas S.A., Endesa Américas S.A. and Chilectra Américas S.A.’s operations in Brazil at 30 June 2016:
31
Endesa Américas S.A.
4 Brazil
USD k
Country Company
Line of
business
Equity
value
Investment
(Direct)
Investment
Endesa Américas
Investment
Chilectra
Américas
Investment
Enersis
Américas
Ampla Energia e Servicos S.A. Dx 479,396 216,999 83,472 175,701 441,170
Coelce S.A. Dx 937,058 423,267 204,852 62,166 607,740
C.G.T Fortaleza S.A. Gx 338,872 172,617 125,845 38,190 285,942
Cachoeira Dourada S.A. Gx 431,296 219,155 159,773 48,486 363,034
Eólica Fazenda Nova Geraçao e Comercializaçao de
Energia S.A.
Gx - - - - -
EGP Modelo I Eólica Gx - - - - -
EGP Modelo II Eólica Gx - - - - -
CIEN S.A. Tx 312,562 159,214 116,074 35,225 263,741
Enel Brasil S.A Hold (53,219) (27,109) (19,763) (5,997) (44,906)
En-Brasil Comercio e Serviços S.A. Otros 162,345 82,696 60,295 18,291 136,986
Ingendesa do Brasil Ltda. Otros - - - - -
Total Brazil 2,608,311 1,246,840 730,547 372,061 2,053,707
Bra
zil
GlossaryAppendicesResults of the valuationExecutive summaryContents

PwC
July 27th, 2016
DC3 - Highly confidential information
Description of the operationsBackground
Economic perspectives
GDP growth projection for Brazil is -3.6% in FY16 and the expectedannual average growth rate over the period 2017 - 2021 is 1.7%.Inflation is projected at 7.5% in FY16, decreasing annually to 4.6% inFY21.
Energy sector
The electricity industry is organized in a large interconnected electricalsystem (Sistema Interligado Nacional) that includes most regions ofBrazil. The generation, transmission, distribution and marketingoperations are legally separated in Brazil. The industry is regulated bythe Mining and Energy Ministry (MME) and the National Agency ofElectric Energy (ANEEL).
32
Endesa Américas S.A.
4 Brazil
- In the generation business, the wholesale price is based on theaverage prices of the concession auctions, including independent bidprocesses of existing energy and new energy.
- In the transmission business, tariffs for the companies are set by theBrazilian Government. The charge for the transmission is fixed andtransmission revenues don’t depend on the quantity of electricitytransmitted.
- The distribution business operates through companies to whichconcessions have been granted. Distributors cannot: (i) developactivities related to the generation or transmission of electricity; (ii)sell electricity to non-regulated customers, (iii) maintain a direct orindirect interest in any other company or corporation; (iv) developactivities that are not related to their respective concessions.
Source: Management Presentations
-3.6
0.2
1.62.0
2.32.6
2016 2017 2018 2019 2020 2021
GDP(%)
7.5
6.15.7 5.5
5.04.6
2016 2017 2018 2019 2020 2021
Inflation (%)
3.95
4.00
3.95
3.90
3.85
3.80
2016 2017 2018 2019 2020 2021
Exchange Rate year-end BRL/USD
GlossaryAppendicesResults of the valuationExecutive summaryContents

PwC
July 27th, 2016
DC3 - Highly confidential information
Description of the operationsBackground
Current Regulatory Framework actual - Generation
Generation agents can sell electrical energy under two regulatedenvironments: (i) The Regulated Contracting Environment (ACR)where distribution companies operate and where the purchase ofenergy should be conducted under a bidding process coordinated byANEE; and (ii) the Free Contracting Environment (ACL), in which theconditions for purchasing energy are negotiable directly betweensuppliers and customers.
Sales contracts are registered in the Chamber of ComercializaçãoElectric Energy (CCEE) and are part of the basis for the determinationof adjustments due to differences arising in the short-term market.
The new energy auctions are for long-term contracts (20-25 years forthermal plants and 30 for hydro) in which the new generation projectsshould cover increases in demand expected by distributors.
Current Regulatory Framework actual –Distribution
Distribution companies purchase electricity through bids (which areheld annually) that are regulated by ANEEL and organized by CCEE.The government also has the right to call special bids for renewableelectricity (biomass, small hydro, solar and wind power plants).
There are three types of rate revisions to final consumers: (i) the TariffRepositioning Index (IRT), which is adjusted for inflation; (ii) theRevised Tariff Ordinary (RTO) performed every four or five yearsdepending on each concession contract, and (iii) Extraordinary TariffReview (RTE), which is carried out when a noteworthy event thatsignificantly affects the value of the tariff occurs. All revisions and tariffrepositioning are approved by ANEE.
33
Endesa Américas S.A.
4 Brazil
Financial performance Enersis Group
Total Group EBITDA from Brazil operations in FY15 was BRL 1,898million, 59% from the distribution business, 29% from the generatingbusiness and 12% from the transmission business.
In the distribution business, the Group operates in Brazil throughAmpla and Coelce with total energy sales of 22,776 GWh and 6.7million customers. The generation business operates through CentraisEléctricas Cachoeira Dourada and C.G.T with a total installed capacityin hydroelectric and thermal power plants of 987 MW FY15.
Source: PwC Analysis
Gx. 29%
Dx. 59%
Tx. 12%
EBITDA 2015 per business line
GlossaryAppendicesResults of the valuationExecutive summaryContents

PwC
July 27th, 2016
DC3 - Highly confidential information
Description of the operationsGeneration, Distribution and Transmission Business
Ownership structure – Generation, Distribution and Transmission Business
34
Endesa Américas S.A.
4 Brazil
Generation
Distribution
Transmission
Others
Enersis
Américas
Endesa
Américas
Chilectra
Américas
Enel Brasil
Cachoeira
Dourada
59.98% 99.09%
50.09% 34.64%
C.G.T FortalezaEolica Fazenda
Noca
EN-Brasil
Comercio e
Servicios
E.G.P Modelo I E.G.P Modelo II
99.75% 100.00% 99.95%
0.97%99.99% 0.97%
Edegel 3.99% Ampla
5.33%
21.38%
46.89%
Coelce
Cien
100.00%
15.18%
58.87%
Source: Management presentations
GlossaryAppendicesResults of the valuationExecutive summaryContents
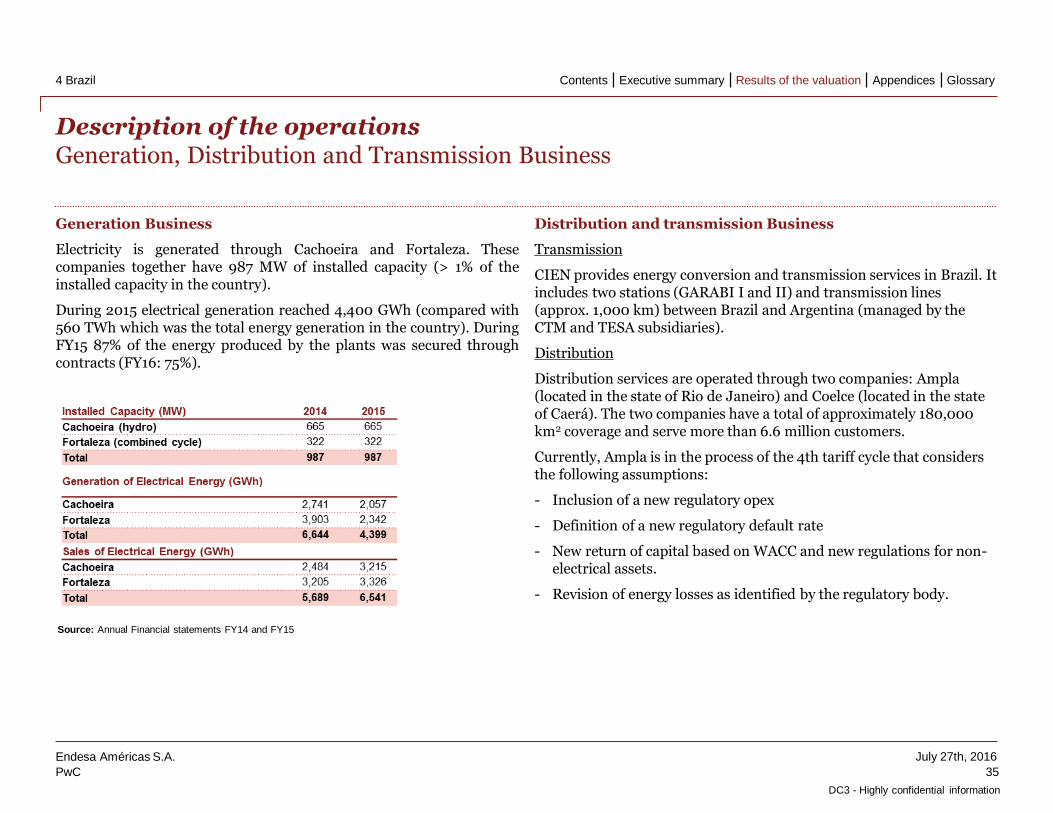
PwC
July 27th, 2016
DC3 - Highly confidential information
Description of the operationsGeneration, Distribution and Transmission Business
Generation Business
Electricity is generated through Cachoeira and Fortaleza. Thesecompanies together have 987 MW of installed capacity (> 1% of theinstalled capacity in the country).
During 2015 electrical generation reached 4,400 GWh (compared with560 TWh which was the total energy generation in the country). DuringFY15 87% of the energy produced by the plants was secured throughcontracts (FY16: 75%).
Distribution and transmission Business
Transmission
CIEN provides energy conversion and transmission services in Brazil. It includes two stations (GARABI I and II) and transmission lines (approx. 1,000 km) between Brazil and Argentina (managed by the CTM and TESA subsidiaries).
Distribution
Distribution services are operated through two companies: Ampla(located in the state of Rio de Janeiro) and Coelce (located in the state of Caerá). The two companies have a total of approximately 180,000 km2 coverage and serve more than 6.6 million customers.
Currently, Ampla is in the process of the 4th tariff cycle that considers the following assumptions:
- Inclusion of a new regulatory opex
- Definition of a new regulatory default rate
- New return of capital based on WACC and new regulations for non-electrical assets.
- Revision of energy losses as identified by the regulatory body.
35
Endesa Américas S.A.
4 Brazil
Source: Annual Financial statements FY14 and FY15
GlossaryAppendicesResults of the valuationExecutive summaryContents

PwC
July 27th, 2016
DC3 - Highly confidential information
Company overview Centrais Eléctricas Cachoeira Dourada S.A.
36
Endesa Américas S.A.
4 Brazil
General information
Ownership
Operational background
This company is located in the State of Goias, 240 km south of Goiania.It has ten units with a total of 665 MW of installed capacity. It is anhydroelectric pass-through and it draws water from the ParanaibaRiver.
Net Generation during 2015 was 2,057 GWh, while sales reached 3,215GWh.
Financial Assumptions
50.81% 37.04% 11.24%
Enersis Endesa Chilectra
Description
Discount rate, nominal term, local currency 13.71%
Cash Flows Projection Period 2016 – 2027
End of concession 2027
Perpetual growth rate, g N/A
CAGR % (5 years) 7.89%
Exchange Rate BRL/USD 30-Jun-2016: 3.20
Generation Business
GlossaryAppendicesResults of the valuationExecutive summaryContents

PwC
July 27th, 2016
DC3 - Highly confidential information
Company overview C.G.T Fortaleza S.A.
37
Endesa Américas S.A.
4 Brazil
General information
Ownership
Operational background
Operations are located in the municipality of Caucaia, 50 km from thecapital of Ceará state. It consists of a combined cycle power plant of 322MW using natural gas and has the capacity to generate a third of theelectricity needs of Ceará, for a population of about 8.2 million people.
Electrical generation in FY14 was 2,342 GWh, while sales totaled 3,326GWh.
Financial Assumptions
50.94% 37.14% 11.27%
Enersis Endesa Chilectra
Description
Discount rate, nominal term, local currency 13.71%
Cash Flows Projection Period 2016 – 2031
End of concession 2031
Perpetual growth rate, g N/A
CAGR % (5 years) 3.67%
Generation
Business
Exchange Rate BRL/USD 30-Jun-2016: 3.20
GlossaryAppendicesResults of the valuationExecutive summaryContents

PwC
July 27th, 2016
DC3 - Highly confidential information
Company overview Ampla Energía y Servicios S.A.
38
Endesa Américas S.A.
4 Brazil
General information
Ownership
Operational background
Ampla is an energy distribution company with operations in 73% of theterritory of the State of Rio de Janeiro (32,188 km2).
During FY15 Ampla delivered electricity services to 2,996,676customers, 4.2% more than in 2014. Energy sales in 2015 totalled11,547 GWh representing a decrease of 1.1 % in relation to 2014.
Financial Assumptions
45.27% 17.41% 36.65%
Enersis Endesa Chilectra
Description
Discount rate, nominal term, local currency 12.97%
Cash Flows Projection Period 2016 – 2020
End of concession N/A
Perpetual growth rate, g 4.60%
CAGR % (5 years) 7.55%
Distribution Business
Exchange Rate BRL/USD 30-Jun-2016: 3.20
GlossaryAppendicesResults of the valuationExecutive summaryContents

PwC
July 27th, 2016
DC3 - Highly confidential information
Company overview Coelce S.A.
39
Endesa Américas S.A.
4 Brazil
General information
Ownership
Operational background
Provides electricity distribution services in the state of Ceará innortheastern Brazil and covers a concession area of 148,921 km2. Thecompany serves a population of over 9 million.
Energy sales in FY15 were 11,229 GWh, an increase of 0.6% comparedto FY14. The number of customers at the year-end 2015 increased to3,757,651 (3.7% variation compared to year-end 2014).
Financial Assumptions
45.17% 21.86% 6.63%
Enersis Endesa Chilectra
Description
Discount rate, nominal term, local currency 12.97%
Cash Flows Projection Period 2016 – 2020
End of concession N/A
Perpetual growth rate, g 4.60%
CAGR % (5 years) 4.56%
Distribution Business
Exchange Rate BRL/USD 30-Jun-2016: 3.20
GlossaryAppendicesResults of the valuationExecutive summaryContents

PwC
July 27th, 2016
DC3 - Highly confidential information
Company overview Compañía de Interconexión Energética S.A. (CIEN)
40
Endesa Américas S.A.
4 Brazil
General information
Ownership
Operational background
La Compañía de Interconexión Energética S.A. (CIEN) is a powertransmission Company, including two frequency conversion stationsGarabi I and Garabi II, which convert two-way frequencies of Brazil (60Hertz) and Argentina (50 Hertz), and of the transmission lines. On theArgentinian side, these are managed by two of CIEN’s 100% ownedsubsidiaries: Company S.A. transmission Mercosur (CTM) andTransportadora de Energía S.A. (TESA).
The interconnection system consists of two transmission lines with atotal length of 1,000 km, and the converter station Garabi.
Financial Assumptions
50.94% 37.15% 11.27%
Enersis Endesa Chilectra
Description
Discount rate, nominal term, local currency 12.57%
Cash Flows Projection Period 2016 – 2022
End of concession 2022
Perpetual growth rate, g N/A
CAGR % (5 years) -3.24%
Transmission Business
Exchange Rate BRL/USD 30-Jun-2016: 3.20
GlossaryAppendicesResults of the valuationExecutive summaryContents

PwC
July 27th, 2016
DC3 - Highly confidential information
Company overview En-Brasil Comercio e Serviços S.A.
41
Endesa Américas S.A.
4 Brazil
General information
Ownership
Operational background
The company provides services to the electric power sector.
Financial Assumptions
50.94% 37.14% 11.27%
Enersis Endesa Chilectra
Description
Discount rate, nominal term, local currency 16.98%
Cash Flows Projection Period 2016 – 2020
End of concession N/A
Perpetual growth rate, g 4.60%
CAGR % (5 years) 81.76%
Others
Exchange Rate BRL/USD 30-Jun-2016: 3.20
GlossaryAppendicesResults of the valuationExecutive summaryContents

PwC
July 27th, 2016
DC3 - Highly confidential information
Other companies in Brazil
42
Endesa Américas S.A.
4 Brazil
Based on the information provided in the dataroom and Management comments, the following Brazilian-based companies are not currently operating and do not hold significant assets (other tan their investments in other Group companies that are already included in the valuation) or liabilities:
(a) Information requested to Management but not provided
(b) Financial Projections only include operating expenses
Company Sector Description Ownership (%)
EGP Modelo I Eólica (a) Gx Generation of electrical energy (wind origin) Enersis (0.50%); Chilectra (0.11%); Endesa (0.36%)
EGP Modelo II Eólica (a) Gx Generation of electrical energy (wind origin) Enersis (0.50%); Chilectra (0.11%); Endesa (0.36%)
Eólica Fazenda Nova Geraçao e Comercializaçao de Energia S.A. (a)
Gx Generation of electrical energy Enersis (50.91%); Chilectra (11.26%); Endesa (37.12%)
Enel Brasil S.A. (b) Others Manages the assets of Enersis, Endesa Chile andChilectra in Brazil.
Enersis (50.94%); Chilectra (11.27%); Endesa (37.14%)
Ingendesa do Brasil Ltda. (a) Others Provision of engineering services. Enersis (3.74%); Endesa (96.25%)
GlossaryAppendicesResults of the valuationExecutive summaryContents

PwC
July 27th, 2016
DC3 - Highly confidential information
Colombia
43
Endesa Américas S.A.
5 Colombia GlossaryAppendicesResults of the valuationExecutive summaryContents

PwC
July 27th, 2016
DC3 - Highly confidential information
Economic valuation Colombia
The table below sets out the results of the economic valuation of Enersis Américas S.A., Endesa Américas S.A. and Chilectra Américas S.A.’s operations in Colombia at 30 June 2016:
44
Endesa Américas S.A.
5 Colombia
USD k
Country Company
Line of
business
Equity
value
Investment
(Direct)
Investment
Endesa Américas
Investment
Chilectra
Américas
Investment
Enersis
Américas
Emgesa S.A. Gx 4,760,915 1,028,721 1,279,448 - 1,796,146
Emgesa Panamá S.A. Gx 0 - - - -
EEC S.A. Dx - - - - -
Codensa S.A. Dx 2,445,329 944,874 - 225,704 1,168,525
Inversora Codensa S.A.S. Hold - - - - -
Deca S.A. Hold - - - - -
Sociedad Portuaria Central Cartagena S.A. Otros 2,208 495 563 10 843
Total Colombia 7,208,453 1,974,090 1,280,011 225,714 2,965,514
Co
lom
bia
GlossaryAppendicesResults of the valuationExecutive summaryContents

PwC
July 27th, 2016
DC3 - Highly confidential information
Description of the operationsBackground
Economic perspectives
GDP growth projection for Colombia is 2.6% FY16 and the expectedannual average growth rate over the period 2017 – 2021 is 3.1%.Inflation is estimated at 7.1% in FY16, thereafter decreasing graduallyto 3.5% in FY21.
Energy Sector
To operate or initiate projects, permits must be obtained from theappropriate authorities (e.g. environmental, health, water rights andpermits of a municipal nature if required). The Ministry of Mines andEnergy (MME) dictates the Government's policy for the energy sector.
45
Endesa Américas S.A.
5 Colombia
- In the generation business, electricity transactions are conductedunder the modalities of the spot market, bilateral contracts and thereliability charge. It is mandatory for generation to engage thecentral office (applicable to plants generating > = 20MW).
- The Transmission business operates with fixed guaranteed annualincome determined by the new replacement value of networks andequipment and by the resulting value of the bidding processes thataward new projects in the national transmission system (STN).
- In the Distribution business, distributors or network operators areresponsible for planning, investing, operating and maintainingelectrical networks with voltages below 220 kV. Any customer canhave access to a distribution network for which he pays a connectionfee.
Source: Management Presentations
2.6
2.93.1 3.1
3.3 3.3
2016 2017 2018 2019 2020 2021
GDP (%)
7.1
4.8
4.0 4.0 3.8 3.5
2016 2017 2018 2019 2020 2021
Inflation (%)
3,1453,170
3,206
3,251
3,292
3,333
2016 2017 2018 2019 2020 2021
Exchange Rate year-end COP/USD
GlossaryAppendicesResults of the valuationExecutive summaryContents

PwC
July 27th, 2016
DC3 - Highly confidential information
Description of the operationsBackground
Current Regulatory Framework actual - Generation
In the short-term energy market, the National Dispatch Centre (CND)receives daily price offers and the declaration of commercial availabilityfor each hour of the following day, for all generators that participate inthe wholesale market. Based on this information, the CND performs aneconomic dispatch based on an optimized process for the 24 hours ofthe following day, taking into account the electrical and operatingsystem restrictions and other conditions necessary to meet the expecteddemand for energy the following day in a safe, reliable and economicalway. Unlike other countries where the central office is based on variableproduction costs, in Colombia it is based on prices offered by agents.
Current Regulatory Framework actual –Distribution
Distribution companies are free to acquire their own source of supplyand can define the conditions in public tender processes to acquire theenergy in regulated markets. They can also resort to buying energy inthe spot market.
Distribution charges are set by the CREG based on the newreplacement value of existing distribution assets, the cost of capital,non-electric assets, as well as operational and maintenance costs foreach company. They are defined for four different voltage levels asfollows: Level 1 less than 1 kV; Level 2 greater than or equal to 1 kV andless than 30kV; Level 3 greater than or equal to 30 kV and Level 4greater than or equal to 57.5 kV to less than 220 kV.
Levels 1, 2 and 3 are referred to as Local Distribution Systems (SDL)and Level 4 is referred to as the Regional transmission system (STR).
46
Endesa Américas S.A.
5 Colombia
Currently, the process is under review for distribution charges for thefive years spanning 2015 to 2019.
Financial performance Enersis Group
Group EBITDA from operations in Colombia was COP 2,926,782million in FY15, 42% of which arises from the distribution business and58% from the generation business.
Distribution is operated through Codensa with a total of 13,946 GWh ofenergy sales to 2.8 million customers.
Generation business is operated through Emgesa with a total installedcapacity in hydroelectric and thermoelectric plants of 3,459 MW FY15.
Source: PwC Analysis
Gx. 58%
Dx. 42%
EBITDA 2015 per business line
GlossaryAppendicesResults of the valuationExecutive summaryContents

PwC
July 27th, 2016
DC3 - Highly confidential information
Description of the operationsGeneration and distribution business
Ownership structure – Generation and Distribution Business
47
Endesa Américas S.A.
5 Colombia
Generation
Distribution
Transmission
Others
Enersis
Américas
Endesa
Américas
Chilectra
Américas
Emgesa
Emgesa Panamá
Soc. Portuaria
Cartagena
Codensa EEC
DecaInversora
Codensa
59.98% 99.09%
21.60% 26.88%
100.00%
94.95% 4.90%
100.00%48.97%
39.13% 9.35%
82.34%
Generation Business:
Generation is provided through Emgesa. This companyhas 3,459 MW of installed capacity through its fourteenstations (20.9% of the installed capacity in the country).
Electrical generation reached 11,406 GWh in FY15(compared with 560 TWh of total generation of thecountry).
At present, the development of new projects is not beingconsidered in Colombia.
Source: Annual Financial Statements FY15
Source: Management presentations
Installed Capacity (MW) 2014 2015
Emgesa 3,059 3,459
Total 3,059 3,459
Generation of Electrical Energy (GWh)
Emgesa 13,559 13,705
Total 13,559 13,705
Sales of Electrical Energy (GWh)
Emgesa 15,773 16,886
Total 15,773 16,886
GlossaryAppendicesResults of the valuationExecutive summaryContents

PwC
July 27th, 2016
DC3 - Highly confidential information
Operational backgroundGeneration Business y Distribution
Distribution Business
In Colombia, there are 31 other distributors involved in the electricalsystem. Codensa (22% of the national demand for electricity) and EECare companies that provide distribution services and sell electricity inBogota and Cundinamarca.
Codensa has a total coverage of approx. 14,400 km2 and serves morethan 2.8 million customers. During 2015 it initiated the process ofmerging with EEC that is expected to be completed by the end of 2016.
48
Endesa Américas S.A.
5 Colombia
Source: Annual Financial Statements FY14 and FY15
Operations information 2014 2015
Sales of Electrical Energy (GWh) 14,724 15,048
Total clients (k) 2,774 2,865
Annual rate of energy losses 7.19% 7.26%
GlossaryAppendicesResults of the valuationExecutive summaryContents

PwC
July 27th, 2016
DC3 - Highly confidential information
Company overview Emgesa S.A.
49
Endesa Américas S.A.
5 Colombia
General information
Ownership
Operational background
It is the largest generation company in Colombia and is located in the city of Bogota. The company operates 13 plants with a total capacity of 3,059 MW, including Guavio (1,213 MW) which is the largest hydroelectric plant in Colombia. Of the 13 existing plants, 11 are hydroelectric and two are thermal.
The new hydroelectric plant of El Quimbo started commercial operation on 16 November 2015.
Financial Assumptions
21.61% 26.87% N/A
Enersis Endesa Chilectra
Description
Discount rate, nominal term, local currency 10.94%
Cash Flows Projection Period 2016 – 2020
End of concession N/A
Perpetual growth rate, g 3.50%
CAGR % (5 years) 3.36%
Exchange Rate COP/USD 30-Jun-2016: 2,919.16
Generation Business
GlossaryAppendicesResults of the valuationExecutive summaryContents

PwC
July 27th, 2016
DC3 - Highly confidential information
Company overview Codensa S.A. E.S.P.
50
Endesa Américas S.A.
5 Colombia
General information
Ownership
Operational background
The company distributes and sells to customers in the Bogotá regionincluding 97 municipalities in Cundinamarca, 8 municipalities inBoyacá and one municipality of Tolima, over a total area of 14,456 km2.
Codensa focuses primarily on providing services to regulated customersbut also serves some industrial and commercial customers and publiclighting of municipalities.
Financial Assumptions
38.64% N/A 9.23%
Enersis Endesa Chilectra
Description
Discount rate, nominal term, local currency 10.27%
Cash Flows Projection Period 2016 – 2020
End of concession N/A
Perpetual growth rate, g 3.50%
CAGR % (cinco años) 5.68%
Distribution Business
Exchange Rate COP/USD 30-Jun-2016: 2,919.16
GlossaryAppendicesResults of the valuationExecutive summaryContents

PwC
July 27th, 2016
DC3 - Highly confidential information
Company overview Sociedad Portuaria Central Cartagena S.A.
51
Endesa Américas S.A.
5 Colombia
General information
Ownership
Operational background
This company is involved in the investment, construction andmaintenance of the docks within Cartagena’s port. It corresponds to aport concession agreement with the National Infrastructure Agency(ANI). Its objective is to implement infrastructure projects that willoptimize the port operations.
Financial Assumptions
22.41% 25.52% 0.45%
Enersis Endesa Chilectra
Description
Discount rate, nominal term, local currency 9.88%
Cash Flows Projection Period 2016 – 2020
End of concession N/A
Perpetual growth rate, g 3.50%
CAGR % (5 years) 9.95%
Others
Exchange Rate COP/USD 30-Jun-2016: 2,919.16
GlossaryAppendicesResults of the valuationExecutive summaryContents

PwC
July 27th, 2016
DC3 - Highly confidential information
Other companies in Colombia
52
Endesa Américas S.A.
5 Colombia
Based on information provided in the dataroom and Management comments, the following Colombian-based companies are not currently operating and do not hold significant assets (in addition to investments in other Group companies that are already included in the valuation) or liabilities:
(a) Information requested to Management but not provided
(b) Financial Projections only include operating expenses
Company Sector Description Ownership (%)
Emgesa Panamá S.A. (b) Gx Purchase, sale, import and export of electricity Enersis (21.60%); Endesa (26.87%)
Inversora Codensa S.A.S. (a) Others Minority interest in Sociedad Portuaria Central Cartagena S.A..
Enersis (39.13%); Chilectra (9.35%); Endesa (1.25%)
GlossaryAppendicesResults of the valuationExecutive summaryContents

PwC
July 27th, 2016
DC3 - Highly confidential information
Peru
53
Endesa Américas S.A.
6 Peru GlossaryAppendicesResults of the valuationExecutive summaryContents

PwC
July 27th, 2016
DC3 - Highly confidential information
Economic valuation Peru
The table below sets out the results of the economic valuation of Enersis Américas S.A., Endesa Américas S.A. and Chilectra Américas S.A.’s operations in Peru at 30 June 2016:
54
Endesa Américas S.A.
6 Peru
USD k
Country Company
Line of
business
Equity
value
Investment
(Direct)
Investment
Endesa Américas
Investment
Chilectra
Américas
Investment
Enersis
Américas
Chinango S.A.C. Gx 395,374 66,861 197,555 - 185,357
Edegel S.A. Gx 2,215,237 468,272 1,383,600 - 1,298,168
Empresa Electrica De Piura S.A. Gx 209,046 201,729 - - 201,729
Compañía Energética Veracruz S.A.C Gx - - - - -
Edelnor S.A. Dx 1,348,359 810,353 - 210,139 1,018,581
Inversiones Distrilima S.A. Others 29,070 20,304 - 8,766 28,990
Generandes Perú S.A. Others 585 228 357 - 442
Generalima S.A. Others (78,733) (78,733) - - (78,733)
Empresa Electrica Caboblanco S.A. Others 8,212 8,212 - - 8,212
Total Peru 4,127,149 1,497,227 1,581,512 218,905 2,662,747
Pe
ru
GlossaryAppendicesResults of the valuationExecutive summaryContents

PwC
July 27th, 2016
DC3 - Highly confidential information
Description of the operationsBackground
Economic perspectives
GDP growth projection for Peru is 3.7% in FY16 and the expectedannual average growth rate over the period 2017 – 2021 is 4.2%.Inflation is estimated at 3.7% in FY16, thereafter gradually decreasingto 2.4% in FY21.
Energy Sector
In Peru, energy policies at the national level are made by the Ministry ofEnergy and Mines (MEM) in conjunction with the Ministry ofEnvironment.
The National Electrical Interconnected System (SEIN) is operated bythe Committee of Economic Operation of the Systems (COES), whichcoordinates the dispatch of generation units based on the minimumcost. The node price is calculated annually.
55
Endesa Américas S.A.
6 Peru
- In the generation sector, companies that have a total installedcapacity greater than 5oo KW require a permanent concessiongranted by the MINEM.
- In the distribution sector, prices to regulated customers are set tocover for charges of energy and power, for generation andtransmission, plus the Aggregate Distribution or VAD value (whichconsiders a regulated return on investments), fixed charges foroperations and maintenance, and a standard percentage for energylosses in distribution.
- In the transmission sector, construction of the ComplementarySystem lines are approved by Osinergmin, which calculates theaverage annual cost to compensate for each installation, consideringinvestment standards, operation and maintenance, a discount rate of12% before taxes and a lifespan of 30 years.
Source: Management Presentations
3.7
4.14.0
4.1
4.3
4.4
2016 2017 2018 2019 2020 2021
GDP (%)
3.7
3.22.9
2.7 2.6 2.4
2016 2017 2018 2019 2020 2021
Inflation (%)
3.60 3.60
3.51
3.45
3.36
3.27
2016 2017 2018 2019 2020 2021
Exchange rate year-end PEN/USD
GlossaryAppendicesResults of the valuationExecutive summaryContents

PwC
July 27th, 2016
DC3 - Highly confidential information
Description of the operationsBackground
Current Regulatory Framework - Generation
COES is the coordinator of the delivery of electric operations and isresponsible for determining the spot price and the administration oftransactions that occur in the National Interconnected ElectricalSystem.
Transactions between generators and distributors and / or customerstake place at prices and on terms that have been mutually agreed upon.
In the Electric Concessions Law Decree (Law No. 25844 of 1992), theprice agreed upon through bilateral contracts can not be higher thanthe price determined by the COES in the case of regulated customers.In addition, Law 28832 of 2006 “Law to ensure the efficientdevelopment of electric generation" establishes that distributors canmeet the demand of their regulated and unregulated customers undercontracts signed after a process of auction of power and energysupervised by Osinergmin for a period of up to 20 years.
Current Regulatory Framework –Distribution
The Legislative Decree No. 1221 of 2015 established that the return oninvestment of the companies, determined by the VAD (value addedDistribution), will be estimated every four years based on a modelcompany, considering an internal rate of return of 12% with a deviationof +/- 4%.
56
Endesa Américas S.A.
6 Peru
Furthermore, an additional charge was set as part of the tariffs forprojects that are technologically innovative and energy efficient,previously approved by the Osinergmin and an incentive has beendefined for the improvement of the quality of service and the possibilityof extending the concession areas of distributors was defined takinginto account rural areas surrounding the concessions.
Financial performance of Enersis Group
FY15 Group EBITDA for operations in Peru was 1,690 MPEN, 39% ofwhich came from the distribution business and 61% from thegeneration business.
The distribution business is operated through Edelnor with total energysales of 7,642 GWh and 1.3 million customers. The generation businessis operated through Edegel, Empresa Electrica de Piura and Chinangowith a total installed capacity in hydroelectric and thermoelectric plantsof 2,049 MW FY15.
Source: Pwc Analysis
Gx. 61%
Dx. 39%
EBITDA 2015 per sector
GlossaryAppendicesResults of the valuationExecutive summaryContents

PwC
July 27th, 2016
DC3 - Highly confidential information
Description of the operationsGeneration and distribution businesses
Ownership structure – Generation and Distribution businesses
57
Endesa Américas S.A.
6 Peru
Generation
Distribution
Transmission
Others
Generation Business
Generation is operated through Edegel and S.E. Piura,which have a combined installed capacityof 1,983 MW across nine hydroelectric powerplants (representing 21% of the installed capacity in thecountry).
Generation reached 8,801 GWh in FY15 (in comparisonwith 39.8 TWh of total generation of the country).
At present, the development of new projects is not beingconsidered in Peru.
Source: Financial Statements FY14 and FY15
Enersis
Américas
Endesa
Américas
Chilectra
Américas
Generandes
Perú
Edegel
Chinango
Distrilima
Edelnor
59.98% 99.09%
39.00% 61.00%
54.20% 51.68%
69.84% 30.15%
29.39%
80.00%
Generalima
100.00%
Caboblanco
Veracruz
100.00%
20.00%
80.00%
E.E. Piura
60.00%36.50% 24.00%
Source: Management presentations
Installed Capacity (MW) 2014 2015
Edegel 1,652 1,686
E.E. Piura 297 297
Total 1,949 1,983
Generation of Electrical Energy (GWh)
Edegel 8,609 8,218
E.E. Piura 453 583
Total 9,062 8,801
Sales of Electrical Energy (GWh)
Edegel 9,320 8,633
E.E. Piura n.a. n.a.
Total 9,320 8,633
GlossaryAppendicesResults of the valuationExecutive summaryContents

PwC
July 27th, 2016
DC3 - Highly confidential information
Operational backgroundGeneration and distribution businesses
Distribution Business
Edelnor holds the concession for the supply of electricity to the publicin north Lima, in the provinces of Callao, Huaura, Huaral, Barrancaand Oyón. The concession covers a total area of 1,517 km2. It serves fiftytwo districts exclusively and shares the concessions for five additionaldistricts with the distribution company in south Lima. Edelnordistributes electricity to 1,336,610 customers.
58
Endesa Américas S.A.
6 Peru
Source: Financial statements FY14 and FY15
Operations information 2014 2015
Sales of Electrical Energy (GWh) 7,338 7,624
Total clients (k) 1,294 1,337
Annual rate of energy losses 7.95% 3.80%
GlossaryAppendicesResults of the valuationExecutive summaryContents

PwC
July 27th, 2016
DC3 - Highly confidential information
Company overview Edegel S.A.A.
59
Endesa Américas S.A.
6 Peru
General information
Ownership
Operational background
Operations are located in the surroundings of the city of Lima and consist of seven hydroelectric plants and two thermal plants with a total capacity of 1,652 MW. Thermal plants use natural gas as the principal fuel and diesel as an alternative fuel.
Financial Assumptions
21.14% 62.46% N/A
Enersis Endesa Chilectra
Description
Discount rate, nominal term, local currency 9.28%
Cash Flows Projection Period 2016 – 2020
End of concession N/A
Perpetual growth rate, g 2.40%
CAGR % (5 years) 6.16%
Exchange Rate PEN/USD 30-Jun-2016: 3.29
Generation Business
GlossaryAppendicesResults of the valuationExecutive summaryContents

PwC
July 27th, 2016
DC3 - Highly confidential information
Company overview Empresa Eléctrica de Piura S.A. (EEPSA)
60
Endesa Américas S.A.
6 Peru
General information
Ownership
Operational background
E.E. Piura has two plants that it operates for generating electricity. Bothplants are located in the province of Talara, Piura region in northernPeru. These are: (i) Central Malacas 2 consisting of an ABB open cycleunit that operates on natural gas with or without the injection of water,and (ii) Central Malacas 3 consisting of a Siemens open cycle unit in thecondition of a backup and that is fuelled by B5 Diesel.
Financial Assumptions
96.50% N/A N/A
Enersis Endesa Chilectra
Description
Discount rate, nominal term, local currency 9.28%
Cash Flows Projection Period 2016 – 2020
End of concession N/A
Perpetual growth rate, g 2.40%
CAGR % (cinco años) 4.78%
Generation Business
Exchange Rate PEN/USD 30-Jun-2016: 3.29
GlossaryAppendicesResults of the valuationExecutive summaryContents

PwC
July 27th, 2016
DC3 - Highly confidential information
Company overview Chinango S.A.C.
61
Endesa Américas S.A.
6 Peru
General information
Ownership
Operational background
The controlling company is Edegel S.A. (80%).
Financial Assumptions
16.91% 49.97% N/A
Enersis Endesa Chilectra
Description
Discount rate, nominal term, local currency 9.28%
Cash Flows Projection Period 2016 – 2020
End of concession N/A
Perpetual growth rate, g 2.40%
CAGR % (5 years) 1.20%
Generation Business
Exchange Rate PEN/USD 30-Jun-2016: 3.29
GlossaryAppendicesResults of the valuationExecutive summaryContents
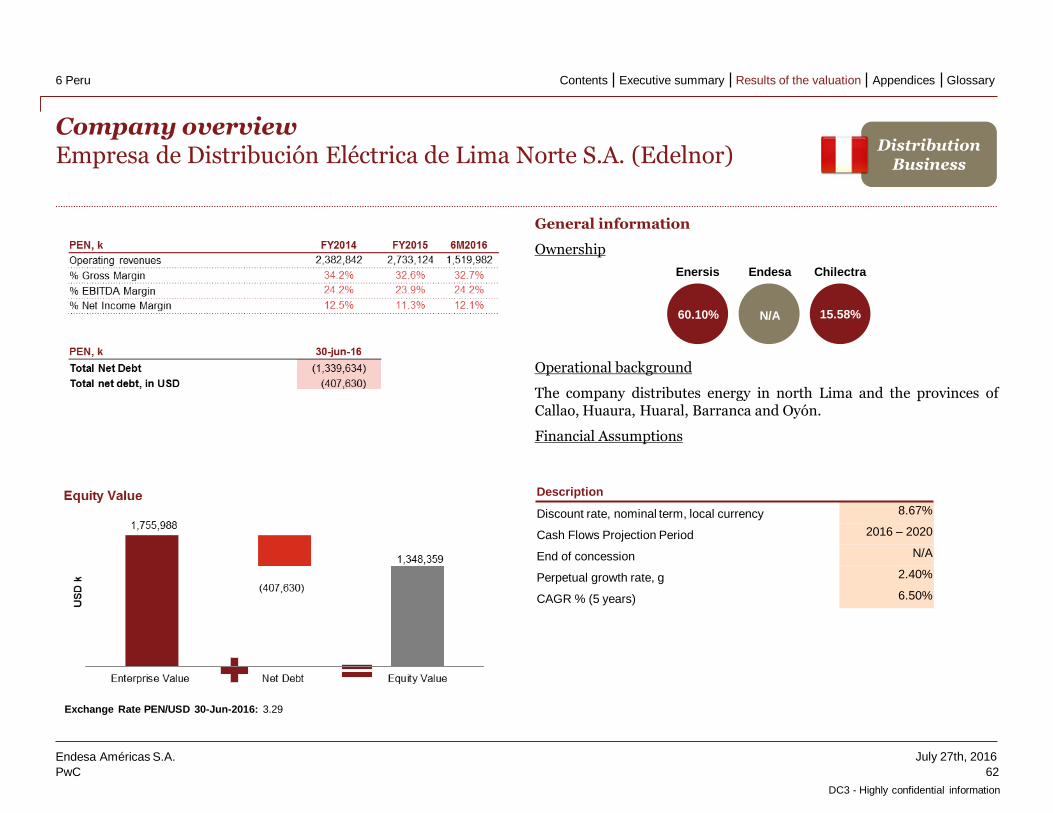
PwC
July 27th, 2016
DC3 - Highly confidential information
Company overview Empresa de Distribución Eléctrica de Lima Norte S.A. (Edelnor)
62
Endesa Américas S.A.
6 Peru
General information
Ownership
Operational background
The company distributes energy in north Lima and the provinces ofCallao, Huaura, Huaral, Barranca and Oyón.
Financial Assumptions
60.10% N/A 15.58%
Enersis Endesa Chilectra
Description
Discount rate, nominal term, local currency 8.67%
Cash Flows Projection Period 2016 – 2020
End of concession N/A
Perpetual growth rate, g 2.40%
CAGR % (5 years) 6.50%
Distribution Business
Exchange Rate PEN/USD 30-Jun-2016: 3.29
GlossaryAppendicesResults of the valuationExecutive summaryContents

PwC
July 27th, 2016
DC3 - Highly confidential information
Other companies in Peru
63
Endesa Américas S.A.
6 Peru
Based on information provided in the dataroom and Management comments, the following Peruvian-based companies are not currently operating and do not hold significant assets (in addition to investments in other Group companies that are already included in the valuation) or liabilities:
(a) Information requested to Management but not provided
(b) Financial Projections only include operating expenses
Company Sector Description Ownership (%)
Compañía Energética Veracruz S.A.C. (a)
Gx Development of an hydroelectric power plant of 730 MW.
Enersis (100.0%)
Inversiones Distrilima S.A. (b) Others The company has a controlling interest in EdelnorS.A.
Enersis (69.85%); Chilectra (30.15%);
Empresa Eléctrica Cabo Blanco S.A.C. (b)
Others The company has a controlling interest in Piura. Enersis (100.0%)
Generandes Perú S.A. (b) Others The company has a controlling interest in EdegelS.A.
Enersis (39.00%); Endesa (61.00%)
Generalima S.A.C. (b) Others Interest in EEC S.A., EEPSA y CEV S.A.C. Enersis (100.0%)
GlossaryAppendicesResults of the valuationExecutive summaryContents

PwC
July 27th, 2016
DC3 - Highly confidential information
Appendices
64
Endesa Américas S.A.
Appendices 64
1 Discount Rate 65
2 Market Multiples 66
3 Methodology 68
GlossaryAppendicesResults of the valuationExecutive summaryContents

PwC
July 27th, 2016
DC3 - Highly confidential information
Discount rate per country and line of businessAt June 30th, 2016
65
Endesa Américas S.A.
1 Discount Rate
Gx Dx Tx Gx Dx Tx Gx Dx Tx Gx Dx Tx
Risk-free rate (1) 2.45% 2.45% 2.45% 2.45% 2.45% 2.45% 2.45% 2.45% 2.45% 2.45% 2.45% 2.45%
Country Risk Premium (2) 9.09% 9.09% 9.09% 4.55% 4.55% 4.55% 2.91% 2.91% 2.91% 2.31% 2.31% 2.31%
Market Risk Premium (3) 6.25% 6.25% 6.25% 6.25% 6.25% 6.25% 6.25% 6.25% 6.25% 6.25% 6.25% 6.25%
Beta Unlevered (4) 0.72 0.64 0.64 0.72 0.64 0.64 0.72 0.64 0.64 0.72 0.64 0.64
Beta Levered 0.81 0.79 0.93 0.81 0.79 0.93 0.81 0.79 0.93 0.82 0.80 0.95
Cost of Equity (Ke) 16.61% 16.49% 17.33% 12.08% 11.96% 12.82% 10.44% 10.32% 11.18% 9.88% 9.79% 10.70%
G Spread (6) 2.00% 2.00% 2.00% 2.00% 2.00% 2.00% 2.00% 2.00% 2.00% 2.00% 2.00% 2.00%
Tax Rate 35.00% 35.00% 35.00% 34.00% 34.00% 34.00% 34.00% 34.00% 34.00% 29.70% 29.70% 29.70%
Cost of Debt (before tax) 13.54% 13.54% 13.54% 9.00% 9.00% 9.00% 7.36% 7.36% 7.36% 6.76% 6.76% 6.76%
Cost of debt (Kd) 8.80% 8.80% 8.80% 5.94% 5.94% 5.94% 4.86% 4.86% 4.86% 4.75% 4.75% 4.75%
Debt / Asset (5) 15.98% 26.32% 41.19% 15.98% 26.32% 41.19% 15.98% 26.32% 41.19% 15.98% 26.32% 41.19%
Equity / Asset 84.02% 73.68% 58.81% 84.02% 73.68% 58.81% 84.02% 73.68% 58.81% 84.02% 73.68% 58.81%
WACC Nominal (USD) 15.37% 14.47% 13.82% 11.10% 10.38% 9.99% 9.55% 8.88% 8.57% 9.06% 8.46% 8.25%
USD Inflation 2.20% 2.20% 2.20% 2.20% 2.20% 2.20% 2.20% 2.20% 2.20% 2.20% 2.20% 2.20%
Country Inflation 11.50% 11.50% 11.50% 4.60% 4.60% 4.60% 3.50% 3.50% 3.50% 2.40% 2.40% 2.40%
WACC Nominal (Local Currency) 25.86% 24.88% 24.17% 13.71% 12.97% 12.57% 10.94% 10.27% 9.96% 9.28% 8.67% 8.46%
(1) Federal Reserve T-Bond (average June 2016). Source: Federal reserve
(2) CDS Spread for one year, except Argentina (EMBI spread since January 2005). Source: Bloomberg
(3) Market premium USA at 30 June 2016. Source: Damodaran
(4) Comparable betas for companies in Argentina, Brazil, Colombia, Chile, Peru and USA versus the SPX Index. Regression period of 5 years, monthly frequency, at valuation date.
Source: Bloomberg.
(5) Ratio D/A of comparable companies. Source: Bloomberg.
(6) Spread betw een Treasury yield curve and long term corporate bonds, emitted by companies in the electric sector in the USA (G-Spread), at June 30 th, 2016.
Source: Bloomberg.
Argentina Brazil Colombia Peru
GlossaryAppendicesResults of the valuationExecutive summaryContents

PwC
July 27th, 2016
DC3 - Highly confidential information
Market multiples of comparablesAt June 30th, 2016
The following graphs show the EV / EBITDA multiples used in the valuation for each business and country. The sample includes comparablecompanies of the business for each country, respectively.
These graphs also illustrate the corresponding average for LATAM by line of business (includes companies from Argentina, Brazil, Colombia andPeru).
66
Endesa Américas S.A.
2 Market Multiples
3.65x
7.59x
9.13x 9.04x
7.60x
Argentina Brazil Colombia Peru
EV/EBITDA Generation Business
Latam average
3.90x
4.86x
6.41x
7.97x
7.13x
Argentina Brazil Colombia Peru
EV/EBITDA Distribution Business
Latam average
5.98x
7.60x
9.25x
10.03x
8.21x
Argentina Brazil Colombia Peru
EV/EBITDA Transmission Business
Latam average
GlossaryAppendicesResults of the valuationExecutive summaryContents

PwC
July 27th, 2016
DC3 - Highly confidential information
Economic Valuation (Market Multiples)Enersis Américas, Endesa Américas y Chilectra Américas
67
Endesa Américas S.A.
2 Market Multiples
The multiples shown on the previous page were considered when choosing a reasonable EV / EBITDA multiple as well as a variation of +/- 0.2x tocalculate the minimum and maximum ranges.
The multiple used corresponds to the estimated country and business line.
Company Min Max Min Max Min Max Min Max
Endesa Américas 3,489,743 3,705,218 2,093,180 2,222,424
Chilectra Américas 606,471 703,300 600,956 696,905
Emgesa S.A. Gx 9.13x 4,497,820 4,774,862 971,872 1,031,735 1,208,743 1,283,196 - -
Emgesa Panamá S.A. Gx 9.13x 0 0 0 0 0 0 - -
Codensa S.A. Dx 6.41x 2,159,539 2,339,151 834,445 903,847 - - 199,325 215,904
Chinango S.A.C. Gx 9.04x 308,576 323,916 52,183 54,777 154,185 161,850 - -
Edegel S.A. Gx 9.04x 2,016,144 2,114,426 426,186 446,962 1,259,250 1,320,635 - -
Empresa Electrica De Piura S.A. Gx 9.04x 260,039 273,753 250,937 264,172 - - - -
Edelnor S.A. Dx 7.97x 1,233,484 1,317,985 741,314 792,098 - - 192,236 205,405
Ampla Energia e Servicos S.A. Dx 4.86x 398,217 522,205 180,253 236,377 69,337 90,925 145,949 191,391
Coelce S.A. Dx 4.86x 842,264 942,614 380,449 425,777 184,129 206,067 55,877 62,534
C.G.T Fortaleza S.A. Gx 7.59x 333,488 351,594 169,874 179,097 123,845 130,569 37,583 39,623
Cachoeira Dourada S.A. Gx 7.59x 498,480 523,552 253,294 266,034 184,662 193,950 56,039 58,857
CIEN S.A. Tx 7.60x 246,303 260,463 125,463 132,676 91,468 96,726 27,758 29,353
Hidroeléctrica El Chocón S.A. Gx 3.65x 117,391 124,029 - - 38,366 40,536 - -
Endesa Costanera S.A. Gx 3.65x 59,821 72,296 0 0 22,635 27,355 - -
Central Dock Sud S.A. Gx 3.65x 73,142 79,589 14,718 16,016 - - - -
Edesur S.A. Dx 3.90x 293,007 342,813 55,049 64,407 733 857 49,878 58,357
Transportadora de Energía del Mercosur S.A. (Tesa) Tx 5.98x (19,140) (18,691) (4,875) (4,760) (3,554) (3,471) (1,078) (1,053)
Cía. de Transmisión del Mercosur S.A. (CTM) Tx 5.98x (18,717) (18,294) (4,767) (4,659) (3,475) (3,397) (1,055) (1,031)
Total Investments 7,140,532 7,723,882 3,330,323 3,545,798 762,511 859,341
(+) Other Assets 1,244,981 1,244,981 61,663 61,663 (136,081) (136,081)
(-) Holding costs (212,472) (212,472) 97,757 97,757 (19,960) (19,960)
Total Equity Value 8,173,041 8,756,391 3,489,743 3,705,218 606,471 703,300
Arg
en
tin
a
Equity Value Enersis Americas Endesa Americas Chilectra Americas
Bra
zil
Pe
ru
Co
lom
bia
EV/EBITDA
Multiple
Line of
Business
GlossaryAppendicesResults of the valuationExecutive summaryContents

PwC
July 27th, 2016
DC3 - Highly confidential information
Valuation concepts
The following describes the most commonly used valuationmethodologies:
Market Approach
• The Market approach indicates the value of the shares of theCompany based on a comparison of the Company to comparablecompanies in similar lines of business that are publicly traded orwhich are part of a public or private transaction.
Discounted cash flows (“DCF”) method
• The most accepted and widely used method for valuing companies in Chile is the Discounted Future Cash Flows method, as it represents the capacity that the assets have to generate funds over time.
• The value of a company is basically a function of two main factors: The first represented by the capacity of its assets to generate cash flows and the second, the discount rate corresponding to the opportunity cost rate of the capital, which is represented by the WACC (Weighted Average Cost of Capital).
• This method projects the future profits (earnings) of the company and therefore the return that the investment is able to generate.
• The market value is determined by the relationship between the projected returns and applying the corresponding risk rate.
• The discount of future cash flows or the present value of future flows of funds, corresponds to the stream of net income and expenses that take place during a given period of time, discounted to their present value at the respective discount rate, consistent with the specific industry. Net operating flows of funds are the only relevant flows when estimating the value of an investment or asset, since they are what finally provide the return to the investor.
68
Endesa Américas S.A.
3 Methodology GlossaryAppendicesResults of the valuationExecutive summaryContents
PwC
July 27th, 2016
DC3 - Highly confidential information
Valuation concepts (cont.)
Discount rate:
WACC – The returns required by both debt and equity investors, weighted by their respective contributions of capital. The conventional formula for deriving the WACC and the associated definitions is presented below:
WACC = Kd * (1-t) * (Percent Debt) + Ke * (Percent Equity)
where Percent Debt is Debt/capital as a percentage of total investedcapital, t is effective tax rate and Percent Equity is Equity/capital as apercentage of the total invested capital.
The cost of equity capital is estimated using the Capital Asset Pricing Model (CAPM), which assumes the cost of equity is equal to the return on risk-free securities plus the ERP adjusted for the company’s systematic risk (Beta). The general formula for the cost of equity is:
ke = rf + ß * ( E(rm) -rf ) +Pr
Where rf is the risk-free rate, ( E(rm) -rf ) is the Risk Premium and ß is the beta coefficient of the equity (associated risk factor) for a given industry or sector of the market, and SSP represents the Size Premium assigned by the market to smaller sized companies.
The market recognizes as risk-free (or zero-risk) investment, the document issued or guaranteed by the State, such as Central Bank bonds. The Risk Premium is a function of: 1) the expected market return less the risk-free rate and, 2) the beta coefficient which represents the correction factor to the risk premium required for a typical market asset, according to the larger or smaller variability that the returns of the investment have shown historically, as compared to the historical performance of market returns.
Market Multiples :
• In the case of the economic valuation, the average market multiplesValue / EBITDA were obtained using a sample of public companiesthat operate in the generation, transmission and distributionbusinesses. Valuations using market multiples were used tocorroborate the values obtained using the discounted cash flowmethodology.
69
Endesa Américas S.A.
3 Methodology GlossaryAppendicesResults of the valuationExecutive summaryContents

PwC
July 27th, 2016
DC3 - Highly confidential information
Other assumptions
70
Endesa Américas S.A.
3 Methodology
Assumptions Description
Operational revenue and costs The financial projections are generated from the operating model used in each of the operations inColombia, Peru, Brazil and Argentina. PwC Chile did not have access to these operating models and,consequently, did not review the source of these projections. However, Management did present anoverview of the models’ projected commodity prices and exchange rates, quantities and an analysis ofthe financial projections in comparison to the historical financial statements of each operation,together with the business strategy and an analysis of the impact of projected capex on each theseprojections.
Working capital Projected working capital in based on forecasted accounts receivables and payables for 2016.Thereafter the projections are based on maintaining DSO (days sales outstanding) and DPO (dayspayable outstanding) at a constant level going forward.
Income tax rate The income tax rates correspond to the tax rates applicable in each country.
Discount rate Discount rates refer to the weighted average cost of capital (WACC) calculated by PwC for eachbusiness sector and by country.
Capex – maintenance and re-investment
Management provided the capex projections for both maintenance and re-investment over the periodof the financial projections. The capex considered in the terminal year of the projections (that is usedto value the residual flows) were estimated by PwC based on a combination of the business plans,projected growth rates and the competitive landscape in each of the countries.
Growth considered in terminal value
Considers a combination of the long-term projected inflation and GDP’s of Colombia, Peru, Argentinay Brazil, adjusted for each of the business sectors operated in each of these countries (generation,transmission and distribution). Also, the competitive landscape in each country was analysed and thepotential impact of new technology.
GlossaryAppendicesResults of the valuationExecutive summaryContents

PwC
July 27th, 2016
DC3 - Highly confidential information
Other assumptions (cont.)
71
Endesa Américas S.A.
3 Methodology
Assumptions Description
Other considerations Cash, financial debt and equivalentsObtained from the individual financial statements of Enersis, Endesa and Chilectra at 30 June 2016, asprovided by Management.
Tax costs and benefits related to the Reorganization operationProvided by Management for Chile and the Americas.
Argentina operations50% of the value has been attributed to the resulting discounted cash flows related to the Argentinaoperations, due to the current political turmoil and monetary restrictions that restrict the possibility ofextract profits from that country.
Contingencies y lawsuitsBased on information provided in the dataroom, there are no known ongoing or potential lawsuits andcontingencies at 30 June 2016 that would require an incremental financial impact in excess of what isalready recorded in the Group’s financial statements and that could significantly affect ourconclusions.
GlossaryAppendicesResults of the valuationExecutive summaryContents

PwC
July 27th, 2016
DC3 - Highly confidential information
Glossary
Term Definition
ARS Argentinian Peso
BRL Brazilian Real
CAGR Compound annual growth rate
CAPM Capital Asset Pricing Model
CLP Chilean Peso
COP Colombian Peso
DCF Discounted cash flow
Dx Distribution
EBIT Earnings before interest and tax
EBITDA Earnings before interest, tax, depreciation and amortization
Eq. Equity
ERP Equity Risk Premium
72
Endesa Américas S.A.
GlossaryAppendicesResults of the valuationExecutive summaryContents

PwC
July 27th, 2016
DC3 - Highly confidential information
Glossary (cont.)
Term Definition
EV Enterprise value
FCF Free cash flows
FX Foreign Exchange
FY Financial year beginning 1st January and ending 31st December
g Perpetual growth rate
GDP Gross Domestic Product
GWh Gigawatt-Hour
Gx Generation
IFRS International Financial Reporting Standards
Kd Cost of debt
LoB Line of Business
Management The Management of Endesa
73
Endesa Américas S.A.
GlossaryAppendicesResults of the valuationExecutive summaryContents
PwC
July 27th, 2016
DC3 - Highly confidential information
Glossary (cont.)
Term Definition
MILA Mercado Integrado Latino Americano ( Integrated Latin American Market)
MW Megawatt
NOPAT Net operating profit after tax
NPAT Net profit after tax
NPV Net Present Value
P/E Price to earnings ratio
PEN Peruvian Nuevo Sol
PwC Chile PricewaterhouseCoopers Chile
Rf Risk-free rate
S.A. Sociedad anónima
Tx Transmission
USA United States of America
74
Endesa Américas S.A.
GlossaryAppendicesResults of the valuationExecutive summaryContents

PwC
July 27th, 2016
DC3 - Highly confidential information
Glossary (cont.)
Term Definition
Valuation Date June 30th, 2016
M Million
K Thousand
WACC Weighted average cost of capital
75
Endesa Américas S.A.
GlossaryAppendicesResults of the valuationExecutive summaryContents

DC3 - Highly confidential information
© 2015 PricewaterhouseCoopers Consultores, Auditores y Sociedad Limitada. Todos los derechos reservados. Su distribución no esta permitida sin el permiso de PricewaterhouseCoopers Consultores, Auditores y Sociedad Limitada. ‘PricewaterhouseCoopers’ se refiere a la red de firmas miembro de PricewaterhouseCoopers International Limited, cada firma miembro es una entidad legal separada e independiente.