energy and co2 emissions outlook world energy outlook - 2006 … · © oecd/iea - 2007...
TRANSCRIPT
© OECD/IEA - 2007
INTERNATIONAL ENERGY AGENCY
Energy and COEnergy and CO22 Emissions OutlookEmissions OutlookWorld Energy Outlook World Energy Outlook -- 20062006
Laura CozziEconomic Analysis Division
© OECD/IEA - 2007
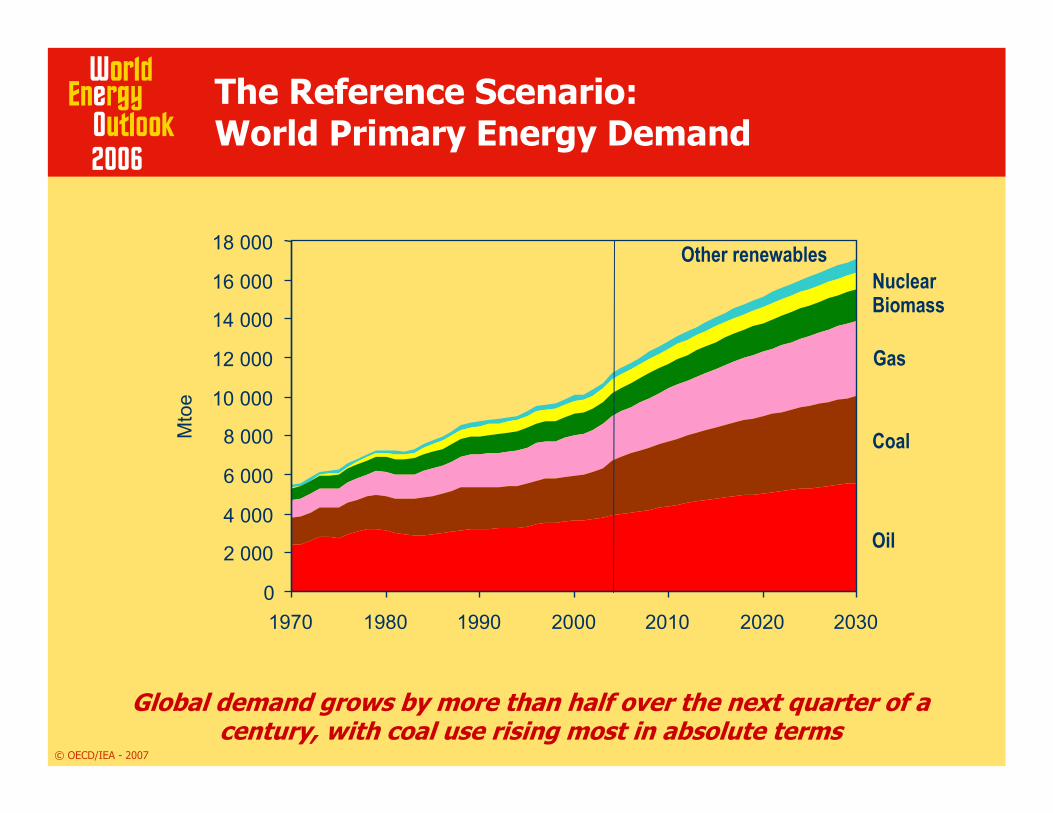
The Reference Scenario: World Primary Energy Demand
Global demand grows by more than half over the next quarter of acentury, with coal use rising most in absolute terms
Oil
Coal
Gas
BiomassNuclear
Other renewables
0
2 000
4 000
6 000
8 000
10 000
12 000
14 000
16 000
18 000
1970 1980 1990 2000 2010 2020 2030
Mto
e
© OECD/IEA - 2007
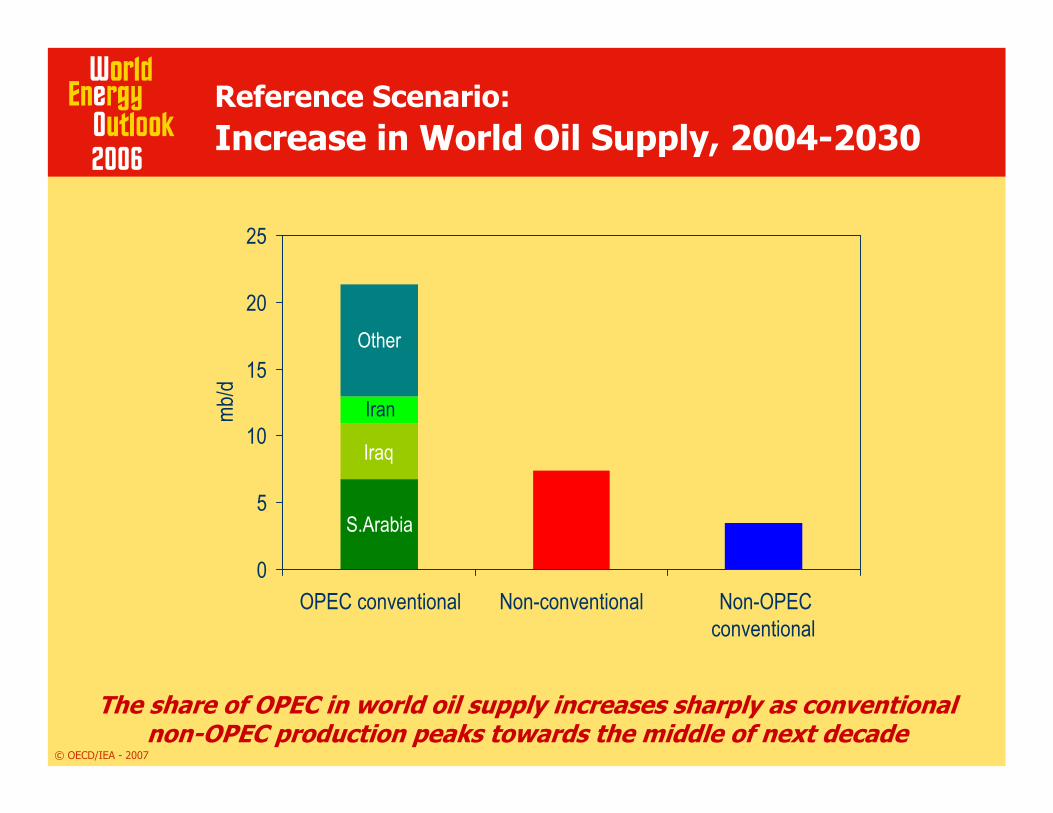
Reference Scenario:Increase in World Oil Supply, 2004-2030
The share of OPEC in world oil supply increases sharply as conventional non-OPEC production peaks towards the middle of next decade
S.Arabia
Iraq
Iran
Other
0
5
10
15
20
25
OPEC conventional Non-conventional Non-OPECconventional
mb/d
© OECD/IEA - 2007
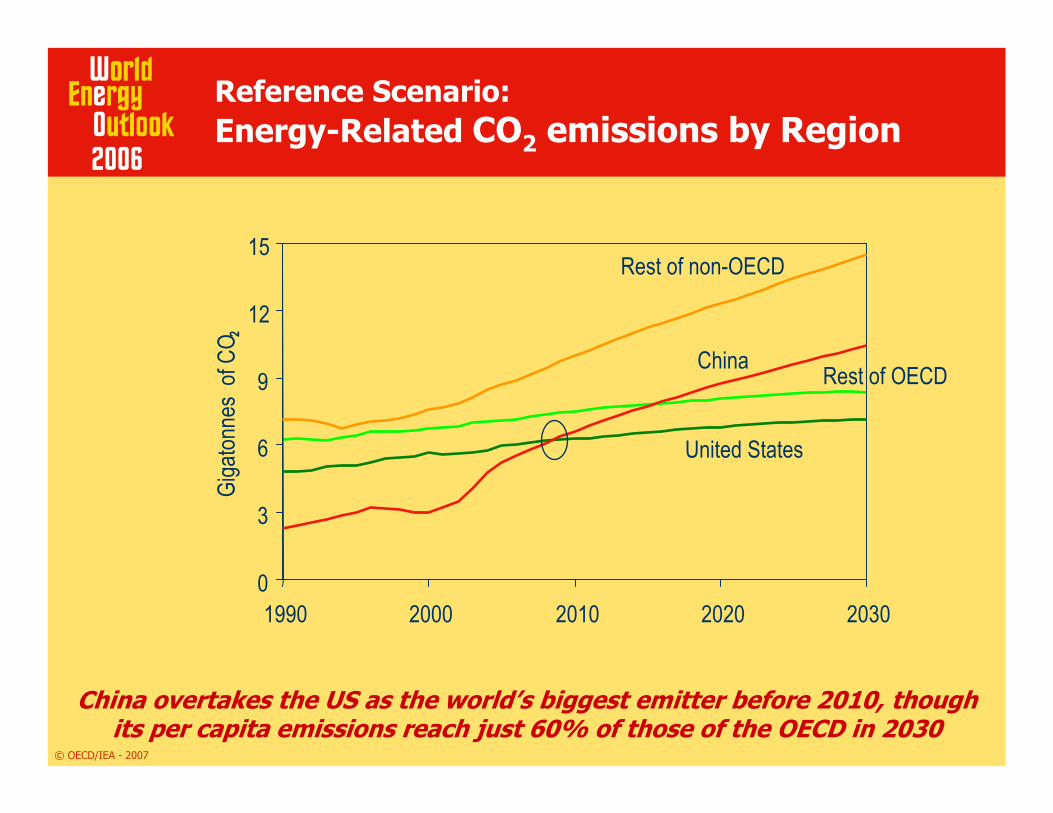
Reference Scenario:Energy-Related CO2 emissions by Region
China overtakes the US as the world’s biggest emitter before 2010, though its per capita emissions reach just 60% of those of the OECD in 2030
0
3
6
9
12
15
1990 2000 2010 2020 2030
Giga
tonne
sof
CO2
United States
China
Rest of non-OECD
Rest of OECD
© OECD/IEA - 2007
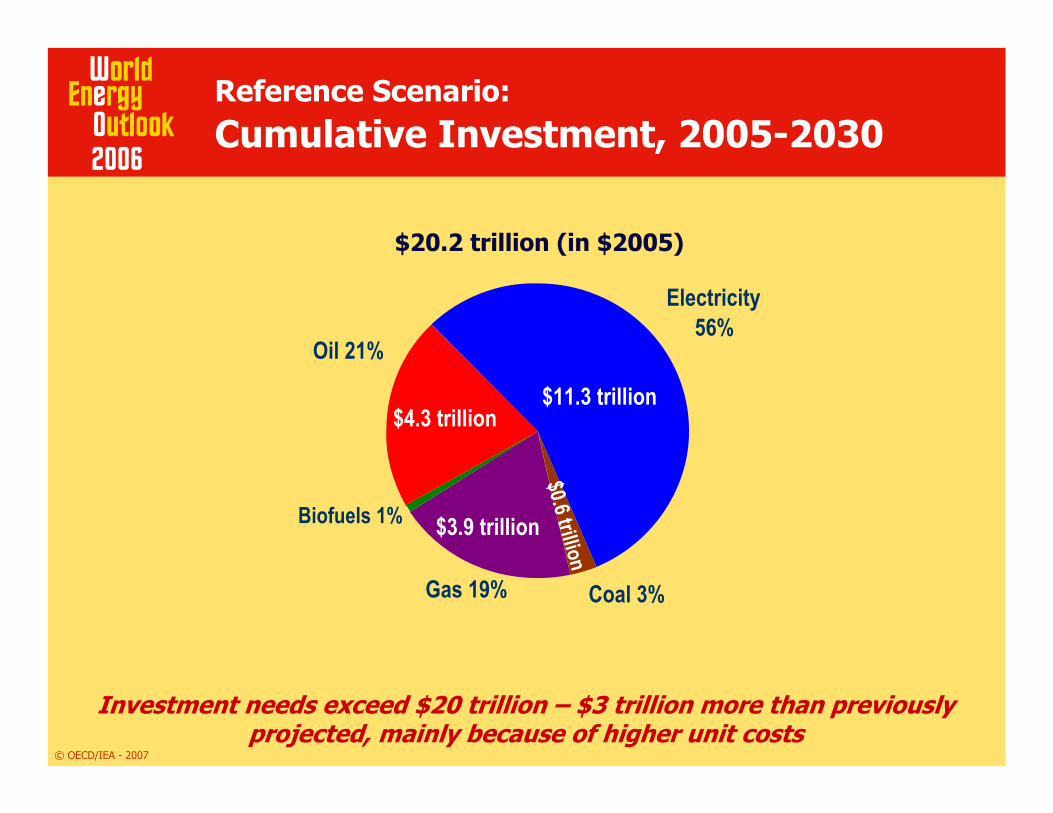
Oil 21%
Electricity56%
Coal 3%Gas 19%
Reference Scenario:Cumulative Investment, 2005-2030
Investment needs exceed $20 trillion – $3 trillion more than previously projected, mainly because of higher unit costs
$20.2 trillion (in $2005)
$4.3 trillion$11.3 trillion
$3.9 trillion$0.6 trillion
Biofuels 1%
© OECD/IEA - 2007
The Next Ten Years Will Determine Our Energy Future
Investment over the next decade will lock in technology for up to 60 years
China and India - growing at breakneck speed fueled by energy
OECD power plants – significant portion reaching to retirement
Security of supply is under threat because the balance of power is shifting
Oil production in non-OPEC countries is set to peak,
Gas production to peak in OECD
© OECD/IEA - 2007
INTERNATIONAL ENERGY AGENCY
Alternative Policy Scenario Alternative Policy Scenario
© OECD/IEA - 2007
Alternative Policy Scenario: Mapping a Better Energy Future
Analyses impact of government policies under consideration to enhance security & curb emissionsDemonstrates that we can significantly reduce growth in energy demand & emissions and stimulate alternative energy production
Oil demand is reduced by 13 mb/d in 2030 - equivalent to current output of Saudi Arabia & IranOil savings in 2015 savings reach 5 mb/d CO2 emissions are 6.3 Gt (16%) lower in 2030 –equivalent to the current emissions of US and Canada
Delaying action by 10 years would reduce the impact on emissions in 2030 by three-quarters
© OECD/IEA - 2007
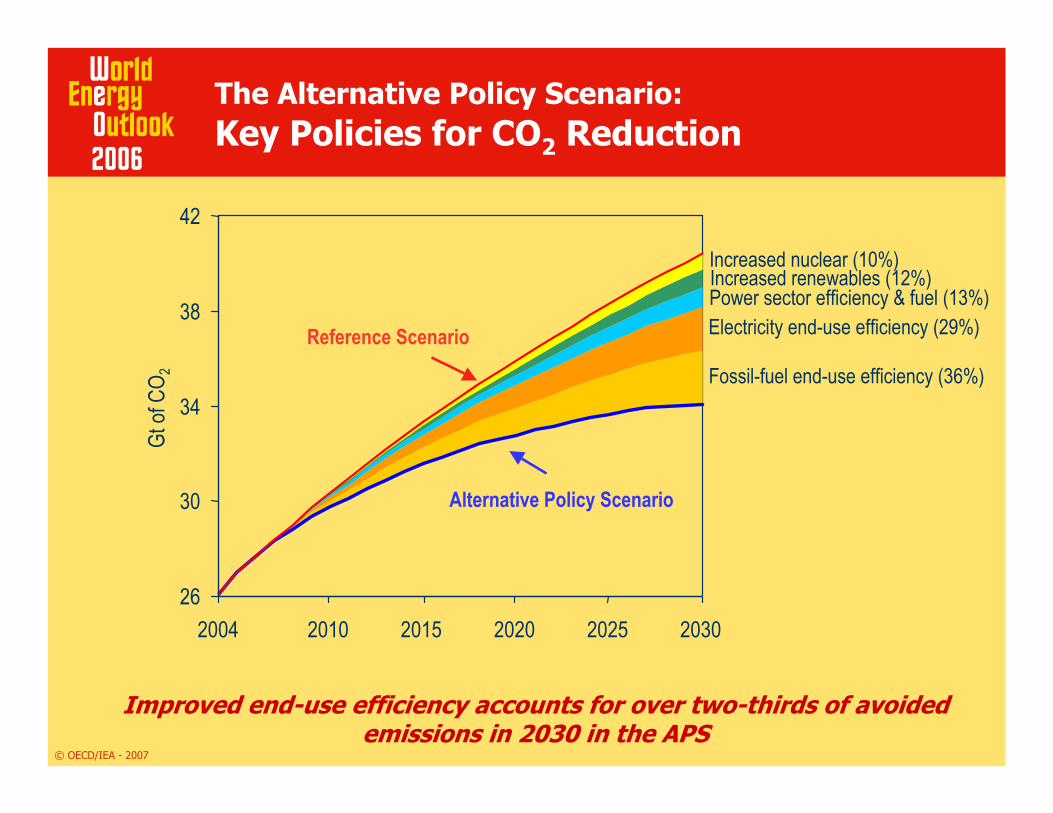
Improved end-use efficiency accounts for over two-thirds of avoided emissions in 2030 in the APS
Alternative Policy Scenario
Reference Scenario
Increased nuclear (10%)Increased renewables (12%)Power sector efficiency & fuel (13%) Electricity end-use efficiency (29%)
Fossil-fuel end-use efficiency (36%)
26
30
34
38
42
2004 2010 2015 2020 2025 2030
Gtof
CO2
The Alternative Policy Scenario:Key Policies for CO2 Reduction
© OECD/IEA - 2007
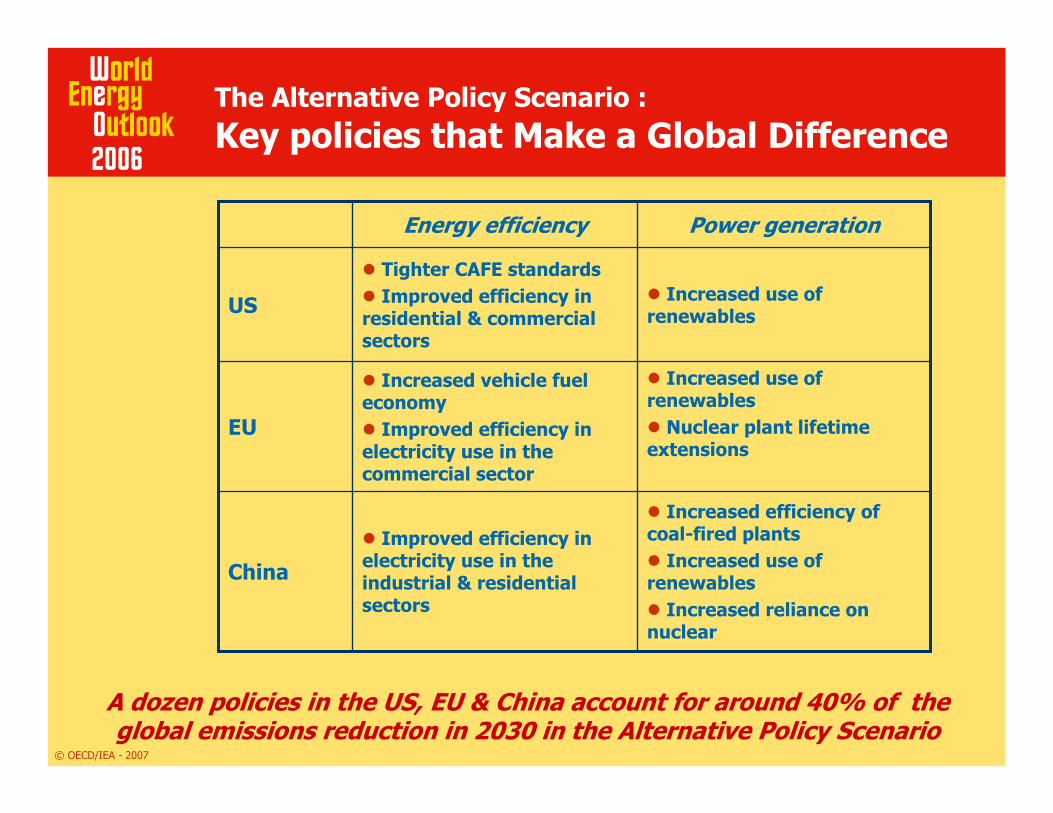
The Alternative Policy Scenario :Key policies that Make a Global Difference
A dozen policies in the US, EU & China account for around 40% of the global emissions reduction in 2030 in the Alternative Policy Scenario
Increased efficiency of coal-fired plants
Increased use of renewables
Increased reliance on nuclear
Improved efficiency in electricity use in the industrial & residential sectors
China
Increased use of renewables
Nuclear plant lifetime extensions
Increased vehicle fuel economy
Improved efficiency in electricity use in the commercial sector
EU
Increased use of renewables
Tighter CAFE standardsImproved efficiency in
residential & commercial sectors
US
Power generationEnergy efficiency
© OECD/IEA - 2007
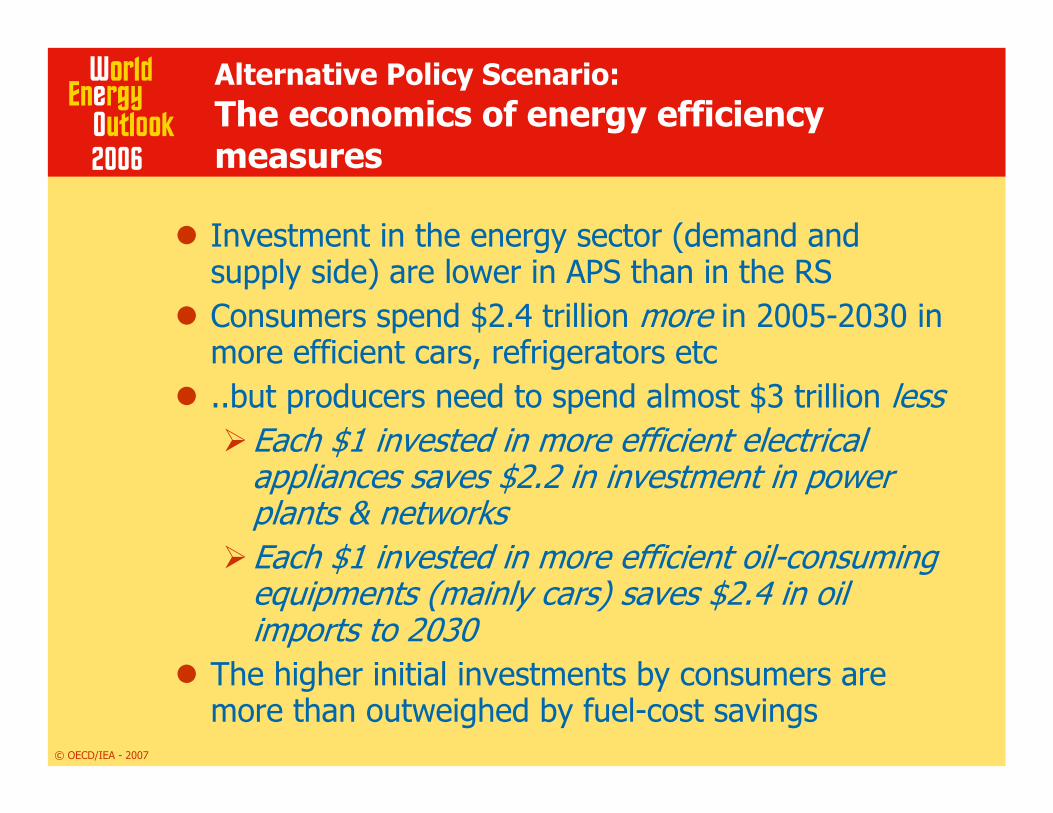
Alternative Policy Scenario:The economics of energy efficiency measures
Investment in the energy sector (demand and supply side) are lower in APS than in the RSConsumers spend $2.4 trillion more in 2005-2030 in more efficient cars, refrigerators etc..but producers need to spend almost $3 trillion less
Each $1 invested in more efficient electrical appliances saves $2.2 in investment in power plants & networksEach $1 invested in more efficient oil-consuming equipments (mainly cars) saves $2.4 in oil imports to 2030
The higher initial investments by consumers are more than outweighed by fuel-cost savings
© OECD/IEA - 2007
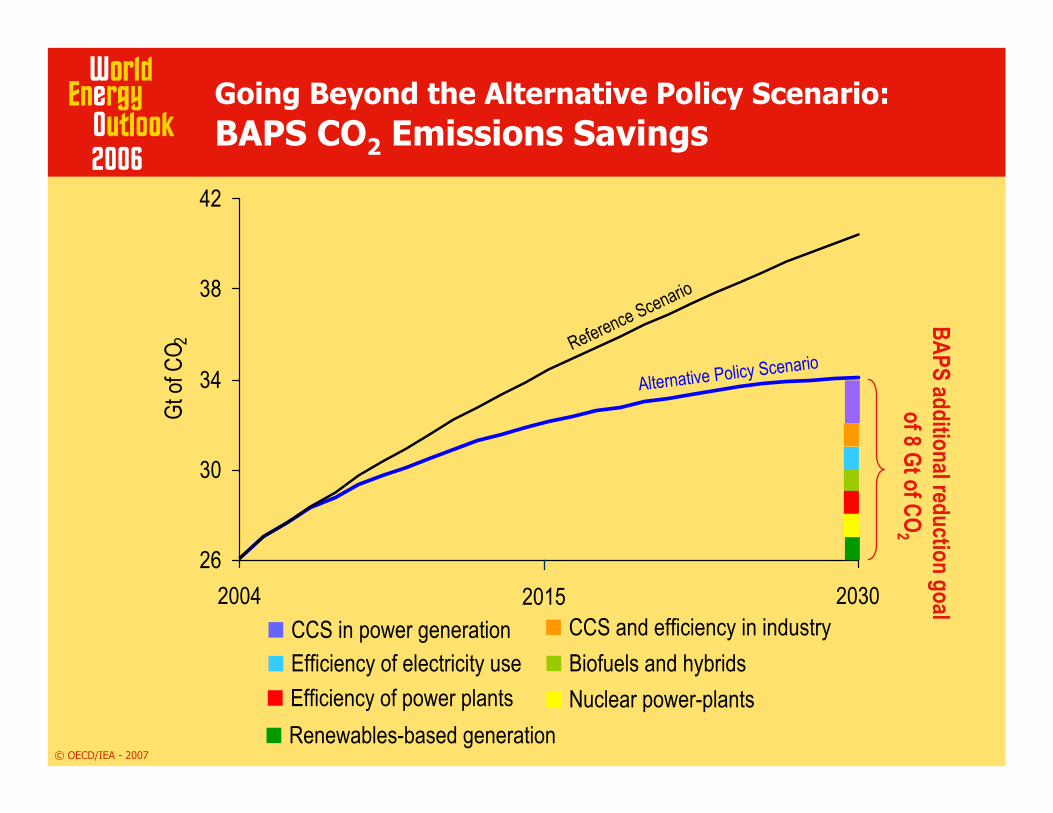
Reference Scenario
26
30
34
38
42
2004 2030
Gtof
CO2
Alternative Policy Scenario
Efficiency of electricity use CCS and efficiency in industry Biofuels and hybrids
Efficiency of power plants Nuclear power-plants Renewables-based generation
CCS in power generation 2015
Going Beyond the Alternative Policy Scenario:BAPS CO2 Emissions Savings
BAPS additional reduction goalof 8 Gtof CO
2
© OECD/IEA - 2007
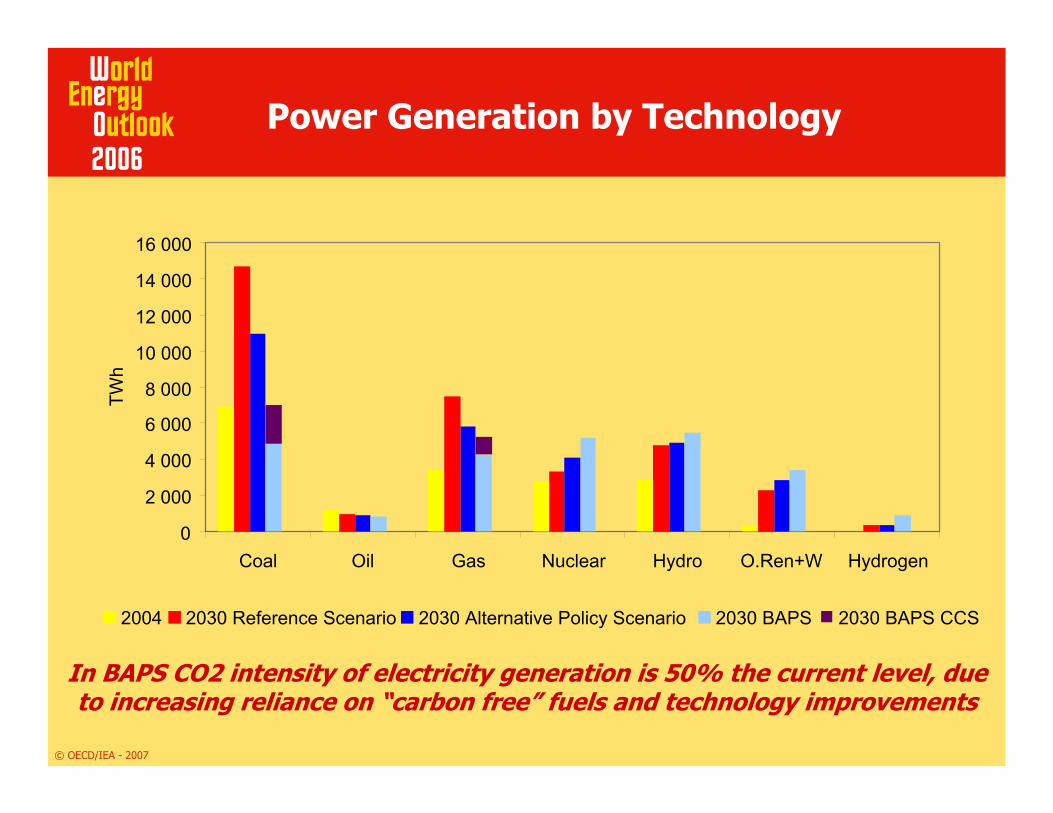
Power Generation by Technology
In BAPS CO2 intensity of electricity generation is 50% the current level, due to increasing reliance on “carbon free” fuels and technology improvements
0
2 000
4 000
6 000
8 000
10 000
12 000
14 000
16 000
Coal Oil Gas Nuclear Hydro O.Ren+W Hydrogen
TWh
2004 2030 Reference Scenario 2030 Alternative Policy Scenario 2030 BAPS 2030 BAPS CCS
© OECD/IEA - 2007
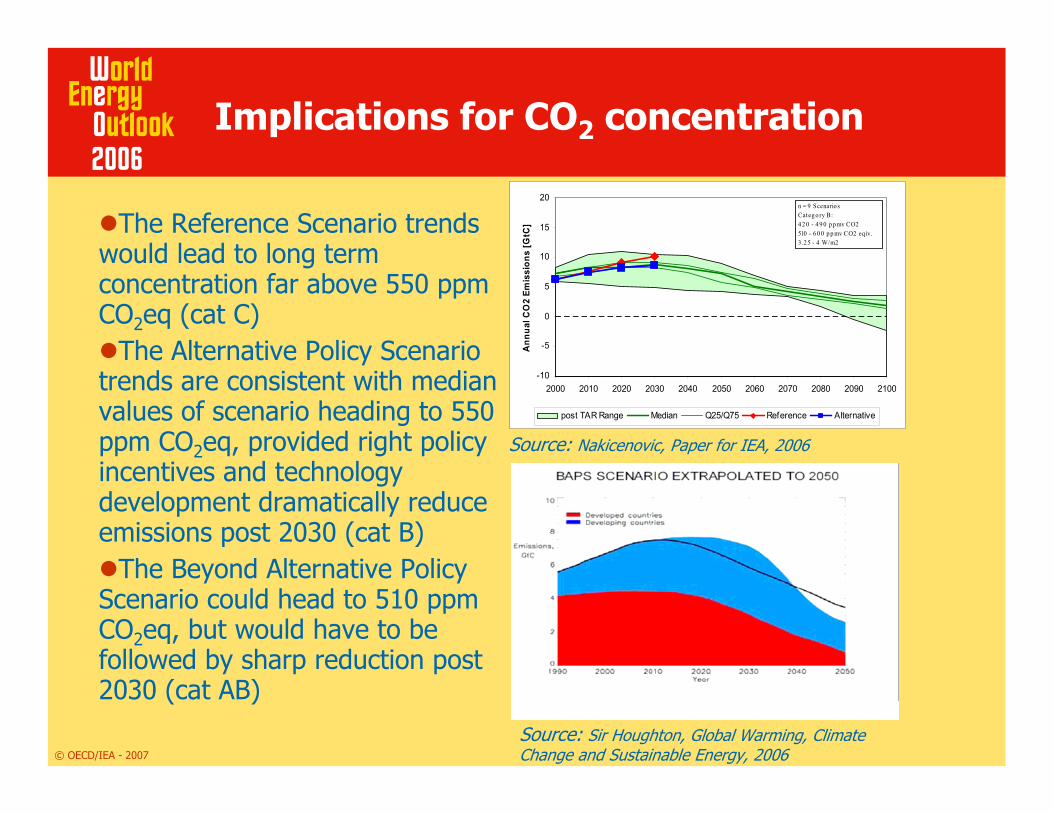
Implications for CO2 concentration
The Reference Scenario trends would lead to long term concentration far above 550 ppmCO2eq (cat C)
The Alternative Policy Scenario trends are consistent with median values of scenario heading to 550 ppm CO2eq, provided right policy incentives and technologydevelopment dramatically reduce emissions post 2030 (cat B)
The Beyond Alternative Policy Scenario could head to 510 ppmCO2eq, but would have to be followed by sharp reduction post 2030 (cat AB)
-10
-5
0
5
10
15
20
2000 2010 2020 2030 2040 2050 2060 2070 2080 2090 2100
Ann
ual C
O2
Emis
sion
s [G
tC]
post TAR Range Median Q25/Q75 Reference Alternative
n = 9 ScenariosCategory B:42 0 - 49 0 ppmv CO2510 - 6 00 pp mv CO2 eq iv.3 .25 - 4 W/m2
Source: Nakicenovic, Paper for IEA, 2006
Source: Sir Houghton, Global Warming, Climate Change and Sustainable Energy, 2006
© OECD/IEA - 2007
Summing Up
The Reference Scenario projects a vulnerable, dirty and expensive global energy systemThe Alternative Policy Scenario maps out a cleaner, cleverer and more competitive energy future based on new policies –mainly on energy efficiency, renewables and nuclear Strong political will and urgent government action is needed to change existing investment patterns and move Beyond the Alternative Policy Scenario
© OECD/IEA - 2007
Next steps – WEO 2007 & WEO 2008
WEO-2007 China and India insights In addition to RS and APS, high growth scenario is also exploredImplications for energy markets and global emissionsCo-operation with TERI, ERI and indian/chineseauthoritiesRelease: 7 November 2007
WEO-2008in-depth analysis of climate change scenarios –understanding energy implications of different post kyotointernational architecturesin-depth field by field analysis of top 200 oil producing fields