energy from waste-india
TRANSCRIPT
Municipal Solid Waste Management in India
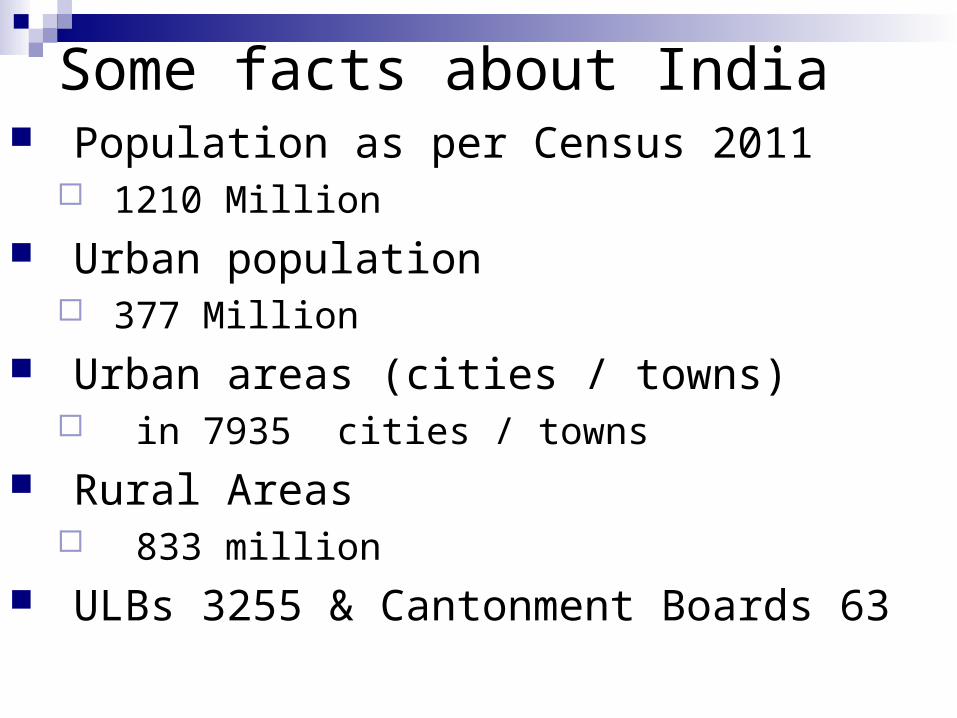
Some facts about India Population as per Census 2011
1210 Million Urban population
377 Million Urban areas (cities / towns)
in 7935 cities / towns Rural Areas
833 million ULBs 3255 & Cantonment Boards 63
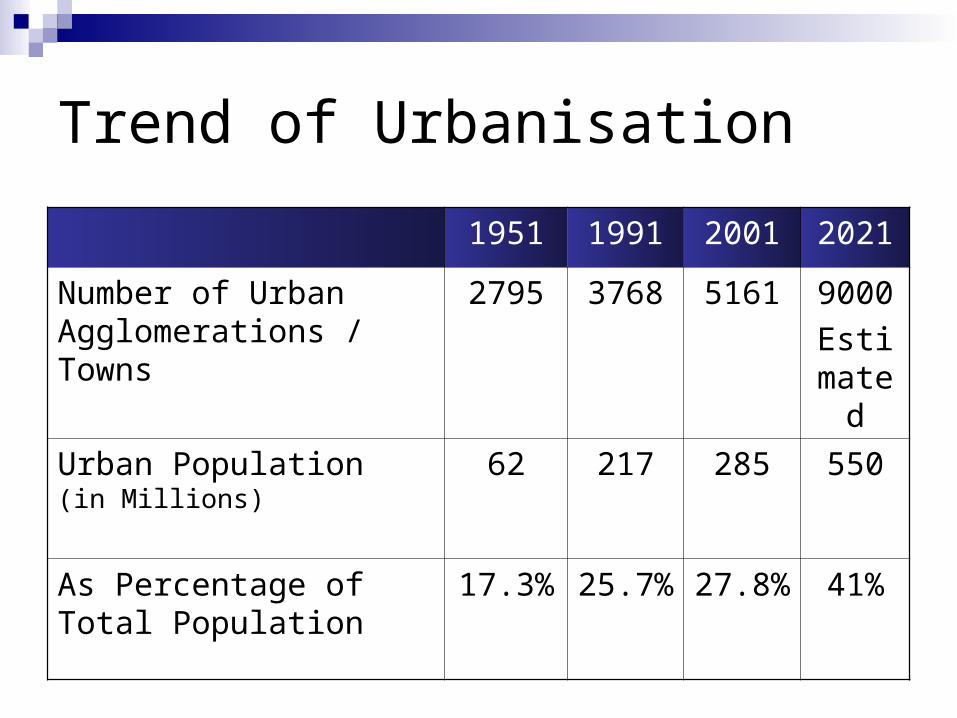
Trend of Urbanisation
1951 1991 2001 2021
Number of Urban Agglomerations / Towns
2795 3768 5161 9000
Estimated
Urban Population (in Millions)
62 217 285 550
As Percentage of Total Population
17.3% 25.7% 27.8% 41%
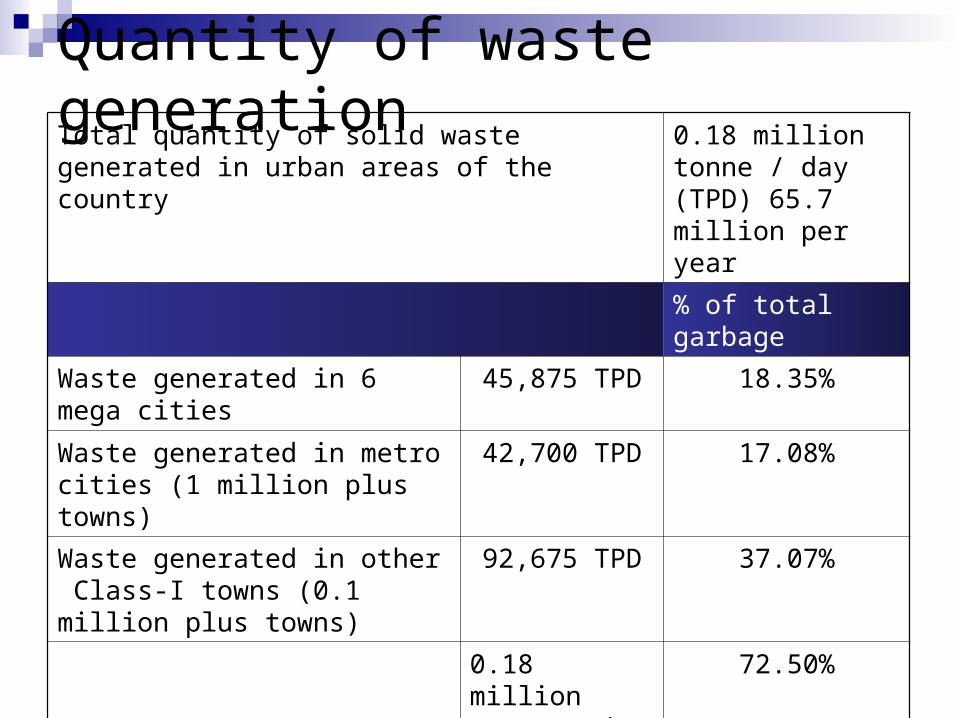
Quantity of waste generationTotal quantity of solid waste generated in urban areas of the country
0.18 million tonne / day (TPD) 65.7 million per year
% of total garbage
Waste generated in 6 mega cities
45,875 TPD 18.35%
Waste generated in metro cities (1 million plus towns)
42,700 TPD 17.08%
Waste generated in other Class-I towns (0.1 million plus towns)
92,675 TPD 37.07%
0.18 million tonne / day (TPD)
72.50%
If waste produced in all Class-I cities is tackled, percentage of waste scientifically managed would be 72.5% of the total waste
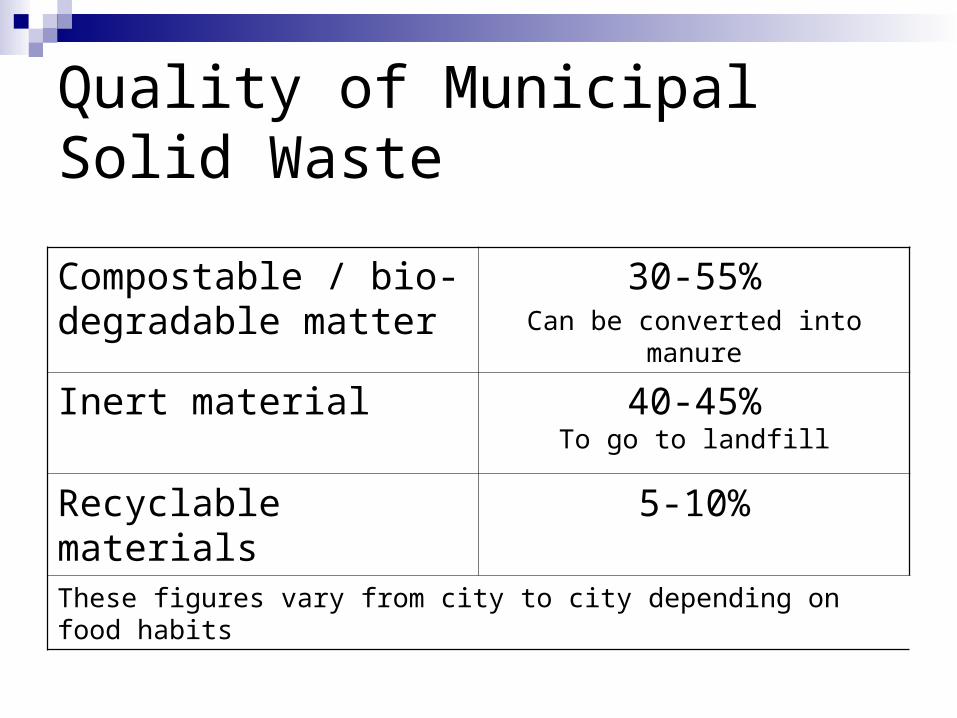
Quality of Municipal Solid Waste
Compostable / bio-degradable matter
30-55%Can be converted into manure
Inert material 40-45%To go to landfill
Recyclable materials 5-10%
These figures vary from city to city depending on food habits
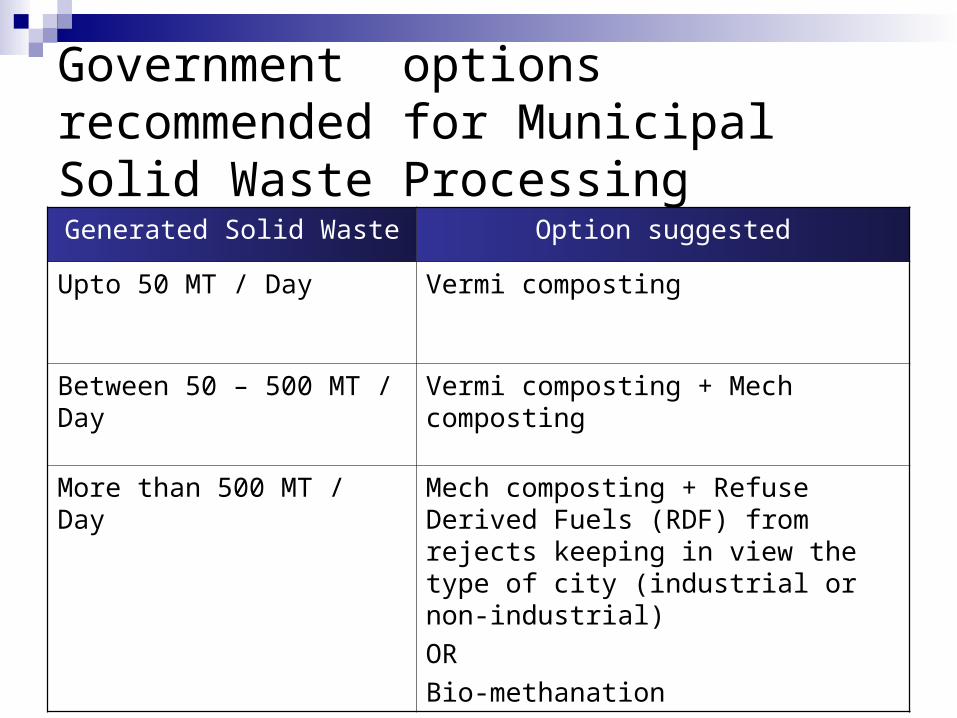
Government options recommended for Municipal Solid Waste Processing
Generated Solid Waste Option suggested
Upto 50 MT / Day Vermi composting
Between 50 – 500 MT / Day Vermi composting + Mech composting
More than 500 MT / Day Mech composting + Refuse Derived Fuels (RDF) from rejects keeping in view the type of city (industrial or non-industrial)
OR
Bio-methanation
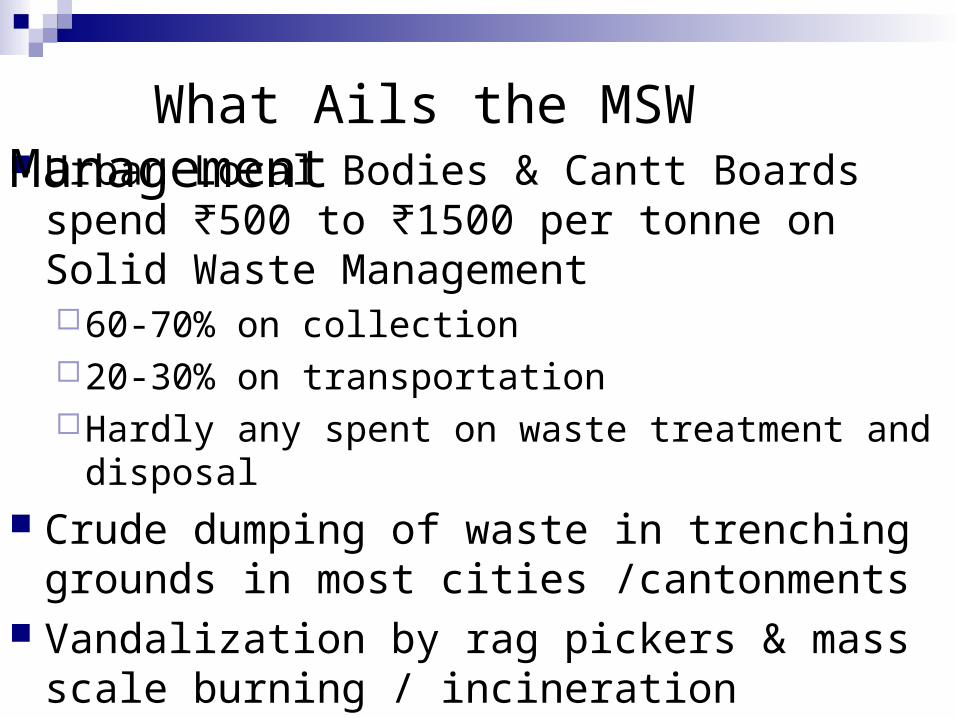
Urban Local Bodies & Cantt Boards spend 500 to 1500 per tonne on Solid Waste ₹ ₹
Management60-70% on collection20-30% on transportationHardly any spent on waste treatment and disposal
Crude dumping of waste in trenching grounds in most cities /cantonments
Vandalization by rag pickers & mass scale burning / incineration
What Ails the MSW Management
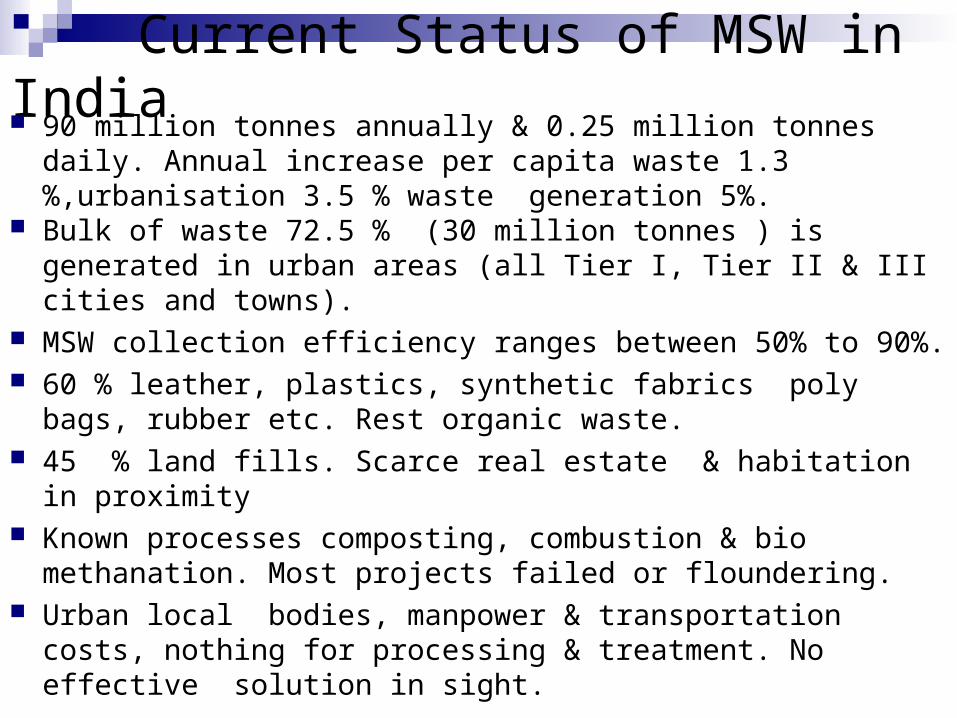
Current Status of MSW in India 90 million tonnes annually & 0.25 million tonnes daily. Annual
increase per capita waste 1.3 %,urbanisation 3.5 % waste generation 5%.
Bulk of waste 72.5 % (30 million tonnes ) is generated in urban areas (all Tier I, Tier II & III cities and towns).
MSW collection efficiency ranges between 50% to 90%. 60 % leather, plastics, synthetic fabrics poly bags, rubber etc.
Rest organic waste. 45 % land fills. Scarce real estate & habitation in proximity Known processes composting, combustion & bio methanation.
Most projects failed or floundering. Urban local bodies, manpower & transportation costs, nothing
for processing & treatment. No effective solution in sight.
WEAKNESSES OF POWER SECTOR TECHNOLOGY WEAK - INEFFICIENT COAL /GAS
FIRED PLANTS FREEBEES - FARM,GOVT SECTORS. FUEL SHORTAGES. POOR CONNECTIVITY POOR DELIVERY & RECOVERY SYSTEM ECO,ENVIRONMENTAL & SOCIAL
CONTROVERSIES PILs INDO US NUC AGREEMENT. TRANSMISSION LOSSES GOVT OWNED POWER COYS & FUNDING CRIPPLED GRID JULY 12
IDENTIFICATION OF PROBLEMS
ACUTE ENERGY SHORTAGE- WORLD’S FIFTH LARGEST INSTALLED CAPACITY,FOURTH LARGEST CONSUMER & STILL DEFICIENT 25%
WASTE DISPOSAL – 90 MILLION TONNES PER YEAR WITH COLLECTION EFFICIENCY RANGING FROM 50% UPWARDS
UNMISTAKABLE LINK BETWEEN THE TWO EXISTS - YET UNTAPPED RESOURCE IN INDIA OPENS WINDOW OF OPPORTUNITY
Criteria for any WTE System
Technology / systems should beTechnically soundFinancially viableEnvironmentally friendlyEasy to operate and maintain by local
communitySustainable in long termConform to MSW Rules 2000

Eight USPs for Memios NO investment. Smart grid power. NO landfills, burning & segregation. Real estate. 3-4 acres / 100 TPD plant. Clean garbage disposal - NO emissions, GHG
& atmospheric pollutants Carbon credits Government incentives / subsidy / tax benefits. Trouble free services
Our Initial Targets Ability to secure and efficiently run two sites within six
to eight months of award. Update knowledge & skills, familiarize ourselves with
Memios plants operations & maintenance. Become conversant with Central /State Govt
sanctions, approvals and permissions. Prepare drafts Detailed Project Reports &
Environment Impact Assessments. Financial perspective for next six months & a detailed
budget for first two sites for next one year. Work out profitability on all prospective sites, ie, Cantt
Boards & ULBs and draw priorities
Recommended Marketing Strategy Target ULBs & Cantt Boards on top priority.
Revival of failed WTE plants and suggest alternatives.
Maintain balanced political posture. No controversies
Get recyclables and rag picking industry on our side.
Initiate mass awareness camapaign through NGOs appeal to affected residents on pitfalls of sanitary landfills.
Acquire cheap land for WTE plants where available.
Recommended Marketing Strategy Contd)
Why NO GO to both bio degradable & non biodegradable waste. Waste to compost.
Aerobic / anaerobic composting – is it worth it ? Vermi composting - methane generation GHG (?)
Waste processing non bio degradable . Refuse Derived Fuel / pelletization - financially viable (?) Bio-methanation - large scale use of methane GHG
Showcase own Technology Demonstrators. Take government / semi government experienced decision
makers as advisors.
Action Plan
Oct 2012 Establish Memios India Office in New Delhi Select Site Office Mhow & Jhajjar Fully enlarge operations in North in J&K & South in
Karnataka States. Commence operations in first two sites with minimum
staffing. Work out profitability in both sites. Contact with Cantonment Boards & ULBs
& submit tenders based on priorities worked out.
Action Plan (contd) Nov 2012
Public Awareness Campaign cum Public Consultation in two sites.
Establish new Project offices at Mhow & Jhajjar. Complete perimeter fencing / boundary walls. Carry out detailed recce of area to measure volumes of
waste generation at sites. Work out alternate sources to optimize plant capacity.
Work out profitability and initiate / submit DPRs & EIA Obtain restrictions on plastic removal and fire Work out detailed collection, transportation , temporary
storage and civil construction plan

Thank You
SIX SIGMA PHILOSOPHY
“If you don’t measure it, you can’t know it. If you don’t know it, you can’t control it. If you can’t control it, you are at the mercy of chance!.”
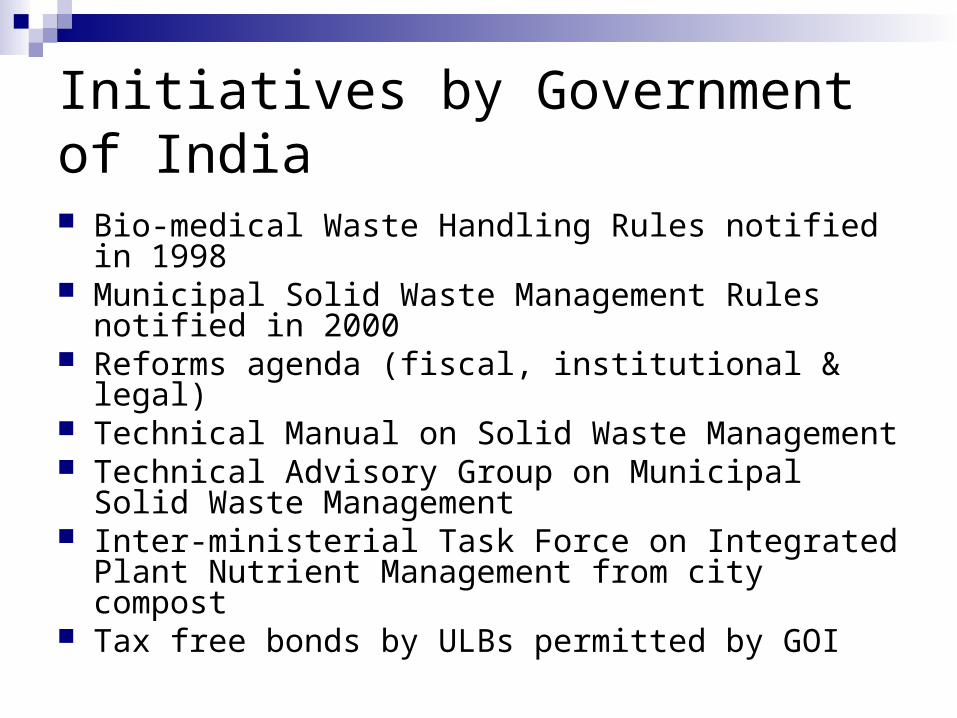
Initiatives by Government of India
Bio-medical Waste Handling Rules notified in 1998 Municipal Solid Waste Management Rules notified in
2000 Reforms agenda (fiscal, institutional & legal) Technical Manual on Solid Waste Management Technical Advisory Group on Municipal Solid Waste
Management Inter-ministerial Task Force on Integrated Plant Nutrient
Management from city compost Tax free bonds by ULBs permitted by GOI
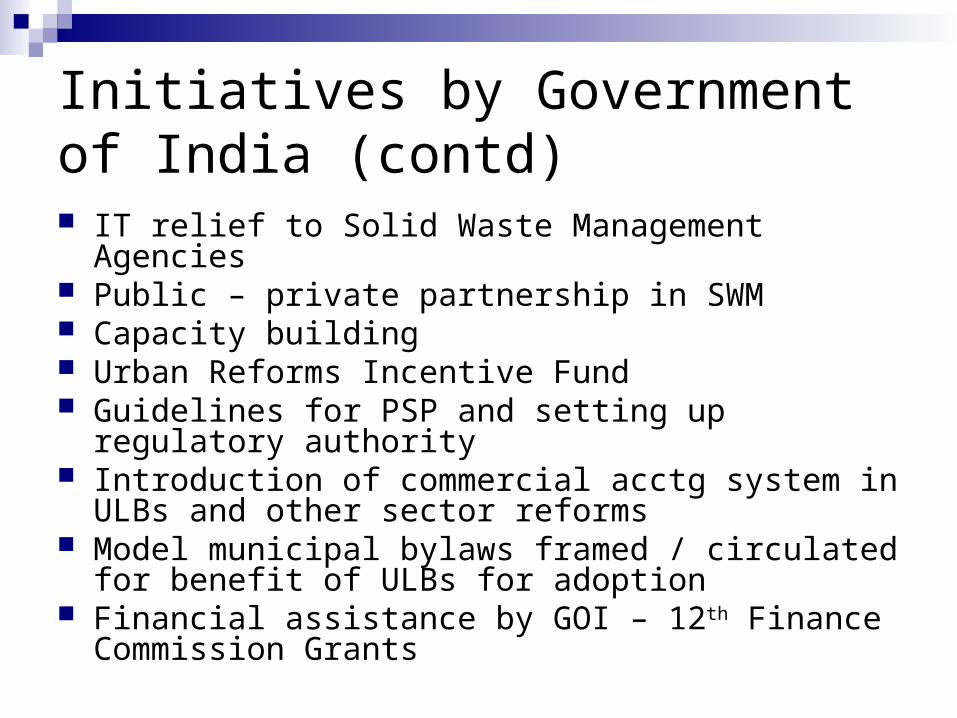
Initiatives by Government of India (contd) IT relief to Solid Waste Management Agencies Public – private partnership in SWM Capacity building Urban Reforms Incentive Fund Guidelines for PSP and setting up regulatory authority Introduction of commercial acctg system in ULBs and
other sector reforms Model municipal bylaws framed / circulated for benefit of
ULBs for adoption Financial assistance by GOI – 12th Finance Commission
Grants
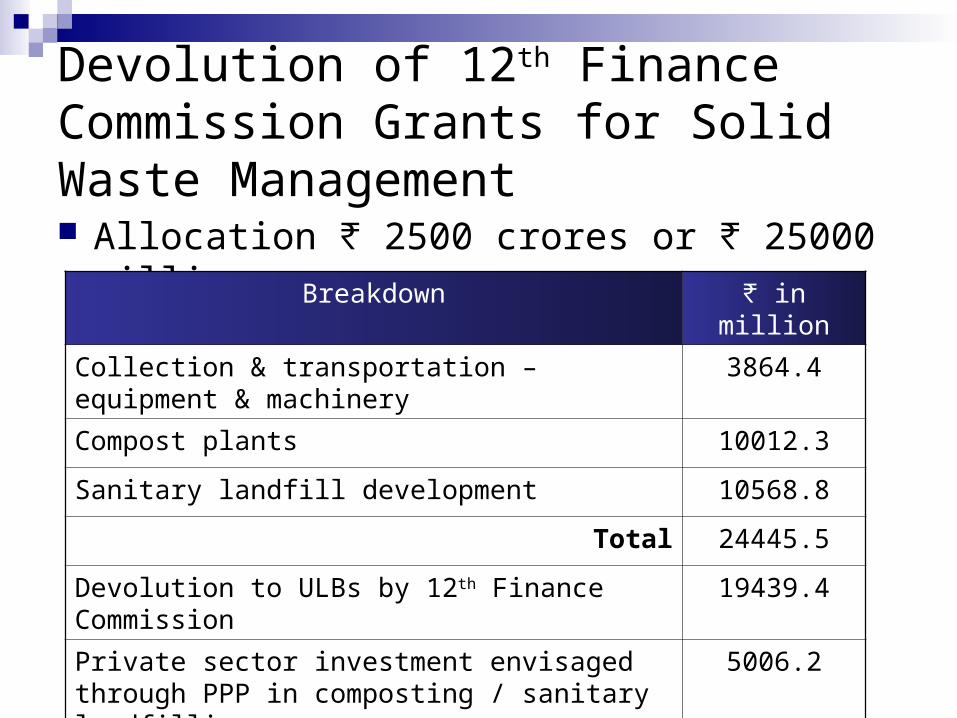
Devolution of 12th Finance Commission Grants for Solid Waste Management
Allocation 2500 crores or 25000 million₹ ₹ Breakdown ₹ in million
Collection & transportation – equipment & machinery
3864.4
Compost plants 10012.3
Sanitary landfill development 10568.8
Total 24445.5
Devolution to ULBs by 12th Finance Commission 19439.4
Private sector investment envisaged through PPP in composting / sanitary landfilling
5006.2

National Urban Renewal Mission
Central / state grants are proposed to be provided for Solid Waste Management
Grant Loan
Centre State
Cities with 4 million plus population
35% 15% 50%
Cities with 1 million plus population but less than 4 million
50% 20% 30%
Other cities 80% 10% 10%
Present state of Waste Management Storage of waste at source is lacking
Domestic / trade waste & construction debris thrown on streets
Bio-medical waste disposed in municipal waste stream
Industrial waste is disposed of in open areas
No segregation of recyclable waste at source Primary collection of waste is not done at place
of generation
Present state of Waste Management (contd) Design & location of municipal waste storage
depots inappropriate resulting in littering Street sweeping not done everyday Waste transportation in open vehicles Waste processing partially practiced in ULBs
only Final disposal done through crude dumping Rag pickers collect recyclables from municipal
bins & litter waste causing unsanitary conditions
Reasons for improper Waste Management Lack of planning for waste management
when planning new townships Lack of technically trained manpower Lack of community involvement Lack of expertise & exposure to modern
techniques and best practices
Reasons for improper Waste Management (contd) Lack of awareness creation mechanism Lack of Management Information Systems Lack of funds with ULBs Indifferent attitudes of ULBs to levy user
charges and sustainability MSW Rules 2000 are antiquated and need
revision /updating.