energy savings in hvac - ordem dos engenheiros · hour 1 2 3 4 5 6 7 8 9 10 11 12 13 14 15 16 17 18...
TRANSCRIPT

10/13/2008 CONFIDENTIAL AND PROPRIETARY – © Trane 2007 – All rights reserved
Energy SavingsEnergy Savingsinin
HVACHVAC
How to optimize
energy savings in buildings through
HVAC system (re) design ?

210/13/2008 CONFIDENTIAL AND PROPRIETARY – © Trane 2007 - All rights reserved
Why Energy Savings Are Important?Why Energy Savings Are Important?
1. Economics• First cost versus Return On Investment:
- Operating cost savings (lower energy and total maintenance costs )
• National/local subsidies or tax incentives • Monetary advantage from trading emissions credits
2. Environmental• Energy recovery to drive down total energy use and (in)direct use of
scarce fossil fuels. • “Corporate Responsibility” / “Green” policies
- Also used in PR and Marketing programs: brand image
3. Compliance
• Compliance with emissions limitations:
- Kyoto Protocol restricts CO2 emissions
• Regulations on energy efficiency: - Energy Performance of Building Directive
1. Economics• First cost versus Return On Investment:
- Operating cost savings (lower energy and total maintenance costs )
• National/local subsidies or tax incentives
• Monetary advantage from trading emissions credits
2. Environmental• Energy recovery to drive down total energy use and (in)direct use of
scarce fossil fuels. • “Corporate Responsibility” / “Green” policies
- Also used in PR and Marketing programs: brand image
3. Compliance
• Compliance with emissions limitations:
- Kyoto Protocol restricts CO2 emissions
• Regulations on energy efficiency: - Energy Performance of Building Directive
The world can no longer afford to avoid energy issuesThe world can no longer afford to avoid energy issues……
310/13/2008 CONFIDENTIAL AND PROPRIETARY – © Trane 2007 - All rights reserved
TODAYTODAY’’S AGENDAS AGENDA
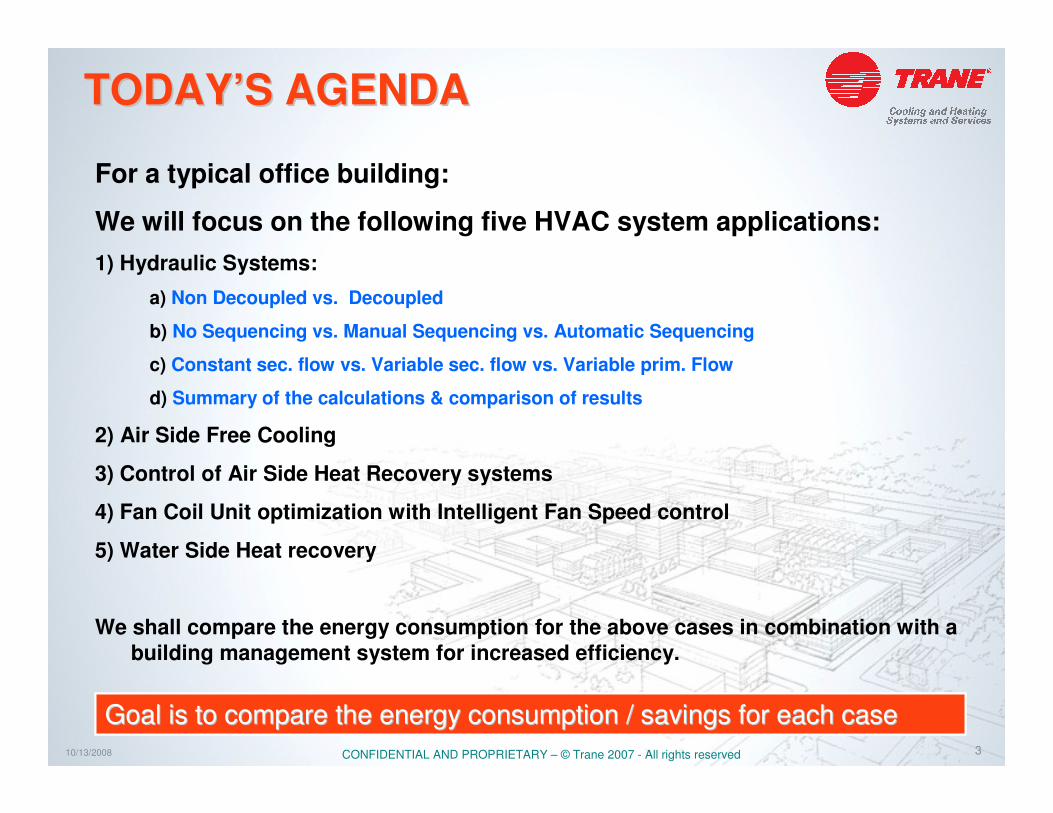
For a typical office building:
We will focus on the following five HVAC system applications:
1) Hydraulic Systems:
a) Non Decoupled vs. Decoupled
b) No Sequencing vs. Manual Sequencing vs. Automatic Sequencing
c) Constant sec. flow vs. Variable sec. flow vs. Variable prim. Flow
d) Summary of the calculations & comparison of results
2) Air Side Free Cooling
3) Control of Air Side Heat Recovery systems
4) Fan Coil Unit optimization with Intelligent Fan Speed control
5) Water Side Heat recovery
We shall compare the energy consumption for the above cases in combination with a
building management system for increased efficiency.
Goal is to compare the energy consumption / savings for each casGoal is to compare the energy consumption / savings for each casee

410/13/2008 CONFIDENTIAL AND PROPRIETARY – © Trane 2007 - All rights reserved
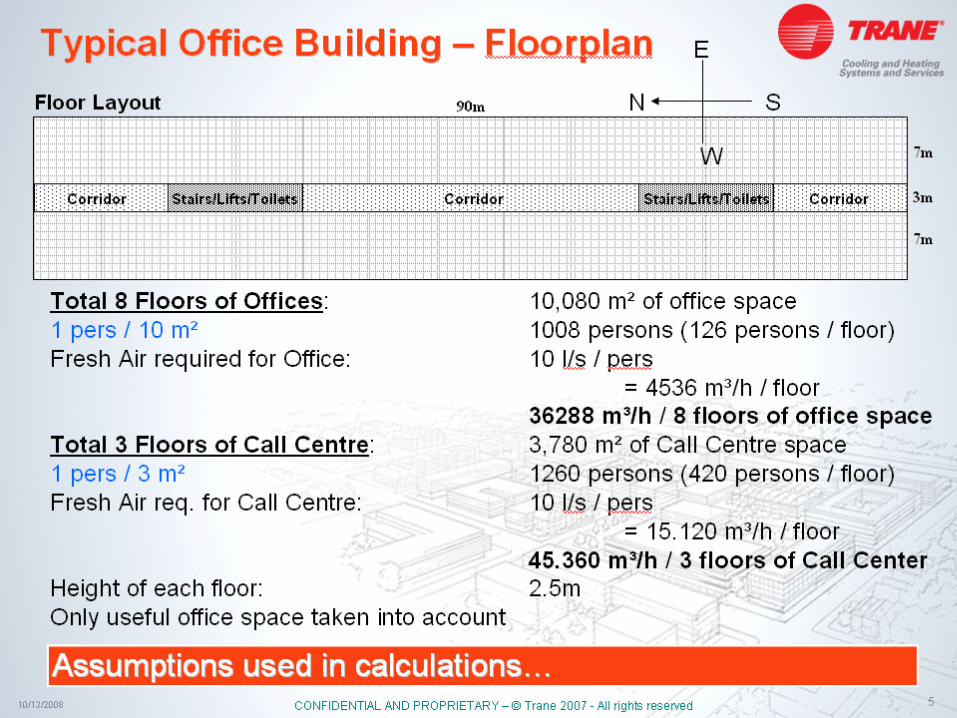
Typical Office BuildingTypical Office Building
11 Floors:
8 Floors - Office Space3 Floors - Call Center
(Only useful office
space taken into account)
90 m17 m
N
S
E
W
Example building used in calculationsExample building used in calculations……
2 Locations in Europe: Rome and Berlin

610/13/2008 CONFIDENTIAL AND PROPRIETARY – © Trane 2007 - All rights reserved
Assumptions for Office FloorsAssumptions for Office Floors
------------------------- Fresh air (wkend)
-----100100100100100100100100100100100100-------- Fresh air (wkday)
252525252525252525252525252525252525252525252525- Lights (weekend)
252525255050100100100100100100100100100505050252525252525- Lights (weekday)
------------------------- People (weekend)
-----2010010010010080801001001003010-------- People (weekday)
242322212019181716151413121110987654321Hour
23222120191817161514131211109876543210
Locations: Rome and Berlin
• Outside walls: U = 0,7W/m².K
with 50% Glass: Double coated U = 2,8W/m².K
Shading coëf. = 0,55
• Building Loads:
One person 120 W (70 W sensible + 50 W latent)
Lights 18 W/m² (50% of load in space)
Equipment 20 W/m² = 200 W/person (Pc + monitor)
• Design temperature:
Summer 24°can drift to 28°with no occupancy
Winter 21°can drift to 18°with no occupancy
• Load (%) Time Schedule:
Assumptions used in calculationsAssumptions used in calculations……
710/13/2008 CONFIDENTIAL AND PROPRIETARY – © Trane 2007 - All rights reserved
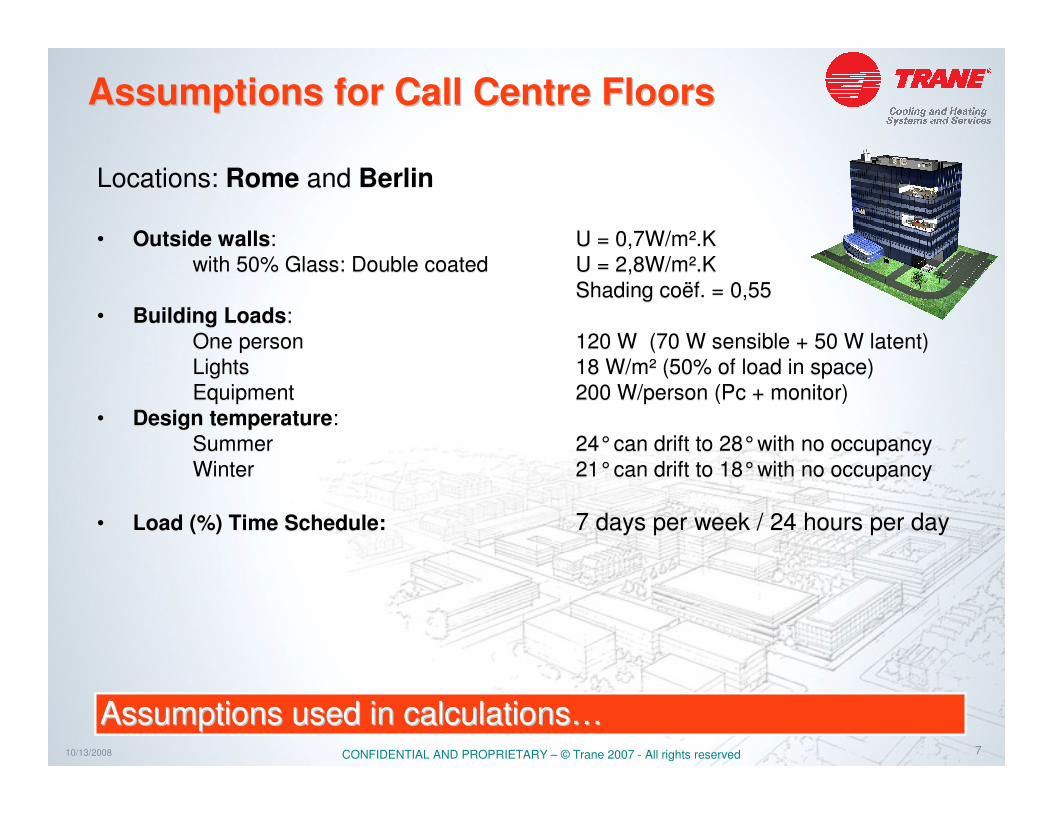
Assumptions for Call Centre FloorsAssumptions for Call Centre Floors
Locations: Rome and Berlin
• Outside walls: U = 0,7W/m².K
with 50% Glass: Double coated U = 2,8W/m².K
Shading coëf. = 0,55
• Building Loads:
One person 120 W (70 W sensible + 50 W latent)
Lights 18 W/m² (50% of load in space)
Equipment 200 W/person (Pc + monitor)
• Design temperature:
Summer 24°can drift to 28°with no occupancy
Winter 21°can drift to 18°with no occupancy
• Load (%) Time Schedule: 7 days per week / 24 hours per day
Assumptions used in calculationsAssumptions used in calculations……

810/13/2008 CONFIDENTIAL AND PROPRIETARY – © Trane 2007 - All rights reserved
Using the previous assumptions regarding…
• Typical building type
• Typical application
• Typical Weather in two European locations
– Northern Europe = Berlin
– Southern Europe = Rome
• Assumed Building Loads
• Assumed Design conditions
Energy consumption per case was calculated for every day and for each of the five different HVAC System Applications, based on ASHRAE standards
How were the calculations made?How were the calculations made?
Trace 700 Building Load Analysis software used for the simulatioTrace 700 Building Load Analysis software used for the simulationsns……
N

910/13/2008 CONFIDENTIAL AND PROPRIETARY – © Trane 2007 - All rights reserved
Size of Chillers and Pumps Size of Chillers and Pumps -- BerlinBerlin
Based on these calculations…Maximum cooling requirement: 1765 kW on 20th of July
3 Chillers: RTAD 150 (585 kW each)
Water temperatures: 12 / 7°CAmbient temperature: 30°C
EER(35°C): 2.63Total cooling capacity: 1755 kW
Pump sizing (assumptions):
• Non decoupled system: 25W pumping required for each kW cooling capacity Assumed total pressure drop of 350kPa
• Decoupled system (split pumping power - 20% production / 80% distribution):
5W pumping for each kW cooling in production Assumed pressure drop of 70kPa
And 20W pumping for each kW in distribution Assumed pressure drop of 280kPa
Based on a 5°C rise/fall of water temperature
Example used to make the calculations.Example used to make the calculations.
1010/13/2008 CONFIDENTIAL AND PROPRIETARY – © Trane 2007 - All rights reserved
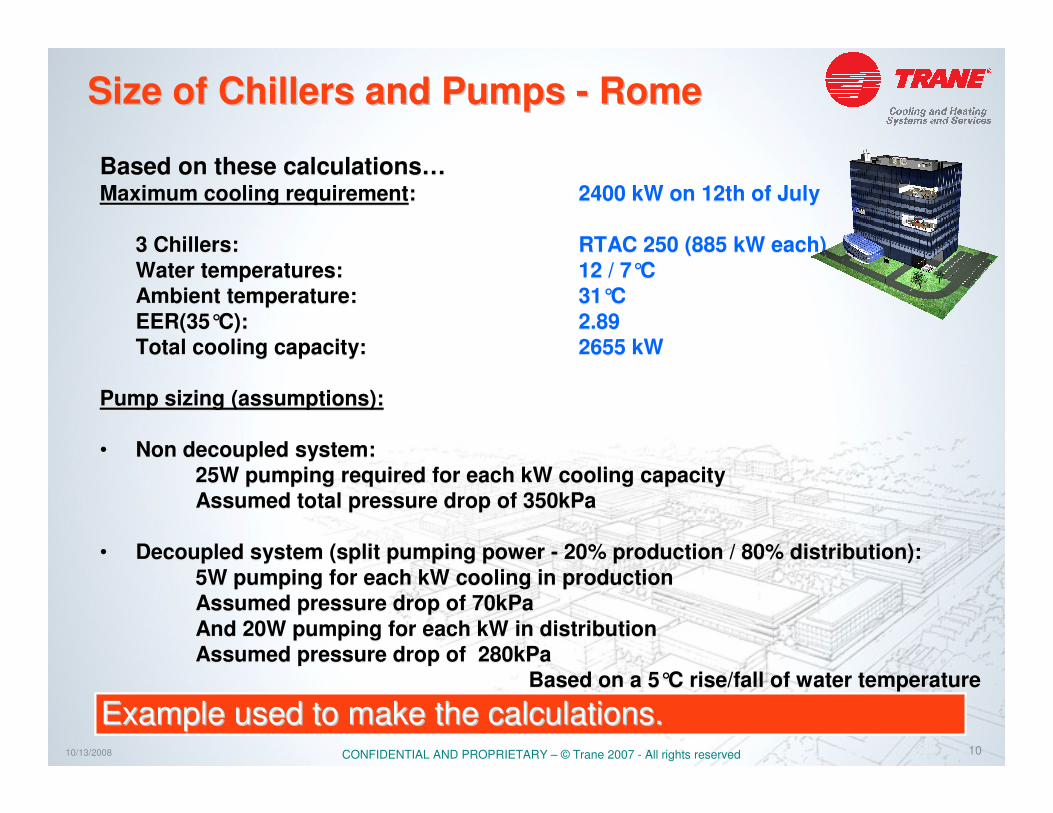
Size of Chillers and Pumps Size of Chillers and Pumps -- RomeRome
Based on these calculations…Maximum cooling requirement: 2400 kW on 12th of July
3 Chillers: RTAC 250 (885 kW each)
Water temperatures: 12 / 7°CAmbient temperature: 31°C
EER(35°C): 2.89Total cooling capacity: 2655 kW
Pump sizing (assumptions):
• Non decoupled system: 25W pumping required for each kW cooling capacity Assumed total pressure drop of 350kPa
• Decoupled system (split pumping power - 20% production / 80% distribution):
5W pumping for each kW cooling in production Assumed pressure drop of 70kPa
And 20W pumping for each kW in distribution Assumed pressure drop of 280kPa
Based on a 5°C rise/fall of water temperature
Example used to make the calculations.Example used to make the calculations.
6910/13/2008 CONFIDENTIAL AND PROPRIETARY – © Trane 2007 - All rights reserved
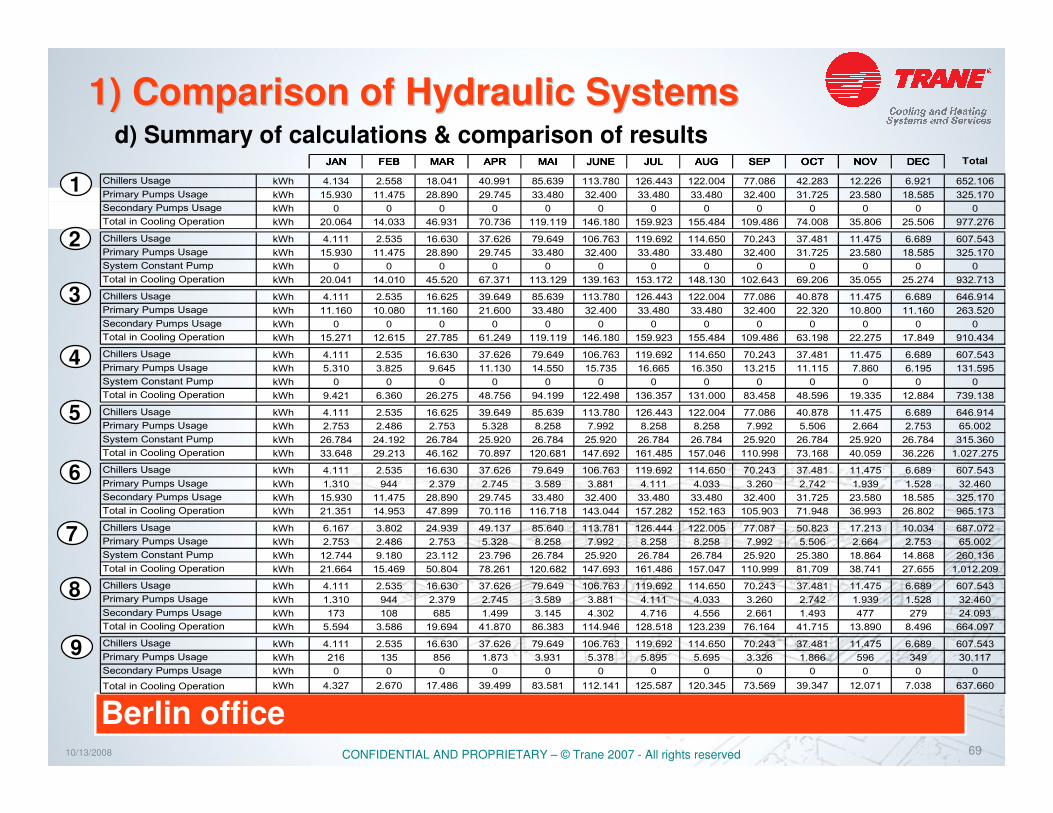
1) Comparison of Hydraulic Systems1) Comparison of Hydraulic Systemsd) Summary of calculations & comparison of results
Berlin office
JANJANJANJAN FEBFEBFEBFEB MARMARMARMAR APRAPRAPRAPR MAIMAIMAIMAI JUNEJUNEJUNEJUNE JULJULJULJUL AUGAUGAUGAUG SEPSEPSEPSEP OCTOCTOCTOCT NOVNOVNOVNOV DECDECDECDEC Total
1111 Chillers Usage kWh 4.134 2.558 18.041 40.991 85.639 113.780 126.443 122.004 77.086 42.283 12.226 6.921 652.106Primary Pumps Usage kWh 15.930 11.475 28.890 29.745 33.480 32.400 33.480 33.480 32.400 31.725 23.580 18.585 325.170Secondary Pumps Usage kWh 0 0 0 0 0 0 0 0 0 0 0 0 0Total in Cooling Operation kWh 20.064 14.033 46.931 70.736 119.119 146.180 159.923 155.484 109.486 74.008 35.806 25.506 977.276
2 Chillers Usage kWh 4.111 2.535 16.630 37.626 79.649 106.763 119.692 114.650 70.243 37.481 11.475 6.689 607.543Primary Pumps Usage kWh 15.930 11.475 28.890 29.745 33.480 32.400 33.480 33.480 32.400 31.725 23.580 18.585 325.170System Constant Pump kWh 0 0 0 0 0 0 0 0 0 0 0 0 0Total in Cooling Operation kWh 20.041 14.010 45.520 67.371 113.129 139.163 153.172 148.130 102.643 69.206 35.055 25.274 932.713
3 Chillers Usage kWh 4.111 2.535 16.625 39.649 85.639 113.780 126.443 122.004 77.086 40.878 11.475 6.689 646.914Primary Pumps Usage kWh 11.160 10.080 11.160 21.600 33.480 32.400 33.480 33.480 32.400 22.320 10.800 11.160 263.520Secondary Pumps Usage kWh 0 0 0 0 0 0 0 0 0 0 0 0 0Total in Cooling Operation kWh 15.271 12.615 27.785 61.249 119.119 146.180 159.923 155.484 109.486 63.198 22.275 17.849 910.434
4 Chillers Usage kWh 4.111 2.535 16.630 37.626 79.649 106.763 119.692 114.650 70.243 37.481 11.475 6.689 607.543Primary Pumps Usage kWh 5.310 3.825 9.645 11.130 14.550 15.735 16.665 16.350 13.215 11.115 7.860 6.195 131.595System Constant Pump kWh 0 0 0 0 0 0 0 0 0 0 0 0 0Total in Cooling Operation kWh 9.421 6.360 26.275 48.756 94.199 122.498 136.357 131.000 83.458 48.596 19.335 12.884 739.138
5 Chillers Usage kWh 4.111 2.535 16.625 39.649 85.639 113.780 126.443 122.004 77.086 40.878 11.475 6.689 646.914Primary Pumps Usage kWh 2.753 2.486 2.753 5.328 8.258 7.992 8.258 8.258 7.992 5.506 2.664 2.753 65.002System Constant Pump kWh 26.784 24.192 26.784 25.920 26.784 25.920 26.784 26.784 25.920 26.784 25.920 26.784 315.360Total in Cooling Operation kWh 33.648 29.213 46.162 70.897 120.681 147.692 161.485 157.046 110.998 73.168 40.059 36.226 1.027.275
6 Chillers Usage kWh 4.111 2.535 16.630 37.626 79.649 106.763 119.692 114.650 70.243 37.481 11.475 6.689 607.543Primary Pumps Usage kWh 1.310 944 2.379 2.745 3.589 3.881 4.111 4.033 3.260 2.742 1.939 1.528 32.460Secondary Pumps Usage kWh 15.930 11.475 28.890 29.745 33.480 32.400 33.480 33.480 32.400 31.725 23.580 18.585 325.170Total in Cooling Operation kWh 21.351 14.953 47.899 70.116 116.718 143.044 157.282 152.163 105.903 71.948 36.993 26.802 965.173
7 Chillers Usage kWh 6.167 3.802 24.939 49.137 85.640 113.781 126.444 122.005 77.087 50.823 17.213 10.034 687.072Primary Pumps Usage kWh 2.753 2.486 2.753 5.328 8.258 7.992 8.258 8.258 7.992 5.506 2.664 2.753 65.002System Constant Pump kWh 12.744 9.180 23.112 23.796 26.784 25.920 26.784 26.784 25.920 25.380 18.864 14.868 260.136Total in Cooling Operation kWh 21.664 15.469 50.804 78.261 120.682 147.693 161.486 157.047 110.999 81.709 38.741 27.655 1.012.209
8 Chillers Usage kWh 4.111 2.535 16.630 37.626 79.649 106.763 119.692 114.650 70.243 37.481 11.475 6.689 607.543Primary Pumps Usage kWh 1.310 944 2.379 2.745 3.589 3.881 4.111 4.033 3.260 2.742 1.939 1.528 32.460Secondary Pumps Usage kWh 173 108 685 1.499 3.145 4.302 4.716 4.556 2.661 1.493 477 279 24.093Total in Cooling Operation kWh 5.594 3.586 19.694 41.870 86.383 114.946 128.518 123.239 76.164 41.715 13.890 8.496 664.097
9 Chillers Usage kWh 4.111 2.535 16.630 37.626 79.649 106.763 119.692 114.650 70.243 37.481 11.475 6.689 607.543Primary Pumps Usage kWh 216 135 856 1.873 3.931 5.378 5.895 5.695 3.326 1.866 596 349 30.117Secondary Pumps Usage kWh 0 0 0 0 0 0 0 0 0 0 0 0 0Total in Cooling Operation kWh 4.327 2.670 17.486 39.499 83.581 112.141 125.587 120.345 73.569 39.347 12.071 7.038 637.660
1
2
3
4
5
6
7
8
9

7010/13/2008 CONFIDENTIAL AND PROPRIETARY – © Trane 2007 - All rights reserved
Results Berlin OFFICE
0
200000
400000
600000
800000
1000000
1200000
Non Decoupled
Constant Flow
NO sequencing
Non Decoupled
Constant Flow
Automatic
Sequencing
Non Decoupled
Sequenced Prim.
Flow Manual
Sequencing
Non Decoupled
Sequenced Prim.
Flow Automatic
Sequencing
Decoupled
Constant Sec.
Flow Manual
Sequencing
Decoupled
Constant Sec.
Flow Automatic
Sequencing
Decoupled
Constant Sec.
Flow Sequencing
on water return
temp.
Decoupled
Variable Sec.
Flow Automatic
Sequencing
Variable Primary
Flow
Secondary Pumps Usage
Primary Pumps Usage
Chillers Usage
1 2 4 5 6 7 8 93
kWh / Year
1) Comparison of Hydraulic Systems1) Comparison of Hydraulic Systems
Berlin office
1 2 3 4 5 6 7 8 9
d) Summary of calculations & comparison of results
7110/13/2008 CONFIDENTIAL AND PROPRIETARY – © Trane 2007 - All rights reserved
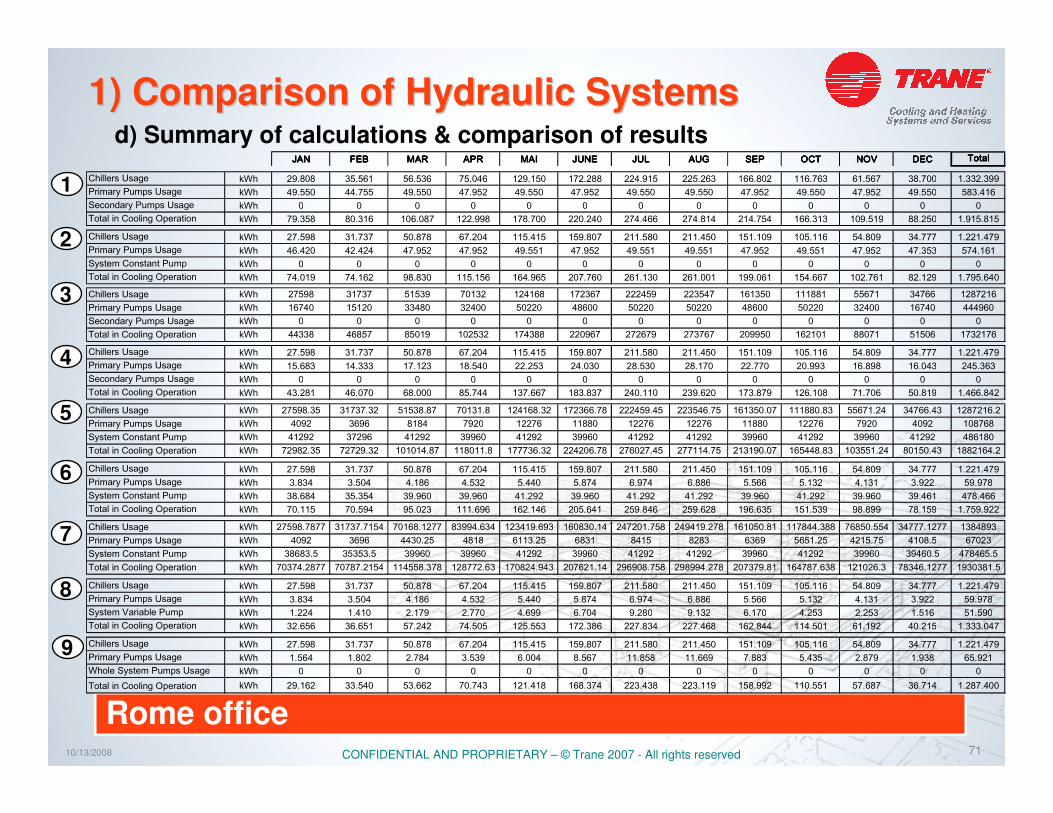
Rome office
JANJANJANJAN FEBFEBFEBFEB MARMARMARMAR APRAPRAPRAPR MAIMAIMAIMAI JUNEJUNEJUNEJUNE JULJULJULJUL AUGAUGAUGAUG SEPSEPSEPSEP OCTOCTOCTOCT NOVNOVNOVNOV DECDECDECDEC TotalTotalTotalTotal
1111 Chillers Usage kWh 29.808 35.561 56.536 75.046 129.150 172.288 224.915 225.263 166.802 116.763 61.567 38.700 1.332.399Primary Pumps Usage kWh 49.550 44.755 49.550 47.952 49.550 47.952 49.550 49.550 47.952 49.550 47.952 49.550 583.416Secondary Pumps Usage kWh 0 0 0 0 0 0 0 0 0 0 0 0 0Total in Cooling Operation kWh 79.358 80.316 106.087 122.998 178.700 220.240 274.466 274.814 214.754 166.313 109.519 88.250 1.915.815
2222 Chillers Usage kWh 27.598 31.737 50.878 67.204 115.415 159.807 211.580 211.450 151.109 105.116 54.809 34.777 1.221.479Primary Pumps Usage kWh 46.420 42.424 47.952 47.952 49.551 47.952 49.551 49.551 47.952 49.551 47.952 47.353 574.161System Constant Pump kWh 0 0 0 0 0 0 0 0 0 0 0 0 0Total in Cooling Operation kWh 74.019 74.162 98.830 115.156 164.965 207.760 261.130 261.001 199.061 154.667 102.761 82.129 1.795.640
3333 Chillers Usage kWh 27598 31737 51539 70132 124168 172367 222459 223547 161350 111881 55671 34766 1287216Primary Pumps Usage kWh 16740 15120 33480 32400 50220 48600 50220 50220 48600 50220 32400 16740 444960Secondary Pumps Usage kWh 0 0 0 0 0 0 0 0 0 0 0 0 0Total in Cooling Operation kWh 44338 46857 85019 102532 174388 220967 272679 273767 209950 162101 88071 51506 1732176
4444 Chillers Usage kWh 27.598 31.737 50.878 67.204 115.415 159.807 211.580 211.450 151.109 105.116 54.809 34.777 1.221.479Primary Pumps Usage kWh 15.683 14.333 17.123 18.540 22.253 24.030 28.530 28.170 22.770 20.993 16.898 16.043 245.363Secondary Pumps Usage kWh 0 0 0 0 0 0 0 0 0 0 0 0 0Total in Cooling Operation kWh 43.281 46.070 68.000 85.744 137.667 183.837 240.110 239.620 173.879 126.108 71.706 50.819 1.466.842
5555 Chillers Usage kWh 27598.35 31737.32 51538.87 70131.8 124168.32 172366.78 222459.45 223546.75 161350.07 111880.83 55671.24 34766.43 1287216.2Primary Pumps Usage kWh 4092 3696 8184 7920 12276 11880 12276 12276 11880 12276 7920 4092 108768System Constant Pump kWh 41292 37296 41292 39960 41292 39960 41292 41292 39960 41292 39960 41292 486180Total in Cooling Operation kWh 72982.35 72729.32 101014.87 118011.8 177736.32 224206.78 276027.45 277114.75 213190.07 165448.83 103551.24 80150.43 1882164.2
6666 Chillers Usage kWh 27.598 31.737 50.878 67.204 115.415 159.807 211.580 211.450 151.109 105.116 54.809 34.777 1.221.479Primary Pumps Usage kWh 3.834 3.504 4.186 4.532 5.440 5.874 6.974 6.886 5.566 5.132 4.131 3.922 59.978System Constant Pump kWh 38.684 35.354 39.960 39.960 41.292 39.960 41.292 41.292 39.960 41.292 39.960 39.461 478.466Total in Cooling Operation kWh 70.115 70.594 95.023 111.696 162.146 205.641 259.846 259.628 196.635 151.539 98.899 78.159 1.759.922
7777 Chillers Usage kWh 27598.7877 31737.7154 70168.1277 83994.634 123419.693 160830.14 247201.758 249419.278 161050.81 117844.388 76850.554 34777.1277 1384893Primary Pumps Usage kWh 4092 3696 4430.25 4818 6113.25 6831 8415 8283 6369 5651.25 4215.75 4108.5 67023System Constant Pump kWh 38683.5 35353.5 39960 39960 41292 39960 41292 41292 39960 41292 39960 39460.5 478465.5Total in Cooling Operation kWh 70374.2877 70787.2154 114558.378 128772.63 170824.943 207621.14 296908.758 298994.278 207379.81 164787.638 121026.3 78346.1277 1930381.5
8888 Chillers Usage kWh 27.598 31.737 50.878 67.204 115.415 159.807 211.580 211.450 151.109 105.116 54.809 34.777 1.221.479Primary Pumps Usage kWh 3.834 3.504 4.186 4.532 5.440 5.874 6.974 6.886 5.566 5.132 4.131 3.922 59.978System Variable Pump kWh 1.224 1.410 2.179 2.770 4.699 6.704 9.280 9.132 6.170 4.253 2.253 1.516 51.590Total in Cooling Operation kWh 32.656 36.651 57.242 74.505 125.553 172.386 227.834 227.468 162.844 114.501 61.192 40.215 1.333.047
9999 Chillers Usage kWh 27.598 31.737 50.878 67.204 115.415 159.807 211.580 211.450 151.109 105.116 54.809 34.777 1.221.479Primary Pumps Usage kWh 1.564 1.802 2.784 3.539 6.004 8.567 11.858 11.669 7.883 5.435 2.879 1.938 65.921Whole System Pumps Usage kWh 0 0 0 0 0 0 0 0 0 0 0 0 0Total in Cooling Operation kWh 29.162 33.540 53.662 70.743 121.418 168.374 223.438 223.119 158.992 110.551 57.687 36.714 1.287.400
1) Comparison of Hydraulic Systems1) Comparison of Hydraulic Systemsd) Summary of calculations & comparison of results
1
2
3
4
5
6
7
8
9
7210/13/2008 CONFIDENTIAL AND PROPRIETARY – © Trane 2007 - All rights reserved
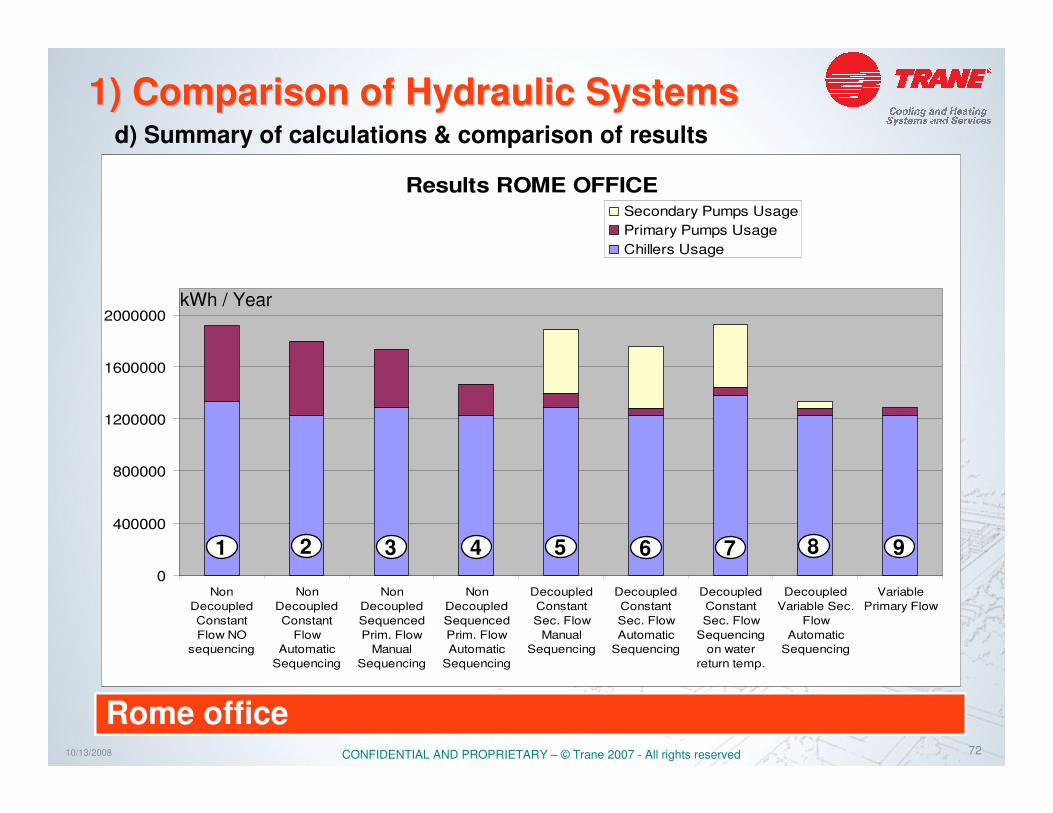
Results ROME OFFICE
0
400000
800000
1200000
1600000
2000000
Non
Decoupled
Constant
Flow NO
sequencing
Non
Decoupled
Constant
Flow
Automatic
Sequencing
Non
Decoupled
Sequenced
Prim. Flow
Manual
Sequencing
Non
Decoupled
Sequenced
Prim. Flow
Automatic
Sequencing
Decoupled
Constant
Sec. Flow
Manual
Sequencing
Decoupled
Constant
Sec. Flow
Automatic
Sequencing
Decoupled
Constant
Sec. Flow
Sequencing
on water
return temp.
Decoupled
Variable Sec.
Flow
Automatic
Sequencing
Variable
Primary Flow
Secondary Pumps Usage
Primary Pumps Usage
Chillers Usage
1 2 4 5 6 7 8 93
kWh / Year
1) Comparison of Hydraulic Systems1) Comparison of Hydraulic Systems
1 2 4 5 6 731 2 3 4 5 6 7 8 9
Rome office
d) Summary of calculations & comparison of results

7310/13/2008 CONFIDENTIAL AND PROPRIETARY – © Trane 2007 - All rights reserved
Conclusion:
• You need to prioritize which of the following factors are most important for your project:
– Low Installed Cost
– Low Energy Consumption
– Low Operating Cost
– Precise Water Temperatures
– Easy Start-up and Maintenance
• Or find a balance between the different considerations
Comparison of Hydraulic SystemsComparison of Hydraulic Systems