eni for 2017 - performance spa registered office piazzale enrico mattei, 1 - rome - italy share...
TRANSCRIPT

S U S T A I N A B I L I T Y P E R F O R M A N C E
E N I F O R 2 0 1 7
Gr
ee
n D
at
a C
en
ter
-
Fe
rr
er
a E
rb
og
no
ne
*00199* *00200*
*00201* *00202*
*00203* *00204*
*00205* *00206*
*00207* *00208*
*00209* *00210*
*00211* *00212*
*00213* *00214*
*00215* *00216*
Guida dell’azionista 2018 ITA
Relazione Finanziaria 2017 ITA Annual Report 2017 ENG
Fact Book 2017 ITA Fact Book 2017 ENG
Eni For 2017 ITA Eni For 2017 ENG
Eni In 2017 Annual Report on Form 20F 2017 ENG
Relazione sul Governo Societario 2017 ITA Relazione sul Governo Societario 2017 ENG
Relazione sula Remunerazione 2018 ITA
Decarbonizzazione Eni For 2017 ITA Decarbonizzazione Eni For 2017 ENG
Performace Eni For 2017 ITA Performance Eni For 2017 ENG
Relazione sula Remunerazione 2018 ENG
Guida dell’azionista 2018 ING

Eni SpA
Registered OfficePiazzale Enrico Mattei, 1 - Rome - ItalyShare capital: € 4,005,358,876.00 fully paid-upBusiness Register of Rome, taxpayer’s code 00484960588
Other BranchesVia Emilia, 1San Donato Milanese (MI) - Italy
Piazza Ezio Vanoni, 1San Donato Milanese (MI) - Italy
Page layout and supervisionK-Change Srl - Rome - Italy
PrintTipografia Facciotti Srl - Rome - Italy
Printed on XPer Fedrigoni paper
CONTENTS
Reporting criteria 2
Governance andbusiness ethics 4
Path todecarbonization 6
Operating model 8
Cooperation model 23
Suppliers & customers 23

E N I F O R 2 0 1 7 | S U S T A I N A B I L I T Y P E R F O R M A N C E2
Eni For is prepared in compliance with the Sustainability Report-ing Standards of the Global Reporting Initiative (GRI) according to principles of balance, comparability, accuracy, timeliness, reliability and clarity (reporting principles). Eni For has adopt-ed the Core “in accordance” option. Key Performance Indicators, selected according to items identified as the most relevant, are collected on an annual basis. The data gathering process is structured to ensure the comparability of data over several years, in order to allow a correct reading of the information and a
The following paragraphs contain the sustainability performance in-dicators for the 2015-2017 period. The information refers to Eni SpA and to the fully consolidated entities, with the exception of some data, as clearly indicated in the following paragraphs of the docu-ment. With regard to data on health, safety and the environment, the consolidation domain is defined on the basis of the operational criterion (control of operations) and refers to the fully consolidat-ed companies and to the companies under joint operation or joint
full vision to all stakeholders interested in the evolution of Eni’s performance. Individual exceptions are appropriately reported in the text.The 2015 and 2016 data could be different from those published previously due to the perimeter variations and also as a conse-quence of the consolidating effect of the data that were only made available after the publication of these documents. For the same reason, the 2017 data represent the best estimation with the data available at the time of writing this report.
control or associates in which Eni has control of operations, with relevant HSE impacts. All the whistleblowing reports received have been included under the report data in line with other company documents and in con-tinuity with the past.In conclusion data on anti-corruption training and on community in-vestment include the fully consolidated companies and other com-panies which are considered relevant with reference to this aspect.
REPORTING CRITERIA
| Reporting principles
| Reporting boundary
| Calculation methods
INDICATORS METHOD
GOVERNANCE
DIVERSITY IN THE BOARDS OF STATUTORY AUDITORS
Outside of Italy, only the companies with a control body similar to the Italian Board of Statutory Auditors were considered.
VALUEADDED
Value added represents the wealth generated by the Company in carrying out its activities. Global gross value added is divided between the following beneficiaries: employees (direct remuneration composed of wages, salaries and provisions for severance payments (TFR) and indirect remuneration consisting of social welfare contributions); Public Administration (income tax); financial backers (medium- and long-term interest paid for the availability of borrowed capital); shareholders (dividends distributed); and the company (reinvested earnings).
PATH TO DECARBONIZATION
GHGEMISSIONS
GHG include emissions of CO2, CH4 and N2O; the Global Warming Potential used is 25 for CH4 and 298 for N2O. Eni inventory will be certified in accordance with ISAE3000/3410. The emission factors used for the calculations are, where possible, site specific or, as an alternative, drawn from the international documents available.
EMISSIONINTENSITY
Numerator: direct GHG emissions (Scope 1) including CO2, CH4 and N2O.
ENERGYCONSUMPTION
Consumption from primary sources: sum of consumption of fuel gas, natural gas, refinery/process gas, LPG, light distillates/petrol, diesel, kerosene, fuel oil, FOK and coke from FCC. Primary energy purchased from other companies: sum of purchases of electricity, heat and steam from third parties.Consumption from renewable sources depends on the national electric mix because consumption from photovoltaic panels installed by Eni on its assets is currently negligible.

E N I F O R 2 0 1 7 | S U S T A I N A B I L I T Y P E R F O R M A N C E 3
INDICATORS METHOD
ENERGYINTENSITY
The refining energy intensity index represents the total value of energy actually used in a given year in the various refinery processing plants, divided by the corresponding value determined on the basis of predefined standard consumption values for each processing plant. For comparison between years, the data for 2009 have been taken as the baseline (100%). For these indexes the numerator represents consumption from primary resources and purchases of electricity and/or steam.
OPERATING MODEL
LOCAL MANAGERS ABROAD
Local senior managers and managers abroad: number of local senior managers + managers (employees born in the Country in which their main working activity is based) divided by total employment abroad.
RATE OFABSENTEEISM
Number of hours of absence divided by the No. of workable hours x 100 for staff employed in the period under consideration. KPI only for Italy and only for non-managerial employees.
TURNOVER RATE New hires with permament contract divided by terminations of permanent contracts.
HEALTHAND SAFETY
LTIF: lost time injury frequency rate, i.e. number of injuries that occurred for every million hours worked. Numerator: total injuries at work with lost days occurring in the period; denominator: hours worked in the same period; the result is multiplied by 1,000,000.TRIR: total recordable injury frequency rate (days of absence due to injuries, medical treatments and cases of work limitations). Numerator: number of total recordable injuries; denominator: hours worked in the same period. Result is multiplied by 1,000,000.Lost day rate: days of absence due to injuries at work per thousand hours worked. Numerator: days of absence from work in the period due to injuries (calculated as calendar days starting from the day following the event); denominator: hours worked in the same period. Result is multiplied by 1,000.
WATERWITHDRAWALS
Sum of sea water, freshwater, and salt water from subsoil or surface withdrawn. TAF (groundwater treatment plant) water represents the amount of polluted groundwater treated and reused in the production cycle.
AIRPROTECTION
NOx: total direct emissions of nitrogen oxide due to combustion processes with air. Includes emissions of NOx from flaring activities, sulphur recovery processes, FCC regeneration, etc. Includes emissions of NO and NO2, excludes N2O.SOx: total direct emissions of sulphur oxides, including emissions of SO2 and SO3.NMVOC (Non-methane volatile organic compounds): total direct emissions of hydrocarbons, hydrocarbon substitutes and oxygenated hydrocarbons that evaporate at normal temperature. They include LPG and exclude methane.TSP: direct emissions of Total Suspended Particulates, finely divided solid or liquid material suspended in gaseous flows. Standard emission factors.
RESEARCH AND DEVELOPMENT
The tangible value generated by R&D is measured by the economic benefits related to the application of innovative production/process technologies. The overall value generated is divided into: (a) actual benefits and (b) expected benefits. Actual benefits are applied to 100% of the investment in technological applications projects and before tax. On the other hand, expected benefits are associated with: (i) investment projects that employ innovative technologies; (ii) reductions in expenditures envisaged from abandoning Upstream infrastructures and are calculated in terms of Net Present Value (NPV) at 100% of the investment and before tax; and (iii) increases in 2P reserves calculated by re-proportioning Eni’s share of the unit NPV/boe to 100% using the SEC methodology. The latter include the benefit deriving from the application of applied technologies in exploration, which contribute to increasing the success rate and the associated values. The tangible benefits are identified in a “what if” scenario, namely as the difference compared to the application of the best alternative technology available on the market or, in the case of new products, as the difference compared to the margin derived from the sale of the new product net of any products replaced.
SUPPLIERS SUBJECTEDTO ASSESSMENT
This indicator relates only to processes managed by Eni SpA and represents all suppliers subjected to Due Diligence, a qualification process, HSE, compliance or business conduct assessment feedback, human rights feedback process or assessment (SA8000). It relates to all suppliers for which Vendor Management activities are centralized in Eni SpA (i.e. all Italian suppliers, mega-suppliers and international suppliers).

E N I F O R 2 0 1 7 | S U S T A I N A B I L I T Y P E R F O R M A N C E4
GOVERNANCE AND BUSINESS ETHICS
2015 2016 2017(b)
Members of the Board of Directors (number) 9 9 9
- executive 1 1 1
- non-executive 8 8 8
- independent(c) 7 7 7
- non-independent 2 2 2
- members of minorities 3 3 3
Board of Directors Annual Meetings 13 14 13
Average attendance at Board meetings (%) 100 98 100
Annual board induction sessions (number) 4 2 4
Diversity in the management and control bodies of the Eni Group
Presence of women on the Boards of Directors (%) 26 27 32
Presence of women on the Boards of Statutory Auditors(d) (%) 34 37 37
(a) For consistency with the representation in the 2017 balance sheet, the Eni Group is understood to mean Eni SpA and its subsidiaries consolidated with the line-by-line method.(b) Refers to the Board in office up until 13 April 2017 and, since 13 April 2017, to the current Board.(c) Refers to independence as defined by the regulations, referred to in Eni’s By-Laws.(d) Outside of Italy, only the companies which a control body similar to the Italian Board of Statutory Auditors were considered.
BOARD OF DIRECTORS AND CONTROL BODIES OF THE ENI GROUP(a)
REMUNERATION
The Board of Directors (BoD) and the Board of Statutory Auditors are appointed by the Shareholders’ Meeting using the list voting system. Their respective chairmen are appointed by the Sharehold-ers’ Meeting with normal majorities. Three Directors and two Audi-tors, including the Chairman of the Board of Auditors, are appointed by minority shareholders1. The current BoD was appointed by the Shareholders’ Meeting held on 13 April 2017. To appoint the Directors, the Shareholders’ Meet-ing took account of the directions promptly communicated to the market by the BoD previously in office on the best composition in terms of diversity, such as gender, profession, managerial experi-ence and nationality. The result is a well-balanced and diversified BoD. A third of members of the BoD and of the Board of Statutory Auditors, including the Chairmen, are women, in compliance with the provisions of law and of the By-Laws. The number of independent Directors on the BoD exceeds the num-ber required by the By-Laws and the corporate governance code. Every year the BoD, with the assistance of an external consul-tant and the supervision of the Appointments Committee, carries
out a self assessment (Board Review). Essential elements of this review are comparisons with best practices at national and international level, and a review of board dynamics, also evalu-ating whether to carry out a Peer Review of directors, which, for the reference three-year period, was actually carried out in 2015 and 20172. In line with the procedure launched several years ago, at the start of the new term of office, training sessions were carried out on in-stitutional and business issues, including visits to operating sites, to support the BoD and the Board of Statutory Auditors.
The internal regulations on the “Corporate Governance of Eni com-panies”, subject to the requirements of the law, provides that in selecting the members of the management and control boards of Eni’s Italian and foreign subsidiaries, the need for diversity (in-cluding gender diversity) is, where possible, taken into account. In line with these regulations, Eni’s commitment to reinforcing the presence of women on the management and control boards of Eni’s companies is ongoing.
1) Eni’s By-Laws ensure that the number of representatives of minorities exceeds the number required by law. The number of independent Directors provided by the Company By-Laws is also greater than that required by law.2) This consists of assessment by each Board Member of the contributions made by each other Board Member.
The CEO’s overall pay mix in the 2017-2020 term is more focused on variable components, which are also linked to sustainability targets, with a strong prevalence of the long-term component. In the table are reported the percentage of the remuneration linked
to long-term objectives and the percentage of variable remunera-tion linked to sustainability objectives, if the target or maximum level company objectives are achieved.
Policy Mandate 2014-2017 Policy Mandate 2017-2020
Target Maximum Target Maximum
% of CEO remuneration linked to long-term objectives 46% 51% 53% 65%
% of CEO variable remuneration on sustainability objectives 25% 33% 25% 38%

E N I F O R 2 0 1 7 | S U S T A I N A B I L I T Y P E R F O R M A N C E 5
2015 2016 2017
Ratio between the CEO’s fixed remuneration and the average fixed remuneration of employees
29 28 31
2015 2016 2017
Gross global value added (€ million) 16,100 12,304 18,281
- of which to human resources 3,368 3,219 3,163
- of which to States and Public Administrations 3,122 1,936 3,467
- of which to financial backers 838 757 751
- of which to shareholders 2,884 2,885 2,884
Total distributed value added 10,212 8,797 10,265
- portion of net profit reinvested in the company (10,283) (3,929) 493
- depreciation, amortization and impairments (gross) 16,171 7,436 7,523
Net value added (71) 4,868 10,758
Below the pay ratio analysis update between the CEO's fixed remuneration and the average fixed remuneration of Eni's employees in Italy.
Distributed value added in 2017 amounted to €10,265 million, an increase compared to 2016, and is divided as follows: i) 34% to the State and Public Administrations through taxes on the in-come of both Italian and overseas businesses: ii) 31% to human
resources remunerated through wages, salaries and welfare contributions; iii) 28% to shareholders remunerated through the distribution of dividends; iv) 7% to financial backers paid through financial charges.
| Value added

E N I F O R 2 0 1 7 | S U S T A I N A B I L I T Y P E R F O R M A N C E6
PATH TO DECARBONIZATION
EMISSIONS
2015 2016 2017
Direct GHG emissions (Scope 1)(a) (million tonnes CO2eq) 42.32 41.46 42.52
- of which CO2 equivalent from combustion and process 32.22 31.99 32.65
- of which CO2 equivalent from flaring 5.51 5.40 6.83
- of which CO2 equivalents from non-combusted methane and fugitive emissions 2.79 2.40 1.46
- of which CO2 equivalents from venting 1.80 1.67 1.58
Direct GHG emissions by sector:
- E&P 23.54 21.78 23.45
- G&P 10.57 11.17 11.23
- R&MC 8.19 8.50 7.82
GHG emissions/100% operated hydrocarbon gross production (E&P) (tonnes CO2eq/toe) 0.177 0.166 0.162
GHG emissions/KWheq (EniPower) (gCO2eq/kWheq) 409 398 395
GHG emissions/crude oil processing and semi-processed oil (R&M)(c) (tonnes CO2eq/kt) 253 278 258
Non-combusted methane and fugitive emissions UPS (tonnes CH4) 91,416 72,644 38,819
Volumes of hydrocarbon sent to flaring (MSm3) 1,989 1,950 2,283
- of which sent to process flaring 1,564 1,530 1,556
Volumes of hydrocarbons sent to venting 10.8 11.5 14.2
CO2 emissions from Eni plants subject to EU ETS (million tonnes CO
2eq) 19.68 20.23 19.72
Quotas allocated to Eni plants subject to EU ETS 6.84 7.06 8.52
Eni plants subject to EU ETS (number) 41 41 40
Indirect GHG emissions from purchases from other companies (Scope 2)(a) (million tonnes CO2eq) 0.62 0.71 0.65
Indirect GHG emissions other than those due to purchases from other companies (Scope 3)(a)(b) 248.04 246.38 249.06
- of which use of sold products 229.14 225.62 228.62
- of which processing of sold products 10.19 10.61 11.00
- of which electricity purchased and sold 5.44 5.86 4.95
- of which purchased goods and services (supply chain) 1.42 1.94 1.73
- of which transportation and distribution of products 1.17 1.44 2.08
- of which business travel and employees commuting 0.10 0.40 0.21
- of which other contribution 0.58 0.51 0.47
Production of biofuels (ktonnes) 179 181 206
Capacity of biorefinery (ktonnes/year) 360 360 360
(a) The GHG includes emissions of CO2, CH
4 and N
2O; the Global Warming Potential used is 25 for CH
4 and 298 for N
2O.
(b) The data includes indirect emissions of GHG from drilling activities subcontracted to third parties by the E&P sector, from sales of petroleum products, natural gas and LNG, from business travel, transportation by road and sea subcontracted to third parties, electricity produced by third parties and sold to final customers and Service Stations in Franchising.(c) The index refers to traditional refineries: Livorno, Sannazzaro, Taranto and Gela in 2014; Livorno, Sannazzaro and Taranto since 2015.
In 2017 the emissions rates related to production showed an im-provement in all sectors compared to 2016: -2.7% in E&P (-15% compared to 2014), -0.8% for EniPower and -7% for refineries. Since 2010, direct emissions have fallen by 27%, however, last year emis-sions of 42.52 Mt of CO2 equivalent were recorded, an increase of 2.5% compared to 2016, due to the rise in emissions from combus-tion, process and flaring, while emissions from methane fell. Combustion and process emissions rose as a result of production increases recorded in the E&P (in particular activities in Libya and start-ups in Ghana, Angola and Indonesia) and G&P sectors (where both electricity production and volumes of natural gas transported have increased).
The increase in emissions from flaring and related volumes of hy-drocarbons are related to emergency flaring in start-ups and the restarting of the Abu Attifel field in Libya, which was shut down in 2016 due to the Country’s difficult situation. Since 2014 the volume of hydrocarbons sent to process flaring has fallen by 7%. The growth trend in volumes of hydrocarbons sent to venting is attributable to the emergency component recorded in February at an Eni US Operating platform. Eni’s emissions of methane (approximately 80% of which from fugitive emissions) have fallen by 39.3% since the previous year due to work carried out in the E&P and G&P sectors, such as pe-riodic maintenance on sites already subject to monitoring in pre-

E N I F O R 2 0 1 7 | S U S T A I N A B I L I T Y P E R F O R M A N C E 7
ENERGY EFFICIENCY
2015 2016 2017
Electricity produced by type of source (EniPower) (TWh) 22.68 24.64 26.35
- of which from natural gas 21.22 23.10 23.90
- of which from petroleum products 1.45 1.52 2.44
- of which from renewables 0.01 0.01 0.01
Electricity produced from photovoltaic (EniPower) MWh 13,750 13,527 14,720
Energy Intensity Index (refineries) (%) 100.3 101.7 109.2
Energy consumption from production activities/100% operated hydrocarbon gross production (E&P)
(GJ/MWheq) 1.595 1.711 1.487
Net consumption of primary resources/MWheq (EniPower) (toe/MWheq) 0.168 0.163 0.162
Primary sources consumption (Mtoe) 12.76 12.52 13.15
- natural gas/fuel gas 9.96 9.97 10.64
- other petroleum products 2.80 2.56 2.51
Primary energy purchased from other companies by type 0.38 0.44 0.38
- electricity 0.33 0.38 0.33
- other sources(a) 0.05 0.06 0.05
Energy efficiency expenditures and investments and climate change(b) (€ million) 12.00 31.81 38.03
- of which current costs 0.54 0.74 2.21
- of which investments 11.47 31.07 35.82
- of which flaring down expenditures and investments 5.43 22.14 28.68
- of which current costs - 0.51 1.34
- of which investments 5.43 21.62 27.34
(a) Including steam, direct process heat, recovery heat and hydrogen.(b) The value is included in the environmental expenditures and investments set out in the “HSE Management System Certification and Expenses” table.
vious years and the extension of the survey to new sites, with an improvement in the accuracy of emissions estimates based on actual plant configuration.In Europe, under the Emissions Trading Scheme (ETS), in 2017 Eni’s consolidated GHG emissions fell overall (-2.5% compared to 2016), since the drop recorded in the R&MC sector (-8%) was only partially offset by the increase recorded in G&P (+1.7%), while the contribution of the E&P sector remained stable (-0.4%). The free allowances assigned in 2017 under the allocation rules in force during the third ETS period (2013-2020) again were not suf-ficient to cover the Company’s needs (EniPower in the G&P sector is particularly affected as, since 2013, it no longer receives free quotas except for those related to heat sold to third parties). The number of plants fell to 40 (it was 41 in 2016), owing to the exit of the Pineto gas-fired power station in the E&P sector.
The energy saving initiatives implemented in Eni between 2008 and 2017 have made possible (under full operation) energy savings of almost 1 Mtoe/year, amounting to a reduction in emissions of more than 2.5 million tonnes of CO2. Historically the R&MC sector con-tributed to this result, but since 2014 the E&P sector has also had a strong influence by carrying out, in 2017 alone, work to achieve savings (under full operation) of over 277 ktoe/year, equal to al-most 94% of the consolidated Eni datum. In the R&MC sector, energy savings (under full operation) of more than 5 ktoe were obtained
During 2017 Eni purchased and cancelled in its favour 680,193 forestry credits in the international market, thus offsetting about half of the increase in its own direct emissions for the year.With regard to indirect GHG emissions other from those due to elec-tricity and steam purchases from other companies (so-called Scope 3), in the scope of accuracy and coverage of GHG reporting, Eni reports emissions from different categories, in line with the main international standards (WBCSD, IPIECA); however the main contri-bution is related to the emissions derived from the final stage of uti-lization of sold products. The overall increase of Scope 3 GHG emis-sions in 2017 (+1.1% over the previous year) is attributed mainly to greater volumes of sales of petroleum and natural gas.In 2017, production of biofuels reached 206 thousand tonnes, an all-time record, with an increase of more than 14% over the pre-vious year.
through the new projects implemented in 2017 at the refineries in Sannazzaro, Livorno and Taranto and 8 ktoe through those at the Versalis petrochemical plants. In the G&P sector, EniPower contin-ued to invest in renewable energy and alternative sources and car-ried out works to achieve energy savings (under full operation) of over 4ktoe/year.In 2017, activities were carried out in all sectors for the adoption and certification of Energy Management Systems. At the end of 2017, the energy management systems in the refiner-

E N I F O R 2 0 1 7 | S U S T A I N A B I L I T Y P E R F O R M A N C E8
ies of Livorno, Sannazzaro, Taranto and Venice, those in the Versalis petrochemical plants in Mantua, Priolo, Ragusa, Ravenna, Brindisi, Ferrara, Porto Torres, Dunkirk, Szazhalombatta and Oberhausen, in the G&P sector, those of all the EniPower electrical power plants
and that of Eni Gas & Power France, in the E&P sector, those of the Southern District and the United Gas Derivates and Karachaganak Petroleum Operating companies and the management systems of the Eni SpA corporate offices are ISO 50001 certified.
OPERATING MODEL
| People
EMPLOYMENT
2015 2016 2017
Employees as of 31st December (number) 33,389 32,733 32,195
- men 25,527 25,126 24,615
- women 7,862 7,607 7,580
- Italy 20,447 20,476 20,468
- Abroad 12,942 12,257 11,727
Employees by sector
- E&P 12,728 12,408 11,928
- R&MC 10,377 10,235 10,312
- G&P 4,388 4,168 4,220
Employees abroad by type 12,942 12,257 11,727
- local 10,938 10,377 10,010
- Italian expatriates 1,344 1,358 1,234
- international expatriates (including TCN) 660 522 483
Employees in Africa 3,612 3,546 3,303
Employees in the Americas 1,297 1,236 1,216
Employees in Asia 2,564 2,523 2,418
Employees in Australia and Oceania 135 113 114
Employees in Italy 20,447 20,476 20,468
Employees in the Rest of Europe 5,334 4,839 4,676
Local employees abroad by professional category 10,938 10,377 10,010
- of which senior managers 79 67 58
- of which middle managers 1,985 1,902 1,781
- of which white collar workers 6,339 5,641 5,543
- of which blue collar workers 2,535 2,767 2,628
Local senior managers & middle managers abroad 15.95 16.06 15.68
Employees in non OECD Countries 7,176 7,002 6,631
% of local employees in subsidiaries: 92.95 93.49 93.36
- of which consolidated 84.52 84.66 85.36
- of which non consolidated 97.60 97.79 97.03
Employees in non consolidated and proportionally consolidated subsidiaries(a) 24,520 26,190 26,492
- of which local 24,002 25,632 25,733
Employees with permanent contracts 32,686 32,299 31,609
Employees with fixed term contracts 703 434 586
Full-time employees 32,697 32,139 31,612

E N I F O R 2 0 1 7 | S U S T A I N A B I L I T Y P E R F O R M A N C E 9
Overall employment is 32,195 people, of which 20,468 in Italy (63.6% of Eni employees) and 11,727 abroad (36.4% of Eni em-ployees). In 2017, employment at global level was reduced by 538 people compared to 2016, equal to -1.6%, with substantial stability in Italy (-8) and a more substantial reduction abroad of -530 re-sources. This reduction is due mainly to a focus of activities on the strategic areas with similar recovery of efficiency in other ar-eas. In Italy, 543 hires were made, including 424 under permanent employment contracts (of which 21.9% were women, a rise com-pared with 2016, when only 20.1% of recruits were women). The number of personnel employed rose, particularly for the younger age group (18-24), mainly due to the recruitment of operating personnel for industrial sites in Italy including Viggiano, Livorno, Sannazzaro, Mantua and Ferrara. Still in Italy, in 2017, the number of terminations remained stable at 499, of which 408 permanent contracts (of which 16.7% were women).In 2017, 691 new hires were made abroad, of which 568 under per-manent contracts (of which 26.8% women) with 72.9% resources under the age of 40. As regards terminations, 1,019 contracts were terminated, of which 904 permanent contracts. Of these, 35.8% regarded resources under the age of 40, and 22.7% were women. Of the hires abroad, approximately 60% refer to the E&P business areas (Congo, Angola, Ghana, Indonesia e Norway) and the G&P business areas (France, UK and Hungary), with the aim of developing and promoting new initiatives and also to support turnover.Of total hires, approximately 33% refer to Local Companies in the Upstream business (total of 232, of which 167 permanent and 65 fixed-term) and in Refining & Marketing & Chemicals; 23% refer
to hires in the Gas & Power business area and the remaining 10% approximately refer to Eni financial companies. The balance be-tween hires and terminations abroad is -328 (+691 – 1,019) and this dynamic can be traced to the re-dimensioning of activities in the gas business in Hungary and the re-dimensioning/streamlin-ing, through the release of local and international resources in Up-stream activities in Nigeria, Turkmenistan, Pakistan, the Americas and the reinforcement of activities in Ghana, Mexico and Norway. Despite a reduction in local resources outside of Italy (-367 com-pared with the previous year), the percentage of local staff out of total employment abroad has increased since 2016, moving from 84.7% to 85.4%. Overall, in 2017, 1,234 hires were made, of which 992 with permanent contracts.Of these, 24.7% covered female staff and about 81% regarded re-sources under 40 years of age. In addition 1,518 contracts were terminated, of which 1,312 permanent contracts, and 20.8% re-garded female employees. 31.2% of the permanent contracts ter-minated in 2017 involved employees under the age of 40. A total of 1,717 expatriates work abroad (of which 1,234 Italians) slightly down since 2016 (-124 Italians). The average age of Eni people in the world is 45.3 years old (46.5 in Italy and 43.2 abroad) with an increase in the average age of 0.5 years compared to 2016. If we analyse the data divided by professional category (qualification), we can see that the aver-age age of the resources in positions of responsibility (senior and middle managers) is 49 years old (50 in Italy and 46.8 abroad). The average age is 44.2 years old (45.8 in Italy and 41.5 abroad) for white collar workers, whereas for blue collar workers it is 41.7 (40.5 in Italy and 43 abroad).
2015 2016 2017
Part-time employees 692 594 583
Senior managers employed 1,036 1,000 990
Middle managers employed 9,185 9,135 9,043
White collar workers employed 17,519 16,842 16,600
Blue collar workers employed 5,649 5,756 5,562
Average age 44.1 44.8 45.3
Employees aged 18 - 24 447 289 364
Employees aged 25 - 39 11,436 10,622 9,761
Employees aged 40 - 54 15,677 15,281 15,022
Employees aged over 55 5,829 6,541 7,048
Number of permanent hires 961 663 992
Number of terminations of permanent contracts 1,311 1,417 1,312
Turnover rate(b) % 6.6 6.1 6.8
Absentee rate (Italy) 5.35 5.73 5.49
(a) The calculation of employees in non-consolidated subsidiaries takes into account the number of total employees and not only Eni’s share of employees.(b) Ratio between the number of Permanent Hires + Terminations of Permanent Contracts and the number of total permanent employees in the previous year.
(continues)

E N I F O R 2 0 1 7 | S U S T A I N A B I L I T Y P E R F O R M A N C E10
In its policy for local personnel Eni defines reference salary levels in terms of minimum/maximum ranges, in relation to the market data for each individual Country, monitored annually using inter-national providers.The comparison between the minimum levels defined in Eni policies and the minimum market levels supplied by providers (1st decile
At the end of 2017, 7,580 women worked for Eni (23.54% of total em-ployees), of which 4,920 were in Italy and 2,660 abroad. In Italy, of the 424 permanent hires over the course of 2017, 21.9% (total 93) were female employees. It should be noted that in 2017 the replace-ment rate of women (ratio between permanent recruitment/ter-mination of permanent contracts) after falling in 2016 rose again, passing from 0.79 in 2015, to 0.43 in 2016 and then 0.90 in 2017. In 2015, the replacement rate for women employees was influenced by the effects of early hires in 2016 to seize on some opportuni-ties provided by current regulations and to reduce the number of contract terminations due to the raising of the retirement age (age and years of service). In 2017, the replacement rate returned to the levels of previous years, also due to the policies of the strategic
of local pay levels) from 2016 refers to the section of the workforce composed of middle managers, senior staff and white collar em-ployees. In 2017, the analysis was carried out on 30 Countries cho-sen from those most representative and which have market data available. The results show that the minimum levels defined in Eni’s policy are significantly higher than the market minimums.
plan associated with gender diversity. The percentage of women in positions of responsibility (Senior and Middle Managers) is also increasing, rising from 23.67% in 2015, to 24.06% in 2016 and reach-ing 24.86% in 2017.The results of the 2017 analysis of the gender pay gap at a global level show a substantial alignment (97%) between the pay of fe-male workers and that of male workers. There is a slight difference compared to previous years but it is statistically irrelevant. It has been used, as in previous years, a consolidated Eni method which neutralizes, in the pay comparison, any effects deriving from dif-ferences in role and seniority. In 2017, this measurement was con-ducted at a worldwide level on a sample of more than 90% of the Eni population (over 30,000 resources in over 50 Countries).
RATIO BETWEEN ENI MINIMUM WAGE POLICY AND MARKET MINIMUM WAGE (1ST DECILE)(MIDDLE MANAGERS - SENIOR STAFF - EMPLOYEES)
Ratio Countries
100 - 115 Italy, Belgium, France, Greece, Netherlands, Poland, United Kingdom, Romania, Spain, Switzerland, Hungary
116 - 130 Austria, Germany, Ireland, Tunisia
131 - 150 China, Ecuador, Norway, Russia, United States
151 - 180 Australia, Iraq
> 180 Algeria, Angola, Egypt, Indonesia, Kazakhstan, Nigeria, Pakistan, Vietnam
169 Global Average
2015 2016 2017
Women employees in service (%) 23.55 23.24 23.54
Women hired 25.39 25.34 24.70
Women in managerial positions (senior and middle managers) 23.67 24.06 24.86
- Senior managers 14.19 14.20 14.14
- Middle Managers 24.74 25.13 26.03
Replacement rate by gender 0.73 0.47 0.76
- Men 0.71 0.48 0.72
- Women 0.79 0.43 0.90
Pay gap
Pay gap senior managers (women vs men) 97% 98% 96%
Pay gap middle managers and senior staff (women vs men) 97% 97% 96%
Pay gap white collar workers (women vs men) 97% 97% 98%
Pay gap blue collar workers (women vs men) 97% 95% 97%
Total pay gap (women vs men) 97% 97% 97%
EQUAL OPPORTUNITIES

E N I F O R 2 0 1 7 | S U S T A I N A B I L I T Y P E R F O R M A N C E 11
The year 2017 was characterized by the consolidation of knowledge management activities through the streamlining of existing com-munities with the aim of strengthening the sharing processes on
In 2017 hours of training increased by 19% compared to 2016. This is mainly due to the increase in digital learning initiatives, in line with
complementary know-how areas. In line with the organization mod-el, there has been a gradual extension and strengthening of KM ini-tiatives on cross-cutting know-how and business support.
the latest training methods, using an integrated distance learning platform available to all employees.
2015 2016 2017
Attendances (number) 146,661 158,355 152,343
Training hours by type (hours) 1,079,634 930,345 1,111,112
- HSE and quality 317,562 309,284 401,094
- Languages and IT 121,314 105,480 124,266
- Conduct/Communication/Institutional 154,046 181,321 213,477
- Professional - cross-cutting 164,524 92,575 113,117
- Professional-technical/commercial 322,188 241,685 259,158
Training hours by professional category: 1,079,634 930,345 1,111,112
- Senior management 24,212 28,152 32,005
- Middle managers and senior staff 288,090 218,342 319,615
- White collar workers 553,075 526,538 580,864
- Blue collar workers 214,257 157,313 178,628
In house training(a) (%) 17.2 19.4 24.2
Training expenditures (€ million) 28.9 28.1 30.7
Training hours 1,079,634 930,345 1,111,112
- of which e-learning 177,609 195,311 232,399
- of which in class 902,025 735,034 878,713
(a) Including the contributions related to the companies not included in the perimeter, such as Saipem.
TRAINING
(number) 2015 2016 2017
Knowledge/Community network by application sector 67 68 64
- business 59 59 52
- cross cutting 8 9 12
Participants in the knowledge community/network by application sector 8,266 9,913 8,781
- business 7,558 8,935 6,597
- cross cutting 708 978 2,184
KNOWLEDGE MANAGEMENT
2015 2016 2017
Eni Global Engage – number of meetings broadcast online (number) 12 13 13
Eni Global Engage – access to online meetings (total clicks) 34,487 34,102 59,325(a)
Eni Global Engage – opinion on clarity of Eni objectives (max score 6) 4.8 4.9 5
MyEni(b) – enabled users on MyEni 24. 396 24,664 25,837
MyEni – coverage of MyEni users on no. of employees in service (%) 73 75 80(c)
(a) The figure includes 23,303 clicks on the event launching the Engage programme, which involved the participation of Eni’s CEO, organized for the first time in 2017. (b) Company intranet, the main instrument for internal communication and support in the daily activities carried out by Eni people.(c) % on total employees in service as of December 2017: 32,195.
ENGAGEMENT OF PEOPLE

E N I F O R 2 0 1 7 | S U S T A I N A B I L I T Y P E R F O R M A N C E12
In 2017, the internal communication plan was developed in 4 di-rections: Executive, Business, Digital and People Communication. Essential for the people engagement process were: - the company intranet MyEni, fully updated at the end of 2017,
saw a sharp increase in interaction and direct involvement by Eni people thanks to new methods of communication and to
In 2017, with reference to the performance assessment3 compared to 2016 highlights growing comprehensive coverage (+12%) on the target population (senior managers, middle managers and young graduates), confirming the intention to achieve full coverage of the population con-cerned, strengthening sensitivity towards transparent, goal-oriented management and assessment with the aim of continuous improve-ment. In particular, full coverage has been achieved for senior manag-ers, while coverage of middle managers and young graduates stand at 85% (+14% vs 2016) and 75% (+5% vs 2016) respectively.Compared to 2016, under the annual review4, the complete mapping of senior management through the management review and an in-crease of +2% of the target population (senior managers, middle man-agers, young graduates). Furthermore, there has been strong growth in the young graduate target (+6% at global level, associated in par-ticular with +9% in the foreign population), and with regard to the
the use of technologies;- events, which saw development towards more active partici-
pation by people and the involvement of specific targets such as the “Engage Programme” or the event "NOI the value of the team" for managers on the issue of leadership and enhance-ment of people.
population of other white collar workers (+14% at global level, due in particular to +22% recorded in the foreign population), demonstration of the gradual internalization of processes for greater involvement of the local population abroad.In the potential evaluation process5, 92% of Potential Assessments were carried out (using the methodologies of the Development Center, As-sessment Center and Focused Interviews), demonstrating an improve-ment trend at global level (+20% compared to 2016). In 2017, online-dis-tance assessment was introduced (approx. 100 resources involved) at international level, which has enabled logistical barriers to be overcome, with an overall reduction of travel costs, which is a benefit for the assess-ment activity. It is planned a gradual extension of this tool in other for-eign Countries, in order to promote a further extension of the tool.In 2017, over 120 resources (senior and middle managers) were as-sessed using Management Appraisal6.
(%) 2015 2016 2017
Employees covered by performance assessment tools (senior managers, managers, young graduates) 61 73(a) 85
- of which senior managers 99 100 100
Employees subject to annual review (senior managers, managers, young graduates) 89(b) 93 95
- of which senior managers 99 100 100
(a) 74% in 2016: the data of the three-year-period were recalculated because of the change in the perimeter of the consolidated entities.(b) 90% in 2015: the data of the three-year-period were recalculated because of the change in the perimeter of the consolidated entities.
ENHANCING PEOPLE
(number) 2015 2016 2017
Health Impact Assessments carried out 17 8 13
Employees included in health monitoring programmes 25,497 31,643 30,944
Number of health services provided - 484,984 450,398
- of which to employees - 349,763 297,480
- of which to contractors - 72,350 56,573
- of which to relatives - 56,677 79,687
- of which to others - 6,194 16,658
Number of registrations to health promotion initiatives - 27,424 56,765
- of which to employees - 18,245 34,458
- of which to contractors - 7,762 11,739
- of which to relatives - 1,417 10,568
OIFR Occupational Illness Frequency Rate (Eni total) 0.10 0.15 0.13
Number of occupational illnesses 125 133 120
- of which current employees 9 14 12
- of which to previous employees 116 119 108
HEALTH
3) Performance assessment: it is the main tool for the communication of corporate priorities and objectives, guidance for the activities orientation and continuous improvement of managerial and professional results and skills. It is aimed at the evaluation of the contribution provided and the results achieved during the year by the people and is one of the reference elements for the rewarding system. 4) Annual review: annual process aimed at expressing a synthetic resources evaluation that takes into account, in a coherent way, all the instruments/moments of observation/assessment of the year, identifying the population groups for the definition of targeted development actions.5) Potential assessment: the potential detection activities allow the collection of information related to personal skills and behaviors expressed at work also for the purpose of the timely identification of resources with high growth potential. The potential detection constitutes, in particular in the first period of working life, a fundamental support for the development of personal and professional skills and for the orientation towards growth paths with prevalent managerial or technical-professional content, coherent with the business needs.6) Management Appraisal: the methodology is aimed at individually evaluating a pool of resources belonging to the middle and senior managerial population (managers in development and senior managers for Italy, comparable figures abroad) to detect soft/managerial skills, level of expendability and potential of growth in relation to the roles to fill.
E N I F O R 2 0 1 7 | S U S T A I N A B I L I T Y P E R F O R M A N C E 13
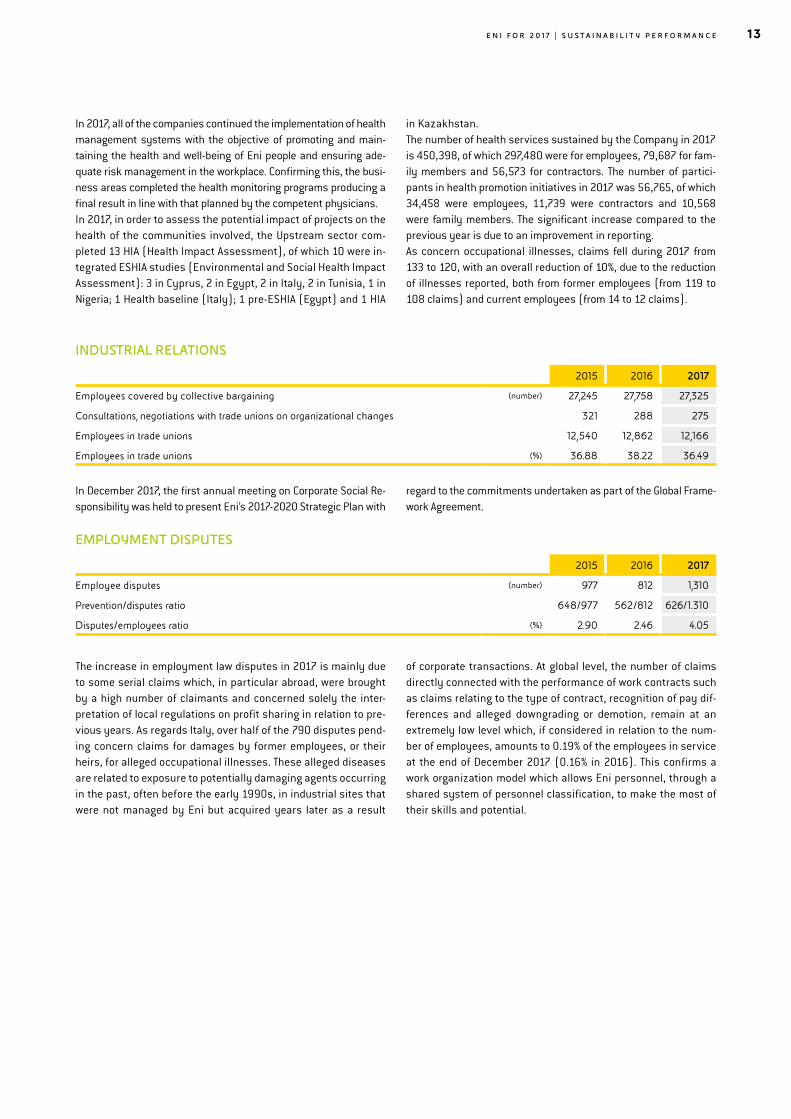
In 2017, all of the companies continued the implementation of health management systems with the objective of promoting and main-taining the health and well-being of Eni people and ensuring ade-quate risk management in the workplace. Confirming this, the busi-ness areas completed the health monitoring programs producing a final result in line with that planned by the competent physicians.In 2017, in order to assess the potential impact of projects on the health of the communities involved, the Upstream sector com-pleted 13 HIA (Health Impact Assessment), of which 10 were in-tegrated ESHIA studies (Environmental and Social Health Impact Assessment): 3 in Cyprus, 2 in Egypt, 2 in Italy, 2 in Tunisia, 1 in Nigeria; 1 Health baseline (Italy); 1 pre-ESHIA (Egypt) and 1 HIA
in Kazakhstan.The number of health services sustained by the Company in 2017 is 450,398, of which 297,480 were for employees, 79,687 for fam-ily members and 56,573 for contractors. The number of partici-pants in health promotion initiatives in 2017 was 56,765, of which 34,458 were employees, 11,739 were contractors and 10,568 were family members. The significant increase compared to the previous year is due to an improvement in reporting. As concern occupational illnesses, claims fell during 2017 from 133 to 120, with an overall reduction of 10%, due to the reduction of illnesses reported, both from former employees (from 119 to 108 claims) and current employees (from 14 to 12 claims).
2015 2016 2017
Employees covered by collective bargaining (number) 27,245 27,758 27,325
Consultations, negotiations with trade unions on organizational changes 321 288 275
Employees in trade unions 12,540 12,862 12,166
Employees in trade unions (%) 36.88 38.22 36.49
2015 2016 2017
Employee disputes (number) 977 812 1,310
Prevention/disputes ratio 648/977 562/812 626/1.310
Disputes/employees ratio (%) 2.90 2.46 4.05
INDUSTRIAL RELATIONS
EMPLOYMENT DISPUTES
In December 2017, the first annual meeting on Corporate Social Re-sponsibility was held to present Eni’s 2017-2020 Strategic Plan with
The increase in employment law disputes in 2017 is mainly due to some serial claims which, in particular abroad, were brought by a high number of claimants and concerned solely the inter-pretation of local regulations on profit sharing in relation to pre-vious years. As regards Italy, over half of the 790 disputes pend-ing concern claims for damages by former employees, or their heirs, for alleged occupational illnesses. These alleged diseases are related to exposure to potentially damaging agents occurring in the past, often before the early 1990s, in industrial sites that were not managed by Eni but acquired years later as a result
regard to the commitments undertaken as part of the Global Frame-work Agreement.
of corporate transactions. At global level, the number of claims directly connected with the performance of work contracts such as claims relating to the type of contract, recognition of pay dif-ferences and alleged downgrading or demotion, remain at an extremely low level which, if considered in relation to the num-ber of employees, amounts to 0.19% of the employees in service at the end of December 2017 (0.16% in 2016). This confirms a work organization model which allows Eni personnel, through a shared system of personnel classification, to make the most of their skills and potential.

E N I F O R 2 0 1 7 | S U S T A I N A B I L I T Y P E R F O R M A N C E14
| Safety7
| Environment
In 2017 there was a further significant reduction in the total record-able injuries rate of the workforce (-6.8% compared to 2016) both for employees (-17.2%) and contractors (-2%). There was one fatal accident involving a contract worker in Egypt caused by an electric shock due to accidental contact with live parts. In 2017, the number of injuries leading to days of absence (LTI) increased in Italy (36
events compared to 30 in 2016), with a worsening of the injury rates (+17.4% for the frequency rate and +24% for the total record-able injury rate) while abroad the rates fell significantly (-22.2% for the frequency rate and -17.9% for the total recordable injury rate). The lost day rate for the workforce rose by 10.3% (+2.5% in Italy, +37.1% abroad).
7) Gli indici infortunistici sono calcolati considerando i soli eventi classificati come Work Related.
2015 2016 2017
Total Recordable Injury Rate (TRIR) (recordable injuries/hours worked) x 1,000,000 0.45 0.35 0.33
- employees 0.41 0.36 0.30
- contractors 0.47 0.35 0.34
- Italy 0.61 0.51 0.64
- Abroad 0.40 0.31 0.26
Injury frequency rate (LTIF) (injuries/hours worked) x 1,000,000 0.20 0.23 0.21
- employees 0.19 0.30 0.27
- contractors 0.20 0.19 0.19
Lost day rate (days of absence/hours worked) x 1,000 0.009 0.010 0.011
- employees 0.012 0.017 0.019
- contractors 0.007 0.007 0.008
Fatality index (fatal injuries/hours worked) x 100,000,000 1.46 0.72 0.33
- employees - - -
- contractors 2.23 1.09 0.47
Number of fatalities 4 2 1
- employees 0 0 0
- contractors 4 2 1
Near misses (number) 1,489 1,643 1,550
Training hours on safety (hours) 256,793 249,467 323,765
- of which to senior managers 3,030 2,144 9,567
- of which to middle managers 41,407 30,532 67,293
- of which to white collar workers 135,609 148,150 174,016
- of which to blue collar workers 76,747 68,640 72,889
2015 2016 2017
OHSAS 18001 certifications (number) 107 103 101
ISO 14001 certifications 101 99 98
EMAS registrations 10 10 11
ISO 50001 certifications 13 18 21
Total HSE expenditure and investments (€ million) 1,066.00 1,101.62 1,101.01
- of which current costs 826.52 838.99 865.85
- of which investments 239.48 262.63 235.16
HSE MANAGEMENT SYSTEM CERTIFICATIONS AND EXPENSES

E N I F O R 2 0 1 7 | S U S T A I N A B I L I T Y P E R F O R M A N C E 15
In 2017, the total number of OHSAS 18001 and ISO 14001 certifi-cations was lower than in previous years due to variations to the consolidation area and the grouping of several operating companies under the same certificate. In 2017, 97% of subsidiaries with signifi-cant HSE risks were certified for both OHSAS 18001 and ISO 14001. The remaining companies that are not certified are in fact recent acquisitions and coverage for both certifications is forecast by the end of 2018 in most cases. The main production units of the R&M and Chemicals and G&P sectors completed EMAS registration and certification of the energy management systems under ISO 50001.In 2017, total HSE expenditures amount to approximately €1.1
billion, remaining stable compared to 2016.Safety expenditures, equal to around 23% of total HSE expenditure in 2017, have recorded a decrease in current costs (-27%), but an increase in investments (+55%), which mainly concerned the mod-ifications to plant and equipment (€48.4 million) and their main-tenance (€24.7 million). Environmental expenditures, equal to over 69% of total HSE expenditure in 2017, have increased by 29% compared to 2016 and are mainly attributed to remediation of land and groundwater (among which: emergency and operational safety measures, decommissioning and restoration for a total of €260.7 million) and waste management (€225.8 million).
2015 2016 2017
- of which Safety expenditures and investments 313.84 287.81 249.75
- of which current costs 234.77 239.48 175.08
- of which investments 79.07 48.32 74.68
- Total Environment expenditures and investments 625.86 588.65 756.16
- of which current costs 492.70 466.54 604.00
- of which investments 133.16 122.11 152.16
(continues)
2015 2016 2017
Total water withdrawals (Mm3) 1,804 1,851 1,786
- of which sea water 1,634 1,710 1,650
- of which freshwater 157 129 119
- of which freshwater from superficial water bodies 105 87 79
- of which freshwater from subsoil 25 23 20
- of which freshwater from urban net or tanker 7 9 10
- of which polluted groundwater treated at TAF plants and used in the production cycle 3 3 4
- of which freshwater withdrawal from other streams 17 7 6
- of which brackish water from subsoil or superficial water bodies 13 12 16
Total production water extracted (E&P) 67 65 67
Production water re-injected (E&P) (%) 56 58 59
Freshwater recycled 82 84 86
Freshwater discharged (Mm3) 120 104 95
Sea water discharged 1,539 1,634 1,552
Expenditures on water resources and discharges(a) (€ million) 82.29 75.45 99.73
- of which current costs 66.60 53.56 73.61
- of which investments 15.69 21.89 26.11
Expenditures for protection of ecosystems and biodiversity(a) 3.98 3.90 5.25
- of which current costs 3.98 3.90 5.25
- of which investments 0.00 0.00 0.00
(a) Data included in the environmental expenditures and investments set out in the “HSE Management System Certification and Expenses” table.
PROTECTION OF WATER AND BIODIVERSITY

E N I F O R 2 0 1 7 | S U S T A I N A B I L I T Y P E R F O R M A N C E16
In 2017, total water withdrawals fell by 3.5% compared to 2016 due to the fall in sea water withdrawals (-3.5%) and the continued fall in freshwater withdrawals (-7.9%).The reduction in sea water withdrawals (of over 65 Mm3) is mainly associated with some maintenance stoppages at the petrochemical plant in Porto Marghera and at the EniPower power station in Raven-na with the positive effects from the improved performance of the desalination plant at the EniPower power station in Brindisi. The re-duction in freshwater withdrawals is essentially due to the start of a tank to recycle industrial water in the petrochemical plant in Mantua.
In 2017, the number of barrels spilled in operational oil spills (more than 90% referable to the E&P sector) has increased com-pared with 2016, mainly due to losses from a crude oil storage tank in the Centro Olio Val d’Agri identified at the start of Febru-ary. By the end of 2017 more than 2,400 barrels of oil had been recovered, almost the total volume of the spill from the tank. As a consequence of this event, the E&P rate of operational/produc-tion oil spill increased significantly to 3.04 barrels/million bar-
In 2017, the percentage of fresh water recycled increased across all the sectors, with Eni’s rising to 86.1%. Moreover, even though more than 50% of the E&P withdrawals concern water stressed Countries, only 5% of Eni’s fresh water withdrawals occurred in these areas. Local Plans for water management are implemented at sites with the highest consumption. In the E&P sector, the percentage of pro-duction water re-injected reached 59% in 2017, mainly due to the re-opening of the Abu Attifel production field in Libya (MOIG) and maintaining the re-injection levels in Egypt (Petrobel) and Ecuador (Agip Oil Ecuador).
rels. In 2017, there was a reduction in the number of incidents by sabotage (-35% compared to 2016) and volume spilled (-31% compared to 2016); spills over a barrel are exclusively related to upstream activities in Nigeria, where, thanks to the commitment deployed to deal with these events, an 18% decrease was record-ed in barrels spilled and a 29% decrease in events. The barrels spilled as a result of the chemical spill in 2017 are attributed to the E&P activity in Norway.
2015 2016 2017
Operational Oil spills
Total number of oil spills (> 1 barrel) (number) 83 85 55
- of which E&P 59 76 50
Volume of oil spills (> 1 barrel) (barrels) 1,634 1,231 3,228
- of which E&P 1,177 1,097 3,022
Operational oil spills/100% operated hydrocarbon gross productions (E&P) (barrels/million barrels) 1.3 1.2 3.0
Oil spills due to sabotage (including theft)
Number of oil spills (> 1 barrel) (number) 167 158 102
- of which E&P 158 143 102
- of which R&MC 9 15 0
Volume of oil spills (> 1 barrel) (barrels) 14,847 4,682 3,236
- of which E&P 10,530 3,953 3,236
- of which R&MC 4,317 729 0
Chemical spills
Number of chemical spills into the environment (number) 43 24 17
Volume of chemical spills into the environment (barrels) 1,211 18 63
Spill prevention expenditures and investments(b) (€ million) 39.45 37.08 53.35
- of which current costs 8.75 15.67 27.64
- of which investments 30.70 21.40 25.72
(a) In line with international standards all the values above refer to events involving more than 1 barrel. The data referring to sabotage includes oil spills due to attempted oil theft and vandalism.(b) The value is included in the environmental expenditures and investments set out in the “HSE Management System Certification and Expenses” table.
MANAGING SPILLS(a)

E N I F O R 2 0 1 7 | S U S T A I N A B I L I T Y P E R F O R M A N C E 17
In 2017, NOx emissions , of which 79% is referred to E&P remained around the same (-0.7%) compared to 2016 since the increase in E&P was offset by decreases in other sectors. In E&P in particu-lar, emissions have increased in absolute terms (+1,202 tNO2eq in relation to the growth in production and flaring emissions), but production emissions have fallen (-7% for the related rate), while the G&P and R&MC sectors recorded a fall in both absolute terms (-1,173 tNO2eq in G&P and -425 tNO2eq in R&MC) and with regard to production (-6% due to the specific emission factor of EniPow-er, thanks to the high running of plants and full operation of the VeLoNOx burners). SOx emissions fell yet again (-6.5%, equal to approximately -580 tSO2eq compared to 2016). The trend is main-ly attributable to the E&P sector where the emissions dropped significantly in Libya (over -1,770 tSO2eq due to the fall in flaring at the Mellitah Complex). Emissions also fell in G&P (-30% due to
Waste from production activities generated in 2017 increased by 70% compared to 2016, due both to the contribution of hazardous waste (more than doubled) and non-hazardous waste (+30%). The growth (over 80%) can be traced to the significant increase in hazardous waste from activities linked to drilling, completion and work over for the start of the Zohr project. The disposal of wa-
the site stoppage lasting several months for LNG Shipping ves-sels). In the R&MC sector, where the parameter increased overall (+18.9%), a significant drop in emissions in Versalis was recorded (-60%), due to the reduction in the use of low sulphur oil in the boilers at the Dunkirk site to improve performance of the crack-ing plant, and a growth trend at refineries (+22.6% equal to over +940 tSO2eq) particularly due to the contribution of Sannazzaro (different type of crudes processes), Taranto (stoppages and restarts due to maintenance work and a different processing cycle structure for the RHU) and Livorno (annexing of the EniP-ower power station during 2016). NMVOC and TSP emissions have grown (+34.8% and +2.9% compared to 2016, respectively), exclu-sively due to the trends in the E&P sector where emissions have increased in relation to the increases in production and flaring emissions. Both parameters in all the other sectors are falling.
ter discharges previously sent to the consortium plant as waste and the new structure of the Centro Oli Val D’Agri at the Southern District also had an impact on the sector trend. Waste from pro-duction activities also recorded an increase in the R&MC sector (+32.8%, equal to over 53,000 tonnes), while it fell significantly in G&P (-41.3% equal to approximately -4,650 tonnes). In R&MC,
2015 2016 2017
NOx (nitrogen oxides) emissions (tonnes NO2eq) 70,346 56,003 55,607
NOx emissions/100% operated hydrocarbon gross production (E&P) (tonnes NO2eq/toe) 0.453 0.327 0.303
NOx emissions of NOx/kWheq (EniPower) (g NO2eq/kWheq) 0.138 0.125 0.117
SOx (sulphur oxides) emissions (tonnes SO2eq) 10,707 8,946 8,368
SOx emissions/100% operated hydrocarbon gross production (E&P) (tonnes SO2eq/toe) 0.034 0.035 0.022
SOx emissions/kWheq (EniPower) (g SO2eq/kWheq) 0.0009 0.0010 0.0003
SOx emissions/crude oil processing and semi-processed oil (refineries)(a) (tonnes SO2eq/kt) 0.294 0.212 0.281
NMVOC (Non Methane Volatile Organic Compounds) emissions (tonnes) 20,559 15,944 21,498
TSP (Total Suspended Particulate) emissions (tonnes) 1,823 1,447 1,488
Air protection expenditures and investments(b) (€ million) 51.27 47.18 55.07
- of which current costs 20.98 22.08 22.82
- of which investments 30.29 25.10 32.25
(a) The index refers to traditional refineries: Livorno, Sannazzaro, Taranto and Gela in 2014; Livorno, Sannazzaro and Taranto since 2015.(b) The value is included in the environmental expenditures and investments set out in the “HSE Management System Certification and Expenses” table.
AIR PROTECTION
2015 2016 2017
Total waste from production activities (tonnes) 1,230,364 804,865 1,364,157
- of which from drilling activities 308,306 225,454 518,114
Hazardous waste from production activities 323,078 256,813 650,308
Non-hazardous waste from production activities 907,286 548,052 713,849
Expenditures and investments in waste management(a) (€ million) 139.23 133.80 225.80
- of which current costs 138.51 133.71 199.76
- of which investments 0.73 0.09 26.03
(a) Data included in the environmental expenditures and investments set out in the “HSE Management System Certification and Expenses” table.
WASTE

E N I F O R 2 0 1 7 | S U S T A I N A B I L I T Y P E R F O R M A N C E18
the trend is mainly attributed to the refineries of Taranto, Gela and Venice, as well as the Versalis plants in Porto Marghera, Ragusa and Porto Torres. In G&P, the fall is mainly due to trends in the Eni-Power sites of Ravenna, Bolgiano and Livorno. In 2017, 7% of haz-ardous waste disposed of by Eni was recovered/recycled, 2% was subjected to chemical/physical treatment, 44% was incinerated, 2% was disposed of in waste dumps and the remaining 45% was
sent for other types of disposal (including transfer to temporary storage plants prior to final disposal). With regard to non-haz-ardous waste, 11% was recovered/recycled, 3% was subjected to chemical/ physical treatment, 0.4% was incinerated, 11% was dis-posed in waste dumps and the remaining 75% was sent for other types of disposal (including transfer to temporary storage plants prior to final disposal).
Expenditure on Eni remediation in 2017 (over 1,000 procedures opened including Sites of National Interest - refineries, petrochemical plants and disused sites -, points of sale in the R&MC sector and well fields in the E&P sector) amounted to €261 million, equal to 24% of total HSE expenditure and mainly concerned the groundwater reme-diation (67%). The most relevant projects (54% of total expenditure) were carried out by Syndial, a company dedicated to remediation of contaminated disused sites through agency contracts for a total of
around €120 million. The contribution of the R&MC sector was also significant with 43% of total expenditure. In 2017, a total of 4.8 million tonnes of waste was generated by remediation activities (of which 4.1 million by Syndial), of which about 70% was groundwater. The quantities of waste generated in 2017 (over 98% non-hazardous waste) have dropped by 15% compared to 2016, in relation to the drop in groundwater (-24%). The quantities of waste from remediation re-covered or recycled in 2017 increased by 27% compared to 2016.
2015 2016 2017
Waste from remediation activities (tonnes) 5,940,604 5,687,487 4,831,061
- of which hazardous 104,602 71,603 92,078
- of which non hazardous 5,836,003 5,615,884 4,738,983
Soil and groundwater remediation expenditures and investments(a) (€ million) 210.83 233.90 260.69
- of which current costs 206.94 223.81 254.70
- of which investments 3.89 10.09 6.00
(a) Data included in the environmental expenditures and investments set out in the “HSE Management System Certification and Expenses” table.
REMEDIATION

E N I F O R 2 0 1 7 | S U S T A I N A B I L I T Y P E R F O R M A N C E 19
In 2017, Eni’s economic investment in scientific research and tech-nological development activities amounted to €185 million. In ad-dition to small increases in the expenditure of many R&D projects, the increase of €24 million (+7%) is mainly due to an increase of the expenditure on the Energy Transition Program launched in 2016 and on some projects in the field Upstream/Downstream. Within the Energy Transition Program three new projects were launched and some projects implemented in 2016 required more investments as a result of greater maturity of the technologies under development. The CO2 capture and production of micro algae biofuels project start-ed in 2016, in 2017 the installation and start-up of the Ragusa pi-lot plant has been carried out. Some projects related to three core themes of the Upstream business (EOR advanced recovery and wa-ter subsoil of co-production control, drilling safety and technologi-cal solutions for submarines developments) sustained increasing investments in comparison with 2016. The value created in 2017 by the innovative Eni technologies and products was estimated at €914 million, a fall from €1,395 million in 2016. In 2017, % of the value of benefits generated by R&D was realized during the year, a value in line with the 70% of 2015 but 27% higher than 2016. The to-tal decrease in benefits and the substantial difference in the ratio of benefits realized over the year against expected benefits can be at-tributed to the presence of expected benefits from the development of the Zohr field in the 2016 values. With regard to Intellectual Prop-erty in support of technological innovation, in 2017 a total of 27 new patent applications were filed, 11 of which are directly concerned with developing technologies in the field of renewable energy sourc-es (biofuels and solar) and 1 is focused on innovative methods for processing contaminated water and soil. This datum, a decrease on
previous years, while maintaining a high level of innovation in the sectors of renewables and environment, is influenced by normal statistical variation and by a greater orientation of the business towards the industrial exploitation of the research results, typically characterized by lower patent intensity, also confirmed by the rise in the total number of patents in the portfolio (6,631) as a result of greater investment in territorial coverage of the protection of propri-etary technologies. The average age of the portfolio is essentially in line with the previous two years as a result of monitoring and updat-ing activities carried out on the portfolio in order to keep it consis-tent with Eni’s industrial and business strategies, as well as those of its subsidiaries. Continuing the commitments launched in 2016, the Knowledge Management (KM) 2017 strategy was focused on the quality of the contents shared on the Knowledge Management Sys-tem portal (#KMS) and the level of diffusion of the tools and sharing culture. At the same time as the implementation of new methods aimed at increasing the quality of information and quantifying its value, an increase in the number of Impacting Knowledge increased in 2017, both at total level and with regard to those considered stra-tegic. In 2017, 2,035 Impacting Knowledge items mainly focused on issues related to fields, drilling, production and facilities were published on #KMS. Lastly, focus on quality in 2017 led to a growth of 66% (compared to 2016) in the number of Impacting Knowledge items considered strategic, i.e. concerning those issues that are considered important by the Managers of the different businesses active in #KMS, reaching 1,165. At the same time, an increase in the number of users was recorded for the #KMS portal (+28.5% com-pared to 2016), i.e. Eni people who shared know-how first hand, of which 1,817 from Business Units.
| Research and Development
2015 2016 2017
R&D expenditures (€ million) 176 161 185
Tangible value generated by R&D 734 1,395 914
First patent filing applications (number) 33 40 27
- of which filed on renewable sources 16 12 11
Existing patents (number) 6,217 6,314 6,631
Average age of patents (years) 8.93 9.05 9.10
R&D expenditures by typology(a) (€ million)
- Other, of which exploration - 66.5 70.5
- Safety and risk reduction - 17.1 26.4
- Environment - 14.6 15.6
- of which related to decarbonization - 63 72
Number of partnerships on R&D(b): (number) 953 874 1,033
- of which with Universities and Research Centers 164 131 233
Number of active users in #KMS(c) 949 1,806 2,321
Impacting Knowledge in #KMS(d) 1,176 1,943 2,035
- of which linked to Strategic Tags(e) - 700 1,165
(a) A reorganization of the research activities with the launch of the Energy Transition Program makes this classification meaningful from 2016 only. (b) Partnerships consider purchase orders relating to goods and services that are functional to R&D activities in Eni SpA, EniProgetti SpA and Versalis SpA. (c) The number of active users reports the number of unique users who have written at least one post in #KMS over the year. (d) Impacting Knowledge includes Knowledge Nuggets, KM Webinars, Innovation Idea Management and Application of Innovative Technologies.(e) Impacting Knowledge referring to issues that are considered strategic for the business lines active in #KMS. Strategic Impacting Knowledge was introduced in 2016 as the KPI representing the quality of the contents.

E N I F O R 2 0 1 7 | S U S T A I N A B I L I T Y P E R F O R M A N C E20
| Human Rights
2015 2016 2017
Hours of training on human rights(a) (number) 32,588 88,874 7,805
- of which in class 0 354 52
- of which e-learning 32,588 88,520 7,753
Attendances in human rights training courses 8,147 22,307 2,084
Employees trained on human rights 7,545 21,682 1,836
Security contracts containing clauses on human rights(b) (%) 85 91 88
Critical sites covered by assessments/surveys (number) 35 35 53
Sites verified by means of a check list 258 295 311
Countries with armed guards protecting sites 7 8 7
Security personnel trained on human rights 61 53 308
Security personnel (professional area) trained on human rights(c) (%) 78 83 88
(a) Including issues related to consultation and/or compensation processes and increase in conflicts.(b) Including discrimination, violations of labour union rights, forced labour, child labour and unfit working conditions (including harassment and mobbing, salaries less than minimum wage and/or undignified salaries).(c) It is an aggregated percentage at 2017.
2015 2016 2017(b)
Reports (assertions) on human rights violations (closed during the year and divided by result of investigation and by type), of which:
31 36 29 (32)
- justified 3 11 3
- potential socio-economic impacts on local communities(c) 0 0 0
- potential impacts on health, safety and/or well-being of local communities(d) 0 1 0
- potential impacts on worker rights(e) 3 9 3
- potential impacts on workplace health and safety(f) 0 1 0
- unfounded, with the adoption of improvement measures 10 6 9
- potential socio-economic impacts on local communities(c) 0 0 0
- potential impacts on health, safety and/or well-being of local communities(d) 0 0 0
- potential impacts on worker rights(e) 7 6 8
- potential impacts on workplace health and safety(f) 3 0 1
- unfounded/generic 18 19 20
- potential socio-economic impacts on local communities(c) 2 0 0
- potential impacts on health, safety and/or well-being of local communities(d) 1 1 2
- potential impacts on worker rights(e) 14 14 15
- potential impacts on workplace health and safety(f) 1 4 3
(a) Whistleblowing report means any report received by Eni, concerning conduct (of any kind, including mere omissions) of Eni personnel or third parties in violation of (i) the Code of Ethics, (ii) any laws or regulations or provisions of the authority or internal regulations or in any case likely to cause damage or prejudice to Eni, even if only to its public image.(b) In 2017, the results of the checks carried out on the single report violation were presented (one report can contain 1 or more assertions) with a potential impact on Human Rights. Otherwise, for the years 2015 and 2016 the overall results of the reports were represented. These results were not necessarily in reference to the specific aspects related to potential impacts on Human Rights.(c) Including issues related to consultation and/or compensation processes and increase in conflicts.(d) Including spills, atmospheric pollution, accidents, etc.(e) Including discrimination, violations of labour union rights, forced labour, child labour and unfit working conditions (including harassment and mobbing, salaries less than minimum wage and/or undignified salaries).(f) Including unhealthy and/or insecure workplace environments.
WHISTLEBLOWING REPORT(a) ON HUMAN RIGHTS VIOLATIONS

E N I F O R 2 0 1 7 | S U S T A I N A B I L I T Y P E R F O R M A N C E 21
| Transparency and anti-corruption
In 2017 the specific e-learning training campaign on Human Rights continued, bringing on board, in addition to the 22,000 people in-volved in Italy and abroad, a further 1,500 people. In 2017, 3 Human Rights modules were developed in the areas of Human Resources, Relations with the Territory and Security, which are expected to be de-livered starting from 2018. The Procurement module was also devel-oped. In addition, since 2008, Eni SpA and its subsidiaries have carried out 172 Human Rights Assessments (of which 162 follow-up) on Eni suppliers at 14 sites and have trained 41 people as qualified SA8000 Auditors. With regard to whistleblowing reports, in 2017 investigations were completed on 83 files, 29 of which included human rights as-pects, mainly concerning potential impacts on workers’ rights.
A primary role in the process to verify and assess the internal con-trol and risk management system (SCIGR) is assigned to the Inter-nal Audit function, which carries out audits (operational, financial and compliance audits with focus on elements of Italian Legislative Decree no. 231/01 and Anti-Corruption compliance) to implement the Annual plan of activities drafted with a “top-down risk based” approach and approved, together with the resources budget, by the Board of Directors and, for elements relevant to Italian Legislative Decree no. 231/01, by the Eni SpA Watch Structure. With reference to the main activities performed by the Internal Audit department, it is noted that i) the number of integrated audits conducted under the 2017 Plan is in line with the average for the three-year period. As in previous years, the average duration of the audits has been affected by the incorporation into the same of the Anti-Corruption audits and independent monitoring carried out in order to comply with the Sarbanes-Oxley Act; ii) 2017 also saw the continuation of training initiatives in relation to the SCIGR directed at Eni SpA’s management and the main subsidiaries in Italy and abroad. These initiatives aim to provide an organic and integrated vision of the SCIGR and develop awareness of the role of management in the implementation and operation of an effective and efficient SCIGR. In particular, in 2017 “on site” workshops were delivered in about
Among these, 32 assertions were checked: the events reported were confirmed, at least in part, for only 3 of these, and actions were taken to mitigate and/or minimize the impacts including: i) actions on the Internal Control and Risk Management System, relating to the implementation and strengthening of the controls in place, updating of contractual standards and actions to raise awareness with reference to business partners; and ii) actions against employees, including disciplinary measures, in accor-dance with Model 231 and the collective labour agreement and other national laws applicable. At the end of the year 19 files were still open, 5 of which referred to human rights aspects, in particu-lar potential impacts on workers’ rights.
17 Countries in addition to Italy and the related e-learning course continues to be provided. During 2017, 36 audits were carried out in 23 Countries, with anti-corruption checks that confirmed the over-all adequacy and effective operation of the anti-corruption compli-ance program.Online courses (e-learning) and class training events (general workshops and job specific training) are provided to Eni person-nel on anti-corruption. General workshops are carried out by the anti-corruption unit, taking into account the Corruption Perception Index published annually by Transparency International and Eni’s presence in the individual sites. The workshops offer a general overview of the anti-corruption laws applicable to Eni, the risks that could result from their infringement for natural and legal persons and the Anti-Corruption Compliance Program that Eni has adopted to address these risks, using an interactive and engaging format based on case studies with multiple choice questions, in order to test the level of understanding of the issues covered. Job specif-ic training is training for professional areas particularly at risk in terms of corruption and it is general provided together with general workshops.In 2017, some training sessions were provided for Eni boards (so-called board induction and ongoing training). These included spe-
2015 2016 2017
Integrated audits (number) 63 68 68
- scheduled audits 54 57 59
- spot audits 3 4 3
- follow-ups 6 7 6
Audit actions on risk of corruption activities 29 33 36
Number of recommendations (corrective actions) 677 657 705
E-learning for managers 1,865 865 493
E-learning for other resources 7,016 9,364 1,857
General Workshop 886 1,269 1,434
Job specific training 693 1,214 1,539
Countries where Eni supports EITI’s local Multi Stakeholder Groups 7 8 9
INTERNAL CONTROL AND RISK MANAGEMENT SYSTEM

E N I F O R 2 0 1 7 | S U S T A I N A B I L I T Y P E R F O R M A N C E22
cific training on Integrated Compliance, with a focus on anti-brib-ery. In 2017, the anti-corruption e-learning campaign continued, adding to the very extensive campaigns launched in 2015 aimed at training the entire company population; these campaigns are
In 2017, 105 whistleblowing reports8 were received and 73 files were opened, of which 58 concern issues relevant to the “Internal Control and Risk Management System”9 and 15 of which relate to “Other matters”10. In the same period, 83 files were archived in total, 61 of which concerned the “Internal Control and Risk Management System” and 22 concerned “Other matters”. The checks carried out on 83 archived files resulted in the following outcomes: i) for 73 files the checks did not find any evidence to confirm the facts reported, nevertheless for 35 files improvement actions were taken in any case; ii) for 10 files the checks confirmed, at least in part, the contents of the reports and the appropriate corrective actions were adopted. The 8 files concerning the “Internal Control and Risk Man-agement System” mainly refer to: violations of the contractual obli-
gradually being completed, thus ensuring full coverage in terms of training for all Eni people. The performance data for class-based learning show an increase, reflecting the company’s desire for even greater oversight of the areas at risk of corruption.
gations by commercial partners/suppliers, anomalies in the award-ing and management of contracts at subsidiaries, and improper behaviour of employees. The corrective actions adopted as a result of these files mainly consisted in actions on the Internal Control and Risk Management System, such as, for example, the formalization of procedures, raising awareness of employees, suppliers and com-mercial partners on following procedures and observing contractu-al provisions, strengthening existing controls and actions relating to employees, such as disciplinary measures in accordance with the Model 231 and the collective labour agreement and other applica-ble national standards. As of 31st December, 2017 there were still 16 files open related to the “Internal Control and Risk Management System” and 3 files concerning “Other Matters”.
8) Whistleblowing report means any report received by Eni, concerning conduct (of any kind, including mere omissions) of Eni’s personnel or third parties in violation of (i) the Code of Ethics, (ii) any laws or regulations or provisions of the authority or internal regulations or in any case likely to cause damage or prejudice to Eni, even if only to its public image. In order to process them and for their investigation, Whistleblowing Reports are divided into SCIGR Reports and AM Reports.9) SCIGR Reports - Reports concerning the Internal Control and Risk Management System: these are, for the effective maintenance of Eni's Internal Control and Risk Management System, all those Reports relating to non-compliance with laws and external regulations and rules included in Eni's internal regulatory system, including (i) cases of fraud against the company's assets and/or in corporate reporting, (ii) events that, at least theoretically, may result in administrative liability under Italian Legislative Decree No. 231/2001 or under similar regulations in terms of corporate responsibility, and (iii) possible facts of corruption (active or passive) or violation of legal anti-corruption regulations.10) AM Reports - Reports concerning other matters in violation of the Code of Ethics. These include all Reports relating to the violation of rules and principles contained in the Code of Ethics (for example, issues relating to business ethics, bullying, harassment, discrimination, conflicts related to personnel management), which do not also result in SCIGR Reports.
2015 2016 2017
Report files opened during the year, of which (number) 64 103 73
Internal control and risk management system reports divided according to the process that is the subject of the report
52 73 58
- procurement 16 17 12
- human resources 8 10 8
- commercial 8 10 10
- logistics 3 6 4
- HSE 2 4 3
- others (security, administration and financial reporting, maintenance, ...) 15 26 21
Reports on other matters relating to alleged violations of the Code of Ethics 12 30 15
Report files that have been closed during the year divided according to the outcome of the investigations, of which:
98 111 83
- justified 7 27 10
- other matters 2 9 2
- internal control and risk management system 5 18 8
- unfounded, with the adoption of improvement measures 38 36 35
- other matters 6 11 8
- internal control and risk management system 32 25 27
- unfounded/generic 53 48 38
- other matters 26 18 12
- internal control and risk management system 27 30 26
(a) Data related to reports contained in this section refer to reports regarding Eni SpA and its subsidiaries.
WHISTLEBLOWING MANAGEMENT(a)

E N I F O R 2 0 1 7 | S U S T A I N A B I L I T Y P E R F O R M A N C E 23
The strategy adopted in Community Investment aims to cover a range of initiatives that can meet the actual needs of local people. In this direction, spending in 2017 amounted to €70.7 million (approx-imately 97% in upstream). Greatest spending was in Asia with about €34 million (mainly Kazakhstan €27 million and Turkmenistan €5 million): for professional training, school infrastructure (nursery
schools and primary schools), sports centers and miscellaneous infrastructure maintenance (bridges and roads). In Africa a total of €23 million was spent, of which €18 million in Sub-Saharan Africa (Nigeria €9 million, Congo €4 million, Gabon €1.7 million, Ghana €1.5 million) for professional training and agricultural development projects and €5 million in North Africa (Libya €4 million).
COOPERATION MODEL
SUPPLIERS & CUSTOMERS
2015 2016 2017
Community investment by sector of intervention (€ thousand)
- Access to energy 1,374 571 1,130
- Water and sanitation 1,420 880 698
- Economic diversification 44,385 27,907 30,230
- Education and training 11,004 16,818 17,344
- Life on land 5,039 7,602 3,646
- Livelihood restoration & resettlement 2,535 5,367 7,463
- Health 7,203 2,938 7,038
- Stakeholders and sustainability management 3,510 2,093 3,132
Community investment by geographical area
- Africa 27,698 14,774 22,901
- Americas 4,085 5,593 4,925
- Asia 35,569 33,490 34,259
- Italy 7,390 9,192 7,005
- Rest of Europe 1,520 976 1,432
- Oceania 208 149 159
Overall total 76,470 64,174 70,681
Number of suppliers awarded contracts in 2017 (number) 9,417
Suppliers by geographical area in 2017 (%)
- Africa 21
- Americas 8
- Asia 6
- Italy 32
- Rest of Europe 32
- Oceania 1
SUPPLIERS
2015 2016 2017
Suppliers subjected to assessment regarding social responsibility aspects (number) 5,114 5,171 5,055
- of which suppliers with criticalities/areas for improvement 721 1,336 1,248
- of which suppliers with whom Eni has terminated relations 97 131 65
SUPPLIER ASSESSMENT

E N I F O R 2 0 1 7 | S U S T A I N A B I L I T Y P E R F O R M A N C E24
During 2017, more than 5,000 suppliers were subject to checks and assessment with reference to sustainability aspects (i.e. health, safety, environment, human rights, anti-corruption and compliance). For 24% of these suppliers, potential criticalities and/or possible areas for improvement were identified; in 95% of cases these were not serious enough to compromise the pos-sibility of working with them, while for the remaining 5% of sup-pliers checked, the criticalities revealed led to the pro-tempore
suspension of relations with Eni. In 2017, criticalities were iden-tified on 1,248 suppliers (the sharp rise between 2015 and 2016 is linked to the greater thoroughness of the checks), for 65 of these the assessment at the qualification stage was negative or Eni issued an instruction suspending or revoking the qualifica-tion; the 2017 figure shows a drop compared to previous years, reflecting the reduced number of investigations for unlawful conduct involving Eni suppliers.
11) It became the Authority Regulating Electricity, Networks and the Environment (ARERA) on 1st January 2018.
The Eni call center results from 2017 confirm a service level exceed-ing the 80% benchmark laid down by the Authority for Electricity, Gas and Water System (AEEGSI)11, the average call waiting time remains substantially below the Authority’s benchmark, 104 seconds instead of 240 seconds. The number of requests resolved on the first call (First Call Resolution - FCR) remained stable at 93%. Furthermore, in this area
In 2017, Eni continued with the program of initiatives aimed at increasing the level of customer satisfaction and outlining a reference model for the quality of the gas and electricity ser-
a considerable increase was recorded in the number of operations car-ried out independently (self care), from 69% in 2016 to 73% in 2017. Eni has conducted a Customer Satisfaction survey since 2013 to mon-itor the daily level of satisfaction of customers that use the call center, interviewing a representative sample of customers, which in the last year reached nearly 200,000 customers.
vice. In this scenario the average assessment of customers on service performance continues its growth trend, recording a score of 86.7% in 2017.
2015 2016 2017AEEGSI
standard
% of customers who called and spoke to an operator (service level) 96.8% 97.5% 95.5% 80%
Average hold time (seconds) 91 103 104 240
First Call Resolution (FCR) 93% 94% 93% -
Self Care (operations performed autonomously by customers on the total of operations requested)
63% 69% 73% -
ENI CALL CENTER PERFORMANCE
| Relations with customers and consumers
| Satisfaction of G&P customers regarding telephone services
2015 2016 2017
Clarity (%) 84.2 85.3 86.2
Courtesy 87.9 88.8 89.7
Wait time 84.6 84.5 84.4
Resolution 77.2 80.1 81.4
Satisfaction with service 79.9 81.4 82.4
Average assessment 85.6 86.2 86.7
(a) The assessment of the service, with the exception of questions related to resolutions, is measured on a scale from 0 to 100.
SERVICE ASSESSMENT(a)
Eni SpA
Registered OfficePiazzale Enrico Mattei, 1 - Rome - ItalyShare capital: € 4,005,358,876.00 fully paid-upBusiness Register of Rome, taxpayer’s code 00484960588
Other BranchesVia Emilia, 1San Donato Milanese (MI) - Italy
Piazza Ezio Vanoni, 1San Donato Milanese (MI) - Italy
Page layout and supervisionK-Change Srl - Rome - Italy
PrintTipografia Facciotti Srl - Rome - Italy
Printed on XPer Fedrigoni paper

S U S T A I N A B I L I T Y P E R F O R M A N C E
E N I F O R 2 0 1 7
Gr
ee
n D
at
a C
en
ter
-
Fe
rr
er
a E
rb
og
no
ne
*00199* *00200*
*00201* *00202*
*00203* *00204*
*00205* *00206*
*00207* *00208*
*00209* *00210*
*00211* *00212*
*00213* *00214*
*00215* *00216*
Guida dell’azionista 2018 ITA
Relazione Finanziaria 2017 ITA Annual Report 2017 ENG
Fact Book 2017 ITA Fact Book 2017 ENG
Eni For 2017 ITA Eni For 2017 ENG
Eni In 2017 Annual Report on Form 20F 2017 ENG
Relazione sul Governo Societario 2017 ITA Relazione sul Governo Societario 2017 ENG
Relazione sula Remunerazione 2018 ITA
Decarbonizzazione Eni For 2017 ITA Decarbonizzazione Eni For 2017 ENG
Performace Eni For 2017 ITA Performance Eni For 2017 ENG
Relazione sula Remunerazione 2018 ENG
Guida dell’azionista 2018 ING
*00199* *00200*
*00201* *00202*
*00203* *00204*
*00205* *00206*
*00207* *00208*
*00209* *00210*
*00211* *00212*
*00213* *00214*
*00215* *00216*
Guida dell’azionista 2018 ITA
Relazione Finanziaria 2017 ITA Annual Report 2017 ENG
Fact Book 2017 ITA Fact Book 2017 ENG
Eni For 2017 ITA Eni For 2017 ENG
Eni In 2017 Annual Report on Form 20F 2017 ENG
Relazione sul Governo Societario 2017 ITA Relazione sul Governo Societario 2017 ENG
Relazione sula Remunerazione 2018 ITA
Decarbonizzazione Eni For 2017 ITA Decarbonizzazione Eni For 2017 ENG
Performace Eni For 2017 ITA Performance Eni For 2017 ENG
Relazione sula Remunerazione 2018 ENG
Guida dell’azionista 2018 ING