environment international - emory...
TRANSCRIPT

Environment International 51 (2013) 150–159
Contents lists available at SciVerse ScienceDirect
Environment International
j ourna l homepage: www.e lsev ie r .com/ locate /env int
Acute health impacts of airborne particles estimated from satellite remote sensing☆
Zhaoxi Wang a,⁎,1, Yang Liu b,1, Mu Hu c,1, Xiaochuan Pan c, Jing Shi a, Feng Chen d, Kebin He e,Petros Koutrakis a, David C. Christiani a
a Harvard School of Public Health, Massachusetts General Hospital/Harvard Medical School, Boston, MA 02115, United Statesb Rollins School of Public Health, Emory University, Atlanta, GA 30322, United Statesc Peking University Health Science Center, Beijing 100191, Chinad School of Public Health, Nanjing Medical University, Nanjing 210029, Chinae Department of Environmental Engineering and Sciences, Tsinghua University, Beijing 100084, China
Abbreviations:AH,Absolute humidity; AOD,Aerosol optGLM, Generalized linear models; MODIS, Moderate ResolutPM, Particulate matter; RH, Relative humidity.☆ We thank Dr. Xihong Li at Biostatistics Department, Hfor organizing Environmental Statistics Retreat in 2006, winitiated. We thank Dr. Jeffrey Shaman at Oregon State Unnar at Harvard School of Public Health, which enlightenedin AOD calibration. We also thank our colleague, Dr. Dougencouragement.⁎ Corresponding author at: 665HuntingtonAvenue, I-1
States.E-mail address: [email protected] (Z. W
1 These authors contributed equally to this work.
0160-4120/$ – see front matter © 2012 Elsevier Ltd. Allhttp://dx.doi.org/10.1016/j.envint.2012.10.011
a b s t r a c t
a r t i c l e i n f oArticle history:Received 6 June 2012Accepted 28 October 2012Available online xxxx
Keywords:Absolute humidityAerosol optical depthEnvironmental healthParticulate matterSatellite remote sensing
Satellite-based remote sensing provides a unique opportunity to monitor air quality from space at global,continental, national and regional scales. Most current research focused on developing empirical modelsusing ground measurements of the ambient particulate. However, the application of satellite-based exposureassessment in environmental health is still limited, especially for acute effects, because the development ofsatellite PM2.5 model depends on the availability of ground measurements. We tested the hypothesis thatMODIS AOD (aerosol optical depth) exposure estimates, obtained from NASA satellites, are directly associat-ed with daily health outcomes. Three independent healthcare databases were used: unscheduled outpatientvisits, hospital admissions, and mortality collected in Beijing metropolitan area, China during 2006. We usegeneralized linear models to compare the short-term effects of air pollution assessed by ground monitoring(PM10) with adjustment of absolute humidity (AH) and AH-calibrated AOD. Across all databases we foundthat both AH-calibrated AOD and PM10 (adjusted by AH) were consistently associated with elevated dailyevents on the current day and/or lag days for cardiovascular diseases, ischemic heart diseases, and COPD.The relative risks estimated by AH-calibrated AOD and PM10 (adjusted by AH) were similar. Additionally,compared to ground PM10, we found that AH-calibrated AOD had narrower confidence intervals for allmodels and was more robust in estimating the current day and lag day effects. Our preliminary findingssuggested that, with proper adjustment of meteorological factors, satellite AOD can be used directly to esti-mate the acute health impacts of ambient particles without prior calibrating to the sparse ground monitoringnetworks.
© 2012 Elsevier Ltd. All rights reserved.
1. Introduction
Environmental epidemiology studies have established a robust asso-ciation between acute and chronic exposure to airborne fine particulatematter with diameter b2.5 μm (PM2.5) and adverse health effects suchas increased overall mortality, as well as cause-specificmortality, cardio-vascular and pulmonary diseases, asthma, and lung cancer (Dockery et
ical depth; AQI, Air quality index;ion Imaging Spectroradiometer;
arvard School of Public Healthhere the idea of this study wasiversity for his insightful semi-us to apply absolute humiditylas Dockery, for discussion and
406C, Boston,MA 02115, United
ang).
rights reserved.
al., 1993; Laden et al., 2006; Pope and Dockery, 2006). In contrast tochronic health effect studies of PM which primarily rely on spatial het-erogeneity in mean PM concentrations to estimate the effects (Yanoskyet al., 2008), day-to-day variations of PM levels are much more impor-tant in short-term health effect studies (Dominici et al., 2006; Samet etal., 2000). Many previous studies relied on central monitors to assignuniform exposure to population living within a certain distance to themonitor. Besides the exposure misclassification related to this approach,its application is limited to the spatial and temporal availability of groundmeasurements from amonitoring network. For example,most U.S. PM2.5
monitors are operated on an every-3-day or every-6-day samplingschedule. In addition, most monitors are located in urban area withsparse or no coverage in suburban and rural areas even in the U.S. Lackof routine ground monitoring is a major factor limiting both chronicand acute PM2.5 health effects research in developing countries.
Various modeling approaches have been explored to improve thespatial and temporal coverage of PM2.5 concentrations. For example,land use regression models have been developed to provide spatiallyresolved PM2.5 levels to support chronic health effect studies (Jerrett

Fig. 1. Population and geographic locations of the healthcare databases used in thisstudy.
151Z. Wang et al. / Environment International 51 (2013) 150–159
et al., 2005). Model simulated PM2.5 levels have been evaluated as ex-posure estimates (Bravo et al., 2012). Given its broad spatial coverage,satellite-based monitoring data can greatly supplement and expandground monitoring networks to study the spatial and temporal varia-tions of PM, particularly in suburban and rural areas far from groundmonitoring sites. Satellite-derived aerosol optical depth (AOD), re-trieved at visible wavelengths such as the green bands (550 nm), ismore sensitive to PM2.5 and can be used as a quantitative measureof PM2.5 abundance in the atmospheric column (Gupta et al., 2006;Koelemeijer et al., 2006; Liu et al., 2005; Liu et al., 2007a; Pacioreket al., 2008). Although satellite-derived AOD has been successfullyused to document pollution episodes (Al-Saadi et al., 2005; Wangand Christopher, 2003), the application of satellite-based exposureassessment in environmental health is in its infant stage. Most re-search focuses on a pre-calibration approach of developing simpleempirical models of AOD based on ground PM2.5 measurements,and then evaluates the health effects of built models (Kloog et al.,2012). However, the success of model building is limited by tempo-ral mismatch between 24-h average PM2.5 and daytime (oftensingle snapshot) AOD and various factors impacting on the mea-surement accuracy from ground or space. To date, there are only afew studies that have examined the relationships between pre-calibrated AOD and long-term health effect (Hu, 2009; Hu andRao, 2009).
Considering the limited success in model building using pre-calibration approach,we tested the hypothesis that AOD is directly asso-ciated with acute and/or chronic health effects without pre-calibration,as observed using ground data, under the condition that AOD is an indi-cator of ground-level PM concentrations. In this exploratory study, wetested this hypothesis using a healthcare database of hospital admissionscollected from the entire geographic region of Beijing in 2006, and fur-ther evaluated using two independent healthcare databases, includingunscheduled outpatients visits and mortality, from sub-geographic re-gions of Beijing. We focused on daily health outcomes extracted fromthese databases to evaluate the acute effects associated with PM expo-sure. Our main objective was to compare air pollution-associated healtheffects monitored from space (by AOD) and ground (by PM), thus,groundmeasurement of PM10 particleswas used as reference to evaluatetheAODapplication in environmental health research even though therewas no PM2.5 data available in Beijing. To our knowledge, this study wasthe first quantitative application of satellite aerosol remote sensing datato estimate air pollution-health effects.
2. Methods
2.1. Healthcare datasets
Three databases covering different geographic regions of Beijing(Fig. 1) were used to compare the effects of air pollution assessedusing ground PM10 and AOD, including unscheduled outpatient visits,hospital admissions, and mortality. The daily events were extractedaccording to the disease categories in Table 1. Strongly influencedby weekday/weekend schedule, major national holidays, and admin-istrative interruptions, the daily events of unscheduled outpatientvisits and hospital admissions had regular patterns of weekly fluctua-tions (Fig. 2). The days at the weekends, holidays, and administrativeinterruptions had the lowest daily events, and the days immediatelyfollowed the weekends, holidays, and administrative interruptionshad the highest daily events. Using a 7-day moving average, wewere able to completely remove weekly fluctuations resulting in afewmajor gaps corresponding to holidays and administrative inter-ruptions longer than five weekdays. In these two databases, we in-vestigated lag effects of air pollution within one-week period byusing 7-day moving average of daily events starting from the cur-rent day or the next day.
2.2. Ground air quality monitoring data and meteorological data
Air Quality Index (AQI) is a color-coded reporting system commonlyused by government agencies to characterize the air quality for a numberof pollutants. It is a piecewise linear function to convert air pollutant con-centration into AQI, which is divided into ranges with a descriptor and acolor code assigned to each range. China implemented a modified AQIsystem, according to the guideline issued by the US Environmental Pro-tection Agency (http://www.epa.gov/ttn/oarpg/t1/memoranda/rg701.pdf).
Chinese AQI level is based on the levels of 5 atmospheric pollut-ants, including sulfur dioxide (SO2), nitrogen dioxide (NO2), particu-lates (PM10), carbon monoxide (CO), and ozone (O3). A daily AQIscore is assigned to the level of each pollutant and the final dailyAQI is the highest of those 5 scores. The type of pollutant is only spec-ified for the day with AQI>50.
Daily AQI covering Beijing area was obtained from the Beijing En-vironmental Protection Bureau. In 2006, PM10 was considered as themajor air pollutant because PM10 had the highest concentrationsamong all monitored pollutants for all of the days with AQI above50, which accounted for over 92% of the days in 2006. Daily AQIvalues at all 35 ground monitors in Beijing were converted to PM10
concentrations, and geometric means of PM10 were used in this study.For those days without pollutant specified (AQIb50), we treated PM10
as the major air pollutant. To convert from concentration to AQI theequation:
C ¼ Chigh−Clow
� �= Ihigh−Ilow� �
� I−Ilow� �
was used, where: I=AQI value, C=the PM10 concentration, Clow=thelower limit of PM10 concentration of corresponding range of C, Chigh=the higher limit of PM10 concentration of corresponding range of C,
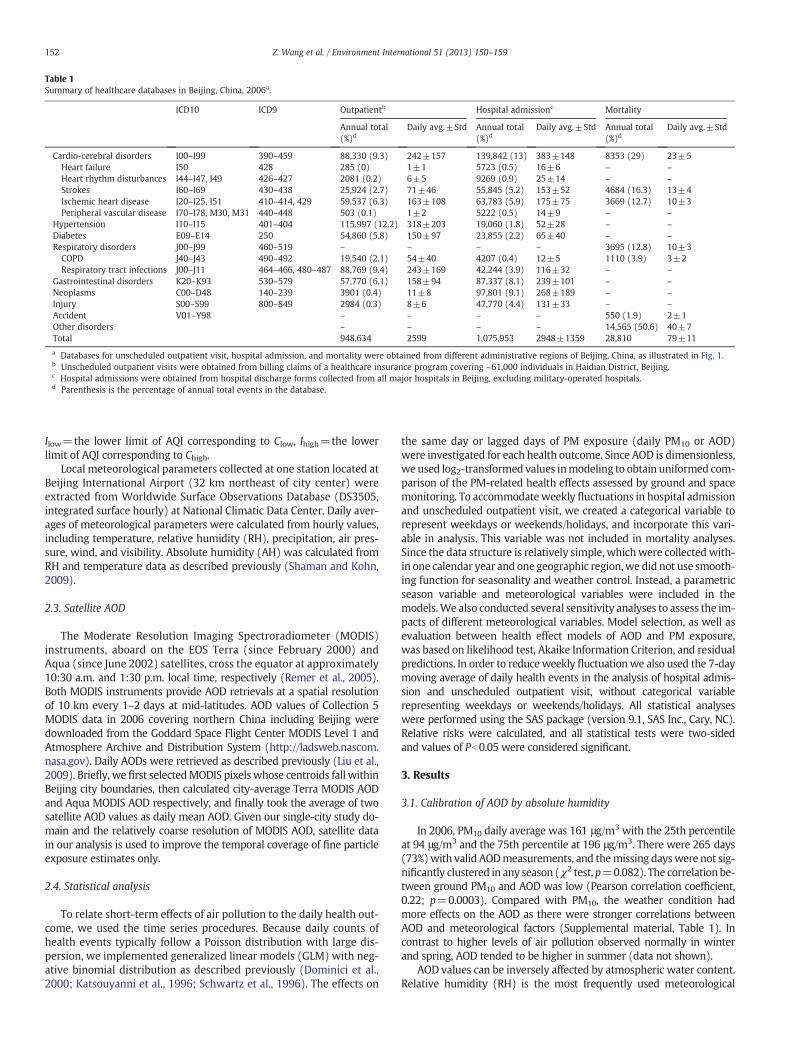
Table 1Summary of healthcare databases in Beijing, China, 2006a.
ICD10 ICD9 Outpatientb Hospital admissionc Mortality
Annual total(%)d
Daily avg.±Std Annual total(%)d
Daily avg.±Std Annual total(%)d
Daily avg.±Std
Cardio-cerebral disorders I00–I99 390–459 88,330 (9.3) 242±157 139,842 (13) 383±148 8353 (29) 23±5Heart failure I50 428 285 (0) 1±1 5723 (0.5) 16±6 – –
Heart rhythm disturbances I44–I47, I49 426–427 2081 (0.2) 6±5 9269 (0.9) 25±14 – –
Strokes I60–I69 430–438 25,924 (2.7) 71±46 55,845 (5.2) 153±52 4684 (16.3) 13±4Ischemic heart disease I20–I25, I51 410–414, 429 59,537 (6.3) 163±108 63,783 (5.9) 175±75 3669 (12.7) 10±3Peripheral vascular disease I70–I78, M30, M31 440–448 503 (0.1) 1±2 5222 (0.5) 14±9 – –
Hypertension I10–I15 401–404 115,997 (12.2) 318±203 19,060 (1.8) 52±28 – –
Diabetes E09–E14 250 54,860 (5.8) 150±97 23,855 (2.2) 65±40 – –
Respiratory disorders J00–J99 460–519 – – – – 3695 (12.8) 10±3COPD J40–J43 490–492 19,540 (2.1) 54±40 4207 (0.4) 12±5 1110 (3.9) 3±2Respiratory tract infections J00–J11 464–466, 480–487 88,769 (9.4) 243±169 42,244 (3.9) 116±32 – –
Gastrointestinal disorders K20–K93 530–579 57,770 (6.1) 158±94 87,337 (8.1) 239±101 – –
Neoplasms C00–D48 140–239 3901 (0.4) 11±8 97,801 (9.1) 268±189 – –
Injury S00–S99 800–849 2984 (0.3) 8±6 47,770 (4.4) 131±33 – –
Accident V01–Y98 – – – – 550 (1.9) 2±1Other disorders – – – – 14,565 (50.6) 40±7Total 948,634 2599 1,075,953 2948±1359 28,810 79±11
a Databases for unscheduled outpatient visit, hospital admission, and mortality were obtained from different administrative regions of Beijing, China, as illustrated in Fig. 1.b Unscheduled outpatient visits were obtained from billing claims of a healthcare insurance program covering ~61,000 individuals in Haidian District, Beijing.c Hospital admissions were obtained from hospital discharge forms collected from all major hospitals in Beijing, excluding military-operated hospitals.d Parenthesis is the percentage of annual total events in the database.
152 Z. Wang et al. / Environment International 51 (2013) 150–159
Ilow=the lower limit of AQI corresponding to Clow, Ihigh=the lowerlimit of AQI corresponding to Chigh.
Local meteorological parameters collected at one station located atBeijing International Airport (32 km northeast of city center) wereextracted from Worldwide Surface Observations Database (DS3505,integrated surface hourly) at National Climatic Data Center. Daily aver-ages of meteorological parameters were calculated from hourly values,including temperature, relative humidity (RH), precipitation, air pres-sure, wind, and visibility. Absolute humidity (AH) was calculated fromRH and temperature data as described previously (Shaman and Kohn,2009).
2.3. Satellite AOD
The Moderate Resolution Imaging Spectroradiometer (MODIS)instruments, aboard on the EOS Terra (since February 2000) andAqua (since June 2002) satellites, cross the equator at approximately10:30 a.m. and 1:30 p.m. local time, respectively (Remer et al., 2005).Both MODIS instruments provide AOD retrievals at a spatial resolutionof 10 km every 1–2 days at mid-latitudes. AOD values of Collection 5MODIS data in 2006 covering northern China including Beijing weredownloaded from the Goddard Space Flight Center MODIS Level 1 andAtmosphere Archive and Distribution System (http://ladsweb.nascom.nasa.gov). Daily AODs were retrieved as described previously (Liu et al.,2009). Briefly, we first selectedMODIS pixels whose centroids fall withinBeijing city boundaries, then calculated city-average Terra MODIS AODand Aqua MODIS AOD respectively, and finally took the average of twosatellite AOD values as daily mean AOD. Given our single-city study do-main and the relatively coarse resolution of MODIS AOD, satellite datain our analysis is used to improve the temporal coverage of fine particleexposure estimates only.
2.4. Statistical analysis
To relate short-term effects of air pollution to the daily health out-come, we used the time series procedures. Because daily counts ofhealth events typically follow a Poisson distribution with large dis-persion, we implemented generalized linear models (GLM) with neg-ative binomial distribution as described previously (Dominici et al.,2000; Katsouyanni et al., 1996; Schwartz et al., 1996). The effects on
the same day or lagged days of PM exposure (daily PM10 or AOD)were investigated for each health outcome. Since AOD is dimensionless,we used log2-transformed values inmodeling to obtain uniformed com-parison of the PM-related health effects assessed by ground and spacemonitoring. To accommodateweekly fluctuations in hospital admissionand unscheduled outpatient visit, we created a categorical variable torepresent weekdays or weekends/holidays, and incorporate this vari-able in analysis. This variable was not included in mortality analyses.Since the data structure is relatively simple, whichwere collected with-in one calendar year and one geographic region,we did not use smooth-ing function for seasonality and weather control. Instead, a parametricseason variable and meteorological variables were included in themodels.We also conducted several sensitivity analyses to assess the im-pacts of different meteorological variables. Model selection, as well asevaluation between health effect models of AOD and PM exposure,was based on likelihood test, Akaike Information Criterion, and residualpredictions. In order to reduceweekly fluctuationwe also used the 7-daymoving average of daily health events in the analysis of hospital admis-sion and unscheduled outpatient visit, without categorical variablerepresenting weekdays or weekends/holidays. All statistical analyseswere performed using the SAS package (version 9.1, SAS Inc., Cary, NC).Relative risks were calculated, and all statistical tests were two-sidedand values of Pb0.05 were considered significant.
3. Results
3.1. Calibration of AOD by absolute humidity
In 2006, PM10 daily average was 161 μg/m3 with the 25th percentileat 94 μg/m3 and the 75th percentile at 196 μg/m3. There were 265 days(73%)with valid AODmeasurements, and themissing dayswere not sig-nificantly clustered in any season (χ2 test, p=0.082). The correlation be-tween ground PM10 and AOD was low (Pearson correlation coefficient,0.22; p=0.0003). Compared with PM10, the weather condition hadmore effects on the AOD as there were stronger correlations betweenAOD and meteorological factors (Supplemental material, Table 1). Incontrast to higher levels of air pollution observed normally in winterand spring, AOD tended to be higher in summer (data not shown).
AOD values can be inversely affected by atmospheric water content.Relative humidity (RH) is the most frequently used meteorological

Fig. 2. Distributions of daily and 7-day moving average for ischemic heart diseases.7-day moving average was calculated from the current day to the 6th lag day.
153Z. Wang et al. / Environment International 51 (2013) 150–159
factor for measuring the atmospheric water content, contrary to thatthe absolute humidity (AH, absolute measure of water vapor in theair) was seldom used in previous studies. Although there was a strongcorrelation between the two measurements (Supplemental material,Table 1), their daily average showed significantly different patterns(Fig. 3A and B). RH tended to have large day-to-day variations andwas more variable in winter, spring, and fall, because high valuescould be found in all seasons but low RHwas seldom observed in sum-mer. AH had much smaller day-to-day variation (mean daily changes,1.4±1.3 g/m3), with an annual daily average of 8.2 g/m3 (median:5.9 g/m3; range, 0.4–25.9 g/m3). Annual distribution of daily AH had adistinct bell-shaped pattern and fitted well with the seasonality(Fig. 3A). Driven by low ambient temperature, winter in Beijing hadvery low AH. AH started to increase gradually in the spring, peaked in
the summer, decreased gradually in the fall, and returned to low levelsin the nextwinter. Comparedwith AH, daily RH seemed to overestimatethe atmospheric water content (Fig. 3B) and less coped with seasonalvariations (Fig. 3A). Moreover, AH had a strong but non-linear correla-tion with daily dew point (Fig. 3C), another meteorological measureof atmospheric moisture. Furthermore, the impacts of AH on AOD wassupported by amoderate positive correlation (Pearson correlation coef-ficient, 0.454; pb0.0001), contrary to a small negative correlationbetween PM10 and AH (Pearson correlation coefficient, −0.225;pb0.0001). Therefore, we calibrated daily AOD values by simply divid-ing them by corresponding daily average AH, named. The AH-calibratedAODhad an annual trendwhich agreedwell with that of PM10 (Fig. 3D).The correlation coefficient between the AH-calibrated AOD and thePM10 was 0.323 (pb0.0001), considerably higher to that estimated forthe uncalibrated AOD.
3.2. Seasonal variations of air quality and health outcomes
Certain disease categories, especially cardiovascular and respiratorydiseases, demonstrated a clear seasonal trend, with summer havingfewer daily events but winter having more events (Fig. 3E and Supple-mental material, Fig. 1). Annual patterns of PM10 and AODwere similar(Fig. 3D), and alignedwell with health outcomes (Fig. 3F). Thus, season-ality had clear impacts on both air pollution and health outcomes inBeijing. Major meteorological factors, such as temperature, atmosphericpressure, dewpoint, and humidity,were highly correlated (Supplementalmaterial, Table 1). Except RH, all meteorological factors had seasonalvariations with either bell-shaped (AH, temperature, and dew point) orinverted bell-shaped (atmospheric pressure) patterns (data not shown).Since the atmospheric water content as measured by AH is determinedby both ambient temperature and pressure, and had direct effects onthe AOD, we selected AH as the representative variable of seasonalityin this study.
3.3. Comparison of health effects of air pollution assessed by ground andspace remote monitoring
Since AH was used to calibrated AOD, we did not adjusted AH orother meteorological factor as an independent covariate of seasonalityin GLM analysis as we did for PM10. In the hospital admission database,both AH-calibrated AOD and PM10 were associated with significantlyincreased daily admissions of cardiovascular diseases including ische-mic heart diseases and heart failure, as well as respiratory tract infec-tions, but not associated with heart rhythm disturbances, strokes,neoplasm, and gastrointestinal disorders (Fig. 4A). AH-calibrated AODwas also significantly associated with higher daily admissions relatedto peripheral vascular disease, COPD, diabetes, and hypertension. Fur-thermore, AH-calibrated AOD was associated with decreased daily ad-missions caused by injury, whereas, the PM10 did not have significantassociations with them. In GLM models, all relative risks predicted byPM10 hadwider confidence intervals.Whenwe examined the lag effectsusing 7-daymoving average, AH-calibrated AODhad robust predictionson all disease categories except heart rhythmdisturbances (Supplementalmaterial, Fig. 2A). Instead of having no immediate effects, AH-calibratedAOD seemed to have significant lag effects on heart rhythm disturbances.In contrast, PM10 predictions on the current day effects and the lag effectswere not consistent (Supplemental material, Fig. 2B).
We did not observe any immediate effects by the current day ex-posure in the database of daily unscheduled outpatient visits. Instead,we found significant lag effects during a 7-day period on cardiovasculardiseases, ischemic heart diseases, COPD, and respiratory tract infectionsby both AH-calibrated AOD and PM10 (Fig. 5A). In contrast to the PM10,AH-calibrated AOD was not significantly associated with strokes.
Because dailymortalities did not haveweekly fluctuations, we couldinvestigate lag effects on single day instead of in the 7-day period. Asshowed in Fig. 6, both AH-calibrated AOD and PM10 performed well in

Fig. 3. Comparison of annual trends among meteorological factors, particulate matter assessed by ground and space monitoring, and ischemic heart diseases in Beijing, China, 2006.A) Daily average of relative humidity and absolute humidity. B) Plot of daily average of relative humidity verses daily average of absolute humidity. C) Plot of daily average of dewpoint verses daily average of absolute humidity. D) 3-day moving average of PM10 and AH-calibrated 260 AOD. E) Daily average of absolute humidity and daily admission of ische-mic heart diseases (7-day moving average). F) Daily average of absolute humidity and 3-day moving average of PM10. We used 3-day moving average of PM10 and AOD for bettervisualizing the annual trend, which were calculated by the values of prior one day, current day, and post one day. 7-day moving average of healthcare outcome was calculated fromthe current day to the 6th lag day.
154 Z. Wang et al. / Environment International 51 (2013) 150–159
GLMmodels. The most robust associations were observed with one lagday for daily mortalities. AH-calibrated AOD appearedmore sensitive indetecting lag effects.
Across all databases, we found that both AH-calibrated AOD andPM10 were consistently associated with the elevated daily events for
cardiovascular diseases, ischemic heart diseases, and COPD. The relativerisks estimated by AH-calibrated AOD and PM10 were similar, with thelargest effects associated with COPD related outcomes. Overall, AH-calibrated AOD had narrower confidence intervals and wasmore sensi-tive in detecting adverse outcomes due to short-term exposure.

Fig. 4. Effects of ground and satellite remote monitored air pollution and absolute humidity on daily hospital admissions. In the analyses of AH-calibrated AOD and AH, day of weekwas included as covariate; and in the analyses of AOD and PM10, absolute humidity and day of week was used as covariates. Since there were significant drops of admission before2007 New Year, we excluded the last week of 2006. The final hospital admission data included 257 days for AH-calibrated AOD and AODmodel analyses, and 348 days for PM10 andAH analyses. In all analyses, AH-calibrated AOD, AOD, PM10, and AH were log2-transformed for easy comparison.
155Z. Wang et al. / Environment International 51 (2013) 150–159
3.4. Health effects associated with AH and other meteorological factors
We also tested AH as a stand-alone risk factor for daily health out-comes (Figs. 4A, 5A, and 6). In all databases, AH demonstrated protec-tive effects at compatible levels for all categories of cardiovascularand respiratory diseases. Additionally, it had protective effects on di-abetes and hypertension, but had increased risk for injury, in the da-tabases of hospital admissions and unscheduled outpatient visits. AH
had no effects on daily events related to neoplasm. To address thequestion whether AH-calibrated AOD associated effects were solelydriven by AH component, we further conducted the analyses usinguncalibrated AOD and AH in the same GLMmodels, as in the analysesof PM10. We observed some discrepancies between AH-calibrated AODand uncalibrated AOD mostly among the disease categories with smallnumber of daily events (Figs. 4B, 5B, and 6). However, we still observedthat uncalibrated AOD had significant increased risks associated with

Fig. 5. Effects of ground and satellite remote monitored air pollution and absolute humidity on daily unscheduled outpatient visits. In the analyses of AH-calibrated AOD and AH,season was used as a covariate; and in the analyses of AOD and PM10, absolute humidity and season was used as covariates. The analyses were limited on non-holiday/non-administrative interruption days, with 202 days for AH-calibrated AOD and AOD model analyses, and 269 days for PM10 and AH analyses. Due to small number of daily eventsresulted in unstable statistical estimations, we did not include the results for heart failure, heart rhythm disturbances, and peripheral vascular diseases. In all analyses, AH-calibratedAOD, AOD, PM10, and AH were log2-transformed for easy comparison.
156 Z. Wang et al. / Environment International 51 (2013) 150–159
cardiovascular diseases, ischemic heart diseases, and COPD. Relativerisks estimated for these diseases were compatible to those fromAH-calibrated AOD, as well as from PM10. In an additional set of analy-ses, we calculated residual AOD after linear regression by AH, and ap-plied residual AOD and AH in the same models. Since AH onlyaccounted for a small portion of AOD variations (adjusted R2=0.203,
pb0.0001), the results of residual AOD were very similar to the resultsof uncalibrated AOD (data not shown).
Because of high degree of correlations, other meteorological fac-tors were also associated with daily health outcomes in all databases(Supplemental material, Fig. 3). Further, using other meteorologicalfactors to replace AH, we obtained similar results for PM10 (data not

Fig. 6. Heat maps showing the effects of ground and satellite remote monitored air pollution and absolute humidity on daily mortality. A color coded cell represented a relative riskestimated by generalized linear models, at a significant level of pb0.05. In the analyses of AH-calibrated AOD and AH, season was used as a covariate; and in the analyses of AOD andPM10, absolute humidity and season was used as covariates. In all analyses, AH-calibrated AOD, AOD, PM10, and AH were log2-transformed for easy comparison.
157Z. Wang et al. / Environment International 51 (2013) 150–159
shown). Among all meteorological factors, AH always gave the bestmodels. However, we could not substitute AH with other meteorolog-ical factors in uncalibrated AOD models.
4. Discussion
In this study, we observed that AH-calibrated AODwere consistentlyassociated with elevated daily events on the current day and/or lag daysfor cardiovascular diseases, ischemic heart diseases, and COPD. The re-sults were robust across three independent databases. The associateddisease patterns and overall effects estimated by relative risks were sim-ilar to ground monitoring by PM10. Additionally, compared to groundPM10, we found that AH-calibrated AOD had narrower confidence inter-vals for all models and was more robust in estimating the current dayand lag day effects. The short-term effects associated with AOD werealso consistent with previous studies using ground PM2.5 on the acutehealth effects of unscheduled outpatient visit, hospital admission andmortalities (Chang et al., 2005; Dominici et al., 2006; Fung et al., 2005;Ostro et al., 2006), including studies in Beijing (Xu et al., 1994, 1995b).
Water absorption can increase the size of hydrophilic particlescontaining sulfate, nitrate, ammonium, and certain species of organic
carbon (Tang and Munkelwitz, 1994). The atmospheric water contenthas direct but inverse impacts on the optical measurement of PM fromspace, as AOD is a measure of particle light extinction (Malm and Day,2001). Compare to RH, AH is a specific and direct measure of watervapor density, and is more relevant to the physical characteristics ofthe optical measurement. Thus, AH-calibrated AOD could provide amore accurate assessment of fine PM-related effects. Our findings sug-gest that adjusting AOD with other meteorological measures of watervapor content, such as RH and dew point, did not result in robust asso-ciations were consistent this (data not shown). We had also tried vari-ousways to adjust AODusing AH, including square or square root of AH,cube or cube root of AH, or log transformed AH, and found that the sim-ple dividing AODby AH gave the best andmost robustmodels (data notshown).
Since AOD dimensionless, we used log2-transformed values to ob-tain uniformed comparison of PM-related health effects assessed byground and space monitoring. Our results can be interpreted as thelevels of increased health risks when the ambient PM level is doubled.Beijing is a highly polluted megacity with PM to be the most severeair pollution issue (Okuda et al., 2004; Song et al., 2006). Besideshigh daily levels, Beijing also had large day-to-day PM variations, as

158 Z. Wang et al. / Environment International 51 (2013) 150–159
we observed 40 occasions (~every 10 days) that daily PM10 increaseswere above 2 folds throughout 2006. In addition, the significant linearrelationships between log2-transformed PM values and the adversehealth effects suggested a nonlinear exposure-response with largereffects at low PM exposure, consistent with previous studies in Beijing(Xu et al., 1995a) and other regions (Pope et al., 2009).
Daily PM10 can be substantially reduced by occasional precipitationand strongwind, but itwas less influenced by temperature andhumidity.Without adjusting meteorological factor, we found PM10 still had signif-icant associations with cardiovascular and respiratory diseases with sim-ilar estimated risks (data not shown). Daily averages of meteorologicalfactors were highly correlated, and were independently associated withdaily health outcomes. Similar observations were previously reportedin Beijing (Xu et al., 1994), as well as in other countries (Braga et al.,2001; Morabito et al., 2005; Sharovsky et al., 2004). Amongmeteorolog-ical factors, AH seemed to have a robust performance in estimatingweather-related health effects, attributing to its inseparable physicalcharacters with atmospheric temperature and pressure. For most of dis-ease categories, AH caused less than 2% changes on daily health eventswith one unit change (g/m3). Mechanisms leading to the possible in-fluence of weather are most likely multifactorial, with a complex re-lationship between seasons and pathophysiological exogenous andendogenous factors (Abrignani et al., 2009). Shaman et al. recentlyreported that AH had stronger effects than RH on influenza virus sur-vival within aerosolized droplets (Shaman and Kohn, 2009), and wasa major determinant for seasonal variations of virus transmissionand associated with influenza-related mortality in the United States(Shaman et al., 2010). Furthermore, a previous study reported that in-fluenza infection was a major cause of winter increase of all-cause andcardiovascular diseasesmortality in theUnited States over a 40-year pe-riod (Reichert et al., 2004). Therefore, theweather-relatedhealth effectsmight be indirectly caused by the increased burden of infections in coldseasons.
Several factors might account for a poor correlation between PM10
and AOD. Firstly, they are measuring different categories of particlesbetween PM10 and AOD (Engel-Cox et al., 2004; Liu et al., 2007b).One limitation of this study was the lack of ground PM2.5 data. Secondly,the sampling periods are different with PM10 representing 24-h average,whereas, AOD corresponding to a snap-shot of daytime PM level. Thirdly,groundmonitoring stations have insufficient coverage of PM andmeteo-rology over the entire metropolitan area of Beijing. Finally, various fac-tors have different impacts on the measurement accuracy from groundor space. Being aware of these potential impacts, all of previous stud-ies focused on developing empirical models of AOD by calibratingwith ground measurement and local meteorological information(Koelemeijer et al., 2006; Liu et al., 2005). This approach, dependingon the available ground data, worked well for long-term average of PMover a large geographic region (Al-Saadi et al., 2005; van Donkelaar etal., 2010; Wang and Christopher, 2003). Currently, there are limitedstudies that adopt empirical AOD models in environmental health re-search. BymergingAODwith groundmeasurements using geographical-ly weighted regression, the standardized county-level biennial mortalityrates (2003–2004) of chronic heart diseases in theUnited Stateswere as-sociated with two-year average re-calculated PM2.5 levels (Hu, 2009), orwith two-year average satellite-derived AOD raster data (Hu and Rao,2009). It is worth to note that, in these studies, data for cold seasons(October to March) were not used in the two-year average calculationand model analysis.
The intrinsic differences of healthcare data and associated qualityattributed to the variations of PM and/or weather related effects. Sincethe admission database covered the entire metropolitan area with largedaily events and more accurate diagnosis, models for both PM10 andAOD performed best in this database. The mortality data was limited toeight districts of downtown Beijing with small daily events and a lowerquality on diagnosis. In contrast, cohort outpatient data was collectedfrom a small, older (mean age±SD: 60±15), and female dominant
(67%) population. Although it had large daily events, the quality was af-fected by large amounts of regular visits formedicine refill and less accu-racy on diagnosis.
5. Conclusion
To our knowledge, this is the first study of directly assessingPM-induced acute adverse health effects by satellite remote sensing,without a prior calibration using ground monitoring data. AH-calibratedAOD is an integrated measurement of satellite-based AOD and localweather conditions. By bypassing a pre-calibration step of empiricalmodel building, it avoids the problems caused by the lack of groundmon-itoring networks. In contrast to ground monitoring data that often lackspatial and temporal coverage and suffer unbalanced spatial distribution,the repetitive and broad-area coverage of satellites allows atmosphericremote sensing to offer a unique opportunity to monitor air quality atglobal, continental, national and regional scales. Satellite-based remotesensing could help fill pervasive data gaps that impede efforts to studyair pollution and protect public health. In addition, the evidence ofsatellite-based environmental health research supports targeting of poli-cy interventions on high-risk regions to reduce pollution levels. Additionstudies are warranted to further explore the potential health benefits ofsatellite remote sensing.
Acknowledgments
This work was supported by grant ES000002 from National Insti-tute of Environmental Health Sciences, by Research Project Awardsfrom Harvard University Center for the Environment, and by pilotproject from Harvard-NIEHS Center for Environmental Health.
Appendix A. Supplementary data
Supplementary data to this article can be found online at http://dx.doi.org/10.1016/j.envint.2012.10.011.
References
Abrignani MG, Corrao S, Biondo GB, Renda N, Braschi A, Novo G, et al. Influence of climaticvariables on acute myocardial infarction hospital admissions. Int J Cardiol 2009;137:123–9.
Al-Saadi J, Szykman J, Pierce RB, Kittaka C, Neil D, Chu D, et al. Improving national airquality forecasts with satellite aerosol observations. Bull Am Meteorol Soc2005;86:1249–61.
Braga AL, Zanobetti A, Schwartz J. The time course of weather-related deaths. Epidemiology2001;12:662–7.
Bravo MA, Fuentes M, Zhang Y, Burr MJ, Bell ML. Comparison of exposure estimationmethods for air pollutants: ambient monitoring data and regional air quality simula-tion. Environ Res 2012;116:1-10.
Chang CC, Tsai SS, Ho SC, Yang CY. Air pollution and hospital admissions for cardiovas-cular disease in Taipei, Taiwan. Environ Res 2005;98:114–9.
Dockery DW, Pope CA, Xu XP, Spengler JD, Ware JH, FayME, et al. An association betweenair-pollution and mortality in 6 United-States cities. N Engl J Med 1993;329:1753–9.
Dominici F, Zeger SL, Samet JM. A measurement error model for time-series studies ofair pollution and mortality. Biostatistics 2000;1:157–75.
Dominici F, Peng RD, Bell ML, Pham L, McDermott A, Zeger SL, et al. Fine particulate airpollution and hospital admission for cardiovascular and respiratory diseases. JAMA2006;295:1127–34.
Engel-Cox J, Holloman C, Coutant B, Hoff R. Qualitative and quantitative evaluation ofMODIS satellite sensor data for regional and urban scale air quality. Atmos Environ2004;38:2495–509.
Fung KY, Luginaah I, Gorey KM, Webster G. Air pollution and daily hospitalization ratesfor cardiovascular and respiratory diseases in London, Ontario. Int J Environ Stud2005;62:677–85.
Gupta P, Christopher SA, Wang J, Gehrig R, Lee Y, Kumar N. Satellite remote sensing ofparticulate matter and air quality assessment over global cities. Atmos Environ2006;40:5880–92.
Hu Z. Spatial analysis of MODIS aerosol optical depth, PM2.5, and chronic coronaryheart disease. Int J Health Geogr 2009;8:27.
Hu Z, Rao KR. Particulate air pollution and chronic ischemic heart disease in the easternUnited States: a county level ecological study using satellite aerosol data. EnvironHealth 2009;8:26.
Jerrett M, Burnett RT, Ma R, Pope III CA, Krewski D, Newbold KB, et al. Spatial analysis ofair pollution and mortality in Los Angeles. Epidemiology 2005;16:727–36.

159Z. Wang et al. / Environment International 51 (2013) 150–159
Katsouyanni K, Schwartz J, Spix C, Touloumi G, Zmirou D, Zanobetti A. Short term effectsof air pollution on health: a European approach using epidemiologic time series data:the APHEA protocol. J Epidemiol Community Health 1996;50(Suppl. 1):S12–8.
Kloog I, Coull BA, Zanobetti A, Koutrakis P, Schwartz JD. Acute and chronic effects ofparticles on hospital admissions in New-England. PLoS One 2012;7:e34664.
Koelemeijer RBA, Homan CD, Matthijsen J. Comparison of spatial and temporal variationsof aerosol optical thickness and particulate matter over Europe. Atmos Environ2006;40:5304–15.
Laden F, Schwartz J, Speizer FE, Dockery DW. Reduction in fine particulate air pollutionand mortality: extended follow-up of the Harvard Six Cities study. Am J Respir CritCare Med 2006;173:667–72.
Liu Y, Sarnat JA, Kilaru V, Jacob DJ, Koutrakis P. Estimating ground-level PM2.5 in theeastern United States using satellite remote sensing. Environ Sci Technol2005;39:3269–78.
Liu Y, Koutrakis P, Kahn R. Estimating fine particulate matter component concentrations andsize distributions using satellite-retrieved fractional aerosol optical depth: part 1 —method development. J Air Waste Manag Assoc 2007a;57:1351–9.
Liu Y, Franklin M, Kahn R, Koutrakis P. Using aerosol optical thickness to predictground-level PM2.5 concentrations in the St. Louis area: a comparison betweenMISR and MODIS. Remote Sens Environ 2007b;107:33–44.
Liu Y, Paciorek CJ, Koutrakis P. Estimating regional spatial and temporal variability ofPM(2.5) concentrations using satellite data, meteorology, and land use information.Environ Health Perspect 2009;117:886–92.
MalmWC, Day DE. Aerosol light scatteringmeasurements as a function of relative humidity:a comparison between measurements made at three different sites. Atmos Environ2001;35:5169–76.
Morabito M, Modesti PA, Cecchi L, Crisci A, Orlandini S, Maracchi G, et al. Relationships be-tween weather and myocardial infarction: a biometeorological approach. Int J Cardiol2005;105:288–93.
Okuda T, Kato J, Mori J, Tenmoku M, Suda Y, Tanaka S, et al. Daily concentrations oftrace metals in aerosols in Beijing, China, determined by using inductively coupledplasma mass spectrometry equipped with laser ablation analysis, and source iden-tification of aerosols. Sci Total Environ 2004;330:145–58.
Ostro B, Broadwin R, Green S, FengWY, LipsettM. Fine particulate air pollution andmortalityin nine California counties: results from CALFINE. Environ Health Perspect 2006;114:29–33.
Paciorek CJ, Liu Y, Moreno-Macias H, Kondragunta S. Spatiotemporal associations betweenGOES aerosol optical depth retrievals and ground-level PM2.5. Environ Sci Technol2008;42:5800–6.
Pope CA, Dockery DW. Health effects of fine particulate air pollution: lines that con-nect. J Air Waste Manage Assoc 2006;56:709–42.
Pope III CA, Burnett RT, Krewski D, Jerrett M, Shi Y, Calle EE, et al. Cardiovascular mor-tality and exposure to airborne fine particulate matter and cigarette smoke: shapeof the exposure–response relationship. Circulation 2009;120:941–8.
Reichert TA, Simonsen L, Sharma A, Pardo SA, Fedson DS, Miller MA. Influenza and thewinter increase in mortality in the United States, 1959–1999. Am J Epidemiol2004;160:492–502.
Remer LA, Kaufman YJ, Tanre D, Mattoo S, Chu DA, Martins JV, et al. The MODIS aerosolalgorithm, products, and validation. J Atmos Sci 2005;62:947–73.
Samet JM, Dominici F, Curriero FC, Coursac I, Zeger SL. Fine particulate air pollution andmortality in 20 U.S. cities, 1987–1994. N Engl J Med 2000;343:1742–9.
Schwartz J, Spix C, Touloumi G, Bacharova L, Barumamdzadeh T, le Tertre A, et al. Method-ological issues in studies of air pollution and daily counts of deaths or hospital admis-sions. J Epidemiol Community Health 1996;50(Suppl. 1):S3-S11.
Shaman J, Kohn M. Absolute humidity modulates influenza survival, transmission, andseasonality. Proc Natl Acad Sci U S A 2009;106:3243–8.
Shaman J, Pitzer VE, Viboud C, Grenfell BT, Lipsitch M. Absolute humidity and the sea-sonal onset of influenza in the continental United States. PLoS Biol 2010;8:e1000316.
Sharovsky R, Cesar LA, Ramires JA. Temperature, air pollution, and mortality frommyo-cardial infarction in Sao Paulo, Brazil. Braz J Med Biol Res 2004;37:1651–7.
Song Y, Zhang YH, Xie SD, Zeng LM, Zheng M, Salmon LG, et al. Source apportionment ofPM2.5 in Beijing by positive matrix factorization. Atmos Environ 2006;40:1526–37.
Tang I, Munkelwitz H. Water activities, densities, and refractive indices of aqueoussulfates and sodium nitrate droplets of atmospheric importance. Geophys Res1994;99:18801–8.
van Donkelaar A, Martin RV, Brauer M, Kahn R, Levy R, Verduzco C, et al. Global estimatesof ambient fine particulate matter concentrations from satellite-based aerosol opticaldepth: development and application. Environ Health Perspect 2010;118:847–55.
Wang J, Christopher SA. Intercomparison between satellite-derived aerosol opticalthickness and PM2.5 mass: implications for air quality studies. Geophys Res Lett2003;30:2095.
Xu X, Gao J, Dockery DW, Chen Y. Air pollution and daily mortality in residential areasof Beijing, China. Arch Environ Health 1994;49:216–22.
Xu X, Dockery DW, Christiani DC, Li B, Huang H. Association of air pollution with hos-pital outpatient visits in Beijing. Arch Environ Health 1995a;50:214–20.
Xu X, Li B, Huang H. Air pollution and unscheduled hospital outpatient and emergencyroom visits. Environ Health Perspect 1995b;103:286–9.
Yanosky JD, Paciorek CJ, Schwartz J, Laden F, Puett R, Suh HH. Spatio-temporal modelingof chronic PM10 exposure for the Nurses' Health Study. Atmos Environ 2008;42:4047–62.