environment, safety and occupational health (esoh) performance measures ndia environmental meeting...
TRANSCRIPT

Environment, Safety and Occupational Health (ESOH)
Performance Measures
NDIA Environmental MeetingApril 2004 San Diego, CA
Donald Kennedy, MPH, JD, CIH Raheem Cash, MS
Steven J. Stone, P.E., DEE, CIH*
Energy & Environment, LMI, McLean, VA

7 April 2004 S. J. Stone, LMI (703) 917-7096 2
LMI
Presentation Purpose
Provide attendees:
Methods for developing ESOH
performance measures
Examples of ESOH performance
measures Safety and Occupational Health Action Plan
Environmental Risk Index

7 April 2004 S. J. Stone, LMI (703) 917-7096 3
LMI
Outline Basic Concepts
Why measure?
Methods for building metrics
Testing and using metrics
Applying the Concepts Safety and Health Action Plan
Environmental Risk Index
7 April 2004 S. J. Stone, LMI (703) 917-7096 4
LMI
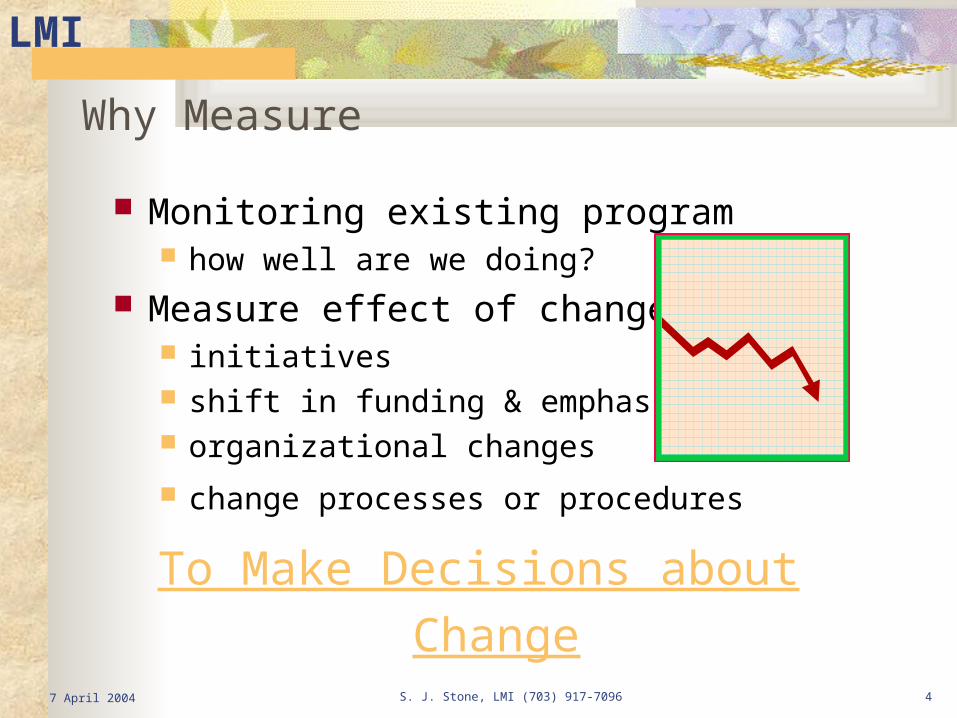
Why Measure
Monitoring existing program how well are we doing?
Measure effect of change initiatives shift in funding & emphasis organizational changes
change processes or procedures
To Make Decisions about Change

7 April 2004 S. J. Stone, LMI (703) 917-7096 5
LMI
Outline
Basic Concepts Why measure?
Methods for building metrics
Testing and using metrics
Applying the Concepts Safety and Health Action Plan
Environmental Risk Index

7 April 2004 S. J. Stone, LMI (703) 917-7096 6
LMI
Developing Metrics3 Common Methods
Brainstorming Process based Decision Based

7 April 2004 S. J. Stone, LMI (703) 917-7096 7
LMI
Brainstorming Safety and Occupational Health Metrics
# of medical exams
# of hazard abatement projects
$ spent on hazard abatement
# of worker complaints
# of safe behaviors
% supervisors and employees trained
# of individuals enrolled in medical surveillance
programs
# employees wearing respirators

7 April 2004 S. J. Stone, LMI (703) 917-7096 8
LMI
BrainstormingEnvironmental Metrics
# completed site assessments
# sites remediated
% reduction in emissions
% of compliance inspections completed
$ spent on fines and penalties

7 April 2004 S. J. Stone, LMI (703) 917-7096 9
LMI
Brainstorming
Gets everyone involved Lots of metrics rapidly How to narrow the list of
metrics?

7 April 2004 S. J. Stone, LMI (703) 917-7096 10
LMI
Developing Metrics3 Common Methods
Brainstorming Process based Decision Based

7 April 2004 S. J. Stone, LMI (703) 917-7096 11
LMI
Process BasedExample – Inspection Process
inspectworkplaces
safe workplace
& no mishaps
controlhazards
identifyhazards
% workplacesinspected
% hazards controlled
“process” or “leading” indicators“outcome”
or “lagging” indicators
injury & illnessrate

7 April 2004 S. J. Stone, LMI (703) 917-7096 12
LMI
Developing Metrics 3 Common Methods
Brainstorming Process based Decision Based

7 April 2004 S. J. Stone, LMI (703) 917-7096 13
LMI
Decision Based Mission
Finance office – to spend all $$ this FY
What decisions are you trying to make How can I reach “zero” on Sep 30th
Information needed for decisions How much am I over / under / on-track
Data supporting the information outstanding bills sub-accounts

7 April 2004 S. J. Stone, LMI (703) 917-7096 14
LMI
Outline Basic Concepts
Why measure?
Methods for building metrics
Testing and using metrics
Applying the Concepts Safety and Health Action Plan
Environmental Risk Index

7 April 2004 S. J. Stone, LMI (703) 917-7096 15
LMI
Testing Metrics
Meaningful to the customer Simple, understandable, repeatable Shows a trend Clearly defined Data that’s economical to collect Timely Drives “appropriate action” Meets organizational goals & objectives

7 April 2004 S. J. Stone, LMI (703) 917-7096 16
LMI
Meaningful to the Customer
0
0.5
1
1.5
2
2.5
3
1984 1986 1988 1990 1992 1994 1996
Accidents per 100,000 Flying Hours
DoD Aviation “Class A” Accident Rate

7 April 2004 S. J. Stone, LMI (703) 917-7096 17
LMI
Shows a Trend
0
1
2
3
4
5
6
84 85 86 87 88 89 90 91 92 93 94 95
UCL(4.92)
LCL(2.64)
Mean(3.78)
Lost time injury & illness rate (cases/100 employees)

7 April 2004 S. J. Stone, LMI (703) 917-7096 18
LMI
Timely (not!)Workers’ Compensation Hearing Loss Claims
0.00.10.20.30.40.50.60.70.8
1985 1986 1987 1988 1989 1990 1991 1992 1993 1994 1995 1996
# claims/100 Employees
UCL(0.74)
LCL(0.20)
Mean(0.47)
shipyards closed

7 April 2004 S. J. Stone, LMI (703) 917-7096 19
LMI
Feedback Loop
data-based decisions
data entry

7 April 2004 S. J. Stone, LMI (703) 917-7096 20
LMI
Outline Basic Concepts
Why measure?
Methods for building metrics
Testing and using metrics
Applying the Concepts Safety and Health Action Plan
Environmental Risk Index

7 April 2004 S. J. Stone, LMI (703) 917-7096 21
LMI
Overview of a SOH Action Plan
It contains a Strategy Mission “Mission metrics” to measure
mission success Accidents, fatalities, injuries, $$$
Vision Commitment

7 April 2004 S. J. Stone, LMI (703) 917-7096 22
LMI
Overview of an Action Plan (cont’d)
It contains Actions Five Action areas modeled from VPP Each Action has specific objectives that include
Classical safety program elements Best practices of the best private industry programs
Metrics to measure achievement of each objective % employees trained % accidents investigated % workplaces inspected

7 April 2004 S. J. Stone, LMI (703) 917-7096 23
LMI
Actions Support the Mission
Action Plan Mission & Vision
A c tio n M e trics
O b jec tives
A c tio ns
M iss io n M e tric s- P reve n t A cc id e n ts- P re ve n t In ju ries- P reve n t lo sse s - $ $$
S O H M iss io n & V is ion
A g e ncy S tra te g ic P lan

7 April 2004 S. J. Stone, LMI (703) 917-7096 24
LMI
Action Plan Metrics Support Mission Metrics
Action Plan Metrics
Mission Metrics
• % employees trained• % accidents investigated• % workplaces inspected• # near-misses reported• # behavior observations
• Accident rate• Lost workday Injury
rate• Total case rate

7 April 2004 S. J. Stone, LMI (703) 917-7096 25
LMI
Why emphasize performance measures?
Clarify the target Use objectives & metrics
to build: work plans budget
Audit/assess progress

7 April 2004 S. J. Stone, LMI (703) 917-7096 26
LMI
How were the Action Plan metrics selected? Included all possible metrics
Classical safety programs Superior corporations and government agencies
with significant reductions in injuries and illnesses Metrics ‘cafeteria’ from which you can select
Removed some metrics as unworkable Professional experience Professional judgment

7 April 2004 S. J. Stone, LMI (703) 917-7096 27
LMI
Local Culture Example Example Metrics
Dynamic local commander Leadership Commitment
Employees empowered to make changes
Employee Involvement
No local strengths or weaknesses
‘Gut feeling’ as most likely to make a difference
Select Metrics That Fit the Culture

7 April 2004 S. J. Stone, LMI (703) 917-7096 28
LMI
Metrics Are Usable Metrics
Meet local organizational goals & objectives Drive “appropriate action”
Law of Unintended Consequences
They are Linked to the process Simple, understandable, repeatable Clearly defined Economical to collect Timely & Show a trend

7 April 2004 S. J. Stone, LMI (703) 917-7096 29
LMI
How it will work – The Action Plan Process
1. Each FA selects field activity-specific objectives and metrics
2. Agency HQ Safety reviews selected metrics & measurement procedures with FA
3. Each FA implements the action plan and monitors their metrics, adjusts program execution, and reports throughout the year
4. Agency HQ Safety reviews performance annually with FAs
5. Agency HQ Safety reviews agency performance and briefs DASHO and Agency Leader
6. FAs select objectives & metrics for new FY
7 April 2004 S. J. Stone, LMI (703) 917-7096 30
LMI
How It Will Work –
The Numbers

7 April 2004 S. J. Stone, LMI (703) 917-7096 31
LMI
Safety Metric Quality Control Report
Select a numerator or denominator value to modify
0
10
20
30
4050
60
70
80
90
100
Oct Nov Dec Jan Feb Mar Apr May Jun Jul Aug Sep
FY01
Per
cen
tag
eMetric #67: Percent of Hazards with a Required
Completion Date
Oct Nov Dec Jan Feb Mar Apr May Jun Jul Aug SepNumerator 8 12 3 6 13 18 24 28 38 34 32 23Denominator 15 20 5 7 15 20 25 30 42 37 36 25Rate 53 55 58 75 85 88 95 90 85 82 87 92
Target Ranges(R/Y/G/B)
95-99
0-84
85-94
100

7 April 2004 S. J. Stone, LMI (703) 917-7096 32
LMI
Performance By Action Report
0
0.5
1
1.5
2
2.5
3
3.5
4
2001 2002 2003 2004 2005 2006 2007 2008 2009 2010
Fiscal Year
Action 1: Management Commitment & Employee Involvement Target Ranges(R/Y/G/B)
2.6 - 3.5
1.0 - 1.5
1.6 - 2.5
3.6 - 4.0

7 April 2004 S. J. Stone, LMI (703) 917-7096 33
LMI
Internal Business Perspective
Innovation and Learning Perspective
Customer PerspectiveFinancial Perspective
Agency HQ S&H
Hazard Prevention & Control
Safety & Health Training
Activity and Worksite Analysis
Mgt. Commitment & Employee Involvement
Safety & Health
How SOH Action Plan will fit into the Agency Strategic Plan

7 April 2004 S. J. Stone, LMI (703) 917-7096 34
LMI
Outline Basic Concepts
Why measure?
Methods for building metrics
Testing and using metrics
Applying the Concepts Safety and Health Action Plan
Environmental Risk Index (ERI)

7 April 2004 S. J. Stone, LMI (703) 917-7096 35
LMI
Background The ESOH office is tasked to develop
performance measures that: Can be readily explained to the Agency
leadership and members of Congress, and
Can clearly show how appropriated funds would improve the environmental performance of a particular building, a region’s building portfolio, and/or the entire Agency building portfolio.

7 April 2004 S. J. Stone, LMI (703) 917-7096 36
LMI
Purpose of the Measure
ERI Results will be used to: Measure progress towards meeting the Agency
environmental goal and objective Goal: Carry out social, environmental, and other
responsibilities as a federal agency. Objective: Provide safe and environmentally responsible
workplaces
Assist in identifying greatest environmental risks Support program and budgeting decisions at the
facility, regional and headquarters level.

7 April 2004 S. J. Stone, LMI (703) 917-7096 37
LMI
Define & Prioritize Environmental Risks
1. Hazardous waste
2. Asbestos
3. IAQ
4. Hazardous materials
5. Subsurface contamination
6. Lead
7. PCB
8. Storage tanks
9. Air emissions
10. Drinking water (Agency or Utility)
11. Wastewater
12. Radon
13. Stormwater

7 April 2004 S. J. Stone, LMI (703) 917-7096 38
LMI
Define & Prioritize Impact Scenarios
Impact scenarios1. Human harm
2. Environmental damage
3. Property damage
4. Financial harm
5. Legal liability
6. Public relations damage

7 April 2004 S. J. Stone, LMI (703) 917-7096 39
LMI
Criteria 5 4 3 2 1
Discharges from WWTP meet permit requirements.
N Y
The facility’s WWTP is at or near recommended carrying capacity.
Y N
Major upgrades or replacements are required at the facility’s WWTP.
Y N
WW management or operator staff receives required training or certification.
N Y
Discharges to POTW and FOTW meet all pretreatment requirements.
N Y
E.g.: (17 / 23) * 3.32 = 2.45 ERI
Scoring formula: ERI = (Sum / max. possible points) * weighting factor [unique for each risk category]
Sample Score Sheet-Wastewater

7 April 2004 S. J. Stone, LMI (703) 917-7096 40
LMI
Obtaining a Building ERI Score
ERI Score Example:
Wastewater field score = 17 out of 23 Wastewater Expert Choice weight = 3.32 Wastewater ERI = 2.45
Each of the 13 category scores is entered and summed to provide a Building ERI Score

7 April 2004 S. J. Stone, LMI (703) 917-7096 41
LMI
Environmental Risk Index for Each Facility Compute an ERI
Index based on percent scale – 0 to 100 Zero represents a building with no risk An index of 100 will be assigned to buildings
with the highest risk for every risk
7 April 2004 S. J. Stone, LMI (703) 917-7096 42
LMI
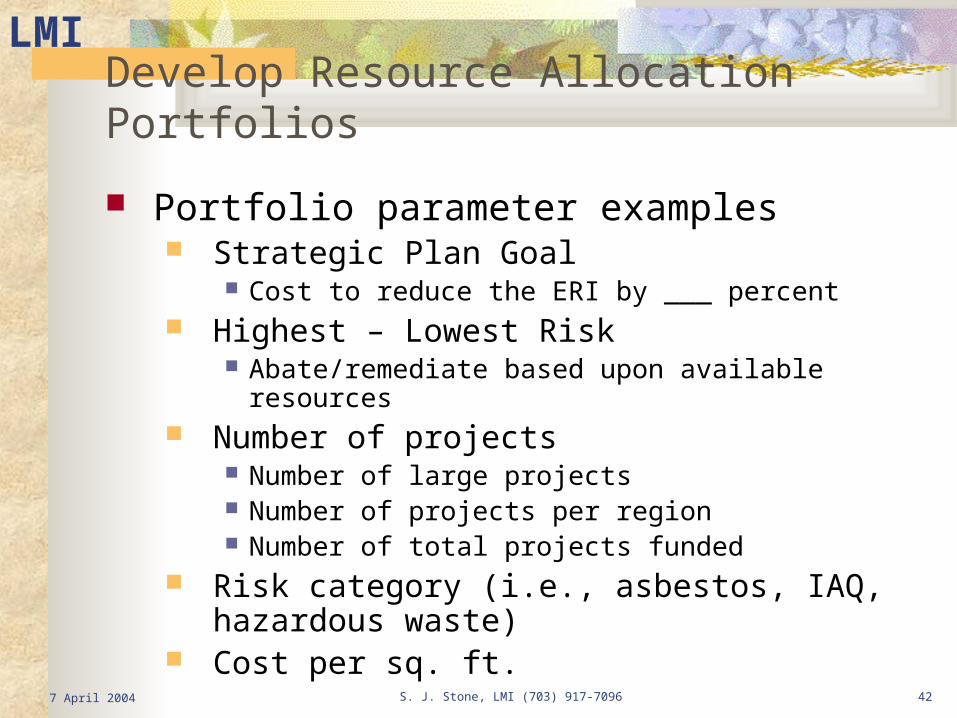
Develop Resource Allocation Portfolios
Portfolio parameter examples Strategic Plan Goal
Cost to reduce the ERI by ___ percent Highest – Lowest Risk
Abate/remediate based upon available resources Number of projects
Number of large projects Number of projects per region Number of total projects funded
Risk category (i.e., asbestos, IAQ, hazardous waste)
Cost per sq. ft.

7 April 2004 S. J. Stone, LMI (703) 917-7096 43
LMI
Portfolio Summary
Portfolio # Budget Constraint
# of projects selected
New ERI Average Total Cost
1 1,000,000$ >=1 project per building 13 15% 975,000$
2 1,500,000$ >=1 project per building 15 9% 1,500,000$
3 500,000$ >=1 project per building 10 23% 475,000$
4 500,000$ >=1 building with asbestos 10* 23% 462,000$
5 1,000,000$ >=1 project per building and 4 buildings with asbestos 12 18% 975,000$
*Note: Total number of projects selected is 10 like portfolio #3, but different projects were chosen

7 April 2004 S. J. Stone, LMI (703) 917-7096 44
LMI
Resource Allocation Portfolio Benefits
Employees at several levels of the organization become involved and provide input
The process is credible because it is aligned with Agency strategies & goals
The process provides a performance metric that can be measured
The process is repeatable. The priorities may change, but the process remains the same.

7 April 2004 S. J. Stone, LMI (703) 917-7096 45
LMI
Review Do you need metrics? Link metrics to your organizational plans Which metrics development method
works best for you? Test your metrics Monitor & adjust metrics and then
performance targets accordingly

7 April 2004 S. J. Stone, LMI (703) 917-7096 46
LMI
Questions?