environmental economics & sustainable development - mohan munasinghe
TRANSCRIPT

a: WORLD BANK ENVIRONMENT PAPER NUMBER 3 417t
Environmental Economicsand Sustainable Development
Mohan Munasinghe
9/ _ :0f L e Xf W - E= t 00Sitt
aQ½
Pub
lic D
iscl
osur
e A
utho
rized
Pub
lic D
iscl
osur
e A
utho
rized
Pub
lic D
iscl
osur
e A
utho
rized
Pub
lic D
iscl
osur
e A
utho
rized

RECENT WORLD BANK ENVIRONMENT PAPERS
No. 1 Cleaver, Munasinghe, Dyson, Egli, Peuker, and Wencelius, editors, Conservation of West and CentralAfrican Rainforests/Conservation de laforet dense en Afrique centrale et de l'Ouest
No. 2 Pezzey, Sustainable Development Concepts: An Economic Analysis

WORLD BANK ENVIRONMENT PAPER NUMBER 3
Environmental Economicsand Sustainable Development
Mohan Munasinghe
The World BankWashington, D.C.

Copyright G 1993The International Bank for Reconstructionand Development/THE WORLD BANK1818 H Street, N.W.Washington, D.C. 20433, U.S.A.
All rights reservedManufactured in the United States of AmericaFirst printing July 1993
Environment Papers are published to commnunicate the latest results of the Bank's environmental work tothe development community with the least possible delay. The typescript of this paper therefore has notbeen prepared in accordance with the procedures appropriate to formal printed texts, and the WorldBank accepts no responsibility for errors.
The findings, interpretations, and conclusions expressed in this paper are entirely those of the author(s)and should not be attributed in any manner to the World Bank, to its affiliated organizations, or tomembers of its Board of Executive Directors or the countries they represent. The World Bank does, notguarantee the accuracy of the data included in this publication and accepts no responsibility whatsoeverfor any consequence of their use. Any maps that accompany the text have been prepared solely for theconvenience of readers; the designations and presentation of material in them do not imply the expressionof any opinion whatsoever on the part of the World Bank, its affiliates, or its Board or member countriesconcerning the legal status of any country, territory, city, or area or of the authorities thereof orconcerning the delimitatiorL of its boundaries or its national affiliation.
The material in this publication is copyrighted. Requests for permission to reproduce portions of it shouldbe sent to the Office of the Publisher at the address shown in the copyright notice above. The World Bankencourages dissemination of its work and will normally give permission promptly and, when thereproduction is for noncommercial purposes, without asking a fee. Permission to copy portions forclassroom use is granted through the Copyright Clearance Center, 27 Congress Street, Salem,Massachusetts 01970, U.S.A.
The complete backlist of publications from the World Bank is shown in the annual Index of Publications,which contains an alphabetical title list (with full ordering information) and indexes of subjects, authors,and countries and regions. The latest edition is available free of charge from the Distribution Unit, Officeof the Publisher, The World Bank, 1818 H Street, N.W., Washington, D.C. 20433, U.S.A., or fromPublications, The World BanLk, 66, avenue d'Iena, 75116 Paris, France.
Mohan Munasinghe is chief, Policy and Research Division, in the Environment Department of theWorld Bank.
Library of Congress Cataloging-in-Publication Data
Munasinghe, Mohan, 1945-Environmental economics and sustainable development /
Mohan Munasinghe.p. cm. - (World Bank environment paper ; no.3)
Includes bibliographical references.ISBN 0-8213-2352-01. Environmental policy-Economic aspects. 2. Economic
development-Environmental aspects. I. Title. II. Series.HC79.E5M865 1993363.7-dc2O 92-42952
CIP

Foreword
The decade of the 1980s has witnessed a fundamental development may be identified; based on economic,change in the way governments and development ecological, and socio-cultural criteria. Reconcilingagencies think about environment and development. these concepts and operationalizing them will be aThe two are no longer regarded as mutually exclu- formidable task, which is only now getting under-sive. It is now recognized that a healthy enviromnent way. In the meantime those maldng decisions haveis essential to sustainable development and a healthy to find ways of introducing such concerns into theireconomy. Moreover, economists and planners are analysis in a practical way.beginning to recognize that economic development The objectives of this paper recognize thesewhich erodes natural capital is often not successful. needs. It seeks to help analysts, practitioners andIn fact, development strategies and programs which policymakers in the field by reviewing the latestdo not take adequate account of the state of critical thinking on the concepts and techniques of sustain-resources-forests, soils, grasslands, freshwater, able development and the valuation of environmentalcoastal areas and fisheries-may degrade the re- impacts, so that they can be explicitly taken intosource base upon which future growth is dependent. account in development decisionmaking.
Since its creation, the Vice Presidency for Envi- The application of environmental economicronmentally Sustainable Development (ESD) has principles is examined, in order to not only extendplaced the highest priority on the analysis of these conventional cost-benefit analysis but also make bet-important issues. Within ESD, the Environment De- ter use of other methods such as multi-criteria deci-partment's work, in particular, has focused on the sionmaking. This analytical discussion is furtherlinks between environment and development, and illustrated by a careful selection of the most recentthe implications of these linkages for development empirical work. These case studies cover a range ofpolicy in general. The objective of the Environment projects and circumstances to be encountered in aPaper Series is to make the results of our work variety of developing countries.available to the general public.
Increasing environmental awareness and con-cerns over sustainability have broadened the rangeof issues that need to be examined in the assessment Ismail Serageldinof the potential impacts of proposed projects and Vice Presidentprograrns. Three different concepts of sustainable Environmentally Sustainable Development

Acknowledgement
The author is pardcularly grateful to Noreen Beg. Special thanks are owed also to Emst Lutz. In addfition, theauthor is grateful to Shakeb Afsah, Edward Barbier, Robin Bates, Wilfred Beckerman, Jan Bojo, Wilfrido Cruz,Partha Dasgupta, John Dixao, John English, Gunnar Kohlin, Randy Kramer, Karl-Goran Maler, Anil Markandya,Peter Meier, David Pearce, Annika Persson, Narendra Sharma, Adelaida Schwab, Tom Teitenberg, HirofumiUzawa, Jeremy Warford, Diale Whittington, and Carlos Young, for assistance. This work was supported in partby grants from the Governments of Norway and Sweden.

Contents
Abstract vi
PART I: ANALYTICAL FRAMEWORK 1
1. Introduction IConceptual Basis of Sustainable Development 1Focus of the Paper 4
2. Linking Economics and the Environment 5The Role of Environmental Economics 5Recent Developments 7Conventional Project Evaluation 7National Income Accounts and Macroeconomic Performance 11Economywide Policies and the Environment 13
3. Framework for Environmental-Economic Decisionmaking 19Valuation of Environmental Costs and Benefits 19Multi-Objective Decisionmaking (or Multi-Criteria Analysis) 28The Discount Rate 33Risk and Uncertainty 35
PART II: CASE STUDIES 38
4. Short Case Studies of Environmental Valuation 38Change in Productivity Method 38Loss of Earnings Method 39Travel Cost and Contingent Valuation Methods 40Contingent Valuation Method to Estimate Option, Existence, and Bequest Values 43
5. Two World Bank Valuation Case Studies 46Vatuation of Biophysical Resources in Madagascar 46Improving Decisionmaking in the Sri Lanka Power Sector 51
6. Conclusions 60
Bibliography 61
Annex 1. Using Shadow Prices 69
Annex 2. Summaries Of Environmental Valuation Case Studies 72Change in Productivity Method 72Loss of Earnings Method 78Travel Cost and Contingent Valuation Methods 80
Annex 3. Estimating International Travel Costs 93
Annex 4. Using a Simple Biodiversity Index 95
Annex 5. Recent Work on Policies and Environmental Implications 97

Abstract
One essential step towards achieving sustainable cation. To facilitate this, an extended bibliography isdevelopment is the economically efficient manage- provided.ment of natural resources. This paper explains the First, a number of shorterdeveloping country casekey role of environmental economics in facilitating studies which cover a wide range of practical valuationthe more effective incorporaLtion of environmental methods, are reviewed. Next, two longer case studiesconcerns into development clecisionmaking. Tradi- describe the current state-of-the-art in applicalion of ationally, the economic analysis of projects and poli- combination of valuation techniques in developingcies (including the techniques of shadow pricing), countries. The Madagascar example focuses or the usehas been developed to help a country make more of methods such as contingentvaluation andtravel cost,efficient use of scarce resources. However, "exter- to value forest resources and biodiversity. The Srinalities", mainly those arising from adverse environ- Lanka case study examines the scope for applicationmental consequences, often have been neglected in of multicriteria techniques (in addition to economicthe past. It is also important to recognize the social valuation), to improve decisionmaking in the energyand ecological objectives that are a part of sustainable sector.development, and to reconcile these concepts and We may conclude generally, that furtheir appli-operationalize them within the economic framework. cation to practical problems in developing countries
This paper reviews concepts and techniques for is required (rather than further theoretical develop-valuation of environmental impacts that enable such ment), of the environmental valuation concepts andenvironmental considerations to be explicitly con- techniques presented in the paper. Such case studysidered in the conventional cost-benefit calculus work can be most effective when carried out as partused in economic decisionmaking. Key related as- of project preparation. A major purpose in this en-pects including environmental impacts of economy- deavor is at least to indicate orders of magnitude, ifwide policies (both macroeconomic and sectoral), it is not possible to provide more accurate numbers.discount rate issues, and mulli-criteria analysis are Some alternatives can be ruled out, and gross envi-reviewed. The process of internalizing environ- ronmental errors avoided in this fashion. Also, onemental externalities may be ifacilitated by making can often identify the key environmental indicatorseven rough qualitative assessments early on in the to which the decision is sensitive and focus atlentionproject evaluation cycle. The advantages of such an on them.approach include: the early exclusion of options that The evidence presented suggests that the valu-are not sound environmentally; more effective in- ation techniques for determining "use values" maydepth consideration of environmentally preferable be applied successfully in appropriate cases. How-alternatives; and better opportunities for redesigning ever, examples involving the estimation of "non-useprojects and policies to achieve, sustainable develop- values" are virtually non-existent in the developingment goals. world, and rather scarce even in the industrialized
There are an increasing number of attempts to nations.both improve and make use of economic techniques The use of multiobjective decision methods alsoto value environmental assets in developing coun- needs to be expanded, (as illustrated in the Sri Lankatries. This paper seeks to help practitioners in the case study), given the difficulties in using purelyfield, whose main concern is to keep up with the monetary methods of cost benefit analysis in manyadvances most relevant to their own areas of appli- contexts.

PART I: ANALYTICAL FRAMEWORK
1. Introduction
The state of the environment is a major worldwide provides many other generalized services rangingconcern today. Pollution in particular is perceived as from simple amenities to irreplaceable life supporta serious threat in the industrialized countries, where functions (e.g., stabilization of the global climate orthe quality of life had hitherto been measured mainly filtering out of harmful ultraviolet rays by the strato-in terms of growth in material output. Meanwhile, spheric ozone layer). One complication is that theseenvironmental degradation has become a serious functions tend to interact negatively-for example,impediment to economic development and the al- overloading the waste absorbing capability will gen-leviation of poverty in the developing world. erally reduce the supply of other productive environ-
Mankind's relationship with the environment mental inputs as well as general life-supporthas gone through several stages, starting with functions.primitive times in which human beings lived in a In this context, several authors have pointed outstate of symbiosis with nature, followed by a pe- that human activities are part of an open dynamicriod of increasing mastery over nature up to the socioeconomic subsystem which is embedded in theindustrial age, and culminating in the rapid mate- global ecosphere (examples of early writings are:rial-intensive growth pattern of the twentieth cen- Odum 1973, Odum 1975; while some recent onestury which adversely affected natural resources in include Costanza 1991, and Folke and Janssenmany ways. The initial reaction to such environ- 1992). The rapid growth of the socioeconiomic sub-mental damage was a reactive approach charac- system in modem times has begun to overload someterized by increased clean-up activities. Most of the capabilities of the ecosystem (locally as wellrecently, mankind's attitude towards the environ- as globally). Many environmentalists argue that un-ment has evolved to encompass the more proactive bounded (and especially material-intensive) eco-design of projects and policies that will help antici- nomic growth would not be sustainable in the longpate and minimize environmental degradation. In run, given that the ecosphere is finite (see, for exam-this context, the world is currently exploring the ple: Goodland, Daly and El-Serafy 1991).concept of sustainable development, an approachthat will permit continuing improvements in the pre- Conceptual Basis of Sustainablesent quality of life at a lower intensity of resource Developmentuse, thereby leaving behind for future generations anundiminished or even enhanced stock of natural re- In addition to its environmental roots, the concept ofsources and other assets.1 sustainable development which emerged in the
The environmental assets that we seek to protect 1980s, draws also on the experience of several dec-provide three main types of services to human soci- ades of development efforts. In the 1950s and 1960s,ety, and the consequences of their degradation must the focus of economic progress was on growth andbe incorporated into the decisionmaking process. increases in output, based mainly on the concepts ofFirst, it has been known for centuries that the natural economic efficiency. By the early 1970s, the large andresource base provides essential raw materials and growing numbers of poor in the developing world, andinputs which support human activities. Second, the the inadequacy of "trickle-down" benefits to theseenvironment serves as a sink to absorb and recycle groups, ledto greater efforts to directly improve income(often at little or no cost to society) the waste prod- distribution. The development paradigm shifted to-ucts of economic activity. This function has received wards equitable growth, where social (distributional)much greater attention in modem times, especially objectives were recognized as distinct from and aswhere overloading of the sink capacity has occurred. important as economic efficiency (see left side of Fig-Finally, there has been increasing recognition, par- ure 1.1).ticularly in the last two decades, that the environment

2 Part I: Analytical Framework
Figure .1 Tradeoffs among the Three Main Objectives of Sustainable Development
- Income redistrib. - Environmental- Employment Assessment- Targetted - Valuation
Assistance - Internalisation
SOCIAL QBJECTIVE - Popular Participation ECOLOGICAL OBJECTIVEP-OVERTY/EQUITY - Consultation NATURAL RESOURCEiS
- Pluralism
Early attempts were made to weight benefits three major points of view: economic, social and(and costs) of development projects according to the ecological, as shown in Figure 1.1.income level of the beneficiaries, thereby incorporat- Attempts are continuing (as described later ining social equity concerns directly into economic this volume) to integrate environmental concernsdecisions. However, the lack of success with such into conventional economic decisionmaking-approaches resulted in a more pragmatic procedure, mainly by valuing environmental assets and impactswhereby the economic and social objectives were of development efforts and using them in procedureskept separate, but reconciled ihrough the pursuit of ranging from project level cost-benefit analysis tomore efficient production coupled with targeted pov- environmentally adjusted national accounts at theerty-alleviating initiatives (e.g., employment genera- macroeconomic level (see the right side of Figuretion, direct subsidies, etc.) to assist low income 1.1). However, to the extent that some functions ofgroups. the environment cannot be valued in monetary
Protection of the enviromnent has now become terms (e.g., biodiversity), other techniques likethe third major objective of development. By the multi-criteria analysis need to be used to trade offearly 1980s, a large body of evidence had accumu- non-comparable objectives.lated that environmental degradation was a major Finally, the interaction between the social andbarrier to development. The concept of sustainable ecological objectives are probably the least welldevelopment has therefore evolved to encompass understood (see the base of Figure 1.1). The grow-

Part !: Analytical Framework 3
ing importance of topics like public participation in point out that it may be more relevant to examine thedecisiomnaking, consultation of affected groups, and maintenance of the set of opportunities, as opposedpluralism, are manifestations of this awareness. to the preservation of the value of the asset base. This
is because preferences and technology are not heldThree Approaches to Sustainable Development constant through successive generations, so preserv-
ing a constant value of the asset base could be redun-It is possible to identify three different concepts of dant. By concentrating on the size of the opportunitysustainable development that reflect the ideas pre- set, the importance of the conservation of biodiver-sented above-i.e., the economic, the ecological sity becomes more evident, both in terms of ecologi-and the socio-cultural (Munasinghe and McNealy cal and economic approaches to sustainability. The1992). preservation of biodiversity allows the system to
The economic approach to sustainability is retain resilience by protecting it from externalbased on the Hicks-Lindahl concept of the maximum shocks, in the same manner that preservation of theflow of income that could be generated while at least capital stock protects assets for future consunption.maintaining the stock of assets (or capital) which The difference between the two concepts lies in theyield these benefits (Solow 1986, Maler 1990). There consequences of a loss in ecological resilience. Un-is an underlying concept of optimality and economic der the Hicksian income measure, a society thatefficiency applied to the use of scarce resources. consumes its fixed capital without replacement is notProblems of interpretation arise in identifying the sustainable. Using an ecological approach, loss ofkinds of capital to be maintained (e.g., manufactured, resilience implies a reduction in the self-organizationnatural, and human capital) and their substitutability, of the system, but not necessarily a loss in produc-as well as in valuing these assets, particularly eco- tivity. This depends to a certain extent on the capacitylogical resources. The issues of uncertainty, irre- of human societies to adapt and continue functioningversibility and catastrophic collapse pose in the face of stress and shocks. The linkage betweenadditional difficulties (Pearce and Turner 1990). socio-cultural and ecological sustainability is thus
The ecological view of sustainable develop- demonstrated through the organizational similaritiesment focuses on the stability of biological and physi- between human societies and ecological systems.cal systems. Of particular importance is the viability In a separate paper, Perrings (1992) points outof subsystems that are critical to the global stability that sustainable development is not necessarily syn-of the overall ecosystem (Perrings 1991). Protection onymous with the maintenance of the status quo.of biological diversity is a key aspect. Furthermore, Biodiversity conservation does not require the pres-"natural" systems may be interpreted to include all ervation of all species, nor the maintenance of currentaspects of the biosphere, including man-made envi- environmental conditions. An evolutionary systemronments like cities. The emphasis is on preserving requires that a level of biodiversity be maintainedthe resilience and dynamic ability of such systems to that will guarantee the resilience of the ecosystemsadapt to change, rather than conservation of some on which human consumption and production, and"ideal" static state. therefore human welfare, depend. Sustainable devel-
The socio-culiural concept of sustainability opment demands compensation for the opportunitiesseeks to maintain the stability of social and cultural foregone by future generations, because today's eco-systems, including the reduction of destructive con- nomic activity changes the level or composition offlicts (UNEP et al. 1991). Both intragenerational biodiversity in a way that will affect the flow of vitalequity (especially elimination of poverty), and inter- future ecological services, and narrow the optionsgenerational equity (involving the rights of future available to unborn generations. This holds true evengenerations) are important aspects of this approach. if positive rates of economic growth indicate anPreservation of cultural diversity across the globe, and increase in the instrumental (or use) values of op-the better use of knowledge concerning sustainable tions currently available.practices embedded in less dominant cultures, should Reconciling these various concepts and opera-be pursued. Modem society would need to encourage tionalizing them as a means to achieve sustainableandharness pluralism and grass-roots participation into development is a formidable task. The diversity ofa more effective decisionmaking framework for so- short-term needs and concerns, as well as long-cially sustainable development. term goals throughout the world, suggests that
In comparing the concepts of ecological and there is no universally "right" or "wrong" sustain-economic sustainability, Githinji and Perrings (1992) able development.

4 Part 1: Analytical Framework
One practical approach that may be more useful cause difficulties in estimating the sustainable priceto policy-makers and the public is the concept of of a resource. The institutional difficulties in themaximization of net benefits of economic and social implementation of inter-generational cornpensa-development, subject to maintaining the services tion schemes would be significant. Despite suchfrom, and stock of natural resources over time. This difficulties, the development of methodologies toimplies that renewable resources, especially if they reflect sustainability constraints in shadow pricing isare scarce, should be utilized at rates less than or important, if economic decisions are to consider theequal to the natural rate of regeneration. The effi- intergenerational effects of the depletion of naturalciency with which non-renewable resources are used resource stocks (see also the following section onshould be optimized subject to substitutability be- discount rates).tween these resources and t,chnological progress.Waste should be generated at rates less than or equal Focus of the Paperto the assimilative capacity of the environment, andefforts should be made to protect intra- and intergen- This volume reviews how environmental economicserational equity. Finally, the iimplementation of sus- could facilitate the efficient use of natural resourcestainable development will require a pluralistic and (both mineral and biological), as well as mamnadeconsultative social framework that, among other capital and human resources-an objective wvhich isthings, facilitates the exchange of information be- a vital step towards sustainable development. Part Atween dominant and hitherto disregarded groups in describes the framework for analysis. Special atten-order to identify less material and pollution inten- tion is paid to the key role of environmental econom-sive paths for human progress. ics in helping value environmental and natural
resources more precisely and in intemalizing theSustainability Constraint costs and benefits of using such resources into the
conventional calculus of economic decisionmaking.In conventional econonmic analysis, biases exist against More generally, the identification of sustainable de-the adequate valuation of natural capital, and the costs velopment options requires:of natural capital depletion. Often, there is an inbuilt * Good understanding of the physical,lack of consideration for the rights of future genera- biological and social impacts of humantions in the traditional decisicinmaking process. The activities.original wvork of Hotelling which established the * Better estimates of the economic value ofprinciple of a depletion premnium or user cost for damage to the environment that help toexhaustible resources, was a key step in beginning to improve the design of policies and pro-place a value on current resource use based on future jects and lead to enviromnentally soundbenefits foregone (for a good review, see Dasgupta investment decisions.and Heal 1979). More generally, if it is accepted that * Development of policy tools and strength-rents from natural capital depletion (both renewable ening of human resources and institutionsand exhaustible) should be shared with future genera- to implement viable strategies and man-tions (as encompassed in the concept of sustainable age natural resources on a sustainabledevelopment), and that a cautious approach must be basis.adopted with regard to natural resource stock deple- Part B of the volume contains a number oftion, then shadow pricing ought to reflect a sustain- shorter case studies grouped and presented accordingability constraint (Pearce et al. 1991). One approach to the various techniques of environmental valuationis to ensure that sufficient assets remain to ensure a discussed earlier. Wo longer case studies that illustratenon-decreasing flow of future per capita welfare or the combined use of several valuation techniques areconsumption (Pezzey 1992). described next. Finally, the conclusions are presented
The emphasis on a sustainable supply ensures followed by the bibliography and annexes.that natural capital is not regarded as a free good, andtherefore preempts the biases mentioned earlier. If an Noteappropriate rule was applied, differences in the rela-tive scarcity of resources would be reflected in the 1. This broad definition is based on the World Cbniuis-sustainable price. However, certain practical consid- sion on Environment and Development, 1987. For a recenterations need to be addressed in determining such a review of altemative definitions of sustainable development.rule.rLations need knowleaddress detrmanig curechan see Pezzey, 1992.rule. Lack of knowledge of the demand curve can

2. Linking Economics and the Environment
The Role of Environmental Economics project evaluation/cost-benefit analysis (CBA), sec-toral/subnational studies, multisectoral macroe-
Environmental economics plays a key role in identi- conomic analysis, and international economicfying options for efficient natural resource manage- analysis (finance, trade, etc.), at the different hierar-ment that facilitate sustainable development. It is an chic levels.essential bridge between the traditional techniques Unfortunately, the analysis of the environmentof decisionmaking and the emerging more envi- cannot be carried out readily using the above socio-ronmentally sensitive approach. Enviromnental economic structuring. As shown in Figure 2.2, oneeconomics helps us incorporate ecological con- convenient breakdown recognizes environmental is-cerns into the conventional framework of human sues that are related to: (1) global and transnationalsociety, as shown in Figures 2.1 and 2.2. concems (for example, climate change, ozone layer
Figure 2.1 indicates the hierarchical nature of depletion); (2) natural habitats (for example, forestsdecisionmaking in modem society. The global and and other ecosystems); (3) land (for example, agri-transnational level consists of sovereign nation cultural); (4) water resources (for example, riverstates. In the next level are individual countries, each basins, aquifers, watersheds); and (5) urban-indus-having a multisectoral macroeconomic structure. trial areas (for example, large cities, airsheds). InVarious economic sectors (such as energy, industry, each case, a holistic environmental analysis wouldagriculture, transport, etc.) exist within each country. seek to study a physical or ecological system in itsFinally, each sector consists of different subsectors, entirety. Complications arise because such naturalprojects and local schemes. systems tend to cut across the decisionmaking struc-
The usual decisionmaking process that corre- ture of human society mentioned earlier. For exam-sponds to this structure, relies on techno-engineering, ple, a forest ecosystem (like the Amazon) couldfmancial and economic analyses of projects and poli- affect the global climate, span several countries, andcies. In particular, we note that conventional economic also interact with many different economic sectorsanalysis has been well developed over the past several within each country.decades, and uses a variety of techniques including
Figure 2.1 The Socio-Economic Structure Figure 2.2 The Environmental System
SOCIOECONOMC EN\lRONMENTALSTRUCTURE SYSTEM
INTER- GLOBALNATIONAL TRANSNATIONAL _
CO Z
_1 _NATURAL
< H~~~~~~~ ~~~~~~~~~~~~~~~~~~~ABITATS < NATIONAL2o i) MACROECON.
0
z oizLL 2 < Z LAND 0
o < SECTDRAL 0
ZO -..U Z UBSECTORAL E
_ .8 <3 FZ wRNECT URBAN-ND _

6 Part f: Analytical Framework
The causes of environmental degradation arise of environmental economnics has also been added-from human activity (ignoring natural disasters and the latter plays a key bridging role, by helping to mapother events of nonhuman origin), and therefore, we the EA results onto the framnework of conventionalbegin in the upper part of Figure 2.1. The physical economic analysis. Once again, a variety of environ-(including biological and social) effects of socioeco- mental economic techniques facilitate this process ofnomic decisions on the environment must then be incorporating environmental issues into traditionaltraced through to the bottom half of the diagram, and decisionmaking. These methods include economicthe techniques of environmental assessment (EA) valuation of environmental impacts (at the local/pro-have been developed to facilitate this difficult analy- ject level), integrated resource management (at thesis. For example, deforestation of a primary moist sector/regional level), environmental Lmacroe-tropical forest may be caused by hydroelectric dams conomic analysis and environmental accounting (at(energy sector policy), roads (transport sector pol- the economywide, multisector level), andicy), slash and burn farming (agriculture sector pol- global/transnational environmental economic analy-icy), mining of mninerals (industrial sector policy), sis (at the international level). The analytical tech-land clearing encouraged by land-tax incentives (fis- niques mentioned above overlap considerably, andcal policy), and so on. Disentangling and prioritizing therefore this conceptual categorization should notthese multiple causes (right side) and their impacts be interpreted too rigidly.(left side) will involve a complex environmental Once the foregoing steps are completed, pro-assessment exercise. jects and policies must be redesigned to reduce their
The various elements in Figures 2.1 and 2.2 are environmental impacts and to shift the developmentcombined in Figure 2.3, while the new analytical tool process towards a more sustainable path. Clearly, the
Figure 2.3 Incorporating Environmental Concerns Into Decisionmaking
ENVIRONMENTAL ANALYTICAL SOCIO ECONOMICSYSTEM TOOLS AND METHODS STRUCTURE
GLOBAL INTER-TRANSNATIONAL NATIONAL
z 0io 0-
<CI)0>I~~ ~~~~~~F cn I LU <
NATU RAL Z O < ZHABITATS L Z Z< <od
Co < 0 O NATIONAL-
LU < L) Z c L MACROECON.
uST~~~~ L) < < L) _ u5
C/) 0 0 EROJE< CTz )LAND < L LIu 0 O<< z
_j < 0)~ 0 z < oC< jLU LU z
F-u < z zj j
z ~~ LU u~~~z - ~~-z> Z- SECTORALWATER I-~~~~co~ o < (3 < -REGIONAL
WATER0 L zw< Z wLI
L)0>
Z a > .< P-w_r C-
,URBAN-INDUST. UJ> a. C.< - SUBSECTORAL
AND AIR -PROJECT

Part !: Analytical Framework 7
formulation and implementation of such policies is efficiency is a necessary but not sufficient conditionitself a difficult task. In the deforestation example for sustainable development.described earlier, the decisionmakers who wish to In 1989, the World Bank issued its guidelinesprotect this single ecosystem are likely to face prob- for environmental irnpact assessment of projects, aslems in coordinating policies in a large number of the natural culmination of many years of increasingdisparate and (usually) non-cooperating ministries concern about the environmental dimension of de-and line institutions (such as energy, transport, agri- velopment.' Thus enviromnental analysis has beenculture, industry, finance, and forestry). elevated to the same level of importance as the
other traditional aspects of project evaluation: eco-Recent Developments nomic, financial, social, and technical analyses.
The valuation of environmental impacts takes onAlthough the consolidation of environmental eco- added urgency in this context, since it would per-nomic theory and its application to empirical issues mit environmental concerns to be incorporated ef-spread throughout the developed world in the 1970s, fectively into the normal decisionmaking process.the incorporation of environmental issues into devel-opment planning is a relatively recent phenomenon. Conventional Project EvaluationA review of the literature in the field reveals thepaucity of writings touching upon the environment. The successful completion of a development projectAcademic development economics barely acknow- usually involves several well-defined steps. The sys-ledged the field until recently (Dasgupta and Maler tematic approach used by the World Bank in a1990). Much of the literature on the environmental typical project cycle includes identification, prepa-economics of developing countries has emerged ration, appraisal, negotiations and financing, im-since the mid-1980s. This is largely as a result of the plementation and supervision, and evaluation.increasing emphasis being placed on enviromnentalissues by major aid-giving institutions. The Project Cycle
The Brundtland Report recognized the role ofeconomics in sustainable development-both in as- Project identification involves preliminary selectionsessing costs of environmental degradation in devel- (by the borrowing country and the World Bank) ofoping countries, and in designing relevant incentives potential projects that appear to be feasible and con-to limit such degradation (World Comiission on form to national and sectoral development goals. InEnvironment and Development 1987). The recent the preparation phase which may last one year orworldwide concern regarding the environment has more, the borrower studies the engineering-techni-strengthened the emphasis placed on enviromnental cal, envirorunental, institutional, economic and fi-sustainability as an important criterion for sound natu- nancial aspects of a proposed project. Projectral resource management. Anotherfacet of this concern appraisal consists of a comprehensive and systematicis reflected in the increased attention paid to intergen- review of all aspects of the project, culminating in anerational equity and the role of discount rates in eco- appraisal report that discusses comprehensively thenomic calculations. national and sectoral strategies as well as the engi-
Decisionmakers in most developing countries neering/technical, environmental, institutional, eco-now accept that poor managementof the environ- nonric, and financial issues.ment has become a significant barrier to develop- The appraisal report is the basis for justifyingment. Since sustainable development includes other the investment, as well as the negotiations at whichlong standing, high priority objectives like economic the borrower and financier (the World Bank) discussgrowth and poverty eradication, scarce resources the measures required to ensure the success of the(both natural and man-made) must be used as effi- project, and the conditions for funding. The resultingciently as possible. The conventional approach relied agreements are included in loan agreements whichon the systematic analyses of economic decisions (in together with the appraisal report are considered andparticular, investment and pricing policies) that in- accepted by the Bank's Board of Executive Directorsfluenced the production of goods and services. How- and the borrowing governmenL The borrower is re-ever, as discussed earlier, this focus on economnic sponsible for implementing the project according to
conditions mutually agreed on with the Bank. Super-

8 Part I: Analytical Framework
vision of the implementation process is carried out ciency border prices (see Annex 1 for more details ofby the Bank through periodic field visits and progress shadow pricing). However, for the financial analysisreports from the borrower Evaluation is the final of projects, B, C and r may be defined in financialstage of the project cycle, following disbursement of terms.the loan. Project performance audits are carried out If projects are to be compared or ranked, the oneby an independent Bank department, and where ap- with the highest (and positive) NPV would be thepropriate, involve review of previous project docu- preferred one, that is, if NPVi > NPV[I (wherements and field visits. This analysis yields valuable NPVi = net present value for project i), then projectexperience that helps imprcve the work at all stages I is preferred to project II, provided also thait the scaleof the project cycle. of the alternatives is roughly the same. More accu-
rately, the scale and scope of each of the projectsEconomic Analysis and Cost-Benefit Criteria under review must be altered so that, at the margin,
the last increment of investment yields net benefitsCost-benefit analysis (CBA ) is the key element in the that are equal (and greater than zero) for all theappraisal stage of the project cycle. CBA seeks to projects. Complexities may arise in the analysis ofassess project costs and benefits using a common interdependent projects.yardstick. Benefits are defined in relation to how a The intemal rate of return (IRR) is also used asproject improves human welfare. Costs of scarce re- a project criterion. It may be defined by:sources used up by the project are measured by theiropportunity costs-the benefit foregone by not using Tthese inputs in the best alternative application. I (Bt - Ct)/(1 + IRR)' =
In addition to this economic test, as previously = omentioned, a number of other aspects (includingtechnical, environmental, institutional, and financial Thus, the IRR is the discount rate which reducescriteria) also need to be ccnsidered in project ap- the NPV to zero. The project is acceptable ifpraisal. Thefinancial and economic analyses of pro- IRR > r, which in most normal cases impliesjects are different. The former uses market or NPV > 0 (ignoring cases in which multiple rootsfinancial costs to estimate the financial viability and could occur, which may happen if the annual netprofits of the project enterprise or firm. By contrast, benefit stream changes sign several times). Problemsthe economic analysis seeks to capture economic of interpretation occur if altemative projects haveeffects on the whole econolmy, using shadow prices widely differing lifetimes, so that the discount ratethat reflect opportunity costs. Extemalities are val- plays a critical role.ued wherever possible (as described below). Some Another frequently used criterion is the benefit-of the criteria commonly used in the cost-benefit test cost ratio (BCR):of a project are described next, with the emphasis oneconomic rather than financial evaluation. [ T 1 F T
The most basic criterion for accepting a project BCR = I B,/ (1 + r) ')compares costs and benefits to ensure that the net = J / =Ipresent value (NPV) of benefits is positive:
If BCR > 1, then NPV > O and the project isT acceptable.
NPV = E (Bi - Ct )/(1 + r)' Each of these criteria has its strengths and weak-,=O nesses, but NPV is probably the most useful. The
NPV test may be used to derive the least-cost rule. Inwhere B, and Ct are the benefits and costs in year t, certain cases, the benefits of two altemative projectsr is the discount rate, and T is the time horizon. may be equal (that is, they both serve the same need
Both benefits and costs are defined as the differ- or demand). Then the comparison of alternatives isence between what would occur with and without the simplified. Thus:project being implemented. As described later, ineconomic testing B, C, andr are defined in economic Tterms and appropriately shaiow priced using effi- NPV, - NPV11 = y, [ C11 t - Cl,I I/ (1 + r) t
*=0

Part I: Analytical Framework 9
since the benefit streams cancel out. Therefore, if national development goal might be embodied in anacceptableobjectivefunctionsuchas aggregatecon-
T T sumption. Usually, one important task of the analyst
E CIIt/ (1 + r) ' > I C 1t/ (1 + r) t; is to maximize this consumption subject to con-1=0 ,=O straints-including limits on the availability of re-
sources (like capital, labor and environmentalthis implies that NPVI > NPV11. assets),structural distortions in theeconomy, and so
In other words the project which has the lower on. Then, the shadow price of a given scarce eco-present value of costs is preferred. This is called the nomic resource represents the change in value of theleast-cost alternative (when benefits are equal). objective function, caused by a marginal change inHowever, even after selecting the least-cost alterna- the availability of that resource.3 While the generaltive, it would still be necessary to ensure that this equilibrium approach is conceptually important, itproject would provide a positive NPV. is too cumbersome and data-intensive to use in
many cases. In practice, partial equilibrium tech-Shadow Pricing niques may be used, that evaluate the impact of the
change in the availability of a given resource on aIn the economist's idealized world of perfect compe- few key sectors or areas, rather than throughout thetition, the interaction of atomistic profit-maximizing economy (see also, the following sections on envi-producers and utility-maximizing consumers gives ronmental accounting and environmental impactsrise to a situation that is called Pareto-optimal.2 In of economywide policies.)tis state, prices reflect the true marginal social costs, Two basic types of shadow prices exist. Thesescarce resources are efficiently allocated and, for a involve whether or not society is indifferent to in-given income distribution, no one person can be made come distribution considerations. To illustrate thisbetter off without making someone else worse off point, consider the simple national goal of maximiz-(Bator 1957). ing the present value of aggregate consumption over
However, conditions are likely to be far from a given time horizon. If the consumption of differentideal in the real world. Distortions due to monopoly individuals is added directly regardless of their in-practices, external economies and diseconomies come levels, then the shadow prices derived from(such as environmental impacts which are not inter- such a model are termed efficiency prices becausenalized in the private market), interventions in the they reflect the pure efficiency of resource allocation.market process through taxes, import duties and sub- Alternatively, when increasing the consumption ofsidies, all result in market (or financial) prices for the lower income groups becomes an important ob-goods and services which may diverge substantially jective, this consideration is given a greater weightfrom their shadow prices or true economic values. in evaluating aggregate consumption. Then, the re-Furthermore, the reliance on strict efficiency crite- sultant shadow prices are called social prices.ria for determining economic welfare implies the The goal of shadow pricing is, therefore, eitherpassive acceptance of the existing (skewed) in- efficiency- or socially-oriented. In brief, efficiencycome distribution-this may be socially and politi- shadow prices try to establish the actual economiccally unacceptable, especially if there are large values of inputs and outputs, while socially orientedincome disparities. Such considerations necessi- shadow prices take account of the fact that the in-tate the use of appropriate shadow prices (instead come distribution between different societal groupsof market prices) of project inputs and outputs, to or regions may be distorted in terms of overall na-determine the optimal investment decisions and poli- tional objectives. This may call for special adjust-cies, especially in the developing countries where ments; for example, giving greater weight to benefitsmarket distortions are more prevalent than in the and costs accruing to the poor relative to the rich. Inindustrialized countries. practice, such fornal weighting schemes are seldom
Given the complex nature of modem societies, used inproject evaluation-instead, income distribu-it is often conceptually and empirically useful to tional and other social issues are addressed throughattempt to capture all the key economic relationships direct targeting of beneficiaries and similar ad hocin a comprehensive "General Equilibrium" model of approaches. In our analysis, we will place primarythe macroeconomy. In such a model, the overall emphasis on efficiency shadow pricing.

10 Part I: Analytical Framework
Nonpriced inputs and outputs must be shadow- excessive environmental damage, until rmore accu-priced to reflect their economic opportunity costs rate data and valuation studies can be carried out. In(see Annex 1 for details of border shadow prices and such cases, the initial emphasis is on cost effective-conversion factors). Major categories of such non- ness (i.e., achieving pollution targets at the lowestpriced inputs and outputs are common property re- cost), rather than valuing the benefits of controlsources and externalities (especially those arising measures.For example, quantity controls on air pol-from environmnental impacts). Access to common lution that limit the aggregate emission level may beproperty resources is not restricted, and therefore combined with an initial allocation of emissionrightsexploitation tends to occur on a first come, first among existing and potential individual pollutersserved basis, often resulting in overuse (beyond the (which collectively do not exceed the total emissionsustainable level). In particular, public goods are a limit). This is analogous to defining property rightsclass of environmental resources (e.g., a beautiful to an open access resource-in this case, the airshedview) that are freely accessible and indivisible (i.e., over a particular region. Next, it would be logical toenjoyment by one individual does not preclude en- encourage schemes like marketable pollution per-joyment by others). These properties lead to "free- mits (which may be competitively traded amongriding"-a situation in which one consumer, either polluters), to achieve an economically efficient re-knowingly or unknowingly, uses the resource at a distribution of "pollution rights" within the overallprice less than the efficient cost of making that re- emission limit. However, specific minimum quantitysource available, and in the process takes advantage controls may not be an efficient long-term solution,of the greater contributions of others (this is the case if no attempt is made to compare the mnarginal costswhen wastewater dischargte taxes are paid by con- of compliance with the real benefits provided (i.e.,sumers using a transnational groundwater source in marginal damages avoided--especially as environ-one nation, and the environmental benefits of cleaner mental conditions improve over time).water are shared by consumners in another country In practice, it is often prudent to us>^ ia variablewho draw from the samne aquifer, but do not pay such mix of both price and quantity controls to protect thetaxes.)4 environment (Pearce and Turner 1990). A mixed
Externalities are defined as beneficial or ad- system allows the various policy instruments to beverse effects imposed on others for which the origi- flexibly adjusted depending on marginal cleanupnator of these effects cannot charge or be charged (as costs. In this way, an optimal outcome cam be ap-the case may be).5 If a (damaging)externality can be proached even without full information concerningeconomically valued or shadlow priced, then a charge control costs (Baumol and Oates 1988).or tax may be levied on the perpetrator, to compen-sate for and limit the damage. This is the so-called Numeraire"Pigouvian" or "price-control" approach to environ-mental regulation. The basic concepts and tech- To derive a consistent set of economic shadow pricesniques for economic valuation of environmental for goods and services, a common yardstick or nu-impacts underlying this approach are discussed later meraire to measure value is necessary. The choice ofin Chapter 3. the numeraire, like the choice of a currency unit,
Unfortunately, many externalities are not only should not influence the economic criteria for deci-difficult to measure in physical terms but even more sionmaking, provided the same consistent frame-difficult to convert into monetary equivalents (that work and assumptions are used in the analysis.is, to measure the "willingness to pay" of the parties The same nominal unit of currency maLy have aaffected by the externalities). Quite often therefore, different value depending on the economic circum-the so-called "quantity-control" approach is taken, stances in which it is used. For example, a rupee-by imposing regulations and standards, expressed worth of a certain good purchased in a duty free shopin physical measurements only (e.g., safe mini- is likely to be more than the physical quantity of themum standards for pollution), that try to eliminate same good obtained for one rupee from a retail store,the perceived external damages. Especially when after import duties and taxes have been levied. There-environmental pollution is severe and obvious, fore, it is possible to distinguish intuitively betweensetting standards could sente as a useful first step the border-priced rupee, which is used in intema-to raise consciousness about the problem and limit tional markets free of import tariffs, and a domestic-

Part I: Analytical Framework 11
priced rupee, which is used in the domestic market of productive activity, is not included insubject to various distortions. A more sophisticated terms of current costs or depreciation ofexample of the value differences of a currency unit natural wealth. Thus, resource-basedin various uses arises in countries where investment goods are underpriced in the market-thefor future economic growth is considered inade- lower the value added, the larger is thequate. In these instances, a rupee-worth of savings extent of underpricing of the final productthat could be invested to increase the level of future (Dasgupta and Maler 1991). It follows thatconsumption, may be considered more valuable than countries that export primary products doa rupee devoted to current consumption. so by subsidizing them, often with dispro-
Amost appropriate numeraireinmany instances portionately large adverse impacts on theis a unit of uncommitted public income at border poorest members of society (who are lessshadow prices (Little and Mirrlees 1974). Essen- able to protect themselves)-the small cul-tially, this unit is the same as freely disposable for- tivator, the forest dweller, the landlesseign exchange available to the government, but peasant, and so on. Currently, there are noexpressed in terms of units of local currency con- estimates of such hidden costs or "subsi-verted at the official exchange rate. Annex 1 contains dies", but if there were, the GDP of manya discussion of this particular yardstick of value. The countries could well be significantlyborder-priced numeraire is particularly relevant for lower. In addition, natural resource deple-the foreign exchange-scarce developing countries. It tion raises intergenerational equity issuesrepresents the set of opportunities available to a to the extent that the productive assetscountry to purchase goods and services on the inter- available to future generations are unfairlynational market. diminished (see the discussion on discount
rate in the next section).National Income Accounts 3. Abatement or cleanup activities (for exam-and Macroeconomic Performance ple, those that result in expenditures in-
curred to restore the environment) oftenIn order to accurately recognize and include environ- serve to inflate national income, but themental concerns in macro-econornic analyses, stand- offsetting environmental damages are notard income accounting techniques must be included. In the case of private firms, de-re-examined. Gross domestic product (GDP) is the fensive environmental expenditures (thatcommonly used growth measure, based on transac- is, measures to reduce or avoid environ-tions in markets. GDP is the basis on which many mental damage) are dedected from fmalaspects of macroeconomnic policy are determined. value added. However, if such cleanupHowever, its shortcomings include neglect of income costs are undertaken by the government ordistributional concerns, non-market activities, and by households, they are added to nationaleven more crucial-environmental degradation. output.The resulting GDP estimate is in-
In terms of the envirom-nent, there are three correct because: (a) harmful outputs likeweaknesses in the current national accounting frame- pollution are ignored; and (b) beneficialwork (Lutz and Munasinghe 1991): inputs related to enviromnental needs are
1. National accounts may not represent wel- implicitly under valued.6
fare accurately, because the balance sheets To overcome these deficiencies in presentlydo not fully include environmental and used accounting techniques, it is necessary to de-natural resources, and therefore, important velop a System of National Accounts (SNA) that ischanges in the status of such resources are capable of yielding an Environmentally-adjusted netneglected. Domestic Product (EDP) and an Environmentally-
2. The true costs of using natural resources in adjusted net Domestic Income (EDI). National levelhuman activity are not recorded in conven- decisionmakers and macroeconomic planners (typi-tional national accounts. The depletion or cally, in a Ministry of Finance or National Plamning)degradation of natural capital (such as the routinely rely on the conventional SNA to formulatestock of water, soil, air, minerals, and wil- economic policies. Thus, a supplementary environ-derness areas), which occurs in the course mentally-adjusted SNA and corresponding perform-

12 Part I: Analytical Framework
ance indicators would encourage such policymakers adjusted net Domestic Product 1 (EDP 1) was calcu-to reassess the macroeconomic situation in light of lated, which incorporates the "economic" depletionenvironmental concerns and to trace the links be- costs of natural resource use, (but does not accounttween economywide policies and natural resource for the degradation of environriental quality andmanagement (Muzondo et ia. 1990). corresponding losses of non-marketed environ-
The World Bank has worked closely with the mental services that is reflected in EDP2). Next,UN for the past decade, to better incorporate envi- EDP2 was estimated after subtracting the costs ofromnental concerns into the present round of revi- degradation of environmental quality from EDPI.sions of the SNA framework. As an interim measure, EDP2 was estimated to range from 90 to 97 percentthe "UNSO Framework" (Bartelmus, Stahmer, and of NDR. The final results showed that consumptionvan Tongeren 1989, UNSO 1990) was created. This exceeded net environmentally adjusted domesticframework is referred to as the System for Environ- production in most years. However, lack of physicalmentally-adjusted EconomicAccounts (SEAA). Its ob- data made it extremely difficult to obtain accuratejective is to integrate environmental data sets with estimates. Significant fluctuations in commodityexistingnationalaccountsinforrnation,whilemaintain- prices also reflect the difficulties for governments ining SNA concepts and principles insofar as possible. attempting to maintain sustainable developmentEnvironmental costs, benefits, and natural re- policies.source assets, as well as ex]penditures for environ- Additionally, contrary to findings, Papua Newmental protection, are presented as satellite Guinea is not necessarily depleting its capital base,accounts in a manner consistent with the account- as the capital gain from erosion of external debting framework of the SNA. (caused by inflation reducing the value of ihe debt)
In brief, the SEAA seeks to maintain the essen- is about 4% of GNP in real terms. The substitutabilitytial integrity of the existing SNA; but at the same of capital is therefore an issue to be considered in thetime, encourages (through the satellite accounts) the definition of "income".collection and compilation of relevant infornation Aside from these World Bank-supported stud-on natural resources and the environment. An impor- ies, few examples exist of the application of environ-tant element of the SEAA is its ability to utilize mental accounting in developing countries (and eveninformation that may be generated by other measure- less in the developed world). The UN Economicments such as physical resource accounting at the Commission for Latin America and the Envirorunentregional or sectoral level. The satellite accounts con- (ECLAC) and the United Nations Environment Pro-stitute an important step towards the eventual goal of gramme (UNEP) performed two case studies in Latincomputing an EDP and an EDI. America that apply enviromnental accounting meth-
The World Bank, together with the UN Statisti- odologies to limited areas within countries. The Ar-cal Office (UNSO), has recently completed case gentina study valued a forest ecosysitem bystudies in Mexico (van Tongeren et al. 1991), and estimating the costs of improving productive func-Papua New Guinea (Bartelmus et al. 1992), to deter- tions and of maintaining ecosystem functions. Re-mine how such accounts can be prepared. The Papua sults gained were employed in modelling alternativeNew Guinea study demonstrates the feasibility of management and exploitation scenarios. The Mexicoapplying the SEAA framework in a country with study calculated adjustments to the gross product,relatively weak institutional capacities and limited due to a biological corridor, using market valuationdata availability, (a scenario that would exist in many of replacement cost in the agricultural and ,forestryresource-rich developing countries). Depreciation of sectors, and constructed physical balance sheets forproduced assets was calculated to be between 9 and individual resources (CIDE 1992). The H[icksian11 percent of Gross Domestic Product (GDP), result- concept of income was utilized to provide a reviseding in a conventional Net Domestic Product (NDP) measure of the region's income.of between 89 and 91 percent cif GDP. Environmental Gilbert performed a case study of Botswanaimpacts were assessed for the agriculture, forestry, using an environmental accounting franieworkmining and energy sectors. within a larger modelling and information system.
The authors estimated that these impacts The framework consisted of stock accounts (clescrib-amounted to 2.1 percent of NDPon average, for the ing natural resource stocks in physical units); re-1986-1990 time period. First, the Environmentally- source user accounts (describing stocks in physical

Part 1: Analytical Framework 13
and monetary units); and socio-economic accounts oriented reforms with the complementary goal of(which focused more on demographics, environ- environmental protection. Indeed, a key message ofmental policy, and the use of resources). However, the 1992 World Development Report is the need tofull implementation of the framework has not been identify and exploit such "win-win" policy reformpossible because of severe constraints on informa- opportunities. For example, addressing problems oftion (CTDIE 1992). land tenure as well as access to financial and social
An early application of environmental account- services not only yield econoric gains but also areing in a developing country was performed by essential for promoting environmental stewardship.Repetto et al. (1989) for the World Resources Insti- Similarly, refomis to improve the efficiency of indus-tute. The study collected data on petroleum, timber, trial or energy related activities will reduce both eco-and soil resources. The approach used is based upon nomic waste and environmental pollution (World Bankphysical stock and flow accounts of natural re- 1992).sources, and the valuation of these stocks. It has been Many instances of excessive pollution or re-suggested that the valuation method used in forestry source over-exploitation are due to market failuresoverestimates the true resource depreciation (Peskin and policy distortions exacerbated by unemploy-with Lutz 1990) but has nevertheless proved ex- ment, landlessness, and poverty (Munasinghe et al.tremely useful as an indicator of the magnitudes 1993). Therefore, broad policy reforms, which usu-involved in adjustments to GDP through environ- ally promote efficiency or reduce poverty, alsomental accounting (CIDIE 1992). Alater study by the should be generally beneficial for the environment.Tropical Science Center and the World Resources However, some of these reforms may have negativeInstitute (1991) utilized the same valuation method- environmental effects, depending on pre-existingology for forestry, but focused on providing detailed (and often localized) constraints or distortions-methods for the technical estimates of deforestation, such as inadequately defined property or resourcesoil erosion, and coastal fishery over-exploitation in rights. The challenge is to trace the complicatedpathsCosta Rica. An example from Brazil is provided in by which such policy changes ultimately affect in-Ser6a da Motta and Young (1991). Lutz (1993) is a centives for efficient resource use at the firm orrecent comprehensive volume on environmental ac- household level. The objective is not necessarily tocounting. directly modify the original broader policies (which
have other conventional, economic, or property re-Economywide Policies and the Environment lated goals), but rather to design more specific or
localized complementary measures. The latter wouldEconomywide policies (both macroeconomic and help mitigate negative effects or enhance the positivesectoral) play a significant role in the rate of deple- impacts of the original policies on the environmenttion of natural resources and the level of environ- Such complementary actions would include bothmental degradation. Fiscal and monetary policies, market-based approaches (like Pigouvian taxes onstructural adjustment programs, and stabilization environmental externalities or allocation of limitedmeasures all have an effect on the natural resource pollution rights coupled with marketable pennits), asbase. Unfortunately, interactions between the econ- well as non-market methods (such as command-and-omy and the environment are complex and not well control techniques). This process of articulating aunderstood. The ideal approach is a "general equilib- range of policies becomes more difficult whenrium" analysis that traces both the economnic and economywide reform programs address very broadenvironmental effects of economywide policy re- macroeconomic distortions.forms. However, such comprehensive methods areseldom feasible in developing countries where data General Economywide Policiesand skills are more scarce. "Partial"approaches thathelp to identify the most important impacts of At the outbreak of the economic crisis of the earlyeconomywide policies may be more practical. 1980s, many developing countries that had been
No simple generalizations are possible as to the running substantial budget and trade deficits andlikely environmental effects of broad policy meas- financing these by increasing external debt wereures. Nevertheless, opportunities have been missed forced to adopt emergency stabilization programs.oftenfor combining poverty reduction- or efficiency-

14 Part I: Analytical Franework
These programs may have had unforeseen environ- fish exports), then the degree of ownership wouldmental consequences. influence how production and resource slocks were
One important environmental impact of the cri- managed. Reactions might range from more invest-sis was related to poverty and unemployment. The ment in and maintenance of assets (if environmentalstabilization efforts often necessitated currency de- costs were internalized by owner-users) to rapid de-valuations, controls on capital, and interest rate in- pletion (when the users had no stake in the resourcecreases. When income levels dropped, tax revenues stock). The possibility of the latter result is empha-decreased accordingly. As unemployment increased, sized in another study (Capistrano and Kiker 1990).governments fell back upon expansionary financing They propose that increasing the competitiveness ofpolicies, which led to increases in consumer prices. world exports would also increase the opportunityThe effect of such policies on the poorest population cost of keeping timber unharvested. This could leadgroups often drove them onto marginal lands, resulting to forest depletion that significantly exceeds naturalin soil erosion or desertification. Fuel price increases regenerative capacity. Another recent study (Kahn andand lowered incomes also contributed to deforestation McDonald 1991) used empirical evidence to suggestand reductions in soil fertility, as the poor were forced that a correlative link exists between debt and defores-to use fuelwood and animal dung for heating, lighting, tation. They propose that debt burdens cause myopicand cooking. behavior that often results in overdepletion of forest
Aside from the contractionary aspects of short- resources-through deforestation rates that may not beterm stabilization measures, many macroeconomic optimal in the long run, but are necessary to meet shortpolicies also have potentially important effects on term needs.resource use and the environment. Unfortunately, no The important influence of the macroeconomiceasy generalizations as to the directions of these context for agriculture has already been shown by theeffects are possible; they can be either beneficial or classic studies of Johnson (1973) and Schuh (1974).negative, depending on specific conditions. For ex- More recently Krueger, Schiff, and VWldes (1991)ample, real currency devaluations have the effect of have compiled detailed country examples suggestingincreasing international comnpetitiveness, and raising that economywide factors may in fact be more imn-production of internationally tradable goods (for ex- portant than sectoral policies in agriculture. Theseample, forestry and agricultural products). If the studies point out that when a broad assessmentagricultural response occurs through crop substitu- perspective is adopted, direct output price inter-tion, environmental impact would depend on ventions by government turn out to have less effectwhether the crop being prornoted tended to be envi- on agricultural incentives than indirect, economy-romnentally benign (such as tea, cocoa, rubber) or wide factors, such as foreign exchange rates andenvironmentally damaging i(such as tobacco, sugar- industrial protection policies.cane, and corn). Environmental impacts would also The impact of economywide policies are impor-depend on whether increased production led to farm- tant for the environment, although studies are onlying on new land (which could result in increased starting to quantify the importance of their role. Fordeforestation) or to more efficient use of existing example, Hyde et al. (1991) cite studies in Brazil andfarmland. Another possibility is that overvaluationof in the Philippines that demonstrate how economicthe exchange rate (and the resulting negative terms policy spillovers constitute an important source ofof trade, decreased competitiveness of products and deforestation. Agricultural subsidies in Brazil prob-lower farmgate prices), may well push small cultiva- ably contribute to half of forest destruction in Ama-tors onto more environmenatally fragile marginal zonia (Mahar 1988, Binswanger 1989, Lewandroskilands, in an attempt to absorb the effects of the price and McClain 1990). Ageneral equilibrium simulationchanges. for the Philippines suggests that foreign exchange
In a recent review of the links between growth, rate changes, although motivated by general balancetrade policy and the environnent, (Lopez 1991), the of payments concems, have major implications forauthor argues that the output from a natural resource the demand for wood products, therefore influencingsuch as a forest or fishery (where production depends logging rates (Boyd et al. 1990). The case of fielwoodcritically on the stock) also will be affected by other may be as interesting, since fuelwood shortages havefactors such as property rights. Thus, if trade policy been identified as the major forestry problem inincreased the value of output (for example, timber or many developing countries. It is possible that na-

Part 1: Analytical Framework 15
tional price policies on fuel and investment policies tion, the reduction of government subsidies, or en-on altemative energy sources may be as important as ergy pricing reforms. Each such policy would haveany sector specific program for addressing the fuel- different implications for various environmental ar-wood problem. eas of concern. For examnple, devaluation would
Arecent study of WorldBankcountry andsector significantly affect timber and crop prices and there-work has sought to present an overview of how fore influence deforestation trends (indicated by theeconomywide policy reforms to promote develop- arrows in the top half of Figure 2.4). This approachment have numerous unanticipated environmental is explored more systematically in Table 2.1.effects (Cruz and Munasinghe 1992). Ongoing work The first column of Table 2.1 contains a fewon this project includes a series of country case among the many issues addressed by macroe-studies. conomic and sectoral decisionmakers. The
The linkages among economywide policies and economywide policies in the second colunm of thethe environment may be examined from two major table are usually designed to address these issues,perspectives - economic and environmental. First, with the corresponding direct economic objectives orconsider the viewpoint of macroeconomic and sec- development impacts in the third column. Examplestoral planners or decision-makers, especially those of second-order, and often unanticipated environ-involved in national economic planning in the Min- mental impacts are listed in the fourth and last col-istry of Finance or Planning, or in key sectoral line umn. Industrial protection reform provides oneMinistries. Inicreasingly, they would wish to know example of how both positive and negative environ-the likely impact of a specific policy on a range of mental effects (last row, last column of Table 2.1),environmental issues. Iypical policies might in- might be associated with such an economywide pol-clude local currency devaluation, price liberaliza- icy. Therefore, to properly evaluate broad policy
Figure 2.4 Interaction Among Economic Policies and Environmental Issues
National Economic Plan: Environmental Action Plan:Economywide Policies Environmental Issues
Devaluation * ___ -
* \*0 Deforestation
* 0
Low Energy Prices * 0
* 0 Urban Air Pollution
* 0

16 Part I: Analytical Framework
Table 2.1 Some Typical Examples of Direct and Indirect (Environmental) Impacts of Policies
Policy Direct IndirectPolicy Issue Reform Objectives/Effects (Environmental E^ffects)
1. Trade Flexible Promote industrial Export promotion maydeficits. exchange rates. competitiveness, exports; lead to more deforestation
reduce imports. for export, but it couldalso lead to substitution oftree crops for annualcrops. In addition,industrial job creation mayreduce pressures on landresources.
2. Food security and Agricultural Increase crop yields and May reduce spontaneousunemployment. intensification in settled acreage; absorb more rural rnigration to ecologically
]ands and resettlement labor. fragil areas. However,programs for new areas. there is potential for over-
use of fertilizers andchemicals.
3. Industrialization Iteduce tariffs and special Promote competition and More openness may leadprotection, associated with investment incentives. industrial efficiency. industry to adopt moreinefficient production. energy-efficient or less
pollution-pronetechnologies. However, itmay also lead to in-rnigration of hazardousindustries.
reforms, their direct and indirect effects need to be nomic policies, including foreign exchange and ag-identified, and any trade-offs between their conven- ricultural price policy reforms.tional development contribution and their environ- This second approach is illustrated in Table 2.2,mental effects need to be assessed. where the first column lists some typical environ-
Retuming to Figure 2.4, let us consider the mental issues that are incorporated in environmentalsecond (or converse) viewpoint of environmental action plans. These issues are catogorized accordingpolicyrnakers-e.g., those in ihe Environment Min- to varying economic characteristics in the secondistry who are charged with preparing the national column. Column 3 contains a sampling of broadenviromnental action plan (NEAP). They may be policy reforms that could affect the particular envi-quite concerned to find out which of a bewilderingly ronmental problem. For example, water availabilitywide range of economic poLicies (current or pro- and quality will depend primarily on domestic priceposed) would have substantial imnpacts on a specific policies while energy generation will often be veryenvironmental issue that has high priority in the sensitive to international fuel prices. Thus, rational-NEAP (e.g., urban air pollution or deforestation). If izing domestic water charges and subsidies will beair pollution is the major concem, then the NEAP crucial in promoting more sustainable water use,should include a detailed review of policies such as whereas trade and exchange rate policies (that influ-energy pricing (indicated by the arrows in the bottom ence fuel prices) will be relevant for improving en-part of Figure 2.4). On the other hand, addressing ergy efficiency.deforestation issues would require particular atten- Ideally, both the above approaches (eccinomniction to be paid to a somewhat different set of eco- and environmental) should be developed consis-

Part l: Analytical Framework 17
Table 2.2 Some Typical Environmental Issues, Their Characteristics, and Sensitivity to Policy Reforms
Resource/EnvironmentalManagement Issue Sectoral Economic Characteristics Relevant Policy Reforms
1. Agricultural expansion and * many small, competitive * reduction of taxes and subsidiesdeforestation decisionmakers are involved * exchange rate and trade reforms
* outputs, inputs are mostly * poverty and incomeinternationally traded distribution policies* government implements * property rights reformssubstantial production subsidiesand trade intervention
2. Water depletion and degradation * supply side is dominated by * intersectoral pricinggovermnent or monopolies; bulk * reduction of subsidies andof resource use goes to large introduction of charges forcommercial enterprises and resource degradationirrigation systems* resource is not internationallytraded but sectoral use andproductivity for main user groupssubstantially differ* prices are highly regulated
3. Energy use and air pollution * as with water, supply side * exchange rate reformsdominated by government and * reduction of cross-subsidiesmonopolies * privatization programs for* inputs (coal, oil) are generally generating and distributiontraded; output broadly linked to all activitiesproduction activities* sectoral investment and pricinghighly centralized
tently within the same comprehensive framework of tegrating the domestic economy into the world econ-national decisionmaking. However, in practice they omy (Fischer and Thomas 1990).tend to be quite distinct and disjointed, often because Adjustment lending started in the early 1980s toof historical constraints. Overcoming such problems address the problem of maintaining growth in coun-may require far-reaching reforms in decisionmaking tries severely affected by the worldwide economicprocesses and institutions, even before new policies crisis. The crisis was triggered by the second roundare formulated and implemented. of energy price hikes, the collapse of export markets,
and increased international interest rates (WorldStructuralAdjustment Bank 1988). These external conditions, combined
with lack of competitiveness of local industries, lag-Structural adjustment programs address a well-de- ging employment generation, and persistent budgetfined set of reform areas. These will generally in- deficits, led to unsustainable current account deficits.clude establishing an appropriate macroeconomicframework for growth, introducing a set of support- Thus, trade-oriented reforms, including tanffing sectoral policies and investment efforts, and in- reductions and devaluation, became key components

18 Part I: Analytical Framiework
of adjustment lending. Because the deficit is identi- known about the intervening or mediating role ofcafy equal to the use of foreign savings, adjustment factors such as property rights and populationimplications for managing external debt have also re- growth.ceived much attention. In turn, this led to concern for In the early to mnid-1980s, environmental aspectsstimulating domestic savings., increasing the role of were relatively neglected in adjustment lending op-taxation in resource mobilization, decreasing the extent erations. There were few, if any, explicit loan com-of government expenditures, and making investments ponents or conditionalities that weremore productive. "environmental." Thus, the 1989 study emphasized
The benefits and costs of such programs are the potential complementarities between the adjust-highly country-specific. In a recent review of the ment reform components and environmental objec-Latin American experience, Birdsall and Wheeler tives. For example, trade liberalization was(1991) conclude that there is no evidence to show considered potentially environmentally beneficial.that open developing country economies are more Increased agricultural export prices would implyprone to pollution. They argue that the inflow of higher land values and therefore more investment inforeign technology and capital would tend to bring land. Of course, assumptions on land tenure securityin better pollution standards. At the same time, it is were needed to complete the argument.the pollution-intensive heavy industries sector that The above study has been updated recentlyhas generally benefitted froni protective industrial (Warford et al. 1992). The current review concludesand trade policies. Nevertheless, some concern per- that environmental aspects have been increasing insists that encouraging foreign investment and priva- importance in adjustment programs. Recent pro-tization might lead to the growth of "pollution grams, from 1988-92, includemore thanjust anomi-havens," given the weakness of environmental regu- nal treatment of environment. For example. aboutlations in most developing countries. Trade liberali- 60% of the 58 countries involved in the review hadzation also could encourage the growth of adjustment programs whose loan components orenergy-intensive and/or highly polluting industry. conditionalities were environmentally motivated.However, pollution caused by industrialization During FY79-FY87, the comparable figure would onlycould be offset by afforestaticin (although this does have been 37%. In addition, environmental policy re-not necessarily compensate residents of polluted forms have been the subject of some sectoral adjust-areas), and limited by appropriate taxation policies ment programs.that encouraged the use of pollution abatement In recent years, non-govermnental organiza-technologies. tions and academic institutions have contributed to
Next, we examine to what extent those who the debate on the environmental effects of stmicturaldesign structural adjustment lending programs have adjustment and stabilization programs-among theprogressed in recognizing their environmental impli- most recent efforts being the studies undertaken bycations and in incorporating policy measures that the World Wildlife Fund (WWF) and the Worldcould reduce negative impacts or enhance environ- Resources Institute (WRI).mentally beneficial effects. An initial assessment of The WWF-sponsored report (Reed, ed., 1992)the environmental relevance of structural adjustment included three case studies, in C6te d'Ivoire, Thai-reforns was undertaken by Seblastian and Alicbusan land, and Mexico. In CBte d'Ivoire, no direct linkage(1989). This study looked at how the adjustment was established between macroeconomic policieslending reforms may have affected environmental and the environment. Underlying institutional fac-factors. The reforms included (I) relative price tors and market and policy failure at the sectoral levelchanges in agricultural outputs, inputs, energy, ex- had a greater impact on natural resource use thanport taxes; (2) trade and industry policy reformn; (3) macroeconomic instruments. Again, in the case ofchanges in public expenditure programs; and (4) Mexico, no clear linkages between macroeconomicinstitutional reforms by sector. At the time of com- policy and the environment could be establishedpletion of this paper, most of the links between (although, at the micro level, inappropriate pricingadjustment-related policies and the environment fo- for water and energy has resulted in adverse environ-cused on inter-sectoral effects, e.g., between in- mental consequences). In Thailand, evidence sug-creased agricultural export prices and incentives for gested that, while structural adjustment programsagricultural land managemrent. Also, little was may have reduced resource depletion and environ-

Part I: Analytical Framework 19
mental degradation per unit of output, overall envi- include industrial promotion and investment incen-ronmental quality declined because of the increase tives, tax incidence, import liberalization and trade,of output in the aggregate. Because the underlying and energy pricing. These are undertaken to improvemarket failures with regard to the natural resource resource allocation, but they also have importantsector were not adequately addressed, and social and implications for macroeconomic stability andenvironmental costs were not fully internalized, the growth (Fischer and Thomas 1990). The first is pri-trade-off (between economic growth and loss of en- marily a microeconomic goal while the second is anvironmental quality) may not have been economi- adjustment goal.cally efficient or enviromnentally sustainable. For example, taxation and government expen-
The WRI (Cruz and Repetto 1992) performed a ditures are the prime microeconornic mechanismsstudy on the environmental effects of structural ad- for resource allocation. However, they also comprisejustrnent and stabilization programs in the Philip- the basic elements of fiscal policy. In turn, fiscalpines. They found that structural adjustment policies policy has a critical macroeconornic impact becausehad not adequately examined adverse envirounental it directly determines the fiscal deficit and thereforeimpacts of macroeconomic policies. This resulted in affects the current account deficit and, after a lag,increased emissions, concentrated pollution and con- investment levels.7 Tax reform issues are particularlygestion, increased pressure on open-access re- relevant from an environmental management per-sources, and encouraged overexploitation of spective because they can have a wide range ofnon-renewable resources. They suggest several poli- potential impacts on resource use. The choice of thecies (for example, the taxation of resource rents, tax or tariff base, for example, can lead to substantialenergy taxes, and the elimination of industrial incen- changes in the level of pollution-related activities.tives), that could limit environmental damage while Such environmental implications, however, are notat the same time promoting economic objectives considered in conventional assessments that focus onsuch as fiscal balance, poverty alleviation, and eco- fiscal effectiveness. Other sectoral reforms, such asnomnic efficiency. those dealing with energy pricing and industrial ex-
Rationalization of public expenditure is an inte- ports, also affect macroeconomic stability and havegral part of many Structural Adjustment Loans thus played a regular role in adjustment programs(SALs), and usually emerges from recommendations (Yagci et al. 1985, World Bank 1989).on spending priorities made in Public Invest- Beyond their role in contributing to a stablement/Expenditure Reviews (PI/ERs). macroeconomic environment, sectoral policies also
Such reviews provide a consistent framework have economy-wide relevance in terms of promotingwithin which the borrowing country and the Bank growth from the supply side. These include sectoralcould discuss how spending decisions might be investment and pricing policies as well as sectoralbest tailored to meet the priority objectives of regulation and institutional development. As notedmacroeconomic management. Environmental con- by Fischer and Thomas (1990), the traditional ap-siderations would be incorporated better into deci- proach to development was through investment insions affecting intra sectoral resource allocation, agriculture, industry, infrastructure, and human re-as well as specific projects investment, by more sources. However, the contribution of these sec-effective use of the PI/ER process. toral investments also depended largely on the
macroeconomic policy context and on the presenceSectoral Policies of enabling institutions.
Practical examples of the effects sectoral poli-While adjustment is inherently a macroeconomic cies have on the environment have been described ineffort, involving macroeconomic policy reform, it several studies. Some countries subsidize urban con-also requires specific sectoral reforms (Cruz and sumers by placing price ceilings on food. In suchMunasinghe 1992). The key macroeconomic vari- cases, the environmental consequences will be theables in adjustment programs are the investment- same as for currency overvaluation, as both result insavings gap, the fiscal deficit, the trade deficit, the lowered incentives to increase production of interna-exchange rate, and the rate of inflation. The microe- tionally tradable crops.conomic or sectoral reforms relevant to adjustment

20 Part I: Analytical Framework
'iWo classic studies by Mahar (1989) and Bin- Notesswanger (1989) highlighted how distorted publicpolicies have exacerbated environmental problems 1. For details, see World Bank, Operationail Directivein the Brazilian Amazon region over several decades. 4.01.Mahar showed that poor and landless peasants have 2. Further details concerning the sumnmanized materialMl this section may be found in Dasgupta. P., S. M[arglin andcontributed to deforestation, basically responding tO A.K. Sen, 1972. Guidelines for Project Evaltuati on, UNEDO,incentives such as highways that opened up jungle New York Little, I.M.D. and Mirrlees, J. 1974. ProjectAp-areas, govemment land grants, access to public in- praisal and Planning for Developing Countries, New York,frastructure, and cash subsidlies. Some of the blame Basic Books; Munasinghe, M., 1990b. Energy Analysis andis attributable directly to govemment settlement pro- Policy, Butterworths Press, London; Ray A., 1984. Cost
BenefitAnalysis, Baltimore: Johns Hopkins University Press;jects. Large scale livestock as well as iron ore smelt- and Squire, L. and H. Van der Tak. 1975. Economic Analysising (in the Carajas area) have contributed to land of Projects, Baltimore, Johns Hopkins University Press.degradation. Binswanger, focussing on the agricul- 3. In the more technical context of a mathematicaltural sector, argued that tax and land distribution programming macroeconomic model, the optimal values ofpolicies, and the provision of credit to farmers, not the dual variables (that correspond to the binding resoure
availability constraints in the primal problem) have dimen-only encouraged deforestation but also worsened sions of prce, and could be interpreted as shadow pricesincome distribution (by favoring larger landowners). (LAenberger 1973, Sassone 1977).
More recently, Lutz and Young (1992) have 4.AseminalreferenceonthefreeriderprincipleisP.A.stressed that rational agricultuural policies that elimi- Samuelson 1954. "The Pure Theory of Public Expenditures",nated subsidies for farm inputs (like fertilizers and Review of Economics and Statistics, 36, 370-89.pesticides) could provide both economic and envi- 5. For a review of the basic theory of extemailities, seeponnesticides)icouldSpr ider both al. (1993)argue that R. Coase, "The Problem of Social Cost", Journal qfLaw andronmental gains. Schneider et al. (1993) argue that Economics, October 1960; and D.M.G. Newbery, "Exteunali-unsustainable destruction of ithe Amazon is the result ties: The Theory of Envirounental Policy" in G.A. Hughesof farmers, ranchers and loggers responding quite and G.M. Heal (eds), 1980,Public Policy and the TaxSystem.predictably and rationally to distorted incentives 6. Dasgupta and Maler (1991) suggest that in order toarising from poor govemmeint policies and political avoid double-counting, expenditures that enhance the re-instability. source base, (such as planting fcrests), should not be includedinstability, ~~~~~~~~~~~in national incomne comnputations, since they are already re-
Some recent examples of World Bank sectoral flected in the value of changes in the resource stockcs.work that attempted to address issues of environ- 7. Stanley Fischer and Vmod Thomas, "Policies formental concem through policy reform are detailed in Economic Development" in American Journal of Agricul-Annex 5 (Cruz and Munasinlghe 1992). tural Economics,Vol. 72, No. 3, August 1990.

3. Framework For Environmental-EconomicDecisionmaking
As discussed earlier, a comprehensive framework for Basic Concepts of Economic Valuecost-benefit analysis of projects in developing coun-tries was in place by the 1970s, including sophisti- Conceptually, the total economic value (TEV) of acated techniques of shadow pricing to compensate resource consists of its (i) use value (UV) and (ii)for economic distortions, as well as social weights to non-use value (NUV). Use values may be brokenadjust for income distributional concerns. With the down further into the direct use value (DUV), theemphasis on market-oriented reforms and economic indirect use value (IUV) and the option value (OV)liberalization in the 1980s, some of the enthusiasm (potential use value). One needs to be careful not tohas waned for applying such a complex system rig- double count both the value of indirect supportingorously (Little and Mirrlees, 1990). functions and the value of the resulting direct use.1
Nevertheless, the rise of environmental con- One major category of non-use value is existencecerns, and growing evidence of associated externali- value (EV).2 We may write:ties and market failures have revived interest ineconomic evaluation of projects and policies. In TEV = UV + NUVview of the increasing risk of environmental degra- or TEV = [DUV + IUV + OV] + [NUV]dation, even modest attempts to assess environ-mental impacts and risks would be well justified. Figure 3.1 shows this disaggregation of TEV inIdeally, environmental cost and benefits should be schematic form. Below each valuation concept, aquantified economically and integrated into tradi- short description of its meaning and a few typicaltional cost benefit analysis. In cases where valuation examples of the environmental resources underlyingof environmental impacts is problematic, other tech- the perceived value, are provided:niques such as multicriteria analysis may be used to * direct use value is determined by the con-incorporate the environmental concerns into invest- tribution an environmental asset makes toment decisions and policies. current production or consumption;
* indirect use value includes the benefitsValuation of Environmental Costs derived basically from functional servicesand Benefits that the enviromnent provides to support
current production and consumption (e.g.,Incorporating environmental concerns into eco- ecological functions like natural filtrationnomic decisions involves two basic steps. First, the of polluted water or recycling of nutri-"with"and "without"project scenarios are compared ents);to identify the physical impacts (broadly defined to * option value is basically the premium thatinclude also ecological and social effects) of a given consumers are willing to pay for an unu-economic activity. Engineers, biologists, social sci- tilized asset, simply to avoid the risk of notentists, and other experts are required to determine having it available in the future (a moresuch impacts. An important issue, outside the scope detailed version is provided later in thisof this paper, is that such physical impacts are com- section); andplex and often poorly understood. * existence value arises from the satisfac-
Economically valuing such physical impacts tion of merely knowing that the assetconstitutes the second step in the environmental-eco- exists, although the valuer has no inten-nomic analysis, as described below. tion of using it.
Option values and non-use values are shaded inthe figure, to caution the analyst concerning some ofthe ambiguities associated with defining these con-cepts-as shown in the examples, they can spring

Figure 3.1 Categories of Economic Values Attributed to Environmental Assets (with Examples from a Thopical Forest)
Total Economic Value
. I,,IUse Values Non-Use Values
I I . ltII. l IDirect Use Indirect Use Option Existe'ce Other Non-UseValues Values Values Vle Valu's
Output that Functional Future direct Value fromcan be benefits and indirect knowledge ofconsumed use values continueddirectly existence
o Food o Ecological o Biodiversity o Habitatso Biomass functions o Conserved o Endangeredo Recreation o Flood control habitats specieso Health o Storm protection
e ADecreasing "tangibility" of value to individuals
Source: Adapted h-o Peare (1992).

Part I: Analytical Framework 23
from similar or identical resources. Economic theory on the level of services attributed to nonuse values.clearly defines TWV (see next section), but there The question of strictly partitioning use and non-usetends to be considerable overlap and ambiguity in the values therefore becomes more complex.breakdown categories, especially with regard to non- For the practitioner, what is important is notuse values. Therefore, these categories are useful necessarily the precise conceptual basis of economicmainly as an indicative guide. Further, the distinc- value, but rather the various empirical techniquestions often become irrelevant in practical estimation that permit us to estimate a monetary value for manysince the objective is to measure TUV rather than its enviromnental assets and impacts. However, there iscomponents (see Randall 1991 for details). uncertainty in the results derived from some of these
Non-use values tend to be linked to more altru- techniques even in developed market econornies, andistic motives (Schechter and Freeman, 1992). The therefore their use in developing countries should bediffering formns of altruism include intergenerational tempered by caution and sound judgement.altruism, or the bequest motive; interpersonal altru-ism or the gift motive; stewardship (which has rather Overview of Practical Valuation Techniquesmore ethical, as opposed to utilitarian origins); andq-Altruism, which states that the resource has an A variety of valuation techniques may be used tointrinsic right to exist. This final definition is clearly quantify the above concepts of value. The basicwell outside the conventional economic theory, in- concept of economic valuation underlying all thesecorporating the notion that the welfare function techniques is the willingness to pay (WTP) ofshould be derived from something more than purely individuals for an environmental service or re-humanutility. Quiggin(I991)has put forward amore source.3 Willingness to pay itself is based on thecontroversial point-that the more radical forms of area under the demand curve, as illustrated belowaltruism could not be reconciled within a conven- by a simplified case.tional BCA framework. In Figure 3.2, the curve D(So) indicates the
There has been considerable debate recently demand for an environmental resource (e.g., theconcerning the applicability of non-use values. number of visits made per month, to a freshwaterSmith (1992) states that further research is needed in source like a river). Xo is the original demand levelorder to better describe the public good services at the price p (e.g., the cost of making a trip,underlying non-use values. Consider the indirect including the value of time spent for travelling).utility function The total WTP or value of the services provided by
the environmental resource is measured by the areaU = V(Y,P,Q) OHEA which consists of two main components:
(1) the area OBEA or (pXo), which represents thewhere Y is the individual's income, P is a vector of total cost; and (2) the area BEH, which is calledprices for private goods available on markets (or the consumer surplus or net benefit (i.e., the netthrough well-defined conditions of access to assets value over and above actual expenses). The pointsuch as recreation sites), and Q is a vector of services H represents the choke price, at which demand(both use and non-use) derived from a given environ- falls to zero.mental resource. The distinction between use and Next, we extend this example to examine whatnon-use value is made by introducing constraints that could happen if the quality of the environmentallinkQ to one or more of the goods rationed by prices. service is improved (e.g., by clean-up of the fresh-Smith points out that for Q to include services based water source). The normal response would be anon non-use values, it must be capable of changing increase in demand, represented in Figure 3.2, bywithout an individual undertaking any actions. The a shift in the demand curve from D(So) to D(SI).factors altering Q must satisfy the requirements of a The new level of demand is Xi (assuming the samepublic good-they must be non-exclusive and non- price p), yielding the corresponding total WTPappropriable. If attention is paid to the source of equal to area OGFI, and the new net benefit meas-services underlying nonuse values, it may emerge ured by area BF. Thus, the quality improvementthat the components of Q based on use values depend will result in an incremental increase in the value

24 Part 1: Analytical Framework
Figure 3.2 Benefit Increase Due to the Improvement in Quality of an Environmental Asset
Value
p 1. E
D(S1 )
Demand
oftheenviromnentalresource-givenbytheshaded mental asset could be defined in terms of thle differ-areaEFIH.4 ence between the values of two expenditure (or cost)
The theoretically correct demand function to functions. The latter are the ninimum amounts re-use in estimating value, is the compensated or Hick- quired to achieve a given level of utility-for asian one which indicates how demand varies with household (or output-for a firm) before and afterprice while keeping the user's utility level constant varying the quality of, price of, and/or access to, theEquivalently, the change in value of an environ-

Part I: Analytical Framework 25
environmental resource in question, while keeping then the market valuation will be a partial meas-all other aspects constant (see also Annex 3). ure, and shadow price corrections may need to be
Problems of measurement may arise because made. The foregoing comments apply to change ofthe commonly estimated demand function is the production.Marshallian one-which indicates how demand var- Often, the result of the impact cannot be directlyies with the price of the environmental good, while related to a market activity. In some of these cases,keeping the user's income level constant. In practice, the WTP could be estimated at conventional marketit has been shown that the Marshallian and Hicksian value by using a closely related proxy. Care shouldestimates of WTP are in good agreement for a variety be exercised on the following points: a) the rele-of conditions, and in a few cases the Hicksian func- vant attributes affected by the environmental im-tion may be derived, once the Marshallian demand pact might, in the case of the proxy measure, befunction has been estimated (Willig 1976, Kolstad mixed with other attributes, thereby affecting theand Braden 1991). value of proxy; and b) if the proxy attributes are
What people are willing to accept (WTA) in the identical to the ones lost by the impact, then theway of compensation for environmental damage, is value given by the proxy is only a lower bound foranother measure of economic value that is related to the true WTP. This approach applies to the follow-WTP. WTA and WTP could diverge as discussed ing techniques: loss of earnings, defensive expen-below (Cropper and Oates 1992). In practice either diture, replacement cost, and shadow project.or both measures are used for valuation, and there- In certain cases the WTP can be estimatedfore references to WTP in the case studies may be through derivation of a demand function for thebroadly interpreted to include WTA also, unless environmental asset through analysis of actual be-otherwise stated. havior. Examples of this approach (also called surro-
As shown in Table 3.1 valuation methods can be gate market techniques) include travel cost, wagecategorized, on the one hand, according to which differential, and property valuation. The WTP cantype of market they rely on, and on the other hand, also be elicited through a controlled experiment orby considering how they make use of actual or po- direct interviews, using the artificial market tech-tential behavior of economnic agents.5 nique or contingent valuation.
Next, we provide some general comments about While empirical evidence indicates that ques-valuation, before separately discussing each of the tions about willingness to accept compensation yieldtechniques in Table 3.1 in greater detail. higher answers than questions about willingness to
Under specific conditions, such as when the pay to retain the same amenity, there is no explana-environmental impact leads to a marginal change in tion for this discrepancy on the basis of economicthe supply of a good or service that is bought on a theory. It has been suggested that WTA questionscompetitive market, the WTP can be estimated di- need more time to be properly understood and as-rectly in terms of changes valued at prevailing mar- sininlated, and that the gap between WTA and WTPket prices. If the market is not fully competitive, narrows with successive iterations. However, it has
Table 3.1 Taxonomy of Relevant Valuation Techniques
Conventional market Implicit market Constructed market
Based on actual behavior Effect on Production Travel Cost Artificial MarketEffect on Health Wage DifferencesDefensive Cost Property ValuesPreventive Cost Proxy Marketed Goods
Based on potential Replacement Cost Contingent Valuationbehavior Shadow Project Other

26 Part I: Analytical Framework
also been suggested that people are willing to spend with other measures of the demand for wateractual income or wealth less readily than "opportu- (Markandya 1991).nity" income or wealth-money they do not yet have Whittington et al. (1992) carried out a revealingbut may obtain (Knetsch and Sinden, 1984). It may study in Nigeria. The study was designed a) to meas-also be the case that individuals are more cautious ure the demand for different types of drinking waterwhen weighing the net benefits of changing assets programs in Nigeria in a way that would allow pre-than when no change is made. Generally, WTP is dictions of household participation patterns with dif-considered to be more consistent and credible a ferent designs and pricing schemes; b) to evaluate themeasure than WTA. However, when significant dis- feasibility of using CVM in rural villages wherecrepancies exist between the two measures, then the respondents have limited education and monetaryhigher values of WTA may be more appropriate when resources; and c) to examine the consequences ofvaluing losses in environmental benefits. This in turn giving respondents time to evaluate contingent valu-would lead to higher values for conservation projects ation questions before taking their bids. The authors(Markandya 1991). found that respondents who were allowed time to
WTPis often used even when the situation being think about WTP questions made significantly lowervalued involves a loss of amenity-(the question is bids the second time around. This was tnre for boththen presented in the form of what one is willing to public water systems and private connections. Thepay to prevent a loss (Markandya, 1991). Hanemamn authors concluded that the differences were not a(1991:) showed that the rneasure to be employed result of strategic behavior because of the open-depends on the problem under consideration. He ended interview process used, and multivariatedemonstrated that the difference between WTA and analyses of WTP bids. They noted that these find-WTP varies directly with the income elasticity of ings are probably not easily transferable to devel-demand for S (the desired good or service) and oped country studies, given the increasedinversely with the elasticity of substitution between consumer awareness in the industrialized world.S and private goods. Therefore, WTP and WTA are We conclude this section by noting that environ-equal if the income elasticity of demand for S is zero, mental impacts also may be classified as indicated inor if S is a perfect substitute for a private good. Table 3.2.Conversely, as the elasticity of substitution between In the table, on-site and off-site are relativeS and private goods approaches zero, then the differ- terms, since they depend on how widely the projectence between WTA and WTP could become large. site or "boundary" is defined. For example, inunda-
In developing countries, the ability to pay be- tion of land near a new dam is definitely on-site,comes a concern. Especially in low income areas, whereas distant effects like extent of siltation farmoney values placed on environmental goods and downstream of the dam are off-site. In-between im-services are traditionally low. One way of addressing pacts could be classified in either category, depend-this concern within cost benefit calculations is to use ing on the project boundary assumed in the; analysis.income weights. However, the use of income weights There is a related time dimension. For example,is somewhat constrained by the data problems in off-site effects also tend to occur in the more distantgetting income or consumption levels of the con- future, than on-site impacts (although this is notcerned groups. In such cases, the decision criterion always the case). Clearly, there is a systematic in-has to evaluate the income distribution impacts sepa- crease in the difficulty of valuation as the analystrately, i.e., based on the social concept of sustainable progresses from on-site, short-run, market priceddevelopment discussed in Chapter 1 (see also the impacts to off-site, long-run, non-market priced ef-Madagascar case study in Chapter 5, and Markandya fects. In the developing world, given data, time and1991). An alternative approach would be to measure resource constraints, it would be advisable to avoidbenefits of environmental imaprovements in terms of attempting to value off-site, non-market priced envi-willingness to accept income for loss of amenity, as ronmental impacts.opposed to willingness to pay for an environmentalimprovement. For example, in water supply projects,WTP can be zero, whereas WTA is more consistent

Part I: Analytical Framework 27
Table 3.2 Ease of Valuation of Environmental Impacts
Availability of Direct Market Prices to Value ImIpact
Impact Location Inpact Time Yes No
On-Site Short-Run Quite Easy to Value Sometimes Possible to ValueLong-Run Highly Possible to Value Possible to Value in Special Cases
............................................................................................................................... ....................................................................... ...............................
Off-Site Short-Run Often Possible to Value Difficult to ValueLong-Run Sometimes Possible to Value Rarely Possible to Value
Source: Adapted from Hamilton, Dixon and Miller (1989).
Actual Behavior in Conventional Markets This technique seeks to avoid ethical controver-sies associated with valuing a single specific life,
The techniques summarized below rely mainly on attempting instead to place a value on changes in thedirectly observable effects or actions valued at mar- statistical probability of ill-health or death (some-ket prices (see north-west corner of Table 3.1). what like the actuarial values used by life insurance
Effect on production. An investment decision firms). Moreover, governments and public healthoften has environmental impacts, which in turn affect authorities routinely set priorities and allocate healththe quantity, quality or production costs of a range of expenditures which affect human well-being. Thisoutputs-that may be valued readily in economic in turn provides a baseline for determining implicitterms.There are examples of this in two case studies values placed by society on various health risks, boththat follow in chapter 4. In the study on soil conser- for prevention and cure of illness.vation in Lesotho, the increased production from Defensive or preventive costs. Often, costsconserved land is estimnated. In the valuation of 1 may have been voluntarily incurred by communitieshectare of Peruvian rainforest the values of different or individuals to mitigate or undo the damage causedproduction schemes are compared. Furher examples by an adverse environmental impact. For example,include impacts on tropical wetlands (Barbier et al. if the drinking water is polluted, extra filtration1991) and the effects of sedimentation on coral diver- and/or purifying chemicals may need to be used.sity and ultimately on fish production (Hodgson and Then, such additional defensive or preventive expen-Dixon 1988). ditures (ex-post) could be taken as a minimum esti-
Effect on health. This approach is based on mate of the benefits of mitigation. The assumptionhealth effects caused by pollution and environmental is that the benefits of avoided environmental degra-degradation. One practical measure that is relevant dation at least exceed the costs of avoidance. Theis the value of human output lost due to ill health or advantage of the technique is that defensive or pre-(in some cases) premature death. The loss of poten- ventive outlays (already made) are easier to deter-tial net earnings (called the human capital technique) mine than the value of the original environmentalis one proxy for foregone output, to which the costs damage. One weakness is that the defensive actionsof health care or prevention may be added (as a form are sometimes decided upon quite arbitrarily withof replacement/defensive expenditure)-see the little reliance on market forces, so that the costs bearZimbabwe water supply and health study in chapter little relation to the potential environmental benefit.4. The above measure assumes that earnings reflect Recently, Harrington et al. (1989) evaluated thethe value of marginal product and that medical treat- economic damages of a waterbome disease outbreak,ment costs are well defined. The method also en- emphasizing that the valuation of averting behaviorcounters difficulties when the cause-effect link requires the establishment of a relationship betweenbetween environmental quality and ill-health is un- observable defensive expenditures, and non-observ-clear, or the sickness is chronic (i.e., of long dura- able willingness to pay.tion).

28 Part 1: Analytical Framework
Potential Behavior in Conventional Markets Implicit Markets
This section summarizes techniques in which Often, relevant market data is not available in di-potential or future actions could be valued in conven- rectly usable form, to value environmental resources.tional markets to provide a measure of environmental In many such cases, analysis of indirect market datadegradation, provided there is a high degree of cer- (e.g., using statistical and econometric, multiple re-tainty that such actions will be undertaken. gression methods) permits the valuation to be carried
Replacement cost and shadow project. If an out implicitly. A variety of such surrogate market-environmental resource that has been impaired is based methods-including travel cost, the "hedonic"likely to be replaced in the future by another asset methods (property value and wage differential), andthat provides equivalent services, then the costs of proxy goods-as well as their applicability underreplacement may be used as a proxy for the environ- different circumstances, are described below.mental damage. This is an ex-ante measure similar Travel cost. This method seeks to determine thein spirit to the (ex-post) defensive costs approach. It demand for a recreational site (e.g., number of visitsmay be argued that the benefits from the environ- per year to a lake or game park), as a function ofmental resource should be at least as valuable as the variables like consumer income, price, and variousreplacement expenses.This approach is especially socio-economic characteristics. The price is usuallyrelevant if there is a sustainability constraint that the sum of observedcost elements like (a) entry pricerequires certain asset stocks to be maintained intact to the site; (b) costs of travelling to the site; and (c)(see the discussion in Chapter 1). foregone earnings or opportunity cost of time spent.
The replacement cost approach has been applied The consumer surplus associated with the estimatedto deterioration of groundwater resources in the Phil- demand curve provides a measure of the value of theippines, by determining the cost of developing alter- recreational site in question. More sophisticated ver-native water sources (Munasinghe 1990c). The same sions include comparisons (using regression analy-technique of estimating potential ex-post mitigation sis) across sites, where environmental quality is alsoexpenditures represented by the increased costs of included as a variable that affects demand (for ahealth care, is used in the Manicaland case study that detailed survey, see Mendelsohn 1987 and Bockstaelfollows. et al. 1991).
The use of shadow projecst reflects an institu- Until a few years ago, most applications of thistonal judgement on the value of replaced environ- technique were to be found in the market economies,mental assets, and has been discussed in the context but quite recently, several examples have emergedof project-level sustainability. Such a shadow pro- involving developing world applications. Three ofject is usually designed specifically to offset the the case studies sunmmarized in chapter 4 use theenvironmental damage caused by another project. travel cost method. In one case study, the travel costThe cost of the shadow project is a measure of the for domestic trips to a forest reserve in Costa Rica isvalue of environmental assets that are thereby re- used. In another, a study on the value of elephants instored. The original project and shadow project to- Kenya, the travel cost of tourists from Europe andgether form a sustainable package which helps to North America is used as one estimate of consumermaintain undiminished, some vital stock of environ- surplus. Finally, Lumpinee Park in Thailand wasmental resources. For example, if the original project used also as an example of travel cost analysis in awas a dam which inundated some forest land, then developing country setting. In chapter 5, the Mada-the shadow project might involve the replanting of gascar case study uses a sophisticated internationalan equivalent area of forest, elsewhere. Often the travel cost model.equivalency criterion is hard to satisfy exacly-in the Property value. In areas where relatively com-above example, the two tracts of forest may have the petitive markets exist for land, it is possible to de-same volume of biomass, but could differ widely in compose real estate prices into componentsterms of biodiversity. attributable to different characteristics like house
size, lot size, proximnity to schools, shops, parks, etc.(Cropper and Oates 1992). To value an environ-

Part I: Analytical Framework 29
Figure 3.3 The Trade-Off Curve in Multi-Objective Decisionmaking
family ofequipreferencecurves
cn~~~~~~~~~~~~~~~~N
N~~~~~~~~~~~
(I) N-
a0 .- N. O
.> trade-off curve N
0
Objective Z2 (Biodiversity Loss)
mental variable like air or water quality, the method the benefits of the projects, to determine the bias ofseeks to determine that component of the property the hedonic method, if any. The IDB also used thevalue attributable to the relevant environmental vari- hedonic price method to estimate the benefits of aable. Thus, the marginal WTP for improved local water quality improvement project in Ecuador. How-environmental quality (air, land or water) is reflected ever, the model used seems to undervalue the bene-in the increased price of housing in cleaner neighbor- fits of the sewerage connections, and the valuationhoods. of the waste treatment plant resulted in very uncer-
This method has limited applicability in devel- tain benefits (the estumation model did not obtain aoping countnes because it requires a well functioning significant coefficient on the dummy variable usedhousing market, as well as sophisticated information to measure water quality, although the sign is right).and tools of statistical analysis. Jimenez (1983) used Additionally, the benefits of a cleaner river on athis technique to explain changes in housing prices regional or national basis were not accounted for. Thein a Manila slum area, upgraded partly due to water author concludes that the contingent valuationand sanitation service improvements. Markandya method (see below) may have been more appropriate(1991) examines Inter-American DevelopmentBank to use in this case.(IDB) projects that utilized the hedonic price method Wage differences. As in the case of propertyto estimate the benefits of installing a sewerage pro- values, the wage differential method attempts to re-gram in El Salvador, and a drainage program in late changes in an economic price variable (i.e., theBrazil. He points out that, since hedonic pricing can wage rate), to environmental conditions. The under-lead to an overestimation of benefits, it would be lying assumption is that there is some component ofhelpful if more than one method were used to value the wage that is determined by the environmental

30 Part 1: Analyticai Framework
Figure 3.4 Exclusionary Screening
MORE Tradeoff curve
CMAX
Feasibleset ofoptions
U)0
BMAX
LESS BIODIVERSITY LOSS MORE
pollution or hazard associ,ated with the job or work vide an example involving marketed and non-mar-site. The technique is relevant when competitive keted fish substitutes.labor markes exist, where wages (that reflect themarginal product of labor) iequilibrate the supply and ConstructedMarketsdemand for labor. (See earlier discussion on shadowpricing and wage rates). One consideration is that In cases, where market information cannot be usedthis method relies on private valuation of health risks, directly or indirectly, market-like behavior needs torather than social ones. In this context, the level of be deduced through construction or simulation. Theinformation concerning occupational hazards must methods summarized below depend on direct ques-be high in order for private individuals to make tions, surveys or marketing experiments.meaningful tradeoffs between health risks and remu- Contingent valuation. When relevant marketneration. Finally, the effects of all factors other than behavior is not observable, the contingent valuationenvironment (for example, skill level, job responsibil- method (CVM) puts direct questions to individualsity, etc.) that might influence wages must be eliminat to determine how much they might be willing-to-payto isolate the impacts of environment (WTP) for an environmental resource, or h1ow much
Proxy marketed goods. This method is useful compensation they would be willing-to-acceptwhen an environmental good or service has no read- (WTA) if they were deprived of the same resource.ily determined market value, but a close substitute The contingent valuation method is more effectiveexists which does have a competitively determined when the respondents are familiar with the environ-price. In such a case, the mLarket price of the substi- mental good or service (e.g., water quality) and havetute may be used as a proxy for the value of the adequate information on which to base their prefer-environmental resource. Barbier et al, (1991) pro- ences. CVM is likely to be far less reliable when the

Part I: Analytical Framework 31
object of the valuation exercise is a more abstract other types of bias. (For details, see The Energyaspect like existence value. Journal, 1988). Munasinghe (1990a) provides sev-
Generally, declared WTA tends to be signifi- eral early examples of the application of CVM tocandly greater than the corresponding WTP. This value the quality of electricity services in developingmay be partly attributable to "strategic bias" where countries.respondents feel that they would be better off inflat- A review by Pearce and Markandya (1989)ing the amounts they would receive rather than the compared valuation estimates obtainedfrom market-sums to be paid out, if the hypothetical questions based techniques and CVM, using results from sevenposed were somehow to become a reality in the studies carried out in industrial nations. They foundfuture. "Status quo bias" could also serve to increase that the corresponding estimates overlapped withinWTA or WTP estimates-in this case, individuals an accuracy range of plus or minus 60 percent. Thewho have become accustomed to a certain level of conclusion is that CVM, cautiously and rigorouslyenviromnental quality simnply may be signalling their applied, could provide rough estimates of value thatinstinctive resistance to change. Providing more in- would be helpful in economic decisionmaking, espe-formation about options as well as opportunities to cially when other valuation methods were unavailable.reconsider choices, could help to reduce this form of Recently, Strand and Taraldset (1991) tested forbias. In the case of poorer individuals, WTP may be multiple bias in a contingent valuation study in Nor-limited by the ability-to-pay, whereas WTA is not. way. They followed a two-step procedure, compar-Generally, the CVM questionnaires have to be care- ing valuation of air pollution alone; and secondlyfully designed, implemented and interpreted to over- deriving an implicit valuation of the air pollutioncome the above mentioned difficulties, as well as issue from the ranking of a broader set of six envi-
Figure 3.5 Trade-Offs Among the Three Basic Objectives of Sustainable Development
ECONOMIC
x ECs OLOGICAL
0
x SOCIAL

32 Part 1: Analytical Flrarnework
ronmental issues (problems due to oil spills at sea; ment of a group of relevant "experts"is sought tofreshwater pollution; noise pollution; air pollution; estimate the desired values.garbage and waste accumulation; and pressure onrecreational areas). They found that expressed valu- Multi-Objective Decisionmakingations of air pollution reductions were three to four (or Multi-Criteria Analysis)times as high as the true values, and believe that thisis due to the upward bias of what they term "mental Valuation techniques seek to estimate environmentalaccounting"-whereby individuals tend to focus too impacts in economic terms. Often, projects or poli-much of their total valuation of a much larger set of cies and their impacts are embedded in a system ofenvironmental goods on the particular object to be broader (national) objectives, e.g., defined by socialvalued. If biases had not existed, the authors estimate and ecological concerns of the type discussed in thethat from total WTP for a]ll six issues the amount introduction. To the extent that the impacts of pro-allocated for air pollution would be only 50-60% of jects and policies on these broader objectives maythe figure stated when they were asked about air be valued economically, all such effects can bepollution alone. incorporated into the conventional decisionmak-
Despite the limitations of the method, in certain ing framework of cost-benefit analysis. However,circumstances, contingent valuation may be the only some social and biophysical impacts cannot be easilyavailable technique for estimating benefits. It can quantified in monetary terms, and multi-objectiveand has been applied to common property re- decisionmaking offers a complementary approach,sources, amenity resources with scenic, ecological which may facilitate the optimal choice arnong in-or other characteristics, and to other situations vestment options or policies available.where market information is not available Multi-objective decisionmaking, or multi-crite-(Mitchell and Carson 1989). ria analysis (MCA), differs from CBAin three major
Examples of contingenit valuation surveys in areas (van Pelt, 1991). While CBA focuses on effi-developing countries are given in the case studies. ciency (although incorporation of income distribu-The use of the contingent valuation method for esti- tion objectives may be attempted), MCA (toes notmating the value of viewirng elephants in Kenya impose limnits on the fonns of criteria, allowing forshows that it is possible to achieve an understanding consideration of social and other forms of equity.of the order of magnitude of the benefits with only Secondly, while CBA requires that effects be meas-limited efforts. The study on willingness to pay for ured in quantitative terms, to allow for the applica-water services in southern Haiti tests the methodol- tionof prices, multi-objective decisionmaking canbeogy for different biases and reliability of estimated broken down into three groups: one that requiresvalues. The willingness to pay for improved sanita- quantitative data, a second that uses only qualitativetion in Kumnasi, Ghana, is another example of CVM data, and a third that handles both simultaneously.successfully employed in a developing country. Finally, multi-objective decisionmaking does not re-
Artificial market. Such markets could be con- quire the use of prices, although they might be usedstructed for experimental purposes, to determine to arrive at a score. CBA uses prices which mayconsumer willingness to pay for a good or service. sometimes be adjusted according to equity weight-For example, a home water purification kit might be ing. Multi-objective analysis uses weighting involv-marketed at various price levels or access to a game ing relative priorities of different groups as opposedreserve might be offered on the basis of different ad- to pricing. Van Pelt concludes that the choice be-mission fees, thereby facilitating the estimation of the tween the two methodologies is a matter of the trade-value placed by individuals on water purity or on the off between methodological and empiricaluse of a recreational facility, respectively. considerations. If efficiency is the only criterion and
Other. A variety of essentially opinion- and prices are available to value efficiency attributes,survey-based techniques for determining values of CBA is preferable. However, in many cases, a pau-environmental impacts have been used. They are city of data, and the need to incorporate social andrelated to the CVM approach but are more ad-hoc. biophysical impacts makes the use of multi-objectiveOne of these is the Delphi melhod, where the judge- analysis a more practicable and realistic option.

Part I: Analytical Framework 33
Multi-objective decisiornaking calls for desir- one objective against the other-typical equiprefer-able objectives to be specified. These often exhibit a ence curves are illustrated in Figure 3.3. The pre-hierarchical structure. The highest level represents ferred alternative is that which results in the greatestthe broad overall objectives (for example, improving utility-which occurs (for continuous decision vari-the quality of life), often vaguely stated and, hence, ables as shown here) at the point of tangency D ofnot very operational. Some of these, however, can be the best equi-preference curve, with the trade-offbroken down into more operational lower level ob- curve.jectives (e.g., increase income) so that the extent to Since the equi-preference curves are usually notwhich the latter are met may be practically assessed. known other practical techniques have been devel-Sometimes only proxies are available (e.g., if the oped to narrow down the set of feasible choices onobjective is to enhance recreation opportunities, the the trade-off curve. One approach uses limits onattribute number of recreation days can be used). objectives or "exclusionary screening". For exam-Although value judgements may be required in ple, in Figure 3.4, the decisionmaker may face anchoosing the proper attribute (especially if proxies upper bound on costs CMAX (i.e., a budgetary con-are involved) in contrast to the single-criterion meth- straint). Similarly, ecological experts might set aodologies used in economic cost-benefit analysis, maximum value of biodiversity loss BMAX (e.g., ameasurement does not have to be in monetary terms. level beyond which the ecosystem suffers cata-More explicit recognition is given to the fact that a strophic coUapse). These two constraints help tovariety of concerns may be associated with planning define a more restricted portion of the trade-off curvedecisions. (darker line), thereby narrowing and simplifying the
An intuitive understanding of the fundamentals choices available.of multi-objective decisionmaking can be provided Of the several multi-criteria methods that haveby a two-dimensional graphical exposition such as in been developed, the practical method which is mostFigure 3.3. Assume that a scheme has two non-com- suitable to determine the best alternative availablemensurable and conflicting objectives, Zi and Z2. depends upon the nature of the decision situation.6
For example, Zi could be the additional project cost For instance, interactive involvement of the decision-required to protect biodiversity, and Z2, some index maker has proved useful in the case of problems char-indicating the loss of biodiversity. Assume further acterized by a large number of decision variables andthat alternative projects or solutions to the problem complex causal interrelationships. Some objectives can(A, B and C) have been identified. Clearly, point B be dealt with through direct optimization, while othersis superior (or dominates) to A in terms of both Zi require the satisfaction of a certain standard (e.g., leveland Z2 because B exhibits lower costs as well as of biological oxygen demand or BOD not below 5biodiversity loss relative to A. Thus, alternative A milogranis per liter).may be discarded. However, we cannot make such a More generally, five main forms of multi-criteriasimple choice between solutions B and C since the evaluation methods have been identified (Pearce andformer is better than the latter with respect to objec- Tumer, OECD, 1990). These are the aggregation, lexi-tive Zi but worse with respect to Z2. In general, more cographic, graphical, consensus-maximizing, and con-points (or solutions) such as B and C may be identi- cordance approaches.fied to define the set of all non-dominated feasible Aggregation techniques add up scores over asolution points that form an optimal trade-off curve range of criteria to identify the optimal solution. Itor curve of best options. includes methods such as the Environmental Valu-
For an unconstrained problem, further ranking ation System, which estimates the net enviromnentalof altematives cannot be conducted without the in- impact of a project in temis of a single compositetroduction of valuejudgements. Specific information index score. Four key environmental factors are as-has to be elicited from the decisionmaker to deter- sessed: ecology, pollution, aesthetics and human in-mine the most preferred solution. In its most com- terest. Criteria are weighted by a panel of expertsplete form such infonnation may be summarized by using the Delphi method. Value transfornation func-a family of equi-preference curves that indicate the tions are applied to all project impacts, which couldway in which the decisionmaker or society trades off result in overly subjective indexing, and the applica-

34 Part !: Analytical Framework
tion of scores to certain indicators of pollution (e.g., representation of decision problems in the sense thatemission levels) can be questioned. Bearing these several objectives can be accounted for. However, aqualifications in mind, this method could be utilized key question concerns whose preferences are to befor example, in determining whether to follow a more considered. The model only aids a single decision-conventional (fossil-fuel based) energy policy in the maker (or a homogeneous group). Various interestedmedium term, or whether to pursue an alternative groups will often assign different priorities, to thestrategy which placed greater emphasis on energy respective objectives, and normally it may not beconservation and renewable energy sources. possible to determine a single best solution via the
The lexicographic approach ranks criteria from multi-objective model. Also, the mathematicalthe most to the least important, thereby not allowing framework imposes constraints upon the ability tofor trade-offs among criteria. The method is best effectively represent the planning problem. Nilon lin-suited to cases where priorities, are clear. An example ear, stochastic, and dynamic formulations can assistis a toxic waste facility, where acceptable/non-ac- in better defining the problem but impose costs inceptable risk levels can be relatively easily defined. terms of complexity in formulation and solving the
Graphical approaches employ a method that model (Cocklin 1989).plots altematives on graphs with reference to bench- Nevertheless, in constructing the model tie ana-mark positions (which would be the 'best' scores of lyst communicates information about the nature ofany particular alternative). Weighting is used to as- the problem. He specifies why factors are importantsign relative importance. The method does not con- and how they interact. Liebman (1976) observes thatsider possible collinearity between criteria, a "modelling is thinking made public" and considersproblem that often emerges in multi-criteria analysis. the transfer of knowledge as perhaps the most impor-It also requires that data be in ratio or interval form. tant contribution of modelling. With respect to theA version of this method has been utilized in the second point of criticism (i.e., diverse preferences),U.S.A., to value the externalilies that are to be re- Liebman suggests that there is value to be gained inflected in bidding programs for permits to release constructing models from differing perspectives andsulfur dioxide. comparing the results.
Consensus maximization aggregates individual In addition to facilitating specific tradeoff deci-preferences to form group consensus. The Borda- sions at the project level, the multi-objective ap-Kendall method ranks criteria in terms of importance proach could also help in selecting strategic paths.in order to reveal an overall index of imnportance. The broadest representation of multi-criteria trade-This method could be helpful, for example, in at- offs arising from sustainable development efforts aretempting to estimate the siting of a hydropower pro- shown in Figure 3.5, where the axes are labelledject, by taking into account preferences across according to the three basic objectives (economic,different interest groups (farmers, government plan- social and ecological) discussed in the Introductionners, conservation groups, etc.) (see Figure 1.1). Conceptually, three broad indicators
Concordance methods assume non-compensa- may be envisaged-one for each major objective,tory values between criteria, thereby negating the with movements along any given axis indicating anpossibility of establishing trade-offs. Comparisons improvement in that indicator. In practice, each suchare carried out on a pairwise basis, and a mathemati- indicator would itself consist of many disaggregatecal concordance or discordance index is used to yield sub-indices. Some limited mapping from one axis toindexes of dominant and non-dominant solutions. A the other may be possible (e.g., to the extent thatscore foreach alternative is establishedby examining environmental assets could be valued, then ecologi-the overall comparative performance of an altema- cal concems may be incorporated within the eco-tive against the whole range of criteria. A possible nomic indicator).application of this could be for a wetlands drainage The non-inferior (or trade-off) surface XYZproject that would result in irreversible loss of biodi- shown in Figure 3.5 is the best that could be achievedversity. given the current availability of resources and lakowl-
The major accomplishment of multi-objective edge. In the real world, societies would operate atdecision models is that they allow for more accurate points such as A that are well within this surface-

Part /: Analytical Framework 35
due to constraints and inefficiencies. Therefore, the rium between consumption and investment), equalsfirst step would be to identify actions that would both the marginal rates of time preference and returnmove us closer towards the non-inferior surface (e.g., on capital. In practice, government policy distor-along the path AB). Such so-called "WIN-WIN" tions and market failures lead to divergences be-activities that simultaneously improve all three indi- tween the rates of time preference and return oncators would have the highest priority. One clear capital. Furthermore, the social rate of time prefer-example mnight be to reduce the pollution and degra- ence may be less than the individual time preferencedation of freshwater resources in developing coun- rate, because long-lasting societies are likely to havetries. First, maldng higher quality water available a bigger stake in the more distant future than rela-would increase economic output (e.g., by improving tively short-lived individuals.health productivity). Second, it would certainly im- The rate of capital productivity is often veryprove the ecological status. Finally, the social in- high in developing countries, because of the scarcitydicator would rise also, since water quality of capital. In the poorer countries, the rate of timeimprovements tend to benefit mainly the poor. Once preference also is elevated in many cases, because ofthe shift from A to B is achieved, movements along the urgency of satisfying immediate food needsthe surface (such as B C) would be the next step-this rather than ensuring long-term food security (Pearceprocess is more difficult to determine, since it would and Turner 1990).involve trade-offs among the different objectives. A study was conducted in rural India which
compared estimated rates of time preference of headsThe Discount Rate of rural households. Results were derived from hy-
pothetical questions, and games involving real andDiscounting is the process by which costs and significant awards (Pender and Walker 1992), and
benefits that occur in different time periods may be indicated the existence of a marked positive timecompared. Economists typically use a forward-look- preference. Wealth was inversely and significantlying approach in which past (or sunk) costs and bene- related to the discount rate in many of the experimen-fits are ignored, while a discount rate is applied to tal games and hypothetical questions. Aproportionalfuture costs and benefits to yield their present values. 10% rise in net wealth was accompanied by a 3-7%T he use of standard criteria for cost-benefit analysis fall in the discount rate.(CBA), such as the net present value (NPV) and In both the games and the questions, the dis-internal rate of return (IRR), have been explained in count rate declined with increases in the time framemore detail earlier. (See the section on cost-benefit and the magnitude of reward (Pender 1992). Thiscriteria). suggests that the neoclassical discounted utility
The issue of choosing an appropriate discount model, which imnplies that the rate of time preferencerate has been discussed in the context of general CBA is independent of time frames and the amounts offor many years.7 The long term perspective required commodities, does not always hold true. The lack offor sustainable development suggests that the dis- properly developed capital mnarkets in many devel-count rate might play a critical role in intertemporal oping economies often causes investment decisionsdecisions concerning the use of enviromnental re- to be linked to consumption decisions, and to dependsources. on the nature of preferences. For policy purposes, the
Tvo concepts help shape the discount (or inter- importance of understanding intertemporal prefer-est) rate in a market economy. First, there is the rate ences is evident.of time preference which determiines how individu- Higher discount rates may discriminate againstals compare present-day with future consumption. future generations. This is because projects withSecond, there is the rate of return on investment (or social costs occurring in the long term and net socialopportunity cost of capital), which determines how benefits occurring in the near term, will be favoredan investment (made by foregoing today's consump- by higher discount rates. Projects with benefits ac-tion) would yield a stream of future consumption cruing in the long run will be less likely to be under-(net of replacement). In an ideally functioning mar- taken under high discount rates. It is therefore aket, the interest rate (determines the point of equilib- logical conclusion that future generations will suffer

36 Part !: Analytical Framework
from market discount rates detennined by high rates nario in which growth and consumption are fallingof current generation time preference and/or produc- (e.g., catastrophic global warming in 100 years), thentivity of capital. g could become negative and consequently CTP may
Based on the foregoing, some environmentalists be small or even negative. In this case, with CTP ashave argued that discount rates should be lowered to the discount rate, future costs and benefits wouldfacilitate environmentally sound projects meeting loom much larger in present value terms than if thethe CBA criteria. However, this would lead to more conventional opportunity cost of capital (say 8%)investment projects of all types, thereby possibly was used, thereby giving a larger weight to long-threatening the environmentally fragile resource term, intergenerational concerns. The key point isbases. Krautkraemer (1988) argued that lowering that it may be mnisleading to choose discount ratesdiscount rates can in fact worsen environmental deg- without assuming some consistent future scenario.9
radation-by reducing the cost of capital and thereby Thus an optimistic future would be associated withlowering the cost of production such that more is higher discount rates than a gloomy one--which isconsumed in the near term relative to the case where consistent since the risk of future catastrophies shoulddiscount rates were higher (for a more recent expo- encourage greater concern for the future.sition c2f this point see Norgaard 1991). Pearce (1991) andvan Pelt (1991) make thecase
Many environmentalists believe that a zero dis- that the discount rate traditionally used for projectcount rate should be employed to protect future gen- appraisal at international institutions may be tooerations. However, employing a zero discount rate is high. Pearce points out that if rates above 1-2% areinequitable, since it would imply a policy of total used, then global warming is not taken into consid-current sacrifice, which runs counter to the proposed eration as a serious concern, and future generationsaim of eliminating discrinination between time pe- would be left to bear the cost. The only means ofriods-especially when the present contained wide- achieving such a low rate would be to cisregardspread poverty (Pearce 1991). utility discounting as unethical, to abandon opportu-
There is some basis, in traditional discount rate nity cost discounting, and to place specific restric-analysis, to argue in favour of using declining (and tions on the nature of the income-utility function. Heeven negative) discount rates for evaluating costs and concludes that use of the opportunity cost rate alonebenefits over very long (or multi-generational) time does not appear justifiable on grounds of intergen-periods, when welfare and returns on investment erational equity, and therefore that an appropriatemay be falling. Consider the consumer rate of time range of estimates would be 2-5%. Van Pelt arguespreference which has components: CTP = a + ,g that, in many parts of the world, high discount ratesHere, a represents the preference of an individual cannot be justified on the basis of CBA theory. Ap-for comsumption today rather than in the future-it plication of CBA principles would suggest that inmay be based on the myopic notion of "pure" pref- many African countries as well as India, the rate oference, as well as the risk perception that future discount should be as low as 5%. He suggests thatconsumptionmaynever be realized. , is the elasticity the rate of discount should be determined on a coun-of marginal welfare and g is the growth rate of try-specific basis, and be regularly updated, as is theconsumption. The second term (0g) reflects the fact case with other shadow prices.that the declining marginal welfare of consumption Norgaard makes the case that manipulating dis-combined with increases in expected future con- count rates to reflect sustainability concerns results insumption will combine to make future consumption an inefficient use of capital. Instead he suggests directless valuable than present-day consumption, i.e., income transfers to compensate for environmerntal deg-since we are likely to be richer in the future, today's radation. He utilizes a general equilibrium model toconsumption is more highly valued. demonstrate that income transfers to future genera-
The general consensus is that a is close to zero, tions, through the efficient allocation of resources,usually 0-3%, and j may be in the range of 1 to 2. result in new levels of savings and investment, a shiftThus if g is large (i.e., high expected economic in the types of investments, and a different interest (orgrowth rates), then CIP could be quite large too.8 discount) rate. The rate of interest may increase orOn the other hand, if we consider a long-range sce-

Part 1: Analytical Framework 37
decrease, but this is irrelevant, since it merely serves work of policy andprojectdecisions; (c) In the caseas an equilibrating price. of projects leading to irreversible damage, CBA should
Since the discount rate may be an inappropriate be adapted to the extent possible, to include a measure-tool to facilitate such intergenerational transfers, a ment of the foregone benefits of preservation in thebetter altemnative might be to impose a sustainability computation of costs; and (d) where valuation of envi-constraint, whereby current well-being is maximized ronmental impacts is difficult, and large irreversiblewithout reducing the welfare of future generations damage might occur, restrictions might be set to limitbelow that of the current generation. The aim would the enviromnental degradation within acceptable bio-be to ensure that the overall stock of capital (broadly logical or physical norms.defined) is preserved or enhanced for future genera-tions (see also the discussion of sustainability con- Risk and Uncertaintystraints in Chapter 1). In practice, this would entailmonitoring and measurement of capital stocks (man- Risk and uncertainty are an inherent part of economicmade, human and natural) and an overarching invest- decisions. Risk represents the likelihood of occur-ment policy that sought to ensure that compensating rence of an undesirable event like an oil spill. In theinvestments offset depreciation of existing assets case of uncertainty, the future outcome is basically(Pearce 1991). Apart from the previously detailed unknown. Therefore, the risk of an event may beattempts to include depreciation of natural resource estimated by its probability of occurrence, whereasstock in national income accounting, little has been no such quantification is possible for uncertaintyaccomplished in this area. Where such a sophisti- since the future is undefined. The risk probabilitycated approach may be impractical, simple rules that and severity of damage could be used to determinelimit specific environmental impacts (e.g., ground- an expected value of potential costs, which thenwater pollution standards) may be a useful first step would be used in the CBA.to protect the rights of future generations. However, the use of a single number (or ex-
In the case of projects leading to irreversible pected value of risk) does not indicate the degree ofdamage (such as destruction of natural habitats, and variability or the range of values that might be ex-so on), the benefits of preservation may be incorpo- pected. Additionally, it does not allow for individualrated into standard cost-benefit methodology using perceptions of risk. If the future cannot be perceivedthe Krutilla-Fisher approach (Markandya and Pearce clearly, then the speed of advance should be tailored1988). Benefits of preservation will grow over time to the distance over which the clarity of vision isas the supply of scarce environmental resources de- acceptable. Global warming is an illustrative exam-creases, demand (fueled by population growth) in- ple. In the past, the greenhouse effect of C02 emis-creases, and existence value possibly increases. The sions was not known or recognized as a risk. At theKrutilla-Fisher approach incorporates these increas- present time, there is still considerable uncertaintying benefits of preservation by including preserva- about the future impacts of global warning, buttion benefits foregone within project costs. The given the large magnitude of potential consequences,benefits are shown to increase through time by the caution is warranted. As more understanding of theuse of a rate of annual growth. While this approach phenomenon is gained, the uncertainty may be trans-has the same effect on the overall CBA as lowering formed into estimates of future risk probability.discount rates, it avoids the problem of distorted The traditional and simple way of incorporatingresource allocations caused by arbitrarily manipu- risk and uncertainty considerations in project levellating discount rates. CBA has been through sensitivity analysis.Using
In summary, the following conclusions may optimistic and pessimistic values for different vari-be reached, within the context of environmental ables can indicate which variables will have the mostcost-benefit analysis: (a) The normal range for pronounced effects on benefits and costs. Althoughopportunity costs of capital (e.g., 6-12 percent) sensitivity analysis need not reflect the probability ofmay be used as the discount rate; (b) Efforts should occurrence of the upper or lower values, it is usefulbe made to ensure that compensating investments for determining which variables are most importantoffset capital stock degradation within a frame- to the success or failure of a project (Dixon et al.

38 Part I: Analytical Framnework
1988). More sophisticated approaches to analyze risk cases. The issue is the practical redundancy of OVand uncertainty are available. (See, for example, (which may be captured in other measures), ratherBraden and Kolstad 1991).In particular, deterninis- than its conceptual validity. This view is reflected bytic a point estimate of value could be quite mislead- Freeman (1993):"I think it is time to expunge optioning, whereas a range of values helps identify more value from the list of possible benefits associatedrobust options. Various criteria such as mini-max and with environmental protection".minimum-regret may be used (Friedman 1986). Environmental policy formulation is compli-
The issue of uncertainty plays an important role cated by the presence of numerous forms of uncer-in environmental valuation and policy formulation. tainty. As an illustration, Bromley (1989) identifiedOption values and quasi-option values are based on six different aspects of uncertainty in the case of airthe existence of uncertainty. Option value (OV) is pollution resulting from acid deposition. They are (i)essentially the premium that consumers are willing identification of the sources of particular pollutants;to pay to avoid the risk of not having something (ii) ultimate destination of particular emissions; (iii)available in the future (see the study on valuation of actual physical impacts at the point of destination;elephants in Kenya.) While option value has been (iv) human valuation of the realized impacts at thedescribed in various ways, one useful technical defini- point of destination of the emissions; (v) the extenttion is the difference between tlhe ex-ante and ex-post to which a particular policy response will have anwelfare associated with the use of an environmental impact on the abovementioned factors; and (vi) theasset (Smith 1983). The sign of option value depends actual cost level and the incidence of those costs thatupon the presence of supply and/or demand uncer- are the result of policy choice.tainty, and on whether the consumer is risk averse or Bromley suggests that the way in which policy-risk loving (Pearce and Turner 1 990). makers address these uncertainties depends on their
Quasi-option value (QOV) is the value of pre- perception of the existing entitlement structure. Theserving options for future use in the expectation that interests of the future are only protected by an enti-knowledge will grow over time. If a development tlement structure that imposes a duty on currenttakes place that causes irreversible environmental dam- generations to consider the rights of future genera-age, the opportunity to expand knowledge through tions. He terms them "missing markets," noting thatscientific study of flora and fauna is losL Uncertainty "future generations are unable to enter bids to protectabout the benefits of preservation tobe derived through their interests". In the absence of such a structure,future knowledge expansion (which is independent of decisionmakers may tend to follow a policy thatdevelopment) leads to a positive QOV. This suggests ignores costs to future generations, and minimisthat the development should ba postponed until in- costs to current generations at the expense of thecreased knowledge facilitates a more informed deci- future. If the entitlement structure is adjusted, thesion. If information growth is contingent upon the policymaker can then examine three policy instru-development taking place, which is unlikely in an ments to ensure that future generations are not madeenvironmental context, then QOV is positive when the worse off: mandated pollution abatement; full com-uncertainty regards the benefits of preservation, and pensation for future damnages (e.g., by taxation); andnegative when the uncertainty is; about the benefits of an annuity that will compensate the future for coststhe development.10 imposed in the present. In the face of uncertainty, the
Recently, the applicability of option value has first option would appear to be the most efficient.come into question (Markandya 1991). If calcula- Other important sources of uncertainty linkedtions are performed in terms of the option price with environmental issues include uncertainty about(valuing what a person would pay for future benefits land tenure, which leads to deforestation and unsus-today) then the option value may be redundant. The tainable agricultural practices, and uncertainty aboutoption value basically calls for an individual to add resource rights, which can accelerate the rate ofoption value to expected future benefits to bring total depletion of a nonrenewable resource. Policyrnakersvalue up to the option price. As most CVM methods can address these issues by instituting land reforms,carry out valuations in terms of the option price, the and by designing appropriate taxation policies thatuse of option value may be impractical in many

Part I: Analytical Framework 39
return rents to public sources rather than to private attribute (i.e., cleanness of water) are weak complementsagents. (Maler 1974).
5. In a recent paper, Maler (1992) classifies valuationmethods into two broad groups: (1) Surveys of Willingness
Notes to Pay (like contingent valuation), and (2) Production Func-tion based. He divides category (2) into two sub-categories:
1. For a discussion and example of tiis, see Aylward, B. (2a) output measurable in markets (corresponding to theand E. Barbier, "Valuing Environmental Functions in Devel- secondcolumninTable3.1-conventionalmarkets); and(2b)oping Countries", Biodiversity and Conservation, 1992, vol. output not measurable (other methods in Columns 2 and 3 of1, pp. 34-50. Table 3.1).
2. The various terms in the equation for TEV may be 6. For an introductory overview relevant to naturalgrouped in somewhat different ways, for convenience. See resource analysis, see Munasinghe, M. 1992. Water Supplyfor example Walsh, R. G., J. B. Loomis, and R. A. Gillman, and Environmental Management, Boulder, CO: Westview1984, "Valuing Option, Existence and Bequest Demands for Press. An extensive survey including references to about 150Wildemess." Land Economics, 60, (1). In order to measure applications has been done by C. Romnero and T. Rehman.willingness to pay for wildemess protection, they sought to 1987. pp. 61-89. A shorer, but more recent, survey is by F.separate (a future-oriented) preservation value from recrea- Petry. 1990.tional use value (in current use). Accordingly, these authors 7. For more details, see P. Dasgupta, et al 1972; A.C.defined preservation value (PV) as option value plus exist- Harberger, 1976; and Little and Mirrlees, 1974.ence value plus bequest value, i.e., PV = [ OV + EV + BV 1. 8. Assumning a consumption based numeraire for wel-
3. For an up-to-date exposition, see C.D. Kolstad and fare W, we may write W = W(c). Then B = - (c(d2W/dc2)/JB.Braden, "Environmental Demand Theory", Chapter 2 in (dW/dc)) and g = (l/c)(dc/dt). Marginal welfare increasesBraden and Kolstad (eds.) 1991, Measuring the Demandfor with consumption: (dW/dc) > 0; but at a declining rate:Environmental Quality, Elsevier, New York, 1991; and A. (d2 W/dc2 ) < 0. Therefore P > 0, so that the sign of the termRandall, "Total and Non-Use Values", Chapter 10 in Braden ( 3g) is the same as sign of g. (See Dasgupta & Heal 1979,and Kolstad (eds.) 1991. chapter 10, for details).
4. Fromatheoreticallystrictviewpoint,the abovemeas- 9. For an example where the discount rate is endo-ure of value is correct in this case, only if the good in question genized and reflects future consumption, see Uzawa 1969.(i.e., visits to the water source) and the environmental quality 10. See Pearce and Turner 1990, and Fisher and Hane-
mann 1987.

PART II: CASE STUDIES
4. Short Case Studies of Environmental ValuationIn this section shorter case studies from developing to hybrids). The calculation, which is valid for onecountries are briefly outlined. For ease of reference, year only, does not take into consideratiorn the im-they are grouped according to the valuation tech- pacts on soil conservation. Calculations for maizeniques described earlier. While the case studies are and sorghum show a real marginal internal financialnot necessarily ideal and exhibit various shortcom- rate of return of minus 21 and minus 30 percent,ings, the main purpose of thie exposition is to illus- respectively for the two alternative options.trate the implementation of some of the techniques An economic cost-benefit analysis is per-of environmental impact valuation. Further details of formed, distinguishing between productivity gainsthese case studies are provided in Annex 2. These due to increased use of commercial inputs, and im-illustrations apply primarily to the direct and indirect pacts due to increased soil conservation. Unlike inuse value categories shown in Figure 3.1. Because the earlier financial analysis, soil conservationdeveloping country examples describing attempts to measures are included here, as the calculation cov-estimate option, existence, and bequest values are ers a five-year period. Costs are primarily laborrare, several studies applied to the industrialized and material input costs. This analysis is carriedcountries are also presented. out taking into account the perspective of the Le-
sotho government and the donor agency, the Swed-Effect on Production Method ish International Development Authority ('SIDA).
Primary benefit categories include increased pro-Cost-Benefit Analysis of Land Improvement duction of sorghum and maize (incremental yieldin Lesotho] due to conservation relative to future decline in
yield due to erosion), fruit, fuelwood, and fodder.The Farm Improvement with Soil Conservation Given various assumptions regarding the rate of(FISC) project was initiated in Southern Lesotho in growth of project implementation factors (see de-1985, with the overriding aim of raising agricultural tails in Annex 2), the results of the base case are anproduction among smallholdler fanming households NPV of minus M 7.0 million at a discount rate ofthrough soil conservation measures, subsidized in- 10 percent and minus M 5.6 million at 1 percent.puts, and afforestation. Table A 2.2 demonstrates that conservation crop
In pursuit of this goal the project has rehabili- benefits are more significant at a lower discounttated old terrace structures, constructed new ones, rate, as they are slow to materialize.and added other structures for conservation. It has The qualitative interpretation is that the projectpromoted the use of hybrid maize and sorghum, the makes a loss that is significant in compariscin to theplanting of fodder grasses, and tree planting. It has resources invested. In terms of the overriding targetalso promoted rotational grazing on communal ran- of the project, to raise agricultural production amonggeland. Conservation in this study is defined as the smallholder farming households, the project cannotpromotion of optimum use of land in accordance be termed successful. However, the benefits of soilwith its capability (so as to assure its maintenance conservation may have been underestimated in theand improvement). desire to improve crop yields (FISC is oriented to-
A financial analysis of two cultivation options wards production rather than preservation). Givenis carried out that compares a high commercial input demand uncertainty arising from lack of informationalternative (implying the use of fertilizer and hybrid on future population, food habits, agricultural tech-seed) with the traditional alternative (implying no nology, and capacity to import food; and supplyuse of fertilizer and locally saved seeds as opposed uncertainty about the possibility of droughts leading

Part II: Case Studies 41
to soil losses, it may be advisable to ascribe a positive predict the market outcome than one which focusedoption value to soil conservation efforts to be incor- on the returns to land. This deduction is confirmedporated into the stream of costs and benefits. Again, by behavior in the market, where forest extractivismif long-term protection of the land base is assigned a has tended to vanish wherever labor has had reason-higher priority relative to immediate producuvity in- able alternatives.creases, there would be a basis for more substantialsubsidization of cover crops such as fodder grasses at Effect on Health Methodthe expense of traditional cropping.
Aside from the debatable benefits of its produc- Economic Analysis of a Water Supply and Healthtion-as opposed to conservation-oriented ap- Program in Zimbabwe4
proach, FISC serves as an important model in termsof its emphasis on consultation and community par- Fredriksson and Persson (1989) evaluate the Mani-ticipation and of its reliance on low-cost, labor-inten- caland Health, Water and Sanitation Program in Zim-sive field techniques. babwe using social cost benefit analysis. The
objectives of the program are to improve living con-Valuation of an Amazonian RainforesP2 ditions in the communal areas of Manicaland
through: (i) improving existing and constructing newMost financial appraisals of tropical forests have water supplies that ensure an acceptable quantity andfocused exclusively on timber resources and have quality of water for domestic use and that are reliableignored the market benefits of non-wood products, and accessible to the community; (ii) improving sani-thus providing a strong market incentive for destruc- tation conditions by constructing latrines and conse-tive logging and widespread forest clearing. In an quently preventing fly breeding and the transmissioneffort to illustrate the values of non-wood forest of disease; and (iii) providing health education toproducts, the authors present data concerning inven- improve hygienic practices and motivate behavioraltory, production, and current market value for all the changes.commercial tree species occurring in one hectare of The domestic price of labor is used as a nu-Amazonian forest. They arrive at a combined NPV meraire. The shadow price of foreign exchange wasof US$6,820 for a fruit and latex production and estimated to be Z$1.75 per US$ in the analysis.selective cutting project, with logging contributing The shadow price of unskilled labor is set at zerojust 7% of the total. This compares favorably with an in the dry season, due to unemployment in Zim-estimated NPV of US$3,184 for timber and pulp- babwe. In the peak season, there is a shortage ofwood obtained from a 1 hectare plantation in Brazil- labor. As uncertainty exists because of possible de-ian Amazonia, and an NPV of US$2,960 for fully lays in the harvest, a sensitivity analysis is made instocked cattle pastures in Brazil. the evaluation, where the shadow wage of unskilled
In order to extrapolate the value of the project, labor is set to 100%, 75% and 50% of the marketwhich is based on the value of 1 hectare, it would be wage of Z$0.46 per hour. The opportunity value ofuseful if attempts were made to incorporate elastici- children's labor is set to zero during the whole year.ties of demand for the products. The broader validity (This is a little surprising, given that children repre-of the results for remote areas is doubtful, since this sent a significant labor force in many developingstudy was carried out for an area that was quite close countries). For skilled labor, the shadow wage is setto a market town. at the market wage.
Another methodological concern is the use of The social discount rate is assumed to be the ratereturns per hectareas the unit of comparisonbetween of return in the private sector, which would mean adifferent uses. A recent World Bank study concludes real social discount of 4.86% since the commercialthat an appropriate analysis would compare returns bank lending rate to the industrial sector at the endper productive unit, including land, labor and capital of 1987 was 14.75% and the inflation rate wasvalued at their opportunity cost.3 Since land in the 9.89%. A time horizon of 40 years was establishedAmazon is generally abundant relative to labor, an which was the duration time of benefits from theanalysis based on the returns to labor would better project.

42 Part II: Case Studies
Materials supplied by the project were valued at if a shadow wage of 100% and 100% disease reduc-market prices. Community input is valued at the tion is achieved.opportunity cost of unskilled labor. The constructor While most of the benefits come from diseaseis assumed to be paid the shadow price of skilled reduction, it must be pointed out that benefits arelabor. probably underestimated through the use of a lower
The change in consumer surplus is determiined bound. This is because the value of a saved life hasby calculating the average price for water collected been underestimated, through the use of a lowerin the wet season and dry season, both before and bound. Secondly, the paper does not take into ac-after the project. The price of water in the wet season count other benefits such as local industry that wouldis calculated using 75 peak period days with no energy benefit from improved water supply. T'hird, as in-savings but with a shadow wage greater than zero. In come distribution will probably improve as a resultthe remaining 105 days energy is saved and the shadow of the project, benefits could have been given awage equals zero. Using this infonnation, the change greater weight. The authors conclude that the projectin consumer surplus is then calculated at shadow wages is a success from an overall societal point of view.of 50%,75%, and 100%.
Cost of illness estimnates consist of treatment Travel Cost and Contingent Valuationcosts, costs of lost production and costs for extra Methodstransportation. Since willingness to pay for healthierand longer lives was not estimated, the values used The Consumer Surplus From Visits to a Costasignificantly underestimate the true values. For treat- Rican Rainforestrment costs, the costs for private treatment are usedas the opportunity cost. This study measures the value of ecotourism at a
A life saved would be valued very highly by the tropical rainforest site in Costa Rica using the travelindividual concerned and his/her family. From soci- cost method. By observing travel behavior, theety's viewpoint, a lower bound or miniimum estimate authors reveal that Costa Rican visitors are willingof the gain from a life saved is derived by the authors to pay $35 per household to visit the site. The studyusing future production and consumption. The finds that visitation is highly correlated with educa-weighted average of the wage adjusted for both tion (and therefore probably income), and that house-unemployment and the income in communal lands is holds in areas with high population densities makeused as an estimate of a child's future production, and more trips.future consumpticil is estimated as final household The paper only considers domestic visits, al-expenditure per capita. The net present value of the though foreign visitors to the site outnumbered do-difference between production and consumption is mestic visitors by four to one in 1988. Foreignthe net output gained by saving the child. The same visitation is likely to be worth far more than domes-measure is utilized to de,termine net present output tic, as foreign visitors have higher travel costs, and aproduced by an adult's life if he/she is saved today. greater value of travel time because of higher earn-
Sensitivity analyses were conducted for social ings. Additionally, they provide foreign exchange.discount rates of 2%, 4.86%, 7.24% and 9%; disease Nevertheless, if we use the same value of $35 per visitreductions of 40%, 70%and 100%; and wet season for all visitors, this would result in an NPV of $1,250shadow wages for unskilled labor of 50%, 75%, per hectare. This figure is one to two times the mag-and 100% of the market wage for casual workers nitude of the purchase price currently paid by theon commercial farms in Manicaland. In the base reserve for the acquisition of new lands.case, with an estimated social discount rate of 4.86%, It is unclear, however, whether the authors as-shadow wage 100% of the market wage, and a 100% sess the cost (in foregone earnings) of time spent athealth improvement, the internal rate of return was site. It would have been useful to have a clearergreater than the social (fiscount rate and the net definition of their term "cost of travel tinme."present value of the project was strongly positive. At In addition, they use a linear demrand functiona social discount rate of 7.24%, estimated in the alter- as opposed to the more popular semi-log functionalnative approach, the project is not found profitable even form, as visitation rates from many zones were zero.

Part II: Case Studies 43
In a similar study, Willis and Garrod (1991) made the US$30 million, respectively, based on an estimnate ofcase for the superiority of the semi-log functional 250,000 to 300,000 adult safaris per year. (This is anform over the linear for the Clawson-Knetsch Zonal example of option value-the premium consumersTravel Cost Method. They also found that the zonal are willing to pay to avoid the risk of supply uncer-travel cost method probably overestimated the con- tainty.)sumer surplus for their sample of travel cost studies. Note that both methods produced anmual view-The individual travel cost method comes closer to ing values for elephants of around US$25 million.contingent valuation results. Although these estimates are rough, they are a useful
As in the Costa Rican study, most travel cost guide to the order of magnitude of value.studies look at single-purpose, single destinationtrips. A more general methodological problem is how The Willingness to Payfor Water Servicesto deal with multiple destination trips. In most cases in Haiti7
of intemational tourism to developing countries thetravel cost would need to be attributed to many The contingent valuation method was used in thisactivities at a number of sites. The problem then study to estimate consumers' willingness to pay forbecomes to elicit the specific value given to a certain an improved water system in a village in southemsite. Haiti. The project was executed by CARE. The re-
search team devised tests in an attempt to correctThe Value of Viewing Elephants on Safaris biases that could threaten the validity of the surveyin Kenya6 results, such as strategic bias, starting point bias, and
hypothetical bias. The results of the survey, utilizingThe travel cost method was used to estimate a de- an ordered probit model as opposed to a linear model,mand function for safaris in Kenya. The analysis is demonstrated that willingness to pay for a new waterbased on the 80 percent of tourists who come to system (whether for a public standpost or for a pri-Kenya from Europe and North America. Surveys of vate connection) was positively correlated to in-tour operators and visitors provided data for the come, the cost of obtaining water from existingestimation of land costs, air fare, and travel time sources, and the education of household members. Itcosts. Travel time costs were weighted at 30 percent was negatively correlated with the individual's per-to reflect the fact that vacation time is valued at lower ception of the quality of water at the traditionalthan the gross wage rate. A weighted average con- source used before the construction of the improvedsumers' surplus of US$725 is estimated. This gives water supply system. The sex of the respondent wasa total consumer surplus for those on safari in the statistically significant in the model for public stand-range of US$182 million to US$218 rnillion annu- posts but not in the model for private connections.ally, depending on the assumed level of visitation. The mean of WTP bids for public standposts
To identify the contribution elephants make to represented 1.7 percent of household income, whilethe value of a safari, tourists were asked to allocate the mean WTP bid for private connections was 2.1the pleasure and enjoyment of their trip over various percent of household incomes. These bids are signifi-categories of experience. Elephants represented 12.6 cantly lower than the 5 percent rule-of-thumb oftenpercent of total enjoyment. Therefore, the estimated used in rural water supply planning as an estimate ofeconomic value of a safari yields a viewing value for maximum "ability to pay" for private connections.elephants of US$23 million to U$27 million per year. However, the bids are based on the assumption that
In order to assess consumers'willingness to pay the public standposts are already in place.to maintain the elephant population at current levels The results of this study show that in a casethrough increased enforcement activity, a survey was involving a familiar (basic need) commodity,it isdesigned, utilizing the contingent valuation ap- possible to obtain reasonable, consistent answers inproach. Attempts were made to adjust for biases. The a contingent valuation survey conducted among aaverage value was 89 dollars while the median was very poor, illiterate population. Contingent valuation100 dollars. This yields an annual viewing value of is likely to see greater future use in developing coun-US$22 million to US$27 million and US$25 to tries; for collecting information on individuals'will-

44 Part II: Case Studies
ingness to pay for various public infrastructure pro- expected inverse relationship between travel costsjects, and (with more difficulty), also for environ- and number of visits.mental protection services (such as the treatment of The TC model used was of the standard form-industrial wastewater flowing through residential ar- visitation rates were assumed to be a function of totaleas). travel cost, availability of substitute sites, and in-
come. The total travel cost variable included bothWillingness to Payfor Improved Sanitation in Ku- out-of-pocket travel costs plus the monetary value ofmasi, Ghana8 time spent traveling, using a representative wage
rate. 187 people were interviewed and divided intoWillingness to pay was estimated through a contin- 17 zones of origin within Bangkok. A regressiongent valuation approach in Kumasi, Ghana (Whit- equation of visitation rates on travel cost was esti-tington et al., 1992). Options provided to consumers mated, and a demand curve derived for public use ofwere water closets with a piped sewerage system and the park. The area under the curve, (the consumers'ventilated pit latrines (KVIPs). KVIPs provided a surplus of park users), was estimated at 13.2 millioncheaper option for sanitation, as they did not require baht a year.sewer connections and installation of water closets. The 187 persons interviewed for the TC study
Households that already had connections to were also interviewed for the CVM study. Visitorswater were asked their WTP for a water closet and a for recreational purposes indicated a slightly lowerKVIP. Households with water closets were asked the WTP for yearly contributions to maintain the parkamount they would pay for a sewer connection. than visitors for morning and evening exercise pur-Results showed that WTP for a WC or a KVIP was poses. However, the latter group's willingness to payroughly the same for houses without WCs. House- per visit was less than that of recreational users.holds with bucket latrines were willing to pay the An additional 225 people were interviewedlowest for KVIPs; those using public latrines bid throughout Bangkok, including people who hadsignificantly higher prices, up to 30-35% more, never used the park, in an attempt to estimate thewhich demonstrated dissatisfaction with the incon- broader "social" value of the park. When CVM re-venience and lack of privacy in the public systems. sults were adjusted by the appropriate age-correctedOverall mean bids of around $1.5 per month com- population figures, the W`IP measure of park userspared to average existing expenditures of about $0.5 was estimated at 13 million baht per year, and for theper month WTP was found to be less than costs of survey of Bangkok residents, 116.6 million baht persupply. year, (thus demonstrating the more realistic WTP of
The study concludes that the required subsidy constant users of the park). The consumers' surplusfor a WC system for Kumasi would amount to $60 and welfare gain associated with the continued exist-million. The required overall subsidy would be $4 ence of the park is clearly demonstrated.million for the KVIP system. Although benefits ofimproved health were not estimated, a subsidy Contingent Valuation Method to Estimatewould probably be justifiable in terms of benefits Option, Existence, and Bequest Valuesto public health.
Hardly any developing country examples are avail-Value of a Thai National Park9 able in this category, and a cautious approach is
recormnended. For illustrative purposes, four U.S.In a 1980 study, TC and CVM methods are used to examples are provided below. These studies all usedestimate the economic value to Bangkok residents, the contingent valuation approach to obtain actualof the Lumpinee Park in Thailand. The study is measures for option, existence, and/or bequest val-unusual in that the urban setting is not usually con- ues. The first case was quite possibly the earliestsidered suitable for a travel cost approach. However, survey that developed a methodology to attempt toeven with short visits and minimal travel time and determine existence value. Both this first and thecosts to use the park, the analysis still confirmed the second studies, while revealing the significance of
existence values, examine them as an adjumct to

Part II: Case Studies 45
theirmainfocus,whichisrecreationalusevalue.The Option Price and Existence Value of Wildlifellthird case is perhaps the first study that undertook toexamine total preservation value in depth, broken This study measures the option price (option valuedown into its three separate components of option, plus expected consumer surplus) and existence valueexistence, and bequest value. The fourth study is of grizzly bears and bighorn sheep in Wyoming-basically an attempt to measure the effects of infor- both of these species being endangered by humanmation disclosure (endangered status and physical activity in the area. A mail survey was sent out, withappearance) on existence values for endangered spe- questions being directed towards hunters and non-cies. hunters. Hunters were asked their WTP for a "stamp"
allowing them to hunt in new hunting areas in eitherExistence Value of Preserving Visibiliy'0 five or fifteen years for grizzly bear or bighorn sheep.
Respondents were each confronted with only oneThe survey attempts to measure annual household time horizon. The probability of supply was variable.willingness to pay (WTP) to preserve visibility in the Nonhunters were asked to specify their WTP for theGrand Canyon-both WTP if visibility preservation existence of the animals or for the opportunity towere to be extended to the entire southwestern observe them in the future.parklands region and WTP to prevent plume blight As expected, the overall option price increasedseen from Grand Canyon National Park. For the as the probability of supply increased. Contrary topurpose of the study, only the major source of air expectations, no systematic relationship could bepollution in the region, coal-fired power plants, was determined showing that bids based on certain de-the focus. Over 600 households in Denver, Los An- mand exceeded those based on uncertain demand.geles, Albuquerque, and Chicago participated in the Existence values and observer option prices weresurvey. One-third of the respondents were asked a significant. The mean bids for observer option pricespure user value question: How much would they were in the range of US$20 for both grizzly bear andbe willing to pay in higher entrance fees per day bighorn sheep, regardless of the time element. Thisfor visibility protection at the Grand Canyon or is on a par with option bids for hunters at high levelsother parks? The other two-thirds of the respon- of supply certainty. Existence values are high fordents were asked how much they would be willing grizzly bear ($24 at five years, $15.20 at fifteento pay in higher electric power bills to preserve years), but are significantly lower for bighorn sheepvisibility in the parklands, a measurement of total ($7.40 and $6.90 respectively).preservation value (defined by the authors as thesum of existence plus user value). The authors Option, Existence, and Bequest Valuesinterpreted existence value as the difference be- of Wilderness12
tween total preservation value and user value.The preservation value bids are substantially The key question posed here is the amount of wilder-
higher than the user value bids, apparently signifying ness to be protected in Colorado. A sample of 218that existence value is an important component of resident Colorado households participated in a mailtotal economic value. The authors are careful to point survey. Respondents were asked to report their will-out that visitation plans were not an overwhelming ingness to pay into a special fund to be used exclu-factor in determining preservation value bids, and sively for the purpose of protecting wilderness. Thisthat knowledge acquired through previous visits was payment vehicle is recognizable to Colorado resi-also considered relatively unimportant in the deter- dents, being similar to the state income tax form'smination of bids. Moreover, preservation bids did not checkoff for nongame wildlife preservation. Respon-decline with distance, which seems to indicate that dents were asked to write down the maximumnonuse value was an important component in the amount of money they would be willing to payrespondents' bids. annually for protection of current wilderness, and for
hypothetical increases in wilderness depicted on fourmaps. Once this budget allocation was completed,

46 Part II: Case Studies
respondents were asked to allocate the highest endangered species and preservation altemativesamount reported among ifour categories of value: plays an important part in determining the replicabil-recreational use, option, existence, and bequest de- ity and usefulness of existence valuation results.mands. Total preservation benefits are estimated as The experiment was conducted using isolatedthe residual after recreatien use benefits have been experimental and control groups of paid university-subtracted from total WTP for wildemess protection. level student subjects in the United States. CVM wasPreservation values were estimated by developing an used to measure preservation bids for a humpbackappropriate econometric model of willingness to pay whale preservation fund. The experimental groupby survey households and by aggregating values was then provided with more information about theacross households in the state. whales (through the screening of a film), and both
Results indicate that as the quantity of wilder- groups were then questioned again. The experimen-ness increases, annual household preservation values tal group increased their bids by 32 percent from theirincrease at a decreasing rate, except for bequest original values, and the control group increased theirvalue, which is linear. Option value had a strong bids by 20 percent. This may be attributable to thepositive association with income. In-state wilderness fact that all respondents had more time to reconsiderusers had a much higher option value than nonusers, their bids, and perhaps demonstrates how prefer-indicating that recreational use is an important ele- ences are learned through the interview process it-ment in the determination of option value. Existence self, even in the absence of new information.value was positively related to the importance of Finally, all control and experimental, subjectspreservation of natural scenery, ecosystems, and ge- were asked to fully allocate a lump-sum windfallnetic strains. Existence vaJue increased with fre- gain of $30 arnong preservation funds for three ani-quency of wilderness trips undertaken. All income mal species, given four scenarios, containing differ-groups valued existence of wvildemess about equally. ent levels of information about physical appearanceInterestingly, a wide range of workers (skilled and and endangered status.unskilled) would pay US$1.50 more for existence The effects of information disclosure on re-demands than would persons in other occupations. sponses was more evident here. Faced with zeroBequest value was not influenced by the number of information distinguishing species, the subjects'children living at home with respondents. This seems willingness to pay to preserve each species wasto indicate that bequest value is correctly defined as nearly equal. Given infornation on physical appear-the satisfaction from interpersonal transfers of wil- ance, they allocated more to the monkey-like animalderness to indefinite future generations rather than as compared with the rabbit-like or rat-like animal,specifically to the children of the respondent. Retired reflecting a strong anthropomorphic tendency. Givenpersons were willing to pay US$6.15 more for be- information on endangered status, respondents allo-quest demand than were other respondents. All in- cated significantly more funds to the animal that wascome groups valued bequest demands about equally. endangered but savable as compared with ubiquitous
The authors conclude that, even without taking or extremely rare animals. When information wasinto account the preservation estimates of nonresi- provided on both physical appearance and endan-dents of the state, adding preservation value to the gered status, the endangered but savable speciesconsumer surplus of recrealional value had a sub- received the highest allocation followed by the rarestantial effect on the benefit value for wildemess. and abundant species. These results suggest that
information about endangered status may be rela-Existence Value of Endangered Species13 tively more important to respondents than informa-
tion about physical characteristics in formulatingThis study tests the hypothesis that an individual's preservation bids.WTP to preserve a particular animal is significantly In conclusion, it appears that information dis-influenced by information provided about the ani- closure can influence perceived marginal efficiencymal's physical and behavioral characteristics and of investment in a preservation fund and therebyabout its endangered status. Public awareness about

Part II: Case Studies 47
result in changes of an individual's budget allocation 6. This case study is derived from Brown and Henry,
strategy. 1989.7. This case study is derived from Whittington, et al.
1990.Notes 8. This case study is derived from Whittington et al.,
1992.1. This case study is derived from J. Bojo 1991. 9. This case study is derived from Grandstaff and Dixon2. This case study is derived from Peters, et. al. 1989. in Dixon and Hufschmidt (eds.). 1986.3. World Bank (1992). 10. This case study is derived from Schulze, et al. 1983.4. This case study is derived from Fredriksson and l1. This case study is derived from Brookshire, 1983.
Persson, 1989. 12. This case study is derived from Walsh, et al. 1984.5. This case study is derived from Tobias and Mendel- 13. This case study is derived from Samples, et al. 1986.
sohn, 1991.

5. Two World Bank Valuation Case Studies
The two longer case studies in this section were sonnel, and the development of roads, visitors'facili-carried out recently in the World Bank, and use ties, and other infrastructure. Another important setcombinations of valuation methods to facilitate of costs that are often ignored are the opportunitydecisionmaking. costs associated with the foregone uses of park land.
Benefits include both use values and non-useValuation of Biophysical Resources values. Most parks do not allow exploitation of forestin Madagascar' resources, and the primary uses are therefore for
tourism and research. Tourism can generate consid-In the last two decades, environmental and resource erable revenues for the country from both entranceeconomnists in industrialized countries have devel- fees and travel expenditures. National parks alsooped non-market techniques for the valuation of generate a number of non-use benefits, among whichenvironmental costs and benefits. These methods existence value and option value are important. Ex-have been successfully applied in developed coun- istence value is defined as the willingness to paytries although they have rarely been used in develop- (WTP) to preserve the park-by individuals whoing countries where the neaed for national park never plan to use it. Option value is defined as thecreation is typically much higher. In this section, the willingness to pay to maintain the park for possibleestimation of the non-market costs and benefits of use in the future. Other benefits may include reducedestablishing a national park on nearby villages, and deforestation, watershed protection and climatevaluation of the park as an international tourism regulation. This study focuses on the measurementdestination are discussed. The results summarized of some of the more important and more difficult tobelow are from the first stage in the analysis to arrive measure economic inpacts, namely the impact of theat a rational decision concerning the proposed crea- park on local villagers and the benefits of the newtion of the Mantadia National Park in Madagascar. park to foreign tourists.Further details are available in Kramer, Munasinghe,Sharma et al. (1992). Opportunity Cost Analysis
Madagascar is one of the economically poorestand ecologically richest countries in the world, and The opportunity cost approach uses standard eco-it has been designated by the international commu- nomic analysis based on market values, to detemiinenity as a prime area for biodiversity whose ecosys- the net economic benefits associated with altemativetems are also atgreatrisk. Maclagascaris onIUCN's uses of one or more resources. In this case, thelist of megadiversity countries because of its ex- relevant opportunity costs would be those associatedtraordinarily high rates of species endemism. As a with the alternative uses by people living near and inresult of the enormous biodiversity, the intema- the park. The creation of the park imposes a consid-tional donor community is providing large sums of erable economnic burden on the local population. Themoney in order to save as much of Madagascar's opportunity cost is estimated by determining recentbiodiversity as possible. The government of Mada- land use and by projections of future land usegascar is also taking steps to control forest degradation changes in the absence of a national park.and to protect biodiversity. There are no human settlements within the Man-
Three main methods for ithe valuation of envi- tadia National Park boundaries, but several villagesronmental impacts are applied here-the contingent lie in close proximity. The villagers depend on thevaluation, the travel cost, and the opportunity cost forests in and around the park for forest products andapproaches. agriculture. The form of shifting cultivation used for
The creation of a national park generates many agriculture production in eastem Madagascar is criti-both indirect and direct costs and benefits. Costs cally important as a mechanism for deforestation. Itarise from land acquisition (if the land had been is also the only means of livelihood known to manypreviously privately owned), the hiring of park per- of the inhabitants of the region. Furthermore, fuel-

Part II: Case Studies 49
wood is collected from the forests, a wide range of The village survey had to be modified, to over-fish and animals are consumed, and a number of come constraints. For example, in devising the ques-different types of grass are harvested and used for tions for the village survey, initially it appeared fromassorted purposes. villager responses that they were willing to pay to
The opportunity costs associated with these eco- protect the forest. However, it transpired that thisnomic activities were estimated using a survey of 351 response was not related to perceived non-use bene-households in 17 villages within a 7.5 km radius fits from thepark, butrather was theresultof a sensearound the park boundary. The survey was adminis- of coercion arising from arrests of villagers by localtered by a local NGO well versed in rural survey authorities, for incursions into the park area. Thetechniques, and it was undertaken following a recon- questions were therefore reformulated in terms ofnaissance visit to the village, several focus group willingness-to-accept compensation for being de-interviews, conversations with people well ac- nied access to forestland within the park.quainted with the area, and a pretest covering 25households. It was administered in Malagasy, the TravelCostMethodnational language.
The questionnaire focused upon (i) establishing Travel cost models use the amounts of time andthe extent of the dependence of the local villagers on money visitors spend traveling to a site as the priceforests nearby for obtaining a wide variety of forest proxies, together with participation rates and visitorproducts; (ii) establishing the extent to which the attributes, to estimate the recreational value of thevillagers used the forest for shifting cultivation; and site. Recreation in Madagascar's national parks con-(iii) assessing local attitudes toward conservation of trasts sharply with the standard assumptions that thethe forests. Questions related to socio-economic trip is a single-purpose, single destination day-trip tovariables, land use, time allocation, and house- a site that affords some particular recreational expe-hold production activities were also asked. The rience or typical quality which can be substituted forfinal section used the contingent valuation those available at similar sites. Instead, recreators inmethod discussed below. Madagascar can be divided into two groups consum-
A separate questionnaire was administered to ing distinct goods: (i) local visitors who make daythe village leaders. It focused on issues pertaining to trips to national parks to view the local natural envi-general agricultural patterns, markets and prices of ronment; and (ii) intemational tourists who under-goods sold, village history and migration patterns, take lengthy trips to experience unusual naturalforest related cultural issues, and details on shifting settings and cultures. This part of the study focusescultivation practices. on the second aspect. The novel international travel
cost method used here is summarized in Annex 3, andContingent Valuation Method presented in full in Mercer and Kramer (1992).
The method is based on the assumption thatThe contingent valuation method (CVM) uses sur- individuals travel to a single country where theyvey techniques to establish the value of goods and engage in a variety of activities. Estimating theservices which are not usually exchanged in markets. model requires specific data on how each household
distributes its time across activities during the timeIn this study, the CVM was used in both the horizon of the model, and ideally it implies the
village survey and the tourist survey. In the tourist collection of full trip itinerary data as well as travelsurvey, the CVM was used as an altemative method cost information for foreign visitors. The itineraryto the travel cost method for estimating the total value data includes the distribution of time between activi-of the park to the tourists. These questions were ties for each individual, the costs of pursuing suchphrased in terms of how much more the foreign tourists activities, and the features of the various activitieswould have been willing to pay for their trip, if the new that lead to differences across individuals in theirpark hadbeen createdfor them to visit.These questions ability to undertake them.were also pretested and revised prior to the implemen- Based on the theoretical model, several ques-tation of the tourist survey. tionnaires were prepared and translated into French

50 Part II: Case Studies
and administered to visitors in the small Perinet The survey indicates that fuelwood is the mostForest Reserve adjacent to the Mantadia National important forest product collected (see Table 5.2).Park. The questions consisted of questions on the The average household collects about 6,164 kgs, orcost of the current trip to iMadagascar, details of about US $38 worth of firewood per year. T'he totalprevious nature related tourist trips, the process for value of collected firewood is $13,289 per year. Totaldeciding on trip destinations, contingent valuation value of other collected forest products is US$ 818.questions for the willingness to pay for visits to the To estimate the opportunity cost to villagers ofMantadia National Park, and a series of socio-demo- establishing the Mantadia National park, incomegraphic and economic questions. In addition, a from agricultural and forestry activities was esti-"Madagascar Trip Diary" was developed which elic- mated for three different groups of villages. Theited detailed itinerary, cost, time, and quality infor- mean value of losses was $91 per household per year.mation for the current trip to Madagascar. The Aggregating over all households living in the vicinityquestionnaires were tested in the US with a focus of the park and using a 10% discount rate and twentygroup of previous visitors to Madagascar, and in year time horizon, the net present value of the oppor-Madagascar the questionnaires were revised follow- tunity costs was estimated to be $556,010.ing pretests with a small sarnple of visitors to the The contingent valuation study of the villagesPerinet Reserve and discussions with local Malagasy indicates the villagers' perceptions of the forest.collaborators. Due to political unrest in Madagascar Forty percent seemed to think that forests do not helpduring the time of the survey, only 94 surveys were soil protection, although sixty-five percent agreedcompleted, including a 14% return rate on the travel that floods occur less frequently with forests. inter-diaries. Although this data setL is inadequate for full estingly, 91% of the respondents agreed that primaryimplementation of the international travel cost forests are "more fun" than secondary forests, whichmethod, the estimates of mean willingness to pay to suggests a recreational value of the forests, but 77%visit the new park derived from it provide useful of the respondents did not think that preserving for-insights. ests in order to preserve ancestral graves was very
important. Finally, 68% of the respondents thoughtPreliminary Empirical Results that it is advantageous to clear the forests as a form
of pest management.The average household size in the surveyed villages The responses to the contingent valuation ques-was 4.6 persons. In 1988, average per capita income tions indicate that on average, a compensation of ricewas $190 in Madagascar, and the villages in the equivalent in value to $108 per year per householdsurvey may well have incomes lower than the aver- would make households as well off with the park asage. Several villages are very isolated, and many do without. Aggregating over the population in the parknot have access to medical facilities, running tap area, this implies a necessary one time compensationwater, electricity and primary schooling. Approxi- of approximately $673,078, assuming a 10%7o dis-mately 95% of the householcls own land, and the count rate and twenty year time horizon.average amount of land owned is 1.9 hectares per In the tourist survey, income for the visitorshousehold (see Table 5.1). In the survey, 36% of the ranged from $3,000 to $300,000 with a mean ofhouseholds own a watch, 33% own a radio and 97% $59,156 (see Table 5.3). The average tourist was 39have a kerosene lamp to light their huts. The average years old and had completed 15 years of education.household produces 487 kg of paddy rice per year, Visitors came from 13 countries. Trips rangecd fromor about US $128 worth of rice. Most households 3 to 100 days in length, with a mean of 27 days, andalso engage in shifting cultivation. Eighty percent of with 1-8 days spent at Perinet (mean of 2 days).the households surveyed said that they would add to Expenditures for the trip ranged from $335 to $6,363existing land for cultivation. Ninety-nine percent of with an average trip costing $2,874. The mean trans-these acknowledged that they planned to cut forests port cost to reach Madagascar was about $1,390to add to their land. The average household planned while transport costs within the island averaged al-to cut 1.6 hectares of forested land in the coming year most $590. A further breakdown of tourist charac-to undertake shifting cultivation.

Part 11: Case Studies 51
Table 5.1 Land Use Information for Villages
Variable Number of Observations Range Mean
Total quantity of farmiand 311 0 to 9 1.89per household (hectares)
Planned increase in culti-vated land per household 256 0 to 10 1.70(hectares)
Annual quantity of farm-land planted with rice per 289 0.04 to 5 1.04household (hectares)
Total annual rice yield per 296 2 to 3,600 487.00household (kilograms)
Total annual quantity ofrice marketed per house- 249 0 to 990 41.80hold(kilograms)
Total annual value of rice 296 $0.5 to 1,101 $128.00yield per household ($)
Table 5.2 Value of Forest Products Collected by Viflagers
Total Annual Value Mean Annual Valuefor all Villages per Household
Forest Products Number of Observations ($US) ($US)
Fuelwood 316 13,289 38.0
Crayfish 19 220 12.0Crab 110 402 3.7
Tenreck 21 125 6.0Frog 11 71 6.5
teristics by country of origin, showed considerable tions as a function of travel costs, socioeconomicdiversity (see Table 5.4). characterisitics, and quality variables. The model
Using data from the tourist survey supple- was used to project benefits to tourists that wouldmented by data from a separate survey of travel result from a 10% improvement in facilities at theexperts, an econometric analysis was performed to park. The average increase in willingness-to-pay wasapply the travel cost method. The model, known as estimated to be $24 per tourist, resulting in an annuala random utility model, examines the allocation of benefit to foreign tourists of $93,600, based on thetrip choices to international nature tourism destina- current annual visitation rate at the Perinet Reserve.

52 Part H.: Case Studies
Table 53 Summary Statistics for Complete Sample of Tourists
Variable Number of Observations Range Mean
Income 71 $3,040 to 296,400 $59,156
Education 86 10 to 18 years 15 years
Age 87 16 to 71 years 38.5 years
Number of Days in 83 3 to 100 days 26.6 daysMadagascar
Number of Days in Perinet 80 1 to 8 days 2 days
Total Cost of Trip to 78 $335 to $6,363 $2,874MadagascarTotal Cost to Madagascar 47 $352 to 5,000 $1,388
Total Cost in Madagascar 43 $8 to 2,000 $588
Table 5.4 Summary Statistics for Tourist by Country of Origin
Mean MeanMean Number of Number of Mean Mean
Percent of Expenditure Days in Days in Mean Age Education IncomeCountry Sample ($US) Madagascar Perinet (years) (years) ($US)
Britain 20.2 3,332 18 1.6 45 15.8 36,891
Italy 21.4 2,357 21.4 1.9 34 14.2 112,000
France 15.5 2,481 36 1.9 34 15 63,197
Germany 11.9 3,172 24.8 1.8 40 15 42,304
Switzerland 11.9 3,200 37.6 2.3 36 15.6 51,243
USA 4.8 3,097 18.5 2.75 49 16.5 53,515
Other 1. 6629 081(7 countries) 14.3 2,726 26.6 2.91 40.8 4 33,997
At a 10% discount rate, this would generate a net annually. This amounts to $2.16 million as the pre-present value of $796,870 of benefits associated with sent value for the stream of benefits over 20 years-the park over twenty years. again assuming a 10% discount rate.
Utilizing the contingent valuation method, in adiscrete choice format, the mean bid for tourists to Conclusionsview the new park (conditional on seeing the samenumber of lemurs) was $65. Assuming current visi- Several tentative conclusions can be drawn from thetation pattems continue, the total additional willing- early results of this study. Non-market valuationness-to-pay to visit the new park would be $253,500 techniques can provide useful information for eco-

Part II: Case Studies 53
Table 5.5 Summary of Economic Analysis of Mantadia National Park
Estimates of Welfare Losses to Local Villagers from Establishment of Park
Method Used Annual Mean Value per Household Aggregate Net Present Value
Opportunity Cost $91 $673,078
Contingent Valuation $108 $566,070
Estimates of Welfare Gains to Foreign Tourists from Establishment of Park
Method Used Annual Mean Value per Trip Aggregate Net Present Value
Travel Cost $24 $796,870
Opportunity Cost $65 $2,160,000
nomic evaluation of national parks. A major strength At the same time, the early findings indicateof this study is the opportunity to compare valuation future issues. Reliance on WTP is fundamental to thetechniques (Table 5.5). For the village component, economic approach, but tends to overemphasize thethe estimated welfare estimates based on two entirely importance of value ascribed to richer foreign visi-differentmethods, opportunity cost analysis and con- tors. If conflicting claims to park access were to betingent valuation method, were remarkably similar determined purely on this basis, residents (especially,($91 and $108 per householdper year). The estimates the poor local villagers) are likely to be excluded.of tourist benefits based on the travel cost method Therefore, as indicated in the introduction, the so-and contingent valuation method were somewhat ciocultural concepts of sustainable development (es-more disparate ($24 versus $65 per trip) but it is pecially intragenerational equity and distributionalnoteworthy that the benefit estimates are of the same concerns) would need to be invoked to protect theorder of magnitude. It is important to note that the basic rights of local residents-perhaps in the formhigher contingent valuation estimate may reflect of a "safe minimum" degree of access to park facili-some non-use values, while the travel cost method is ties.for use value only.
Further, research of this type would have impli- Improving Decisionmaking in the Sri Lankacations for policy, investment decisions, resource Power Sector2
mobilization, and project design and management.The information can help govermments decide how The incorporation of environmental externalitiesto (a) allocate scarce capital resources among com- into decisionmaking is particularly important in thepeting land use activities, and (b) choose and imple- power sector, where environmental concerns (rang-ment investments for natural resource conservation ing from greenhouse gas emissions of fossil-fueledand development. Results can also be used in deter- plants to the impacts of inundation at hydro plants)mining or influencing pricing, land use, and incen- have posed increasingly difficult constraints to pro-tive policies. At the local level, the findings can be ject implementation. It is also clear that in order forused to determine compensation for local villagers environmental concerns to play a real role in powerfor foregone access to forest areas designated as sector decisionmaking, one must address these issuesnational parks. In addition, the research findings can early-at the sectoral and regional planning stages,show the value of a park as a global environmental rather than only at the stage of project environmentalasset to foreigners, thus influencing the external as- assessment.sistance for conservation programs at the local level.

54 Part II: Case Studies
Unfortunately, as soon as one is dealing with power, increasing use of demand side management,power sector issues at this aggregate planning level, and .system efficiency improvements), that makethe application of many of the project-level valuation decisionmaking quite difficult-even in the absencetechniques discussed earlier becomes extremely dif- of the environmental concerns. The study is rela-ficult, for two main reasons. The first is the nature of tively unique in its focus on these kinds of planningthe impacts themselves-the health effects of pollut- issues, as opposed to the more usual policy of assess-ants from coal fired generating stations, the potential ing environmental concerns only at the project levelloss of biodiversity associated with large scale hydro after the strategic sectoral development decisionsreservoirs, the impacts of greenhouse gas emis- have already been made.sions-all are exceptionally difficult to value. In-deed, attempts to do so would very likely focus Environmentallssuesattention on the validity of the valuation techniquesthemselves, rather than the policy trade-offs that Sri Lanka (see map in Figure 5.1) is one of the moremust be made. The second reason concerns the scale densely populated countries of the world, and landof analysis. Many of the techniques discussed in this availability is an important issue. In general, hydropaper are most appropriate at the micro-level: the use plants are in the wet zone areas where there is littleof the contingent valuation approach is much more vacant land nearby for resettled inhabitants to relo-valid where respondents can be asked specific ques- cate, while land that is available at greater distancestions about impacts of a particular project to which is often seen by potential evacuees as undesirablethey can relate-as the previous example of Mada- because of questions concerning the availability ofgascar illustrates well. However, this may be very adequate water supply. A rough but effective way ofdifficult to apply in situations where one is dealing comparing the likely extent of potential land-relatedwith a potentially large number of technology, site environmental impacts across projects is the areaand mitigation options. inundated per KWh of capacity. This varies between
It is in these kinds of situations that the tech- zero and as much as 150 hectares per K"ha Theniques of multi-criteria analysis (MCA) may be ap- correlation between the installed capacity and theplied. Such techniques first gained prominence as amount of land to be inundated is poor; large projectspractical evaluation tools in the 1970s, when the do not necessarily mean worse envirormnerntal im-intangible environmental externalities lying outside pacts and vice versa.conventional CBAmethodologies were increasingly The progressive loss of Sri Lanka's natural for-recognized. It also met one objective of modern ests over the past 50 years is well documented, anddecisionmakers, who preferred to be presented with is one of the country's most important environmentala range of feasible alternatives as opposed to one concerns. Power sector projects will be scrutinized"best" solution. As explainecd earlier, MCA allows very carefully for their potential impact on whatfor the appraisal of alternatives with differing objec- natural forest areas remain, even if it is true that thetives and varied costs and benefits, which are often power sector per se has been a relatively minorassessed in differing units of mneasurement. contributor to the loss of forest lands. The main
Such an approach was used by Meier and reason for deforestation in the past has been plannedMunasinghe (1992) in a study of Sri Lanka. The agricultural development and settlement schemes,objective was to demonstrate how environmental chena cultivation, encroachment by unplanned set-externalities could be incorporated into power sys- tlement and cropping, illicit logging and luncon-tem planning in a systematic and efficient manner. trolled fuelwood and timber extraction.Sri Lanka presently depends largely on hydro power Relatively little is known about ambient airfor electricity generation, but over the next decade quality in Sri Lanka. In most parts of the country thethere seems little choice other than to begin building air quality is fairly good, a reflection of the limitedlarge coal- or oil-fired stations, or to build hydro extent of industrialization except in Colombo, andplants whose economic returns and environmental the natural ventilation provided by strong monsoonalimpacts are increasingly unfavorable. In addition, winds. In Colombo, however, the sharp increase inthere are a wide range of other options (such as wind automobile and bus traffic over the past decade has

Part II: Case Studies 55
led to strong indications of increasing deterioration evitable that sites will need to be found on the coastof air quality. Nevertheless, based upon what we do to accommodate such thennal plants. The economicknow about pattems of energy utilization certain importance of preventing environmental degradationinferences can be drawn. It is fairly certain that at in the coastal zones is well established. Foreignpresent the power sector contributes only marginally tourism, an important source of foreign exchange, isto air pollution in Sri Lanka. However, this is ex- largely focused on the country's sandy beaches andpected to change significantly once the anticipated coastal estuaries and lagoons. The marine fisherycoal burning power plants are added to the system industry provides employment to some 100,000 per-beginning in the late 1990's. sons, and is the largest source of animal protein for
Acid rain is likely to become an increasingly Sri Lanka. The main environmental issue concernsimportant environmental issue in the Asia-Pacific the discharge of heated effluents into waters of theregion given the fact that the energy plans in many coastal zone, where there exist numerous ecosystemscountries, in particular India and China, call for rapid that are extremely sensitive to temperature increases,development of fossil energy systems. Acid rain is including 1) coral reefs, sea grass beds, benthic corn-largely a long-range phenomenon, and it is fairly munities, mangrove stands, rocky and other shores,obvious that the extent to which acid rain is or will 2) zooplankton and phytoplankton communitiesbe experienced in Sri Lanka is as much a function of which are free floating, and 3) nursery grounds foremission trends of acid rain precursors in India as in fish and prawns.Sri Lanka itself.
Global warming and transnational acid rain are Methodologyconceptually different from local environmental im-pacts, since in the former case the impacts will occur Multi-criteria analysis has been developed expresslypredominantly in other countries. If the main eco- for situations where decisions must be made takingnomnic objective is to maximize welfare in Sri Lanka, into consideration more than one objective whichdecision-makers in Sri Lanka would be unwilling to cannot be reduced to a single dimension. Its centralincur additional costs if the benefits of such actions focus is the quantification, display and resolution ofaccrue mainly to other nations. In this case study, it trade-offs that must be made when objectives con-is assumed that Sri Lanka will be reimbursed by the flict. In the case of application to the power sector,international community for the incremental costs of there may well be strategies that have beneficialglobal warning mnitigation efforts, or that the Gov- impacts on both environmental and economic objec-emnment would have signed an international agree- tives-most energy efficient investments that arement committing itself to undertake certain C02 economically justifiable also bring about a reductionemission reduction measures. in emissions and hence improve enviroDnental qual-
Because Sri Lanka is a small island, which has ity as well as economic efficiency. But most optionsbeen isolated for relatively long periods, there are a require that trade-offs must be made: wind plants, forlarge number of endemic species. Among Asian example, potentially provide substantial environ-countries, Sri Lanka has the highest level of bio- mental benefits but are more expensive than otherlogical diversity. The NSF Committee on Research options.Priorities in Tropical Biology identifies Sri Lanka The overall methodology is illustrated in Figureas demanding special attention. Biological diver- 5.2, and involves the following steps:sity is under threat in Sri Lanka primarily from the * The definition of the options to be exam-progressive reduction in its natural forests and ined.other natural habitats, especially through the selec- * The selection and definition of the attrib-tive exploitation of tree species, particularly for utes, selected to reflect planningtimber. Therefore, the power sector is likely to objectives.come under intense scrutiny from this perspective. * The explicit economic valuation of those
As the generation mix shifts from one that is impacts for which valuation techniquespredominantly hydro to one in which large baseload can be applied with confidence. The resul-fossil-fueled plants play an increasing role, it is in-

56 Part II: Case Studies
Figure 5.1 Sri Lanka
-~~~~~~~~~~ mm STltiilo GmmAo
a~~ ~~ ~~~~~~~~~~~ t% S -- 2ttxit m- m uv 13hMVA=
CZ_ I'_ -t132 KY tANS*M UNISS )V KY aA Of fW
BAY 132 KY C stRsOF
J&V6L O STAMM
MAA
i \awa#t
CtLCr A / au
s~~~~~~~~~~~~~~~~Tmvn CANYON
U Wn 7Sx
- S., .......A..dh p
Gd.
\ HX X~~~~~~~~~~~~~~XMDW&OCEAN;. 2O *AI

Part II: Case Studies 57
tant values are then added to the system The main set of policy options examined, be-costs to define the overall cost attribute. yond variations in the mix of hydro and thermal
* The quantification of those attributes for plants, included (i) demand side management (usingwhich explicit economic valuation is in- the illustrative example of compact fluorescent light-appropriate, but for which suitable ing); (ii) renewable energy options (using the illus-quantitative impact scales can be defined. trative technology of wind generation); (iii)
* The translation of attribute value levels improvements in system efficiency (using more am-into value functions (known as "scaling"). bitious targets for transmission and distribution
* The display of the trade-off space, to fa- losses than the base case assumption of 12% bycilitate understanding of the trade-offs to 1997); (iv) clean coal technology (using pressurizedbe made in decisionmaking. fluidized bed combustion (PFBC) in a combined
* The definition of a candidate list of op- cycle mode as the illustrative technology); and (v)tions for further study: this also involves pollution control technology options (illustrated bythe important step of eliminating from a variety of fuel switching and pollution controlfurther consideration options that are options such as using imported low sulfur oil forclearly inferior. diesels, and fitting coal buming power plants with
In some applications it may be appropriate to flue gas desulfurization (FGD) systems).add two further steps: the definition of weights for Attribute selection: Great care needs to be ex-each attribute, and the application of an amalgama- ercised in criteria or attribute selection-they shouldtion rule to provide a single overall ranking of op- reflect issues of national (as opposed to local projecttions. However, the Sri Lanka case study did not level) significance, and ought to be limited in num-follow this approach. ber. There is little gain from a proliferation of attrib-
utes. Increasing the number of attributes is not aApplication to the Sri Lanka Power Sector substitute for assigning proper weights to environ-
mental attributes in the decision process. On thePolicy option definition: A variety of options were contrary, the more attributes considered the moreselected for study,including a whole range of siting, complex the analysis, and the higher the probabilitypollution control mitigation and technology options. that the results will be hard to interpret and decision-Indeed, it is very important that as few a priori makers will not find the exercise useful. It oftenjudgements as possible are made about the "feasibil- occurs that, in a desire to be comprehensive, there isity" or "practicality" of options, because for the an inclusion of all possible impacts, making it moreanalysis to be useful, meaningful trade-offs must be difficult to demonstrate trade-offs, and possibly in-examined. For example, in the case of the Trinco- troducing biases through a reluctance to assign lowmalee coal fired power plant (on the north-east weighting to attributes.coast-see Figure 5.1), the environmental impact The following environmental criteria or attrib-assessment prepared in the mid 1980s considered utes were used in the study. To capture the potentialonly a very narrow range of options: all altematives impact on global warming, C02 emissions were de-studied involved sites on Trincomalee bay, with fined as the appropriate proxy. To be sure, the rela-once-through cooling to a shallow bay inlet. Other tionship between global C02 concentrations and thesouth coast sites had been eliminated earlier on actual physical impacts that may follow, such as seagrounds of high cost (because these sites could not level rise or changes in monsoonal rainfall pattensaccommodate large coal transport vessels, resulting are still poorly understood, and in any event unlikelyin higher transport costs). Yet the additional costs of to be captured by simple linear correlations. How-an evaporative cooling system, or of an outfall sys- ever, since Sri Lanka's contribution to worldwidetem that would discharge heated effluents to the emissions will remain extremely small, the assump-deeper parts of the Trincomalee Bay, proved to be tion of linearity of impacts (relative to global CO2less than the incremental coal transport costs to a site emissions) is not unreasonable.on the south coast. To capture health impacts, use was made of the
population-weighted increment in fine particulates

58 Part II: Case Studies
Figure 5.2
ENVIRONMENTAL DEFINE SITING
ISSUES TECHNOLOGY,ISSUES ~~AND MITIGATIONSCENARIOS
gANO I F) DEFINEomADDITIONAL,.*-SCENARIOS
DEFINE APPLYENVIRONMENTAL N YNM ES
ATTRIBUTES ALUATIQONS
MULTI-ATTRIBUTE __ _ __ _m
ANALYSIS ECONOMIC ATTRIBUTE mNALYSX(SYSTEM NPV) ECONOMIC
POLICYANALYSIS
ITRADE-OFF CURVE.S
and NOx attributable to each source. To this end a high. It should be noted that what is captured in thissimple Gaussian plume model was applied to all of attribute is the separate and purely political objectivethe major sites, calculated incremental ambient con- of employment creation, rather than the strictly eco-centrations for lkn square cells to within a 20km nomic benefits that would be captured by the use ofradius, and multiplied by the population in each cell. shadow wage rates appropriate to reflect high unem-
To capture other potential air pollution impacts, ployment in the construction cost estimates. All ofsuch as acid rain, S02 and N0x emissions were used. these impacts were appropriately discoun1i and ex-As an illustrative social impact, the study used the pressed as a present value. Finally, to capture thecreation of labor opportunities. Employment crea- potential biodiversity impacts, a probabilistic indextion is an important objective of national policy, and was derived (as discussed below).in Sri Lanka there has occurred frequent discussion Attribute quantificatdon: The problems ofof the need for employment creation in the south quantification are well illustrated in the case of thewhere youth unemploymenlt rates are especially biodiversity attribute. At the planning level,, detailed

Part 11: Case Studies 59
site specific information at the potential power plant Some Illustrative Resultssites is unlikely to be available. Consequently theonly quantification that appears possible is to derive With options and attribute definitions in hand, thea probabilistic index that gives the decision-maker case study then generated the multi-dimensionalinfornation about the likelihood that the detailed trade-off space. Using the ENVIROPLAN model,envirorunental impact statement will reveal the pres- the attribute values for each of the environmentalence of an endemic species, significantly impact attributes, and the cost attribute (for which averageecosystems of high biological diversity, or affect a incremental cost over a 20-year planning horizonhabitat already in a marginal condition. was used) were calculated for every option, with
There are a number of practical problems in results displayed as a series of two-dimensionalderiving an appropriate index. The first is that the trade-off curves. In a final step, the list of candidatevalue of the area lost is a function of what remains plans for further study was then derived by examin-of the habitat. For example, the loss of the last hectare ing dominance relationships among all criteria si-of an ecosystem would be unacceptable, whereas the multaneously.loss of one hectare if 1,000 hectares remain would be Figure 5.3 illustrates a typical trade-off curve,much less. Second, ecosystems may require a mini- in this case for health impacts. The "best" solutionsmum area for long term survival, which implies that are those that lie closest to the origin, and the so-the value function would need to tend to inflnity as called trade-off curve, defined by the set of "non-in-it approaches that minimum value. Perhaps even ferior" solutions, represents the set of options that aremore importantly, the argument is sometimes made superior, regardless of the weights assigned to thethat the value to be ascribed to the loss of habitat different objectives. For example, on this curve, theassociated with some regulatory or govermmental option defined as "iresid", which calls for the use ofdecision depends on whether it remains secure. The low sulfur imported fuel oil at diesel plants is betterdetails of the biodiversity index derived in the case on both the cost and the environmental objective thanstudy are discussed further in Annex 4. the use of flue gas desulfurization systems (identified
Someimpacts, however, resistdirectquantifica- as the point "FGD").tion, even in terms of the sort of probabilistic scale A quite different trade-off curve was derived forderived for biodiversity. For example, the quantifi- biodiversity, and on Figure 5.4 is illustrated as thecation of potential damages to aquatic ecosystems trade-off between biodiversity index value and aver-from thermal discharges is extremely problematic, in age incremental cost. Most of the options have anlarge part because of the difficulties in extrapolating index value that falls in the range of 50-100: the nofrom one ecosystem to the other. The general effects hydro option has an essentially zero value, becauseof thermal discharges into coastal waters are of the thermal projects that replace hydro plants in thiscourse well known. Discharges into the well-mixed, option tend to lie at sites of poor biodiversity valuesurface layer would usually have the general ten- (either close to load centers or on the coast). Fordency to repel fish. On the other hand, if the dis- example,while wind plants would require rathercharge is below the thermocline, thermal discharges large land area, the vegetation of the area on the southwould have a generally beneficial effect, as the up- coast has relatively low biodiversity value, and there-welling effect caused by plume buoyancy brings fore the overall increase in biodiversity impact of thisnutrients to the layers near the surface. However, option is small. Thus, the best options (or non-infe-attaching specific numerical estimates to the values rior curve) include the no hydro option, and run-of-of this general function is essentially impossible. river hydro options that require essentially zeroWhat can be done as a generic calculation that can inundation. Note the extreme outlier at the top rightbe used to compare different sites is to begin with a hand corner, which is the Kukule hydro dam-it hasdefinition of what is considered to constitute an a biodiversity loss index (B = 530) that is an order ofacceptable environmental risk; for example, say a magnitude larger than for other options (B = 50 totemperature increase of no more than 1 °C at the 70).surface. The surface area over which this criterion is The case study drew several useful conclusions.exceeded is then calculated as a function of the The first four listed below are of a methodologicalcooling system design proposed. nature, and deal with the extent to which multi-attrib-
ute methods are potentially effective in assisting

60 Part II: Case Studies
Figure 5.3 frade-Off Curve of kWh Costs Versus Health Impacts Index
5.9
5.8 u +kukuleHD
5.7no DSM
5.6
5.5lowScoal+iresid
5.4 - u +FGD U noCoalEa)'a 5.3 - owScoal
51 resid m Mawella>D5.2 a ~~~T&D>11
5.15 \ +wind
4.9 + noHydro. ............. basecase(with DSM)4.8+PC
.+UO20014.7 _ I ; . I
2 3 4 5 6 7
NPV(health Impacts,2010,10%)
decision-makers. The remaining ones deal with the Third, the case study indicated that certain op-substantive policy recommendations whose focus is tions were in fact clearly inferior, or clearly superior,to ensure that environmental considerations are ap- to all other options when one examines all impactspropriately incorporated in the planning process. simultaneously. For example, the high dam version
First, the results of the case study indicate that of the Kukule hydro project can be safely excludedthose impacts for which valuation techniques are from all further consideration as a result of poorrelatively straightforward and well-established- performance on all attribute scales (including thesuch as valuing the opportunity costs of lost produc- economic one). On the other hand, implexmaentationtion from inundated land, or, estimating the benefits of certain demand side management measures domi-of establishing fisheries in a reservoir-tend to be nates all other options; i.e., they yield positive gainsquite small in comparison to overall system costs, in terms of economic and enviromnental criteria.and their inclusion into the benefit-cost analysis does Fourth, the results indicate that it is possible tonot materially change results. derive attribute scales that can be useful proxies for
Second, even in the case where explicit valu- impacts that may be difficult to value. For example,ation may be difficult, such as in the case of mortality use of the population-weighted incremental ambientand morbidity effects of air pollution, implicit valu- air pollution scale as a proxy for health impactsation based on analysis of ihe trade-off curve can permitted a number of important conclusions that areprovide important guidance to decisionmakers. For independent of the specific economic value assignedexample, the study determined that the value of to health effects. Thus, the study clearly demon-human life necessary to justify flue gas desulfuri- strated that if the health effects of pollutants associ-zation at potential sites for coal fired-power plants ated with fossil fuel combustion (particularly finewas on the order of $1.5 million. This is at least particulates and NOx) are to be considered, then theone (if not two) orders of magnitude greater than most effective strategy for reducing the overall popu-what would be needed to justify the installation of lation dose is to install tighter pollution controls atmodem diagnostic equipment at the regional hos- oil-burning power plants located in or near urbanpitals.

Part I: Case Studies 61
Figure 5.4 Trade-Off Curve of kWh Costs Versus Biodiversity Index
5.8 - +kukule D
5.7* no DSM
5.6 -
5.5 -
5.4 - +FGD - > ?cE 5.3 iowScoal0)T5 2 iresid
5.2 - T&D>11
a 5.1 -U +wind
5-4.9 _ oHydro Trade-off curve
+ku4.8
+UO20014.7 ¢ I l l l
0 100 200 300 400 500 600Blodiverslty idex
areas, rather than installing FGD systems at the more fluidized bed combustion (PFBC) technology forremote sites suitable for coal-burning power plants. coal power, (iv) replacement of some coal-fired
Finally, with respect to the practical implica- power plants (on the South coast) by diesel units; andtions for planning, the study came to a series of (v) the need to re-examine cooling system options forspecific recommendations on priority options, in- coal plants.cluding (i) the need to systematically examine de-mand side management options, especially Notesfluorescent lighting; (ii) the need to examine whetherthe present transmission & distribution loss reduc- 1. This case study is derived from Kramer, Munasinghe,tion target of 12% ought to be further reduced; (iii) Sharm, et al.. 1992.
... . ~~~~~~2. This case study is derived frmn Meier and Mus-the need to examine the possibilities of pressurized i 92.T

6. Conclusions
One essential step towards achieving economically developing country is required rather than furtherefficient management of natural resources and for- theoretical development. Such case study work canmulating a practical strategy for sustainable develop- be most effectively carried out as part of projectment, is the effective incorporation of environmental preparation. A major purpose in this endeavor is notconcerns into decisionmaking. Traditionally, the eco- to provide fine-tuned numbers but to indicate ordersnomnic analysis of projects and policies (including the of magnitude. Some alternatives can be ruled out andtechniques of shadow pricing), has been developed gross environmental errors avoided in ti.s fashion.to help a country make more efficient use of scarce Also, one can often identify the key environmentalresources. "External effects," especially those indicators to which the decision is sensitive and focusarising from adverse environrnental consequences, attention on them.often have been neglected. Some modest evidence exists that the valuation
This report has reviewed concepts and tech- techniques for determining use values may be ap-niques for valuation of environmental impacts that plied successfully in appropriate cases. However,enable such environmental considerations to be ex- examples involving the estimation of nonuse valuesplicitly considered in the conventional cost-benefit are virtually nonexistent in the developing world,calculus used in economic decisionmaking. Even and rather scarce even in the industrialized nations.rough qualitative assessments early on in the project The use of multiobjective decision methods alsoevaluation cycle may facilitate the process of inter- needs to be explored in greater depth, as an alterna-nalizing these environmental externalities. The ad- tive to more purely economic valuation methods.vantages include early exclusion of environmentally Nevertheless, developing counties are attempt-unsound altematives; more effective in-depth con- ing increasingly to both improve and make use ofsideration of environmentally preferable altema- economic techniques to value environmenital assets.tives; and opportunities for redesigning projects and While the academic literature usually focuses mainlypolicies in order to achieve sustainable development on the development of the techniques, there are alsogoals. sector- or topic-related approaches.14 For practitio-
Certain specific shortcomings and difficulties ners, the important concern is to keep up with andassociated with the case studies were discussed ear- make use of the advances most relevant to itheir ownlier. More generally, greater application of the envi- areas of application. To facilitate this, an extensiveronmental valuation concepts and techniques bibliography is included at the end of this chapter.presented in this paper to practical problems in a

Bibliography
Anderson, D., The Economics of Afforestation - A counting - Framework for an SNA SatelliteCase Study in Africa, The World Bank Occa- System", Review of Income and Wealth, 1989.sional Paper No. 1/New Series, The Johns Hop- Bator, F.J., "General Equilibrium, Welfare and Allo-kins University Press, Baltimore, Md., 1987. cation", American Economic Review, March
Attaviroj, P., "Soil Erosion and Land Degradation in 1957, pp. 22-59.the NorthemThai Uplands", in J.A. Dixon, D.E. Baumol, W.J. and W.E. Oates, The Theory of Envi-James and P.B. Sherman (Eds.), Dryland Man- ronmental Policy, (2nd ed.), Cambridge Univer-agement: Economic Case Studies, Earthscan sity Press, Cambridge, 1988.Publications Ltd., London, 1990. Binswanger, H., "Brazilian Policies that Encourage
Aylward, B., The Economic Value of Ecosystems: 3 Deforestation in the Amazon", ENV Depart-- Biological Diversity, LEEC Gatekeeper Series ment Working Paper No. 16, World Bank,No. GK91-03, IIED/UCL London Environ- Washington, D.C., April 1989.mental Economics Centre, June 1991. Birdsall, N. and D. Wheeler, "Openness Reduces
Aylward, B., and E.B. Barbier, "Valuing Environ- Industrial PollutioninLatin America: The Miss-mental Functions in Developing Countries", ing Pollution Haven Effect", paper presented atBiodiversity and Conservation, 1992, vol. 1, pp the Symposium on International Trade and the34-50. Environment, International Economics Depart-
Balik, M. and R. Mendelsohn, "Assessing the Eco- ment, World Bank, Washington D.C., Novem-nomic Value of Traditional Medicines from ber 1991.Tropical Rain Forests", Conservation Biology, Bishop, R.C., "Option Value: An Exposition andVol. 6, No. 1, March 1991. Extension", Land Economics, Vol. 58, No.1,
Barbier, E.B., The Economic Value of Ecosystems: I February 1982, pp. 1-15.- Tropical Wetlands, LEEC Gatekeeper Series Bishop, J. and J. Allen, The On-Site Costs of SoilNo. GK89-02, August 1989. Erosion in Mali, Environment Department
, The Economic Value of Ecosystems: 2 - Working Paper 21, the World Bank, Washing-Tropical Forests, L-EC Gatekeeper Series No. ton, D.C., 1989.GK91-01, January 1991. Bockstael, N.E., K.E. McConnell and I. Strand,
, The Economics of Controlling Degrada- "Recreation", in Braden, J.B., and Kolstad,tion: Rehabilitating Gum Arabic Systems in Su- C.D., eds., op. cit., Chapter 8, p. 227-270.dan, LEEC Discussion Paper No. DP90-03, Bojo, J., The Economics of Land Degradation: The-IIED/UCL London Environmental Economics ory and Applications to Lesotho, DissertationCentre, June 1990. for the Doctor's Degree in Economics, Stock-
Barbier, E.B., W. M. Adams and K. Kimmage, Eco- hohm School of Economics, 1991, pp.259 -350.nomic Valuation of Wetland Benefits: The Hade- , "Benefit-Cost Analysis of the Farm Im-jia-Jama'are Floodplain, Nigeria, LEEC provement with Soil Conservation Project inDiscussion Paper No. DP91-02, April 1991. Maphutseng, Mohale's Hoek District, Leso-
Barde, J.P., and D. W. Pearce (eds.) Valuing the tho", in J.A. Dixon, D.E. James and P.B. Sher-Environment: Six Case Studies, Earthscan Pub. man (eds.), 1990, op. cit.Ltd., London, June 1991. , Economic Analysis of Agricultural Devel-
Bartelmus, P., E. Lutz, and S. Schweinfest, Inte- opment Projects. A Case Study from Lesotho,grated Environmental and Economic Account- EFI Research Report, Stockholm School ofing: A Case Study for Papua New Guinea, Economics, 1990.Envirornent Working Paper No. 54, World Bojo, J., K.G. Maler, and L. Unemo, EnvironmentBank, Washington D.C., July 1992. and Development: An Economic Approach,
Bartelmus, P., C. Stahmer, and J. van Tongeren, Kluwer, Durdrecht, 1992."Integrated Environmental and Economic Ac-

64 Bibliography
Boyd, R., W. Cruz and WF. Hyde, "Unintended Costanza, R., (ed.), Ecological Economics: The Sci-Policy Spilovers on Upland Resources and the ence and Management of Sustainability, Co-Environment", Ohio University, unpublished lumbia University Press, New York, 1991.manuscript, 1990. Cropper, M.L. and W.E. Oates, "Environmental Eco-
Braat, L.C. and J.B. Opschoor, "Risks in the Bot- nomics: A Survey", Journal of Economic Lit-swana Range-Cattle System", in J.A. Dixon, erature, Vol. XXX, June 1992, pp. 675-740.D.E. James and P.B. Sherman (eds.), 1990, op. Cruz, W. and M. Munasinghe, Economic Policy andcit the Environment: A Review of Bank Work, En-
Braden, LB. and C.D. Kolstad (eds.), Measuring the vironment Department, World Bank, Vlashing-Demand for Environmental Quality, Elsevier, ton D.C., 1992.New York, 1991, Chapters 2 and 10. Cruz, W. and R. Repetto, The Environmental Effects
Bromley, D. W., "Entitlements, Missing Markets, of Stabilization and StructuralAdjustment Pro-and Environmental Uncertainty", Journal of grams: The Philippines Case, World ResourcesEnvironrnental Economics and Management, Institute, Washington D.C., September 1992.vol. 17,1181 - 194, 1989. Dasgupta, P. and G. Heal, Economic Theory and
Brookshire, D.S., L.S. Eubanks and A. Randall, "Es- Exhaustible Resources, Cambridge Universitytimating Option Prices and Existence Values for Press, Cambridge, 1979.Wildlife Resources", Land Economics, Vol. 59, Dasgupta, P. and K.G. Maler, "The Environment andNo. 1, February 1983. Emerging Development Issues", proceedings of
Brown Jr., G. and W. Henry, Trhe Economic Value of the World Bank Annual Conference on Devel-Elephants, London Environmental Economics opment Economics 1990, Beijer Reprint SeriesCentre, Discussion Paper 89-12, 1989. No. 1, Beijer International Institute of Ecologi-
Brown, K. and D.W. Pearce, 'The Economic Value cal Economics, Stockholm, 1991.of Non-Market Benefits, of Tropical Forests: Dasgupta, P., S. Marglin and A. K. Sen, GuidelinesCarbon Storage", in J. Weiss, The Economics of for Project Evaluation, UNIDO, NewProjectAppraisal and theEnviromnent, Edward York, 1972.Elgar, London, 1993. Dixon, J., R. Carpenter, L. Fallon, P. Shermaan, and
Capistrano, D. and C. F. Kiker, "Global Economic S. Manipomoke, Economic Analysis of t!he En-Ifluences on Tropical Closed Broadleaved vironmental Impacts of Development Projects,ForestDepletion, 1967- 1985", paperpresented published by Earthscan in association with theat the International Society for Ecological Eco- Asian Development Bank, London, 1988.nomics Conference, May 1990, World Bank, Dixon, J., and M.M. Hufschmidt (eds.), EconomicWashington D.C. Valuation Techniques for the Envirounent,
Coase, R., 'The Problem of Social Cost", Journal of Johns Hopkins University Press for the East-Law and Economics, October 1960. West Center,1986.
Cocklin, C., "Mathematical Programming and Re- Dixon, J.A., D.E. James and PB. Sherman, Thesources Planning I: The limitations of Tradi- Economics of Dryland Management, Earthscan,tional Optimization", Journal of Environmental London, 1989.Management, vol. 28, 1989, pp. 127-141. Dixon, J.A. and P.B. Sherman, Economics of Pro-
Committee of International Development Institu- tected Areas, Island Press, Washington D.C.,tions on the Environment (CIDIE), 'The Pre- 1990.sent State of Environmental and Resource Durojaiye,B.O., and A.E. Ikpi. 'TheMonetary ValueAccounting and its Potential Application in De- of Recreational Facilities in a Developing Econ-veloping Countries", prepared for Environ- omy: A Case Study of Three Centers in Nige-mental and Natural Resource Accounting ria." Natural Resources Journal 28(2):315-328,Workshop, UNEPHeadquaters, Nairobi, 22-26 1988.February 1992. Energy Journal, Special Issue on Electricity Reli-
ability, Vol. 9, December 1988.

Bibliography 65
Evenson, R., "Genetic Resources:Assessing Eco- Institute and University of California, River-nomic Value", in J. Vincent et al., Valuing Envi- side, July 1992.ronmental Benefits in Developing Economies, Goodland, R., H. Daly and S. El-Serafy, Environ-Michigan State University, East Lansing, 1992. mentally Sustainable Economic Development
Finney, C.E. and S. Westem, "An Economic Analysis Building on Brundtland, ENV 46, Environmentof Environmental Protection and Management: Department, The World Bank, Washington,An Example from the Philippines", in The En- D.C., 1991.vironmentalist, Vol. 6, No. 1, 1986. Grandstaff, S., and J.A. Dixon, "Evaluation of
Fischer, S. and V. Thomas, "Policies for Economic Lumpinee Park in Bangkok, Thailand." in JohnDevelopment", American Journal of Agricul- A. Dixon and M.M. Hufschmidt (eds.), Eco-tural Economics, Vol. 72, No. 3, 1990. nomic Valuation Techniques for the Environ-
Fisher, A. C., and M. Hanemann, "Quasi Option ment: A Case Study Workbook, Johns HopkinsValue: Some Misconceptions Dispelled", Jour- University Press, Baltimore, Md., 1986.nal of Environmental Economics and Manage- Hamilton, L. S., J. A. Dixon and G. 0. Miller, "Man-ment, 14, 1987, pp. 183 - 190. grove Forests: An Undervalued Resource of the
Fleming,W.M.,"PhewaTalCatchmentManagement Land and of the Sea," in E. M. Borgese, N.Program: Benefits and Costs of Forestry and Ginsburg and J. Morgan (eds.), Ocean YearbookSoil Conservation in Nepal", in L.S. Hamilton No. 8, Univ. of Chicago Press, Chicago, II.,(ed.), Forest and Watershed Development and 1989.Conservation in Asia and the Pacific, Westview Hanemann, W. M., "Willingness to Pay and Willing-Press, Boulder, CO, 1983. ness to Accept:How Much Can They Differ?",
Folke, Carl and AnnMari Jansson, The Emergence of American Economic Review, vol. 81, no.3, Junean Ecological Economics Paradigm: Examples 1991.from Fisheries and Agriculture, Beijer Reprint Harberger, A.C., Project Evaluation: Collected Pa-Series No. 9, Beijer International Institute of pers, University of Chicago Press, 1976.Ecological Economics, Stockholm, 1992. Harrington, W., A.J. Krupnick and W.O. Spofford,
Fredriksson, P. and A. Persson, The Manicaland Jr., 'The Economic Losses of Waterbome Dis-Health, Water, and Sanitation Program in Zim- ease Outbreak", Journal of Urban Economics,babwe -A Social Cost Benefit Analysis, Depart- Vol. 25, No. 1. 1989, pp. 116-137.ment of International Economics and Hartunian, N.S., C.N. Smart, and M.S. Thompson,Geography, Stockholm School of Economics, The Incidence and Economic Costs of Major1989. Health Impairments, D.C. Heath, Lexington,
Freeman, A.M., The Measurement of Environmental Mass, 1981.Resource Values, World Resources Institute, Hodgson, G., and J.A. Dixon, Logging Versus Fish-Washington D.C., 1993. eries andTourism in Palawan, Paper No.7, East
Friedman, J.W., Game Theory with Applications to West Center, Honolulu, HI, 1988.Economics, Oxford, Oxford University Press, Holmberg, G., "An Economic Evaluation of Soil1986. Conservation in Kitui District, Kenya", in J.A.
Gigengack, A.R. et al., "Global Modelling of Dry- Dixon, D.E. James and P.B. Sherman (eds.),land Degradation", in J.A. Dixon, D.E. James 1990, op. cit.and P.B. Shennan (eds.), 1990, op. cit. Hyde, W.F. et al,"Forest Economics and Policy
Gilbert, A., "Natural Resource Accounting: A Case Analysis: An Overview", World Bank Discus-Study of Botswana", in J.A. Dixon, D.E. James sion Paper No. 134, Washington D.C., 1991.and P.B. Sherman (eds.), 1990, op. cit. Jimenez, E., "The Magnitudes and Determinants of
Githinji, M. and C. Perrings, "Social and Ecological Home Improvement in Self-Help Housing: Ma-Sustainability in the Use of Biotic Resources in nila's Tondo Project", Land Economics, Vol.59,sub-Saharan Africa: Rural Institutions and De- No. 1 (1983), pp. 70-83.cisionmaking in Kenya and Botswana", Beijer Johnson, D.G., World Agriculture in Disarray,
Macmnillan Press Ltd, London, 1973.
66 Bibliography
Kahn, J.R. and J.A. McDonald, 'Third World Debt University of Maryland, College Park, MD, De-and Tropical Deforestation", prepared by Oak cember 1991.Ridge National Laboratory, Tennessee, for the Luenberger, D., Introduction to Linear and Von-lin-U.S. Department of Energy, December 1991. ear Programming, Addison-Wesley, Reading
Kim, S. and J.A. Dixon, "Economic Valuation of MA, 1973.Environmental Quality Aspects of Upland Ag- Lutz, E. (ed), Toward Improved Accounting for thericultural Projects in Korea", in J.A. Dixon and Environment, World Bank, Washington D.C.,M.M. Hufschmidt (eds.), 1986, op. cit. 1993.
Kolstad, C.D. and J.B. Braden, "Environmental De- Lutz, E. and M. Munasinghe, "Accounting for themandTheory", Chapter 2 inBraden and Kolstad Envirornment," Finance and Development, Vol.(eds.) 1991, Measuring rhe Demand for Envi- 28, March 1991, pp. 19-21.ronmental Quality, Elsevier, New York. Lutz, E. and M. Young, "Integration of Environ-
Knetsch, J.L. and J.A. Sinden, "Willingness to Pay mental Concems into Agricultural Policies ofand Compensation Demanded: Experimental Industrial and Developing Countries", WorldEvidence of an Unexpected Disparity in Meas- Development, Vol. 20, No. 2 (1992), pip. 241-ures of Value", Quarter,!y Journal of Econom- 253.ics, August 1984. MacRae, D., Jr., and D. Whittington, "Assessing
Kramer R.A., M. Munasinglie, N. Sharma, E. Mer- Preferences in Cost-Benefit Analysis: Reflec-cer, and P. Shyamsundar, "Valuation of Impacts tions on Rural Water Supply Evaluation inof Conservation and Development Projects: A Haiti." Journal of Policy Analysis and Manage-Case Study in Madagascar", paper presented at ment 7(2):246-263,1988.the Environnental Valuation Workshop, World Maler, K.G., "Economic Theory and EnvironmentalBank, Washington D.C., December 1992. Degradation: ASurvey of Some Problenis",Re-
Krautkraemer, J., 'The Rate of Discount and the vista de Analisis Economico, Vol. 5, No. 2, pp.Preservation of Natural Environments", Natu- 7 - 17, November 1990.ral Resources Modelling,, Vol. 2, winter 1988. Maler, K.G., "Production Function Approach in De-
Krueger, A., M. Schiff, and A. Valdes, The Political veloping Countries", Beijer Reprint Series No.Economy of Agricultural Pricing Policies, The 6, Beijer Institute, Stockholm, 1992.World Bank, Washington D.C., 1991. Mahar, D., "Govermment Policies and Deforestation
Lewandrowski, J.K. and E. McClain, "Resource Use in Brazil's Amazon Region", a World Bankand Deforestation in Brazil", USDA Economic publication in cooperation with the World Wild-Research Service, unppublished manuscript, life Fund and the Conservation Foundation,1990. Washington, D.C., 1989.
Liebman, J., "Some Simple-Minded Observations Margulis, S., Back of the Envelope Estinuates ofon the Role of Optimization in Public Systems EnvironmentalDamageCosts inMexico, PolicyDecisionmaking", Interfaces, Vol. 6, 1976, pp. Research Working Paper, World Bank, Wash-102 - 108. ington, D.C., January 1992.
Little, I.M.D. and J.A. Mirrlees, Project Appraisal Markandya, A., TheEconomicAppraisal of Projects:and Planning for Developing Countries, Basic The Environmnental Dimension, Inter-AmericanBooks, New York, 1974. Development Bank, Washington D.C., July
Little, I. M. D. and J. A. Mirrlees, "Project Appraisal 1991.and Planning Twenty Years On", paper pre- Markandya, A. and D.W. Pearce, "Enviromnentalsented at the Annual Coniference on Develop- Considerations and the Choice of the Discountment Economics, World Bank, April 26 and 27, Rate in Developing Countries", ENV Depart-1990. ment Working Paper No. 3, Washington D.C.,
Lopez, R., 'The Environment as a Factor of Produc- May 1988.tion: The Economic Growth and Trade Policy Markandya, A. and D.W. Pearce, "Social Costs ofLinkage", mimeo, Economics Department, Tobacco Smoking", British Journal of Addic-
tion, Vol. 84, No. 10, 1989, pp. 1139-1150.

Bibliography 67
McConnell, K.E., and J.H. Ducci, "Valuing Environ- Munasinghe, M., and J. McNealy, "Key Conceptsmental Quality in Developing Countries: Two and Terminology of Sustainable Development",Case Studies." Prepared for session on "Contin- UNU Conference on Sustainability, 22-25 Junegent Valuation Surveys in Developing Coun- 1992, Washington, D.C.tries," AEA/AERE Annual Meetings, Atlanta, Munasinghe, M., W. Cruz and J. Warford, "DoGeorgia, 1989. Macroeconomic Policies Hurt the Environ-
Meier, P. and M. Munasinghe, Incorporating Envi- ment," Finance and Development, Sept. 1993.ronmental Concerns into Power Sector Deci- Muzondo, T.R., K.M. Miranda, and A.L. Borenberg,sionmaking: A Case Study of the Sri Lankan "Public Policy and the Environment", IMFPower Sector, ENV Department, World Bank, Working Paper, International Monetary Fund,Washington D.C., December 1992. Washington D.C., June 1990.
Mendelsohn, M., "Modelling the Demand for Out- Newbery, D.M.G., "Externalities: The Theory of En-door Recreation", Water Resources Research, vironrental Policy" in G.A. Hughes and G.M.Vol. 23, No 5,1987, pp. 961-7. Heal (eds.), Public Policy and the Tax System,
Mercer, E. and Kramer R., "An International Travel 1980.Cost Model: Estimating the Recreational Use Norgaard, R. B., "Sustainability as IntergenerationalValue of a Proposed National Park in Madagas- Equity: The Challenge to Economic Thoughtcar". Paper presented at the Association of En- and Practice", Internal Discussion Paper, Asiavironmental and Resource Economists Regional Series, Report No. IDP-97, WorldContributed Paper Session: Recreation Demand Bank, June 1991.Models Allied Social Science Association An- Odum, E. P., Ecology: The Link Between the Natu-nual Meeting, New Orleans, January 5, 1992. ral and Social Sciences, Holt-Saunders, New
Mitchell, R.C., and R.T. Carson, Using Surveys to York, second edition, 1975.Value Public Goods: The Contingent Valuation Odum, H. T., "Energy, Ecology, and Economics",Method, Resources for the Future, Washington, Amnbio, vol. 2, pp. 220-227, 1973.D.C., 1989. Pearce, D.W., "An Economic Approach to Saving the
Mu, X. et al., "Modelling Village Water Demand Tropical Forest" in D. Helm (ed.), EconomicBehaviour: A Discrete Choice Approach", Policy Towards the Environment, Blackwell,Water Resource Research, Vol. 26, No. 4. Oxford, 1991.
Munasinghe, M., Electric Power Economics, Butter- Pearce, D. W., "Economic Valuation and the Naturalworths Press, London, 1990a, chapters 2,7,8,9. World", Policy Research Working Paper
Munasinghe, M., Energy Analysis and Policy, But- WPS988, World Bank, Washington D.C., Octo-terworths Press, London 1990b. ber 1992.
Munasinghe, M., "Managing Water Resources to Pearce, D.W., E.B. Barbier, A. Markandya, S. Bar-Avoid Environmental Degradation", ENV rett, R.K. Tuner and T. Swanson, Blueprint 2:Working Paper No. 41, World Bank, Washing- Greening the World Economy, Earthscan Publi-ton, D.C. 1990c. cations Ltd., London, 1991.
Munasinghe, M., Water Supply and Environmental Pearce, D.W. and S. Puroshothaman, "ProtectingManagement, Westview Press, Boulder, CO, Biological Diversity: The Economic Value of1992. Medicinal Plants", in T. Swanson, Biodiversity
Munasinghe, M., and E. Lutz, "Environmental-Eco- and Botany:The Values of Medicinal Plants,nomic Analysis of Projects and Policies for Sus- Cambridge University Press, Cambridge, 1993,tainable Development", ENV Working Paper forthcoming.No. 42, World Bank, Washington, D.C., Janu- Pearce, D.W., and A. Markandya, Environmentalary, 1991. Policy Benefits: Monetary Valuation, OECD,
Munasinghe, M., "Biodiversity Protection Policy: Paris, 1989.Environmental Valuation and Distribution Is- Pearce, D.W. and R.K. Turner, The Use of Benefitssues", Ambio, Vol. 21, No. 3, May 1992. Estimates in Environmental Decisionmaking,

68 Bibliography
report to the Environment Directorate, OECD, Quiggin, J., "A Research Program for a Critique ofParis, July 1990. Total Valuation", University of Maryladld Aus-
Pearce, D.W., and R.K. Turner, Economics of Natu- tralian National University, mimeo, 1991.ral Resources and the Environment, Harvester Randall, A., "Total and Non-Use Values", Chapter 10Wheatsheaf, 1990. in Braden and Koistad (eds.) 1991, Measuring
Pearce, D.W. and J. Warford, World Without End: the Demand for Environmental Quaility, El-Environment, Economics, and Sustainable De- sevier, New York.velopment, Oxford University Press, Oxford, Randall, A. and J.R. Stoll, "Existence Value in aTotal1993. Valuation Framework", in Managing Air Qual-
Pender, J.L., "Experimental Measurement of Dis- ity and Scenic Resources at National Pt7ks andcount Rates in Rural India", Stanford Univer- WildernessAreas,WestviewPress,BoulderCO,sity, manuscript, 1992. 1983.
Pender, JLL and T.S. Walker, "Experimental Meas- Ray, A., Cost Benefit Analysis, Johns Hopkins Uni-urement of Tume Preference in Rural India", versity Press, Baltimore MD, 1984.Stanford University and ICRISAT, manuscript, Reed, D., (ed.), Structural Adjustwnt and tAe Envi-1992. ronment, Westview Press, Boulder CO, 1992.
Perrings, C., "Biotic Diversity, Sustainable Develop- Repetto, R., "Economic Policy Reform for Naturalment, and Natural Capital", paper presented at Resource Conservation", ENV DepartmentIntemational Society for Ecological Econom- Working Paper No.4, World Bank, Washingtonics, Stockholm, August 1992. D.C., May 1988.
Perrings, C., Ecological Sustainability and Environ- 'Repetto, R, W. Magrath, M. Wells, C. Beer;and F.mental Control, Centre for Resource and Envi- Rossini, Wasting Assets: Natural Resources inronmental Studies, Australian National the National Income Accounts, World Re-University, 1991. sources Institute, Washington D.C., 1989.
Peskin, H.M. with E. Lutz, "A. Survey of Resource Repetto, R., W. Cruz, R. Solorzano, R. de Camino,and Environmental Accounting in Industrial- R. Woodward, L. Tosi, V. Watson, A. Vazquez.ized Countries", Environment Working Paper C. Vilalobos, and J. Jimenez, Accounts Over-No. 37, World Bank, Washington D.C., 1990. due: Natural Resource Depreciation in Costa
Peters, C.M., A.H. Gentry, and R.O. Mendelsohn, Rica, Tropical Science Center, San Jose, and"Valuation of an Amazoniian Rainforest", Na- World Resources Institute, Washington D.C.,ture, Vol. 339, 29 June 1989, pp. 655-656. 1991.
Petry, F., "Who is Afraid of Chloices? A Proposal for Romero, C. and T. Rebman, "Natural Resource Man-Multi - Criteria Analysis as a Tool for Decision- agement and the Use of Multiple Criteria Deci-making Support in Development Planning", sionmaking Techniques: A Review", EuropeanJournal of International Development, Vol. 2, Journal of Agricultural Economics, Vol. 14,1990. pp. 209-231. 1987, pp. 61 - 89.
Pezzey, J., "Sustainable Development Concepts: An Ruitenbeek, R., "The Rainforest Supply Price: AEconomic Analysis", World Bank Enviromnent Tool for Evaluating Rainforest ConservationPaper No. 2, World Bank, Washington D.C., Expenditures", Ecological Economics, V0Ol. 6,1992. No. 1, July 1992.
Phantumvanit, D., "A Case Study of Water Quality Samples, K.C., J.A. Dixon, and M.M. Gowen, "In-Management in Thailand", in Y.J. Ahmad (ed.), formation Disclosure and Endangered SpeciesAnalysing the Options, UNEP Studies, 5. Per- Valuation", Land Economics, Vol. 62, NVo. 3,gamon Press Ltd., Oxford, 1982. August 1986.
Phelps, C.E., "Death and Taxes: An Opportunity for Samuelson, P.A., 'The Pure Theory of Public Expen-Substitution", Journal of Health Economics, ditures", Review of Economics and Statistics,Vol. 7, 1988, pp 1-24. vol. 36,370-89.
Sassone, P.G., "Shadow Pricing in CBA: Mathemati-cal Programniing and Economic Theory", The

Bibliography 69
Engineering Economist, vol.22, Spring 1977, Squire, L. and H. van der Tak, Economic Analysis ofpp. 219-33. Projects, Johns Hopkins University Press, Bal-
Schecter, M. and S. Freeman, "Some Reflections on timore MD, 1975.the Definition and Measurement of Non-Use Statistical Office of the United Nations (UNSO),Value", Natural Resources and Environmental "SNA Handbook on Integrated EnvironmentalResearch Center and Departmentof Economics, and Economic Accounting", New York, pre-University of Haifa, June 1992 (draft). limninary draft, October 1990.
Schneider, R., G. Platais, D. Rosenblatt, and M. Stocking, M., The Cost ofSoil Erosion in Zimbabwe,Webb, "Sustainability,Yield Loss and Imedia- In Terms of the Loss of Three Major Nutrients,tismo," LATEN Dissemination Note No. 1,The Working Paper 2, Soil Conservation Pro-World Bank, Washington, D.C., April 1993. gramme, Land and Water Development Divi-
Schuh, G.E., "The Exchange Rate and U.S. Agricul- sion, Food and Agriculture Organization,ture", American Journal of Agricultural Eco- Rome, December 1986.nomics, Vol. 56, no. 1, 1974. Strand,J. and A. Taraldset, The Valuation ofEnviron-
Schulze, W.D., D.S. Brookshire, E.G. Walther, K. mental Goods in Norway: A Contingent Valu-Kelley MacFarland, M.A. Thayer, R.L. Whit- ation Study with Multiple Bias Testing,worth, S. Ben-David, W. MaimL and J. Molenar, Department of Economics, University of Oslo,"The Economic Benefits of Preserving Visibil- March 1991.ity in the National Parklands of the Southwest", Thomas, V., "Evaluating Pollution Control: The CaseNatural Resources Journal, Vol. 23, January of Sao Paulo." Chapter 13 in The Economics of1983. Urbanization and Urban Policies in Develop-
Sebastian, I., and A. Alicbusan, "Sustainable Devel- ing Countries, G.S. Tolley and V. Thomas (eds.),opment: Issues in Adjustment Lending Poli- The World Bank, Washington, D.C., 1987.cies", ENVPR Working Paper No. 1989 - 6, Tobias, D. and R. Mendelsohn, "Valuing EcotourismOctober 1989, World Bank. in aTropical Rain-Forest Reserve",Ambio, Vol.
Ser6a da Motta, R. and C. E. F. Young, Natural 20, No. 2, April 1991.Resources and National Accounts: Sustainable Tumer, R.K., "Wetland Conservation: EconomicsIncome from Mineral Extraction in Brazil, and Ethics," in Economics, Growth and Sustain-IPEA, Rio de Janeiro, 1991. able Environments: Essays in Memory of Rich-
Smith, V.K., "Nonmarket Valuation of Environ- ard Lecomber, D. Collard, D.W. Pearce and D.mental Resources: An Interpretive Appraisal", Ulph, (eds.), 121-159. Macmillan, London,North Carolina State University, Raleigh, July 1988.1992. UNEP, IUCN, andWWF. Caringfor the Earth. 1991.
Smith, V.K., "Option Value: A Conceptual Over- Uzawa, H., "'Time Preference and the Penrose Effectview", Southern Economic Journal, vol. 49,3, in a Two-Class Model of Economic Growth," J.pp. 654-658, 1983. Political Economy, Vol. 77, 1969, pp. 628-652.
Society for Promotion of Wastelands Development, van Pelt, M.J.F., Sustainable Development and Pro-"Economic and Social Change in a Small Rural ject Appraisal in Developing Couries, paperCommunity in the Degraded Lower Shivalik presented at the 31st European Congress of theHill Range in North India", in J.A. Dixon, D.E. Regional Science Association, Lisbon, Portu-James and P.B. Sherman (eds.), 1990, op. cit. gal, 27-30 August, 1991.
Society for Promotion of Wastelands Development, vanITngeren, J., S. Schweinfest, E, Lutz, M. Gomez"Dryland Management Options in Wastelands Luna, and F. Guillen Martin, "Integrated Envi-Development: Jawaja Block, Rajasthan (In- ronmental and Economic Accounting: A Casedia)", in J.A. Dixon, D.E. James and P.B. Sher- Study for Mexico", Environment Working Pa-man (eds.), 1990, op cit. per No. 50, World Bank, Washington D.C., De-
Solow, R., "On the Intergenerational Allocation of cember 1991.Natural Resources", Scandinavian Journal of Vmcent, J.R., E. W. Crawford and J.P. Hoehn, eds.,Economics, volume 88, no. 1, pp. 141-149. Valuing Enviromnental Benefits in Developing

70 Bibliography
Countries, proceedings of a seminar held Feb- Services in Developing Countries: A Case Studyruary-May 1990, at Michigan State University, of the Use of Contingent Valuation Surveys inEast Lansing, MI, Special Report 29, September Southern Haiti", Economic Development and1991. Cultural Change, Vol. 38, No. 2, January 1990.
Walsh, R. G., J.B. Loomis, and R.A. Gillman, "Valu- Whittington, D. et al., "Calculating the Value of Timeing Option, Existence and Bequest Demands for Spent Collecting Water:Some Estimates forWilderness", Land Economics, Vol. 60, No. 1, Ukunda, Kenya", World Development, Vol. 18,February 1984. No. 2, 1990.
Wang, G., W. Wu and F. Li, "Economic Evaluation Whittington, D., A. Okorafor, A. Okore, and A.of Land Levelling in Weibei Dry Upland, McPhail, "Strategy for Cost Recovery in theShaanxi, China", in J.A. Dixon, D.E. James and Rural Water Sector: A Case Study of NsukkaP.B. Sherman (eds.), 1990, op. cit. District, Anambra State, Nigeria." Draft. Infra-
Wang, G. and L. Han, "Economic Evaluation of structure and Urban Development Depnrtment,Dryland Peanut Growing with Perforated Plas- The World Bank, Washington, D.C., 1989.tic Mulch", in J.A. Dixon, D.E. James and P.B. Willis, K.G. and G.D. Garrod, "An IndividualSherman (eds.), 1990, op. cit. Travel-Cost Method of Evaluating Forest Rec-
Warford, J. and A. Schwab, "Issues in Adjustment reation", Journal of Agricultural Economics,Lending Policies", Environment Policy and Re- Vol. 42, No. 1, pp. 33-42, January 1991 .search Division, WorldBank, WashingtonD.C., World Commission on Environment and Develop-draft, 1992. ment, Our Common Future, Oxford University
Whittington, D., D.T. Lauria, A.M. Wright, K. Choe, Press, Oxford, 1987.J.A. Hughes, and V. Swarna, Household De- World Bank, World Deveopment Report 1992: De-mandfor Improved Sanitation Services: A Case velopment and the Environment, Oxford Uni-Study of Kumasi, Ghana, UNDP-World Bank versity Press, 1992.Water and Sanitation Program, Report No. 3, World Bank, Adjustment Lending: An Evaluation ofWashington, D.C., May 1992. Ten Years of Experience, Policy and Research
Whittington, D., V. K. Smith, A. Okorafor, A. Okore, Series No. 1, Washington D.C., 1989.J. Leng Liu, and A. McPhail, "Giving Respon- World Bank, "Brazil: An Analysis of Environmentaldents Time to Think in Contingent Valuation Problems in the Amazon", Report No. 9104 -Studies:A Developing C'ountry Application", DR, Vol. 2, Annex 5, Washington D.C., 1992.Journal of Environmental Economics and Man- Yagci, F. et al, Structural Adjustment Lending -Anagement, vol. 22, pp. 205-225, 1992. Evaluation of Program Design, Staff Working
Whittington, D., J. Briscoe,, X. Mu, and W. Barron, Paper No. 735, the World Bank, Washington"Estimating the Willingness to Pay for Water D.C., 1985.

ANNEX 1. USING SHADOW PRICES
The estimation and use of shadow prices is facilitated other domestic or foreign users, the border-pricedby dividing economic resources into tradeable and marginal social benefit (MSB) of this foregone do-nontradeable items. Tradeables and nontradeables mestic consumption or of reduced export eamings,are treated differently. The values of directly im- would be a more appropriate measure of social costs.ported or exported goods and services are already The socially optimal level of total consumptionknown in border prices, that is, their foreign ex- for the given input (Qopt) would lie at the point wherechange costs converted at the official exchange rate. the curves of MSC and MSB intersect. Price andLocally purchased items whose values are known nonprice distortions lead to nonoptimal levels ofonly in terms of domestic market prices, however, consumption Q • Qopt characterized by differencesmust be converted to border prices by multiplying between MSB and MSC. More generally, a weightedthe former prices by appropriate conversion factors average of MSC and MSB should be used if both(CFs). effects are present. The MSB would tend to dominate
Border (Shadow) Price = Conversion Factor x in a short-run, supply constrained situation; the MSCDomestic (Market) Price would be more important in the longer run, when
expansion of output is possible.The MSC of nontradeable goods and services
BP = CF x DP from many sectois can be determined through appro-priate decomposition. For example, suppose onepeso-worth of the output of the construction sector
For those tradeables with infinite elasticities- (valued in domestic prices) is broken down succes-of world supply for imports, and of world demand sively into components. This would include capital,for exports-the cost, insurance, and freight (C.I.F.) labor, materials, and so on, which are valued at pesosborder price for imports and the free-on-board Cl, C2,... Cn in border prices. Since the conversion(F.O.B.) border price for exports may be used (with factor of any good is defined as the ratio of the bordera suitable adjustment for the marketing margin). If price to the domestic price, the construction conver-the relevant elasticities are finite, then the change in sion factor equals:import costs or export revenues, as well as any shiftsin other domestic consumption or production levels nor in income transfers, should be considered. The CCF = , Cfree trade assumption is not required to justify the use =of border prices since domestic price distortions areadjusted by netting out all taxes, duties, and subsi- The standard conversion factor (SCF) may bedies. used with nontradeables that are not important
A nontradeable is conventionally defined as a enough to merit individual attention or that lackcommodity whose domestic supply price lies be- sufficient data. The SCF is equal to the official ex-tween the F.OB. export price and CI.F. inport price. change rate (OER) divided by the more familiarItems that are not traded at the margin because of shadow exchange rate (SER), appropriately defined.prohibitive trade barriers, such as bans or rigid quo- Using the SCF to convert domestic priced values intotas, are also included within this category. If the border price equivalents is conceptually the inverseincreased demand for a given nontradeable good or of the traditional practice of multiplying foreign cur-service is met by the expansion of domestic supply rency costs by the SER (instead of the OER) toor imports, the associated border-priced marginal convert foreign exchange to the domestic pricesocial cost (MSC) of this increased supply is the equivalent. The standard conversion factor may berelevant resource cost. If the incremental demand for approximated by the ratio of the official exchangethe nontradeable results in decreased consumption of
72 Annex 1: Using Shaaow Prices
rate to the free trade exchange rate (FTIER), when the where (m) and (u) are the foregone marginal outputcountry is moving toward a freer trade regime: and overhead costs of labor in domestic prices, and
a and c are corresponding conversion factors to con-
OER eX + nM vert these values into border prices.SCF = ER If we are interested only in efficiency pricing,
FTER eX (1 - t) + nM (1 + tin) then we may stop here. However, if social pricing is
important, consider the effect of these changes onwhere X = F.O.B. value of exports, M = C.I.F. value consumption patterns. Suppose a worker receives aof imports, e = elasticity of domestic supply of ex- wage Wn in a new job and that the income foregoneports, n = elasticity of domestic demand for imports, is WO, both in domestic prices. Note that W'n may nottx = average tax rate on exports (negative for sub- necessarily be equal to the marginal product fore-sidy), and tm = average tax rate on imports. gone En It could be assumed, quite plausibly, that
Illustrative of important tradeable inputs used in low-income workers consume the entire increase inmany development projects are capital goods and income (Wn - Wo). Then this increase in consump-petroleum-based fuels. Soime countries may have tion will result in a resource cost to the economy ofother fuels available, such as natural gas or coal b(Wn - Wo). The increased consumption also pro-deposits. If no clear-cut export market exists for these vides a benefit given by w(Wn - Wo), where (w)indigenous energy resouroes, then they cannot be represents the MSB, in border prices, of increasingtreated like tradeables. If there is no altemative use domestic-priced private sector consumption by onefor such fuels, an appropriate economic value is the unit. Therefore,MSC of the production or extraction of gas or coalplus a markup for the discounted value of futureconsumption foregone (or "user cost"). If another SWR = a.m + c.u + (b - w)(Wn - WO)high value use exists for these fuels, the opportunitycosts of not using the resources in altemative usesshould be considered as their economic value. The symbol b represents the MSC to the econ-
Two important nontradeable primary factor in- omy, resulting from the use of the increased income.puts are labor and land, the next subjects for discus- For example, if all the new income is consumed, thension. The foregone output of workers used in the b is the relevant consumption conversion factor orenergy sector is the dominant component of the resource cost (in units of the numeraire) of makingshadow wage rate (SWR). Consider a typical case of available to consumers one unit worth (in domesticunskilled labor in a labor surplus country-for ex- prices) of the marginal basket of (n) goods that theyample, rural workers employed for dam construc- would purchase. In this casetion. Complications arise in estimating theopportunity cost of labor, because the original rural nincome earned may not reflect the marginal product b = Igi.CF 1of agricultural labor. Furthermore, for every new jobcreated, more than one rural worker may give upformer employment. Allowance must also be made where gi is the proportion or share of the i'th good infor seasonal activities such as harvesting, and over- the marginal consumption basket and CaF is thehead costs like transport expenses. Based on the corresponding conversion factor.foregoing, the efficiency shadow wage rate (ESWR) The corresponding MSB of increased consump-is given by: tion may be decomposed further; w = dlv, where U/v
is the value (in units of the numeraire) of a one-unitincrease in domestic-priced consumption aoruiing to
ESWR = a.m + c.u someone at the average level of consumption (ca).Therefore, v may be roughly thought of as the pre-mium attached to public savings, compared to "av-erage" private consumption. Under certain

Annex 1: Using Shadow Prices 73
simplifying assumptions, b = I/v. If MU(c) denotes assets (see main text). Examples might be the flood-the marginal utility of consumption at some level c, ing of virgin jungle because of a hydroelectric damthen d = MU(c)/MU(ca). Assumng that the marginal that would involve the loss of valuable timber, orutility of consumption is diminishing, d would be spoilage of a recreational area that has commercialgreater than unity for "poor" consumers with c < ca, potential.and vice versa. The shadow price of capital is usually reflected
A simple form of marginal utility function could in the discount rate or accounting rate of interestbe MU(c) = c-n. (ARI), which is defined as the rate of decline in the
value of the numeraire over time. Although there hasbeen much discussion concerning the choice of an
Thus, d = MU(c)/MU(ca) = (ca/c)n . appropriate discount rate, in practice the opportunitycost of capital (OCC) may be used as a proxy for theARL in the pure efficiency price regime. The OCC
Making the further assumption that the distribu- is defined as the expected value of the annual streamtion parameter n = 1, gives d = ca/c = ia/i where isfi of consumption, in border prices net of replacement,is the ratio of net incomes, which may be used as a which is yielded by the investment of one unit ofproxy for the corresponding consumption ratio. public income at the margin.
The consumption term (b-w) in the expression A simple formula for the social-priced ARI,for SWR disappears if, at the margin, a) society is which also includes consumption effects, is given byindifferent as to the distribution of income (or con-sumption), so that everyone's consumption hasequivalent value (d=1); and b) private consumption ARI = OCC [s + (1 - s)w/b]is considered to be as socially valuable as the uncom-mitted public savings (b=lhv).
The appropriate shadow value placed on land where (s) is the fraction of the yield from the originaldepends on its location. Usually, the market price of investment that will be saved and reinvested.urban land is a useful indicator of its economic value Usually, the rigorous estimation of shadowin domestic prices, and the application of an appro- prices is a long and complex task. Therefore, thepriate conversion factor (such as the SCF) to this analyst is best advised to use whatever shadow pricesdomestic price, will yield the border-priced cost of have already been calculated. Alternatively, the ana-urban land inputs. Rural land that can be used in lyst would estimate a few important items such as theagriculture may be valued at its opportunity costs- standard conversion factor, opportunity cost of capi-the net benefit of foregone agricultural output. The tal, and shadow wage rate. When the data is notmarginal social cost of both urban and rural land precise enough, sensitivity studies may bemadeovershould reflect the value of associated environmental a range of values of such key national parameters.

ANNEX 2: SUMMARIES OF ENVIRONMENTALVALUATION CASE STUDIES1
Effect on Production Method valid for one year only. In the economic analysis, soilconservation measures are considered as the calcu-
Cost-Benefit Analysis of Land Improvement lation covers a five year period.in Lesotho2 Crop sampling was carried out in cooperation
with the FISC staff during five seasons, 1986-1990.The Farm Improvement with Soil Conservation The results show that farmers using a "high-input"(FISC) project was initiated in 1985 in Mohale's management do receive higher yields on average, butHoek district in southern Lesotho, and is gradually that very substantial variations of yields make this abeing expanded. The project is now used as a model risky investment.for a national training program in soil conservation. Financial calculations for maize and sorghumOther soil conservation projects are already using show that the yield must increase by 125 percent andFISC as a model. The choice of the FISC project for 144 percent, respectively, in order to achieve a realstudy is further justified by its modem approach in rate of return of 10 percent. These target increasesdealing with land degradation: production orienta- in yield are significantly higher than the averagetion, labor-intensive techniques, and popular partici- values achieved in the areas under high-input man-pation. Furthermore, information for research could agement. The two options actually yield negativebe obtained at low cost. The project area is fairly real marginal IRRs of 21 and 30 percent:, respec-typical for lowland Lesotho where most of the crop tively.production takes place. Wilh some adjustments the Maintained participation in the project appearscalculations could be used for other areas in Lesotho limited after the initial boost when consenration ef-or even for other areas with similar geographic and forts result in in-kind payments. Most likely, projectsocio-economic features in other countries. sales are merely replacing alternative, less accessible
The overriding aim of the FISC project is to sources of supply. There are no convincing signs ofraise agricultural productioni. It has rehabilitated old a major transformation of the crop management re-terrace structures, constructed new ones and added gime. The long-ternn impact of physical conservationother structures for conservation; promoted hybrid works may be thne only net impact as far as the majormaize, hybrid sorghum, and fodder grasses; and grain crops are concerned. Financial budgets for fruitplanted thousands of tree seedlings. It has also pro- and fuelwood trees show more promising retums, how-moted rotational grazing on communal rangeland. ever, and have also met with greater interest amongThe project area covers almost 26,000 hectares and local people.reaches about 22,000 people. Possible explanations for the lack of farmer
response to the promotion of high-inputrmanagementFinacial Analysis are discussed, including, among other things, land
tenure, credit for agricultural investments, and riskThe financial analysis was done from a household pertaining to agricultural investments. Most seriousperspective, using market prices. Two management is the problem of risk. Crop yields are very unreliableoptions for cultivation of maize and sorghum have in Lesotho. The fanners are quite aware of this andbeen compared in financial terms. The "high-input" will (informally) calculate the chances of losing in-alternative implies the use of commercial fertilizer vested resources. Demands for yield increases forand hybrid seed. The "traditional" alternative implies maize and sorghum have been shown to be consid-no use of fertilizer and locally saved seeds instead of erable in order to reach an acceptable level of finan-hybrids. The less immediate impact of soil conserva- cial return (10 percent real rate). It is certainly nottion measures is left out of this calculation, which is
Anne-x 2: Summaries of Environmental Evaluation 75Case Studies
irrational of the farmer to adopt a careful approach * Livestock products by promoting im-in the face of these risks. proved grazing management.
Additional benefit items to consider are:Econoniic Analysis * Training of personnel, and the introduction
of improved communal management, withThe economic analysis considers the perspective of potential extra-project impactsthe Lesotho Government and the donor agency, the * Off-site physical impacts, such as less sil-Swedish International Development Authority tation of dams, less maintenance costs for(SIDA). Overall project performance has been re- roads and bridges, improved water qual-corded for the period March 1985 to December 1990. ity, etcCurrent, firm plans for work until mid 1992 have * Secondary benefits for the community atbeen incorporated, and extrapolations have been large as a result of the increase in incomemade from past performance in relation to the avail- from agriculture.ability of future financial means. Quantifcation of costs and benefits. Not all
The analysis distinguishes between productiv- costs are readily available in monetary terms. Exam-ity impacts due to increaseduse of commercial inputs ples are the temporary loss of soil from new, un-and to improved soil conservation. The distribution, grassed terraces, "loss" of land to terraces and othersale, and use of commercial fertilizer and hybrid seed structures, and increased maintenance for roads duein the project areas has been monitored. In the short to greater use. Labor cost for soil conservation is notterm, distribution of these inputs has increased some- included since it was reported to be negligible. Thiswhat as they are used as in-kind payments for con- view is, however, controversial. Monetary cost dataservation work on individually controlled land. were taken from project accounts and complementedConvincing signs are lacking, however, for a lasting by the executing company's data for costs paid by theimpact in terms of commercial sales or their use. donor agency directly to the company.Farmers are known to save project distributed inputs The crop benefits due to hybrid seeds and fertil-for several years, and the level of use in the project izer use is assumed to be negligible. Only smallareas is not significantly different from use in non- quantities of the inputs have been distributed throughproject areas. Therefore, the project cannot be cred- the project and the financial analysis showed theirited with a rise in productivity due to increased use use to be questionable. For those that wanted theof inputs. inputs they were available through other channels.
Identification of costs and benefts. Financial To determine the benefits from soil conserva-costs are identified through project and donor ac- tion a number of factors need to be considered. Firstcounts. There are also costs of soil conservation is the issue of whether soil loss actually affects cropworks. These are borne by the farmers and have to production at all in this particular area. Second, if itbe estimated separately. Financial costs have to be does, to what extent soil loss occurs, and third, howadjusted in several ways to arrive at real economic this rate affects productivity.costs, however. Potential benefits of the project in- There is reason to believe that soil loss immedi-clude increasing production of ately affects the average crop production area since
* Maize, sorghum, and crop residues due to the average topsoil depth is estimated to be 25 centi-the use of fertilizer, hybrid seed and con- meters, a level at which the water retention capacityservation of soil and nutrients is reduced. Research in the area indicates that the
* Fruits (peaches and apples) annual soil loss is roughly 15 tons per hectare (t/ha)* Fuelwood from pine and other tree on poorly managed soils and 5 tlha for the areas
species under project-influenced conservation management.* Fodder grasses such as Eragrostis and Through comparisons with other studies on loss of
Bana grass productivity due to soil loss, a 1 percent annual* Vegetables from communal gardens spon- decline in yield on nonconserved land was assumed.
sored by the project The impact of soil conservation on crop produc-tion can be expressed as

76 Annex 2: Summaries of Environmental EvaluationCase Studies
IQit = dYit x AYi x LACt x PI x CSi financial wage. The project payment of M 3.5 perday for unskilled labor is shadow priced at M 2.5which is the generally accepted local wage for daily
where IQ = incremental production (kg); laborers.dY = relative crop decline avoided due to conserva- Local financial prices were used for the crops.tion; Based on a comparison of the protein and energyAY= the base level of average (14-year) yieldfor the content of maize residues as compared to five sub-district in kilograms per hectare; stitutes, the approximate price of M 60 per ton ofLAC = accumulated area under conservation man- maize crop residues was derived. The same figureagement (hectare); will be applied to sorghum residues.PI = project impact: the share of AH affected by the The value of fuelwood is based on ihe valuesproject's actions (percent); and calorific content of its substitutes, displayed inCS = the share of maize an(d sorghum respectively of Table A2. 1.the cultivated land (percent); The actual substitution value will vary depend-t = time index (year 1 ... T); and ing on the household's situation. A rough, weightedi = crop index. average could be calculated as follows:
(a) 5 percent will substitute dungr (0.25 *The assumption here is that PI (project impact) M 100.61)
equals 1, as conservation activities are assumed to be (b) 5 percent will substitute brushwood (0.75 *nil in the absence of the project. 3 M 24.33)
Up to 1992, more than 18,000 seedlings of apple Weighted average: M 43.40and peach trees were to be delivered to farmers in the As for the period after 1992, a number of as-project area. The survival rate was estimated to be 50 sumptions have been made. The level of costs ispercent. The number of remaining fuelwood trees by assurmed to remain at the average for 1985-1992, but1992 is estimated atroughly 1]30,000. Thefodderbene- with all costs associated with expatriate (nondomes-fits are rather small due to the small areas planted and tic) services, such as consultant fees, back-stoppingthe opportunity cost of the land used by the executing company, external evaluation mis-
Road and bridge maintenance in the area will sions, etc., taken out. This implies a level of 54not be significantly affected by the improved land percent of the previous average.management and soil retention, and no major dams As for benefits, it is assumed that the projectfor hydropower or irrigation in the project areas will continues to add newly conserved crop land at abe affected. performance rate of 50 percent of the previous level.
Valuation in economic prices. The Loti (pl. However, from the accumulated area under conser-Maloti) is fixed on a par with the internationally vation management reached the previous year, aconvertible South African Rand. There is no black decline rate of 2 percent per year is applied. Anothermarket for Rands or Maloti.. This indicates that the assumption is that there will be no lasting imapact ondistorting impact of foreign exchange restrictions isnot significant. The official exchange rates havetherefore been used, based on International Mone- Table A2.1 Economic Value of Fuelwoodtary Fund data. In 1990 the exchange rate was set to Substitutes per Cubic Meterroughly 3 Maloti per US$.
Since there is a transfer of income to Lesotho of M/kg Mabout 20 percent of the import value, inclusive of MJ/kg Eq. kg (1987) (1990)duties, the value of importeid components is multi-plied by a factor of 0.8 when going from financial to Brushwood 16.0 550 .03 24.33economiic prices.Dug19 68 0 001
Skilled and semi-skilled labor has access to the Dung 12.9 682 .10 100.61large South African labor market and is priced at the Crop residues 14.0 629 .02 18.54

Annex 2: Summaries of Environmental Evaluation 77Case Studies
the level of use of fertilizer and hybrid seed. Further- Table A2.2 Discounted Share of Total Benefitmore, it is assumed that distribution of fruit treescontinues, but declines to a level of 50 percent of Benefit Sharesproject maximum. For fuelwood it is assumed that Item 1 percent 10 percenttree planting declines to a level of 50 percent ofproject average achievement in 1986-1991. For fod- Sorghm 30 25der grasses, the assumption in the base case wil be Maize 28 23that fodder growing stabilizes at 50 percent of the Fruit 29 38level achieved in 1986-1991. Fuelwood 11 12
Results and Sensitivity Analyses Fodder 1 2Total 100 100
Given these assumptions, the results of the base caseare an NPV of minus M 7.0 million at a discount rateof 10 percent and minus M 5.6 million at 1 percent.The internal rate of return is minus 0.8 percent. reflecting the higher marginal utilities of the recipi-
The qualitative interpretation is that the project ents as a group as opposed to the donors as a group.makes a loss that is significant in comparison to the This weight, however, should then be consistentlyresources invested. The present value of costs is only applied to alternative projects.M 9.9 million at 10 percent and M 33.6 million at 1percent. In terms of the overriding target for the Discussionproject as defined by the donor-to raise agriculturalproduction among smallholder farming house- In the quantification of costs, the labor requirementholds-the project cannot be shown to be successful for maintenance of conservation structures was omit-when the benefits are related to the costs. The table ted. However, if a higher cost estimate is accepted,below summarizes the benefit categories, which pro- the size of conservation benefits change drastically.vide some overview of the relative importance of It can be shown that the break-even point for maizevarious benefit items. Each benefit category has been is 15 person-days, given a time horizon of 50 yearsdiscounted by 1 and 10 percent respectively. and a discount rate of 10 percent. Given a discount
Table A2.2 shows that fruit is a significant bene- rate of 1 percent, the maximum labor input is raisedfit item that deserves more thorough monitoring in to 34 days, before the net present value of conserva-the future. This, and conservation benefits, make up tion benefits approximates zero. Thus, it is possiblethe bulk of benefits, and deserve closer scrutiny in that this benefit item has been considerably overesti-terms of sensitivity testing. mated. Only empirical measurement in project areas
The robustness of this base case result is tested could resolve this issue.using sensitivity analysis of alternative assumptions An additional point is option value. Lesotho iswith regard to: discount rate, post-1992 project per- extremely dependent upon migrant labor remit-formance, fruit income, erosion impact on crop tances. Ahigh price scenario is designed to build intoyields, future grain prices, and distributional the calculation the possibility of a substantial in-weights. crease in relative prices as a proxy for the somewhat
The qualitative impression of the sensitivity unlikely, but not impossible, event that a mass ofanalysis is that, if the rate of 10 percent is used, the migrant workers are forced to return to Lesotho.base case result remains robust, although the size of While the nominal price level in fact may not bethe deficit is changed. If the lower rate of 1 percent changed considerably due to the extent of the market,is considered acceptable as a standard, however, the the real price would increase for Basotho farmers asbase case result could be qualitatively altered by incomes would fall. The value of the project is thusseveral factors, mnaldng the project perform better correlated to the size of the GNP of Lesotho. Fromthan expected. With the lower rate, the project could both a macro and a micro perspective, the soilalso be justified using a heavy distributional weight conservation program is an insurance against hard

78 Annex 2: Summaries of Environmental EvaluationCcase Studies
times.Thisleavesthedecisionmakerswithapartially This has given a strong incentive for destructivequantified problem: is the present value of the op- logging and widespread forest clearing.tions higher than the negative NPV of the stream of This valuation was based on a systematic bo-costs and benefits that have been valued? tanical inventory of 1 hectare of Peruvian rainforest
However, soil consenration is not the only pos- along the Rio Nanay near the small village ofsible insurance against declines in migrant labor Mishana, 30 kilometers southwest of the city ofincomes. Lesotho needs food security, not necessar- Iquitos. Annual precipitation in the region averagesily more domestic production of grain. Establishing 3,700 millimeters; soils are predominantly infertilean economic capacity to buy grain on the world white sands. The inhabitants of Mishana are indige-market through other development projects nmay be nous people who make their living practicing shiftinga more efficient alternative.. Lesotho has a compara- cultivation, fishing, and collecting a wide variety oftive advantage in inexpensive labor, not in good forest products to sell in the Iquitos market.agricultural land and a beneficial climate. Screen-ing available development project options for their Method and Dataprofitability is therefore a useful exercise. Further-more, the capacity to ensure food security is de- The inventory showed 50 families, 275 species andpendent on the size of the population, a neglected 842 trees of at least 10.0 centimeters in diameter. Ofmatter which needs urgenit attention in Lesotho. the total number of trees on the site, 72 species (26.2
While nonagricultural investments may be percent) and 350 individuals (41.6 percent) yieldmore efficient from a macroeconomic point of view, products with an actual market value in Iquitos.the majority of the population, and the poorest part, Annual production rates for fruit trees and palmslive in the rural areas. If the primary value of a project were either measured from sub-samples or estimatedlike FISC is not so much to raise production imme- from interviews with collectors. Latex yields werediately but rather to protect to a significant degree the taken from the literature. The merchantable volumeland base in the long term, more substantial subsidi- of each timber tree was calculated using publishedzation of cover crops such as fodder grasses at the regression equations relating diameter to commer-expense of traditional cropping could be justified. cial height.Even if fodder could not be commercially sold, the Average retail prices for forest fruits were col-grower would provide an insurance service while lected in monthly market surveys. The officiallyprotecting the land for future potential uses. The controlled rubber prices were used. Four inde-economic viability of this option needs to be worked pendent sawmill operators were interviewed to de-out. termine the mill price of each timber species. The
This study cannot conclusively provide an an- labor investment associated with fruit collection andswer to the future value of the FISC approach, but latex tapping was estimated in person days per yearhas given some reasons why massive, full-scale rep- based on interviews and direct observation of locallication involving a substantial number of expatriate collecting techniques. The harvest cost was based onpersonnel should be avoided. Continued efforts the minimum wage rate, US$2.50 per day.5 ]3ased onshould be subject to close moritoring of their efficiency earlier studies the transport cost for fruit and latexin order to justify any further funding. The original was estimated at 30 percent of total market valuereport also contains a discussion of the income distribu- while extraction cost for timber was set at 40 percenttional impacts of theproject, which is not analyzedhere of total value.due to lack of space and direct relevance to the topic ofenvironmental valuation. Results
Valuation of an Amazonian Rainforest The market value of the fruit production in the sam-ple area was almost US$650 per year. Annual rubber
Most financial appraisals of tropical forests have yields amount to about US$50. Deducting collectionfocused exclusively on timber resources and have and transportation costs gives net annual revenues fromignored the market benefits of non-wood products. fruits and latex of US$400 and US$22, res$ectively.

Annex 2: Summaries of Environmental Evaluation 79Case Studies
The net present value (NPV) of this production, at 5 market benefits if the appropriate resources are ex-percent discount rate and assuming that 25 percent ploited and properly managed.of the frut crop is left in the forest for regeneration,is estimated at US$6,330. Effect on Health Method
The hectare of forest also contains 93.8 cubicmeters of merchantable timber. If liquidated in one Economic Analysis of a Water Supply and Healthfelling, this sawtimber would generate a net revenue Program in Zimbabwe6
of US$1,000 on delivery to the sawmill. A loggingoperation of this intensity, however, would damage The purpose of the paper is to evaluate the Manica-much of the residual stand and greatly reduce, if not land Health, Water and Sanitation program in Zim-eliminate, future revenues from fruit and latex trees. babwe utilizing social cost-benefit analysis. DataThe net financial gains from timber extraction would was gathered on cost-benefit analysis, water andbe reduced to zero if as few as 18 trees were damaged sanitation projects, and health statistics in Zim-by logging. babwe. Because the health statistics do not fully
Periodic selective cutting would yield a maxi- reflect the mortality and morbidity rates, benefits ofmum of about 30 cubic meters per hectare every 20 the proposed water and sanitation program will beyears. With a weighted average price of US$17.21 underestimated.per cubic meter and deducting harvest and transport Only communal lands in rural Manicaland arecosts, the net revenue is about US$310 at each cutting studied. No consideration is given to resettlementcycle. The net present value would be US$490. areas or commercial farm areas. The study considers
The combined NPV of fruit, latex and selective only two major benefits-health improvements andcutting would be about US$6,820, with logging con- change in consumer surplus for water.tributing about 7 percent of the total. Timber man-agement appears to be a marginal financial option Backgroundin this forest, especially considering the possibleimpact of logging on fruit and latex trees. The Manicaland Province, organized in 7 districts, is
situated in the east of Zimbabwe. It is characterizedCompaisons by a relatively high altitude and a diverse relief,
implying varying patterns of rainfall, temperature,T-he NPV of this piece of rainforest compares well soils, and natural farmiing regions, and has the high-with other uses of rainforests. Using the same dis- est rainfall in the country. The province is agricultur-count rate, 5 percent, the NPV of the timber and ally rich and produces forestry, fruit, maize,pulpwood obtained from a I hectare plantation of groundnuts, sunflowers, tea, coffee, cotton, dairy,Gmelina arborea in Brazilian Amazonia is estimated and beef products. Approximately 90% of the pro-at US$3,184, or less than half that of the forest. vincial population of 1.2734 million (1987) lives inSimilarly, gross revenues from fully stocked cattle rural areas and 66% lives in communal lands. Overpastures in Brazil are reported to be US$148 per 50% of the population is under 15 years of age. Overhectare per year. This gives a present value of 65% of the economically active population in Mani-US$2,960. Deducting the costs of weeding, fencing, caland is working in agriculture, either as subsistenceand animal care would lower this figure significantly. farmers or as permnanent or seasonal laborers onBoth these estimates are based on the optimistic commnercial farms.assumption that plantationforestry and grazing lands The objective of the program, within theare sustainable land-use practices in the tropics. framework of Swedish and Norwegian support to
Tropical forests perform vital ecological serv- Zimbabwe's health sector, is to improve livingices, they are the repository for an incredible diver- conditions in the communal areas of Manicalandsity of germplasm, and their scientific value is through:immeasurable. The results from this study indicate * Improving existing and constructingthat tropical forests can also generate substantial new water supplies that ensure an ac-
ceptable quantity and quality of water

80 Annex 2: Summaries of Environmental EvaluationCase Studies
for domestic use and that are reliable and shadow wage meets the market wage. The opportu-accessibleforthe community; nity cost of children's time is set at zero.
* Improving sanitation conditions by con- Social rate of discount. Using Helmer's ap-structing latrines; proach (taking the rate of return in the private sector),
* Giving health education to improve hygi- one would derive a real social discount rate of 4.86%.enic practices and instigate behavioral If the World Bank discount rate of 10% were used,changes. adjusted for foreign exchange rate changes, the real
discount rate would be 7.24%. There is no officialShadow Pflces Used discount rate for government projects in Zimnbabwe,
so the authors conducted a sensitivity analysis withDomestic prices were used as a numeraire. That is, the social discount rate ranging from 2% to 4%.local currency is expressed in Zimbabwean dollars Time horizon. Atime horizon of 40 years is used(Z$) and foreign currency is expressed in $US. in the analysis, given that benefits are expected to
Foreign exchange rate. Harberger's formula is remain as a result of reinvestment.utilized to calculate the shadow price of foreignexchange. Since Zimbabwe ist a pricetaker, the sup- Calculation of Costsply and demand elasticities of foreign exchange canbe replaced by the import demrand and export supply The materials supplied by the project are valuedelasticities. Assuming that the export supply elastic- at market prices. Community input, except for theity is set to zero, and that no quantitative restrictions constructor's payment in case of latrines, is valued atexist, the Harberger 's formula reduces to the opportunity cost of labor. Since the shadow wage
of unskilled labor has been set at zero during the dryP = n M (1 + T)R = (1 + T) R season (when construction takes place), the costs of
n M community input except for the constructor "s pay-ments are zero. The constructor is paid the s,hadow
where R' = the shadow price of foreign exchange and price of skilled labor: $Z50 for a double latrine, andR the official exchange rate; M = c.i.f. value of $Z250 for a multi-compartment latrine.imports in terms of foreign currency; T = importduties; and n = elasticity of demand for foreign Calculation of Benefitsexchange.
Given the assumption that the export supply Change in consumer surplus. The price ofelasticity equals zero, the H'arberger's formula now water is calculated by mean kCals of energy used inapproaches the standard UNIDO guidelines ap- walking to and carrying water, the energy cost perproach. Using 1987 data, the authors determine that $Z1, andthe time cost with shadow wages set alL 50%,one extra unit of foreign exchange can buy goods 75%, and 100%. The change in consumer surplus perworth 1.1799 units on the domestic market. Because year is equal toof the existence of capital restrictions in the form ofquotas in Zimbabwe, import duties are increased [ (q2 -ql) 1substantially so thatthe demand for foreignexchange 180 q(Pw -(PW2) + 2 (PWI -Pv2)equals the supply. Therefore a shadow price of for-eign exchange of 1.75 is used. (q2 - ql)
Shadow price of labor. In the dry season, there + 185 q, (Pdl - Pd2) + 2 (Pdl - PcOis underemployment in the agricultural sector, so theshadow wage for labor is set at zero. Given thatuncertainty exists in the peak harvest season, when where:there is a shortage of labor, the authors conduct a q1 = quantity carried home in 1 day, before the project;sensitivity analysis, where the shadow wage is set at q2 = quantity carried home in 1 day, after the project;100%, 75%, and 50% of the market wage of Z$0.46 Pwi = price/i in the wet season, before the project;per hour. For skilled laborers, it is assumed that the Pw2 = price/i in the wet season, after the project;
Annex 2: Summaries of Environmental Evaluation 81Case Studies
Pdl =price/I inthedryseason,beforetheproject;pd2 Vc = -64.71/(1 + i)t + (1307.21 - 795.13)/(1 + i)t= price/I in the dry season, after the project.
The change in consumer surplus per person,when full coverage is reached, is shown below. The corresponding net present value of output gained
by society, for each adult saved, is:
Shadow wage
50 percent 75 percent 100 percent VA = (275.00 - 129.41)/(1 + i)t;
0.99 1.18 1.37
with i = social rate of discount.Health improvements. Cost of illness estimates In Table A2.4 the values for different discount
consist of treatment costs, costs of lost production, rates are shown as lower bound estimates.and costs for extra transportation. The authors point In the base case, with an estimated social dis-out that as willingness to pay is not taken into ac- count rate of 4.86%, shadow wage at 100% of thecount, the values arrived at may severely underesti- market wage, and a 100% health improvement, themate true values. internal rate of return was greater than the social
For treatment costs, the costs of private treat- discount rate and the net present value of the projectment are used as the opportunity cost. A consultation was strongly positive. At a social discount rate ofwith a physician costs $Z10.80 and the cost of nurs- 7.24%, estimated in the alternative approach, theing is $Z3.00 per hour. The transportation cost used project is not found profitable even if a shadowis $Z 0.50 per single joumey for all inpatients. The wage of 100% and 100% disease reduction islower bound of the total value per year of reduced achieved.morbidity when full reduction is reached, is shown While most of the benefits come from diseasein Table A2.3. reduction, it must be pointed out that benefits are
The value of a life saved would be very high to probably underestimated because the value of athe individual concerned or his/her family. The saved life has been understated-through the use ofauthors attempt to establish a minimum value by a lower bound. Secondly, the paper does not take intoadopting society's viewpoint to determine the net account other benefits such as local industry thatoutput gained by saving a life. They use the human would benefit from improved water supply. Third, ascapital approach-based on the stream of average income distribution will probably improve as a resultincome minus average consumption, discounted of the project, benefits could have been given aback to the time of avoided death. greater weight on social equity grounds. Therefore
The average household income in communallands is $Z550. If the household consists of 2 adultsand 4.5 children on average, the income received by Table A2.3 Total value in $Z of health improve-each adult is $Z275. The authors estimate that each ments per year after the year 2005 at a socialchild consumes $Z64.71 per year, and that each adult discount rate of 4.86% for different values ofliving on conumunal lands consumes $Z129.41. disease reductions and shadow wage
Assuming an urban migration rate of 20%, andan unemployment rate of 20%, the authors use the Shadow Disease reduction'weighted average of the wage adjusted for unem- wageployment and the income in communal lands as an (percent) 40% 70% 100%estimate of the child's future production: $Z1307.21.Future consumption is estimated as final household 50 2,501,936 4,378,388 6,254,839expenditure per capita, $Z795.13.
The net present value of output gained by pre- 75 2,505,760 4,385,081 6,264,401venting a child's death, taking into consideration 100 2,509,585 4,391,774 6,273,962only production and consumption aspects, is:

82 Annex 2: Summaries of Environmental EvaluationCase Studies
the authors conclude that the project is likely to be a Populations, densities, and illiteracy rates for eachsuccess from a societal point of view. cant6n were taken from a 1986 census. Distances
were measured along the most likely roads betweenTravel Cost and Contingent Valuation the major population center of each cant6n andMethods MCFR. The travel cost was estimated at US$0.15 per
kilometer. This includes out-of-pocket costs, a frac-The Consumer Surplus From Visits tion of fixed costs, and the value of travel time.to a Costa Rican Rainforest 7 The demand function for visits (VISYIATION
RATE) was assumed to be linear and to depend onThis study measures the value of domestic eco-tour- the travel cost (DISTANCE), the population densityism to the privately owned Monteverde Cloud Forest (DENSITY) and the illiteracy rate (ILLITERACY).Biological Reserve (MCFR). The MCFR straddlesthe continental divide in Costa Rica and consists of10,000 hectares of rugged terrain, the vast majority (I) VISITATION RATE = ao + a1DISTANCE +of which is virgin rainforest. Tourism to the reserve a2DENSITY + a3 ILLITERACY + ehas increased markedly over the 18 years of itsexistence, both in terms of domestic and foreignvisitation rates, despite the relatively remote locality where 'e' is an error tenn assumed to be independentand difficulty of accessing the site. and normally distributed. The model was eslimated
using multiple regressions. The se3mi-log functionalData, Method and Results form could not be used on this data because the
visitation rate from many cant6ns was zero. TwoIn 1988, 755 out of approximately 3,000 domestic specifications were estimated; with and without illit-visitors left their addresses at the reserve for the eracy rates. The results are presented in Table A2.5.opportunity to win wildlife photographs. The sample All coefficients have the expected sign. Theshowed a similar geographical distribution as a con- coefficient on price is negative and statistically sig-trol sample and is assumed to be representative of the nificant. Higher population densities result in moretrue domestic visitor population. trips, which is expected since people living in less
Costa Rica is divided into 81 cant6ns. Each dense cant6ns probably have nearby rainforests tocant6n is treated as an observation (this is used visit. The higher the illiteracy rate the lower theinstead of the concentric zones mentioned in Chapter visitation rate, which indicates that visitation is posi-3). Visitation rates (number of visits per 100,000 tively correlated with education, and probably per-residents) were calculated for each cant6n by divid- manent income.ing observed numbers of trips ty census populations. The visitation rates predicted in table A2.5 are
lower than actual rates, since they only predict theTable A2A Lower bound gain to society from visitation observed in the sample. Adjusting this fora saved life in $Z at different discount rates the whole sample (3000/755) yields an accurate per
capita visitation rate. The linear demand functionsSocial discount rate estimated in Table A2.5 suggest that visitation would
(percent) drop to zero only at distances of 328 kilometers and347 kilometers, respectively, for the two regressions.
2 4.8 7.24 9 At the presumed US$0.15 per kilometer, this impliesa maximum price per visit of US$49 and US$52,
Child respectively.(< S yrs) 8,441 2,813 1,094 934 The consumer surplus for each cant6n is the
(<5 yrs) 8,441 2,813 integral under the demand function (I) between theAdult actual price for this cant6n and the maximum jprice.(> 5 yrs) 1,307 1,131 1,011 489 The results are summed across all cant6ns, yielding
an annual consumer surplus estimate of US$97,500

Annex 2: Summaries of Environmental Evaluation 83Case Studies
and US$116,200, respectively. Given that there are Value of Viewing Elephants on Safaris in Kenya8
about 3,000 Costa Rican visitors per year, the site isworth about US$35 per domestic visit. Assuming the Travel Cost Approachreal value of this recreational flow remains the sarneover time and using a real interest rate of 4 percent, the The travel cost method can be used to estimate apresent value of domestic recreation at this site is demand function for going on safari in Kenya.between US$2.4 million and US$2.9 million. The consumer surplus (CS) is the difference be-
tween what people actually pay and themaximumDiscussion they would be willing to pay. This net economic
benefit from a safari does not show up in marketThis consumer surplus estimate of about observations but would be lost to the interna-US$100,000 per year does not include foreign visi- tional society if safaris were prohibited.tors. Foreign visitors outnumbered domestic visitors The analysis is based on a survey taken fromby four to one in 1988. Foreign visitation is likely to samples of the approximately 80 percent of thebe worth far more than domestic since foreign tour- tourists to Kenya who came either from Northists with higher incomes and lack of nearby substi- America or Europe. The other 20 percent of thetutes probably value the site more than domestic tourists were assumed to have the same averagevisitors. The present value estimate is probably too consumer surplus as the sample.low considering the fact that visitation has been In 1988therewere63,000visitorsfromNorthgrowing at 15 percent a year for the last five years. America and 350,000 from Europe. NormalizingStill, if the same figure, US$35, is used for all visitors for population differences gave 0.2316 and 0.9826and also for the future, that would mean anet present visitors per 1,000 population for North Americavalue of US$1,250 per hectare. The price that the and Europe, respectively.reserve currently pays to acquire new land is between The price of safari is defined as the sum ofUS$30 and US$100 per hectare. This suggests ex- land travel costs, air fare, and travel time costs.pansion of protected areas near this reserve is a These are summarized in Table A2.6. Land costswell-justified investment. were estimated by creating a quality weighted
Finally, it should be noted that the recreational pr ice index from the tour operator s'surveys.9 Thevalue of standing forests is but one of its potential air fare and travel time were estimated from visi-benefits. The total value of the forest includes bene- tors' surveys. Average annual income wasfits from renewable harvests of many commodities, US$45,000 giving an estimated hourly wage ofbiological diversity, ecological services, and sites for US$22.50, which is weighted at 30 percent toscientific research. reflect that vacation time is less valued than gross
wage rate.
Table A2.5 Domestic Demand for Visits to Monteverde
VISITATION RATE = 36.17 - 0.121 DISTANCE + 0.008 DENSITY(4.20) (2.77) (2.76)
Adjusted R2 = 0.145
VISITATION RATE = 44.42 -0.107 DISTANCE +0.006 DENSITY -0.001 ILUTERACY(4.28) (2.40) (1.82) (1.40)
Adjusted R2 = 0.1562
Note: The t-statistics are in parentheses. The number of observations (cant6ns) are 81. The low R2 values are probably due to thelack of additional data. For example, information is unavailable on socioeconomic variables that mnight better explain differencesin visitor travel behavior.

84 Annex 2: Summaries of Environmental EvaluationCase Studies
We now have the minimum requirement to es- Results Fmm Tavel Cost Approachtimate a demand curve-two observations of price-quantity. Expecting demand to be a linear function The weighted average consumer surplus is aboutwe have: US$725. Based on discussions with tour operators
and with personnel in the economic section of theU.S. Enbassy in Kenya, the number of adults going
P = 4,023 - 1,674 Q on safari eachyear was estimated at between 250,000and 300,000. This gives a total consumer swuplus forthose on safari in the range of US$182-US$218
where P is the sum of land and air travel time costs, million annually, depending on the assumed level ofand Q is holiday visits per :1,000 population. Note visitation.that we have yet to address the problem of the per- To identify the contribution elephants make tocentage of visitors on holiday to Kenya that actually the value of a safari, tourists on safari were asked ingoes on safari. the tourist survey to allocate the pleasure and enjoy-
Given a linear demand curve, per person con- ment of their trip over four stipulated categories ofsumer surplus is the choke pjice (the price at which experience. "Seeing, photographing, and learningdemand is driven to zero) minus the actual price paid, about the wildlife" made up 50 percent of the pleas-divided by two. For North America, the consumer ure according to the answers. In a follow-up questionsurplus is given by: concerning only the enjoyment of the wildlife, the
interviewees attributed 25 percent of their wvildlifepleasure to seeing African elephants. Applying the
CS. = 0.5 * (4,023 minus 3,635) = US$194 share of 12.6 percent, attributed by the visitors toelephants, to the estimated economic value of a safariyields a viewing value for elephants of 23 to 27
For Europe it is million dollars per year.
Contingent Valuation AppmachCfS. = 0.5 * (4,023 - 2,378) = US$822.50
The tourists' survey contains a series of contingentvaluation questions. One of the questions (see box
It seems reasonable that a safari, a once-in-a- A2.1) asks people to pay in the form of a speciallifeftime adventure for most North Americans, most annual permit (or increased safari cost) of 100 dollarsof whom had a vety satisfactory experience, would which would maintain the elephant population atbe worth 5 percent more than it costs. It seems current levels through increased enforcement activ-plausible that a similar experience at less cost would ity. Sixty-five percent of the respondents said theybe worth 35 percent more than the cost for a Euro- would pay 100 dollars. The average was 89 dollarspean. while the median was 100 dollars.
Some respondents dislike translating importantqualitative experiences into a dollar metric and re-
Table A2.6 Land, Airfare, and Travel Tine Costs (all monetary units US$)
Land travel HourlyRegion cost Air fare Travel time wage Weight Time cost Total price
North America 1,465 1,900 40hrs 22.50 0.30 270 3,635
Europe 957 1,300 18hrs 22.50 0.30 121 2,378

Annex 2: Summaries of Environmental Evaluation 85Case Studies
spond with a zero response. There were a substantial Although the estimates are rough, they are almostnumber of zero responses. However, to maintain a certainly a good guide to the order of magnitude ofshort questionnaire no follow-up questions were asked value. The viewing value of elephants is more likelytodistinguish"protesting"respondentsfrom"genuine" 25 million dollars annually than 2.5 million or 250zero respondents. Ib diminish the importance of the million dollars. It does not seem prudent for Kenya'szeros, the median value, 100 dollars, has been used 1988 Wildlife Management and Conservationinstead of the average. budget to be under 200,000 dollars when tens of
Respondents could have a strategic bias to give millions of dollars in viewing value of elephantslarge values if they thought the result would lead to alone are at stake.policy decisions they like but would not have to payfor. Respondents may also put in large values if they The Willingness to Payfor Water Servicesregard the question as a sort of referendum in which in Southern HaiOthey vote, as it were, for a broader, perhaps moralissue. However, the largest response to this question In rural areas, many of those who are in the servicewas 500 dollars, less than 1 percent of the respon- area of new water supply systems have chosen todent's income and about 3 percent of the cost of continue with their traditional practices. If ruralhis/her safari. There was therefore no "trimming" of water projects are to be both sustainable and replica-data. ble, an improved planning methodology is required
Starting point bias was not tested for due to that includes a procedure for eliciting information oninadequate sample size. As to the credibility of the the value placed on different levels of service, andmedian value, 100 dollars, it seems modest inasmuch tariffs must be designed so that at least operation andas it is 3 percent of the total cost of a safari. If one maintenance costs (and preferably capital costs) canthinks introspectively about the value over and above be recovered. A key concept in such an improvedthe cost of a very satisfying moderately expensive planning methodology is that of "willingness to pay"experience, 100 dollars does not appear to be a (WTP).suspiciously high number and some think it some- Two basic theoretical approaches are availablewhat low. for making reliable estimates of households' WTP.
The first, the "indirect" approach, uses data on ob-Results Fum Content Valualion Method served water use behavior (such as quantities used,
travel times to collection points, perceptions of waterCombining the median value of willingness-to-pay quality) to assess the response of consumers to dif-of 100 dollars with the estimate of 250,000 to ferent characteristics of an improved water systemn.300,000 adult safaris per year yields an annual view- The second, or "direct" approach, is simply to ask aning value of elephants of between 25 to 30 million individual how much he or she would be willing todollars. If the mean value of 89 dollars per person is pay for the improved water service. This surveyaccepted, the viewing value is decreased to between approach is termed the "contingent valuation22 million and 27 million dollars. method" and is the focus of the case study.
Note that both methods produce annual valuesof around 25 million dollars for viewing elephants.
Box A2.1 Question 10 in survey: Special Fees and Permits
Suppose that the current population of elephants can be maintained if additional foot, vehicle, and aerial pa-trols are operated on a sustained basis in the parks. If these patrols can be supported by a special 100 dollar annualpermit (or included in each visitor's safari cost), are you willing to support this permit fee.
[18] NO, I am not willing to pay $100 for this permit.[34] YES, I am willing to pay $100 for this permit.[ ] I am willing to pay a maximum of for this permit.

86 Annex 2: Summaries of Environmental EvaluationCas e Studies
The Study Area obtaining water from existing sources, and theeducation of household members, and negatively
In August 1986 the research team conducted a correlated with the individual's perception of thecontingent valuation survey and source observa- quality of water at the traditional source usedtions in Laurent, a village in southern Haiti. At the before the construction of the improvedi watertime the United States Agency for International supply system. The authors hypothesize that theDevelopment was funding a rural water supply WTP bids of women respondents would be higherproject designed to proviide services to about than those of men because women carry most of160,000 individuals in 40 towns and villages. The the water, but alternative interpretations are cer-project was executed by CARE. The affiliation tainly possible.with CARE provided access to villages and justi- The research design attempted to testfied the presence of the tearm to the local popula- whether WTP bids are systematically related totion. the variables suggested by economic thecry. Dif-
Haiti, with two-thirds of the population at an ferent ways of posing the questions were tried.annual Per capita income of less than US$155 in The bidding game format worked better than1980, provides a field setting similar to the situ- direct, open-ended questions. The bidding gameation in much of Africa and some parts of Asia. In was very familiar and easily understood becausesuch poor areas an accur ate understanding of the it was similar to the ordinary kind of bargainingwillingness of the population to pay for rural that goes on in local markets of rural Haiti. Testswater services is likely to be particularly impor- were also included for the existence and magni-tant for sound investment decisions. tude of several types of threats to the validity of
The population of Laurent is about 1,500, the survey results, such as strategic bias, startingpredominantly small farmers with a few people point bias, and hypothetical bias.having regular wage employment. Remittances Strategic bias may arise when respondents be-from relatives and friends are common. More lieve they may influence an investment or policythan 80 percent of the population is illiterate and decision by not answering the interviewer's ques-malnour:ishment among children is widespread. tions truthfully. Such strategic behavior may influ-
There are seven sources of fresh water within ence answers in either of two ways. Suppose anapproximately 2 kilometers of most of the popu- individual is asked how much he would be willing tolation: one protected well and six springs in dry pay to have a public standpost near his house. Ifriver beds. The springs provide only modest he/she thinks the water agency or donor will provideamounts of water, and individuals often wait more the service if the responses from the village arethan an hour to draw supplies. The average 3 positive, but that someone else will ultimately paykilometers round trip to a water source can some- for the service, there will be an incentive to overstatetimes take several hours. The preferencefor clean his/her WTP. On the other hand, if the individualdrinking water is strong, and people sometimes believes the water agency has already made the de-will walk considerable distances past alternative cision to install public standposts in the village andsources to collect drinking water that is consid- that the purpose of the survey is to determine theered pure. amount people will pay for the service (in order to
assess charges), the individual will have an incentiveResearch Design to understate the true WTP.
An attempt to estimate the magnitude of the biasEconomic theory suggests tthat an individual's was made by dividing the study population in twodemandfor agoodisafunctionof thepriceofthe groups. One group was read an opening stalementgood, prices of substitute and complementary intended to minimize strategic bias. The group wasgoods, the individual's income, and the individ- told that the international agency, CARE, had alreadyual's tastes. Maximum WTP for a new water sys- decided to build the new system and that peopletem will vary from household to household and would neither have to pay CARE for the system norshould be. positively related to income, the cost of pay money at the public fountains. The second group

Annex 2: Summaries of Environmental Evaluation 87Case Studies
was read another statement that was accurate but left ond consisted of a number of specific water-relatedmore questions about the purpose of the study unan- questions. In the third section the enumerator readswered, especially concerning the role of the inter- one of the statements used to test for strategic biasview in designing a water fee. and showed the photographs of public standposts in
The hypothesis was that if individuals acted other villages. The respondent was then asked tostrategically, then bids from those who received the present bid per month for (a) public standposts (as-second statement would be lower than bids from the sunming no private connection) and (b) for a privatefirst because the former would fear that a high bid connection (assuming public standposts were al-would result in a higher charge by the community ready installed). The fourth section was a series ofwater committee. questions on the health and education of family
Starting-point bias exists if the initial price in members and the household's assets (such as radiosa bidding-game affects the individual's final WTP. or kerosene larnps). The latter was used, along withThis could, for example, be the case if the respondent observations about the quality of the house itself, aswanted to please the interviewer and interpreted the a substitute for expenditure questions, to forTn ainitial price as a clue to the "correct" bid. To test for household wealth index.starting-point bias, three different versions of the The second part of the fieldwork consisted ofquestionnaire were randomly distributed, each with observing the quantities of water collected by indi-different initial prices in the bidding game. viduals at all the sources used by the population of
Hypothetical bias may arise for two kinds of the village. The objective of these observations wasreasons. First, the respondents may not understand to verify the information individuals provided inor correctly perceive the characteristics of the good household interviews on the sources they used andbeing described by the interviewer. This has been a the quantities of water collected. All sources wereparticular problem when the contingent valuation observed on the same day from sunrise to sunset. Themethod has been used to measure individuals' WTP analysis of the source observation data for Laurentfor changes in environmental quality. For example, increased the confidence in the quality of the water-it may be difficult for people to perceive what a use data obtainedfrom the household interviews. Outchange in sulfur dioxide or dissolved oxygen means of 119 observations of trips to water sources, thein terms of air or water quality. This bias is not likely interview responses were consistent with the sourcein the present case. The respondents were farniliar observation for 101 households (85 percent).with public water fountains and private water con-nections and photos of public standposts built in Analysis of Contngent Valuation Bidsnearby villages were shown during the interview.
The second source of hypothetical bias is the Fourteen percent of the households gave an answerpossibility that the respondents do not take the ques- of "I don't know" in response to WTP question fortions seriously and will respond by giving whatever public standposts; there was a 25 percent non-re-answer first comes to mind. The test for this is the sponse rate for the WTP question for private connec-same as for the applicability of consumer demand tions. The mean for the bids for the standposts, 5.7theory: were bids systematically related to the vari- gourdes per month, (US$1.14) seemed realistic.ables suggested by economnic theory? The test for strategic bias showed the antici-
pated higher bids for those who had received theField Procedure neutral statement, but the difference was not statisti-
cally significant (t-statistics of 1.1 and 0.5, respec-Fieldwork in the village consisted of two parts: tively, for bids on standposts and privatehousehold surveys and source observation. The ma- connections). On the basis of this test, the hypothesisjority of households in Laurent were interviewed that respondents were not acting strategically when(170 questionnaires completed out of approximately they answered the WTP questions cannot be rejected.225 households). The household interview consistedof four sections. The first dealt with basic occupa- The test for starting-point bias showed that thetional and demographic data on the family. The sec- bids did not vary systematically with the starting-

88 Annex 2: Summaries of Environmental EvaluationC'ase Studies
point. The null hypothesis: that the three samples are Conclusionsfrom the same population cannot be rejected, al-though the confidence intervals are wide. The results of this study suggest that it is possible to
On the basis of these results, there was no reason do a contingent valuation survey among a very poor,to attempt to adjust the WTP bids for strategic or illiterate population and obtain reasonabile, consis-starting-point bias. The mean of WTP bids for the tent answers. The results strongly suggest that con-public standposts was 5.7 gourdes per household per tingent valuation surveys are a feasible method formonth. Assumning an average annual income in estimating individuals' willingness to pay for im-Laurent of 4,000 gourdes i(US$800), the mean bid is proved water services in rural Haiti. It may also proveabout 1.7 percent of household income and is signifi- to be a viable method for collecting information oncantly lower than the 5 percent rule of thumb often individuals' willingness to pay for a wide range ofused in rural water supply planning for maximum public infrastructure projects and public services in"ability to pay" for public standposts. The mean of developing countries.WTP bids for private connections, 7.1 gourdes, wasnot much higher (2.1 percent of household income), Willingness to Payfor Improved Sanitationbut these bids were based on the assumption that the in Kumasi, Ghanallpublic standposts were already in place.
The variations in the bids for public standposts A case study was conducted in Kumasi, Ghana, toand private connections were modeled as a function determine household demand for two sanitationof the identified explanatory variables. The depend- technologies: water closets (WCs) with a piped sew-ent variable obtained from the bidding game is prob- erage system, and Kumasi ventilated improved pitably not the maximum amount the household would latrines (KVIPs). The objective of the study is tobe willing to pay but rather an interval within which demonstrate how information on household demandthe true willingness to pay falls. Linear regression is for improved sanitation services can be gatherednot an appropriate procedure for dealing with such utilizing a contingent valuation survey, an,d how thisan ordinal dependent variable because the assump- information can be used to plan sanitation invest-tions regarding the specification of the error term in ments.the linear model will be violated. An ordered probitmodel was instead used to explain the variations in Study DesignWTP bids.
The results of the estimations can be seen in Observers were placed at a random sarnple of 30Table A2.7. The coefficients for all the independent public latrines in neighborhoods in Kumasi, and atvariables are in the direction expected. The t-statis- all 10 public latrines near the public marketplace, totics indicate that the variables for household wealth, determine usage levels of public latrines (such usagehousehold education, distance of the household from requires payment of a fee in some localities). Aseriesthe existing water source, and water quality are all of interviews was then carried out with personnelsignificant at the 0.05 level in both models. The sex involved in the management and operation of all 40of the respondent was statistically significant in the public latrines in the sample. Information was gath-model for public standposts, but not in the model for ered on the cash flow position regarding the latrines,private connections. The results clearly indicate that and on the facilities themselves. Data was gatheredthe WTP bids are not random numbers but are sys- also on the amount of waste collected by Kumasi'stematically related to the variables suggested by eco- six desludging trucks.nomic theory. The major part of the field work was related
The ordered probit model can be used to predict to the design and implementation of a large house-the number of households in a community which will hold survey, to collect information on existinguse anew source if various prices were charged. Such sanitation practices and WTP for improved sanita-demand schedules are precisely the kind of informa- tion services. An initial household survey of 50tion needed by planners and engineers to make sound households was conducted in July 1989. This wasinvestment decisions.

Annex 2: Sunmaries of Environmental Evaluation 89Case Studies
Table A2.7 Willingness-to-pay bids for public standpost and private connections
Dependent variable: Probability that a household's WTP falls within a specified interval
For a public standpost For a private connection
Independent variables Coefficient 7-ratio Coefficient i-ratio
Intercept 0.841 1.350 -0.896 -1.344
Household wealth in- 0.126 2.939 0.217 4.166dex
Household with for- 0.064 0.232 0.046 0.194eign income(1 if yes)
Occupation index -0.209 -0.848 -0.597 -2.541(1 if farmer)
Household educationlevel .157 2.113 0.090 1.818
Distance from exist- 0.001 5.716 0.000 1.949ing water source
Quality index of ex- -0.072 -2.163 -0.099 -2.526isting source
Sex of respondent -0.104 -5.41 -0.045 -0.207
Log-likelihood -206.01 -173.56
Restricted log-likeli- -231.95 -202.48hood
Chi-square (free- 51.88 57.83dom=7)
Adjusted likelihood 0.142 0.177ratio
Degrees of freedom 137 120
followedbyapretestingquestionnaireforahundred socioeconomic characteristics, such as education,households. income, etc. A two-stage, stratified.sampling proce-
The final survey questionnaire had four parts. dure was utilized to select a random sample of 1,633The first part related to demographic characteristics. households. The household survey was caried outThe second was concerned with the household's over a five-week period in October and Novemberexisting sanitation conditions, and the level of satis- 1989. The overall response rate to the survey wasfaction with these services. The third contained ques- very high-only 45 households refused to be inter-tions about WTP for improved sanitation facilities. viewed. Usable interviews were completed by 1,224Fourth and finally, there were questions relating to respondents.
90 Annex 2: Summaries of Environmental EvaluationCase Studies
Household preferences for improved technologies sewer connection for households currently with-out water. Each household was only asked about
Surveyors asked the question: "If a WC (con- its WTP for services relevant to its specific cir-nected to a sewer system) and a KVIP each cost cumstances.the same amount per month, which one would you On average households without a WC wereprefer?" Contrary to expectations that respon- willing to pay about the same for a WC or KVIPdents would stronglyprefer aWC,45% indicated ($1.43 vs. $1.47). Households with a WC werea preference for KVIPs, and only 54% preferred willing to pay $1.32 for a sewer connection.WCs. In an attempt to identify any underlying Households without water connections were will-patterns for expressed preferences, a logit model ing to pay $1.56 for a KVIP and $2.53 per monthwas estimated to examine the relationship be- for both a water connection and WC. Resultstween household preferences and socioeconomic suggest that expenditures for water and sanita-and other characteristics of the household. The tion are not substitutable-the demand is addi-dependent variable was the household's prefer- tive.ence for either WCs or KVIPs assuming equal Three multivariate modeling approachescosts; higher values of the dependent variable were utilized to analyze the relationship of vari-indicated a preference for the KVIP over a WC. ous determinants in the WTP bids. These wereDependent variables included sex, age, education, Ordinary Least Squares (OLS), Stewart Maxi-income, and existing household sanitation facili- mum Likelihood, and Ordered Probit. Resultsties. obtained from the multivariate analysis are ro-
The unrestricted model used a list of 21 bust, and show that WTP information is system-independent variables to explain household pref- atically related to socioeconomic characteristicserences.Theoverallfit of thismodelwasnot good; of the household in all areas, and that r-esponsesit could not be confirmed that parameter esti- obtained conformed with prior expectations andmates were not equal tci zero. Surprisingly, no consumer demand theory.linkage could be established between higher in- Household with higher incomes bid signifi-comes and/or better education and a greater pref- cantlymorefor improved services than thosewitherence for WCs. lower incomes. Owners bid more for improved
The restricted model used four independent facilities than renters. Respondents with access tovariables, all of which were significant at the 10% a private water connection bid more for KVIPslevel in the unrestricted raodel. In this restricted than respondents without a private connection,model,thevariablerelatedtothe"time-to-think" suggesting a desire to continue improving basiceffect was significant at the 5% level, which indi- services. Households in multistorybuildiings werecates that respondents who had time to consider willing to pay less for a KVIP than householdstheir answers were more likely to prefer KVIPs. living in single-story buildings, possibly becauseThe authors suggest that this later hesitancy may of the limited convenience of KVIPs in multistorybe linked to a diminished enthusiasm for an un- dwellings.familiar system (WCs coinected to a sewer sys-tem) once respondents were able to reconsider Policy optionstheir responses.
The authors point out that information on WTPHousehold willingness to pay for improved sanitation can help in sanitation
for improved sanitation planning. Costs of both KVIPs and WCs arehigher than what households are willing topay for
Respondents were asked about their WTP for five them, and therefore public subsidization woulddifferent types of services: KVIPs, WCs with sewer be necessary if improvements were to be imple-connections, sewer connections for households that mented. It is evident that conventional seweragealready had WCs, private water connections, and systems, and therefore WCs, are not affordableboth a private water connection and a WC with a for the majority of the population. The authors

Annex 2: Summaries of Environmental Evaluation 91Case Studies
suggest that if policy reforms were introduced in the Visitation rates or number of visits per 1,000financial and housing markets, household demand people, (not the number of visitors, since many makefor KVIPs might be significantly increased without repeat visits) were calculated for all 17 zones, andthe need for subsidization. are demonstrated in Table A2.8. Information on the
round-trip monetary travel cost and the average tineApplicability of CVM in Esfimaing Household for each trip was collected. Time spent traveling was
Denund for Sewerage Services then changed into a monetary value using a repre-sentative wage rate and was then added to the travel
The study identifies two areas in which additional cost. Aregression equation was estimated, regressingresearch is needed. Contingent valuation questions visitation rates against average total travel cost. Us-for alternative technologies were asked sequentially ing data on changes in admission fees, changes inin this survey. Research is required to develop cost- demand for visits with higher fees can be estimatedeffective ways of determining how households (Table A2.9). These results were then plotted on awould choose between multiple options presented linear demand curve, and the consumer surplus wassimultaneously at varying prices. estimated at Baht 13.2 x 10⁶. Capitalized at 10%, this
Secondly, the study used the single household yielded a value of Baht 132 million, or $US 6 million,as the unit of analysis. Additional research shouldbe at the 1980 exchange rate.undertaken on how best to estimate collective will- Under the contingent valuation approach, usersingness to pay for improved facilities in situations were directly asked a hypothetical question: "If thewhere group housing is common-for example, in government could no longer allocate the budget toan apartment building. maintain the park but in fact was considering turning
The study helps to broaden the horizons of it into other uses, what would be the maximumplanners, engineers, and policy analysts, by placing amount you are willing to contribute per year to keepmore of a focus on "demand-side" issues (for hous- the park?" Two sets of values were obtained from theing, capital, and infrastructure), as opposed to purely survey-a user value, from interviews conducted attechnological alternatives or government financing. the park, and values from respondents who were
interviewed at their residences.Value of a ThaiNational Park 2 The 187 persons interviewed for the TC study
were also interviewed for the CVM study. TheIn an attempt to measure the value of Lumpinee Park amount per year that respondents were willing to payin Thailand, two surveys were conducted, a demand appeared to be linked with the frequency of visits.function for the service of the park was estimated, Visitors for recreational purposes indicated a slightlyand the value of the consumer's surplus associated lower WTP for yearly contributions to maintain thewith the demand curve was computed to represent park than visitors for morning and evening exercisethe value of the park in the year of the study (1980). purposes. However, the latter group's willingness to
The Travel Cost model used was of the standard pay per visit was less than that of recreational users.form-visitation rates were assumed to be a function The authors decided to estimate the number of visi-of total travel cost, availability of substitute sites, and tors per year (2.1 million) as the number of visits, asincome. The total travel cost variable included both the value of the park will depend to a large extent onout-of-pocket travel costs plus the monetary value of the proportion of the visitors using the park fortime spent traveling, using a representative wage recreational and exercise purposes and their averagerate. 187 people were interviewed and divided into visitation rates.17 zones of origin within Bangkok. The initial survey User's willingness to pay, or what the authorswas divided into weekday and weekendusers. It was call the user's hypothetical valuation, was estimatedfound that the park's use rate was heaviest on the at 13 million baht, and is therefore virtually identicalweekend. An attempt was made to determine if week- to the travel cost results.day and weekend users were statistically different in An additional 225 people were interviewedterms of values, income, etc. It was found that this throughout Bangkok, including people who hadwas not the case. never used the park, in an attemipt to estimate the

92 Annex 2: Swnmaries of Environmental EvaluationCase Studies
broader "social" (or what is now more commonly Table A2.8 Visitation Rate per 1,000 Populationtermed "non-use") value of the park. When CVM per Year for All Zonesresults were adjusted by the appropriate age-correctedpopulation figures, the WTPmeasure of park users was Sampleestimated at 13 million baht per year, and for the survey Popula- Vlisitationof Bangkokresidents, 116.6millionbabiperyear, (thus Zone tion Person Percent rate/1,000demonstrating themorerealisticWTPof constantusersof the park). The consumer surplus and welfare gainassociated with the continued existence of the park is 1 190,450 10 5.3 590clearly significanL 2 235,647 27 14.4 1,288
Notes 3 77,112 4 2.1 5834 131,542 23 12.3 1,965
1. Portions of this Annex are based on an original draft 5 380,416 30 16.0 886prepared by Gunnar Kohlin.
2. This case study is derived from J. Bojo, 1991. 6 519,869 18 9.6 3893. This is supported byobservations during fieldwork 7 523,831 37 19.8 794
in the area before project initiation.4. This case study is derived from Peters, et al. 1989. 8 123,109 3 1.6 2745. All prices in 1987 U.S. dollars using anexchangerate 9 479,659 4 2.1 94
of twenty infis to the dollar.6. This case study is derived from Fredriksson and 10 201,334 4 2.1 223
Persson, 1989. 11 388,333 6 3.2 1747. This case study is derived from Tobias and Mendel-
sohn, 1991. 12 255,555 7 3.7 3088. This case study is derived from Brown and Henry, 13 262,097 1 0.5 43
1989.13 22071 0549. The survey contained 17 questions and was distrib- 14 140,249 4 2.1 320
uted at some lodges and given to tourists during parts of May 15 382,621 5 2.7 147and June, 1988. There were 53 respondents.
10. This case study is derived fromn Whittington, et al., 16 204,434 1 0.5 55
11. This case study is derived from Whittington et al., 17 113,769 3 1.6 2961992.
12. This case study is derived from Grandstaff and aDixon, in Dixon and Hufschmidt (eds.), 1986. Total 4,610,027 187 99.6
a. Percentages do not total 100 due to rounding.

Table A2.9 Visits in One Year at Various Admission Fees in Baht (B)
Number of visits at various admission fees (B)
Popula- Total cost
Zone tion (Blvisit) 0 2 4 6 8 10 12 14 16 18 20
1 190,450 8.08 161,978 139,714 117,438 95,169 72,900 50,631 28,362 6,093 -- -- --
2 235,647 3.72 260,483 232,929 205,375 177,821 150,268 122,714 95,160 67,606 40,052 12,499 --
3 77,112 10.25 55,800 46,783 37,768 28,750 19,734 10,717 1,700 -- -- -- --
4 131,542 5.04 135,254 119,873 104,492 89,111 73,730 58,349 42,968 27,587 12,206 -- --
5 380,416 8.64 311,085 266,604 222,123 177,641 133,160 88,678 44,197 -- -- -- --
6 519,869 10.00 383,788 323,000 262,213 201,426 140,639 79,851 19,064 -- -- -- --
7 523,831 13.66 274,624 213,373 152.123 90,872 29,621 - -- -- -- -- --
8 123,109 16.65 43,021 28,626 14,231 -- -- -- -- -- -- - -
9 479,659 14.18 236,884 180,798 124,713 68,627 12,541 -- - -- -- -- --
10 201,334 15.50 83,893 60,352 36,810 13,268 -
11 388,333 20.35 51,701 6,294 -- - -- -- - -- - -- --
12 255,555 19.52 46,424 16,543 - -
13 262,097 17.16 83,776 53,129 22,482 - - - -- - -- - --
14 140,249 17.01 46,058 29,659 13,260 - -- - - - -- -- --
15 382,621 18.43 93,890 49,151 4,412 - - -* - -- - -- --
16 204,434 27.59 - - -- - - -- -- -- --
17 113,769 21.70 6,167 - -- - - -- -- -- -
Total visits per year 2,274,826 1,766,828 1,317,440 942,685 632,593 410,940 231,451 101,286 52,258 12,499 0

ANNEX 3. ESTIMATING INTERNATIONALTRAVEL COSTS1
Most travel cost studies specify the problem in to Madagascar, relative to trips to other countries.terms of valuing single-purpose, single destination This is described in more detail below (for a rigorousday-trips to a site that provides aparticular recreation mathematical analysis, see Mercer and Kramerexperience of typical quality that is interchangeable 1992).with those available at many similar sites. Recreation There are two types of goods in the model:in Madagascar's national parks is not consistent with recreation service flows and nonrecreation servicethese assumptions. Recreators in Madagascar can be flows. Recreational service flows are produces bydivided into two groups consuming two distinct combining market travel services and timre to travelgoods: a) local recreators who consume day-trips to to a country with nature tourism trip experiences innational parks to escape the city and view the local the country. Nonrecreation service flows includenatural environment; and b) international nature market commodities combined with time.tourists who consume mu]ti-week trips to an exotic Nature tourism trip experiences in a country areland, to experience unusual landscapes, fauna, flora, produced by choosing a bundle of activities andand cultures. utilizing in-country market services and travel time
Basic travel cost models can be applied directly to visit the location of the activities. The activitiesto estimate the demand of local recreators. By con- can be thought of either as single destinations withintrast, the decision by foreigners to pursue nature the country, or groups of destinations. Activities intourism in Madagascar and at a particular site such Madagascar, for example, might include travelling toas the proposed national park is much more complex the proposed Mantadia National Park to view thethan the models presented in standard travel cost indiri lemurs and to a specific beach to swim andstudies. Such foreign visitCrs fly great distances and sunbathe, or to a group of parks for birdwatching andutilize various modes of travel to visit numerous sites a group of beaches for snorkeling. The productionand enjoy many different activities in Madagascar. function of these nonhomogeneous nature tourismFew foreign tourists plan trips solely to visit a par- trip experiences is therefore a function of the activi-ticular national park in Madagascar. More com- ties chosen, the travel time to reach the location ofmonly, they first decide to take a trip to Madagascar the activities, and the market goods used to travel toto view nature. Then, they decide on a specific itin- the location of the activities.erary that may include several parks, cultural sites, Once the site of the activity is reached, theetc. Therefore, modeling the demand for foreign activity is produced by combining market goods (e.g.travel to a national park in Madagascar for nature guide services, camnping equipment), environmentalrelated recreation on the basis of the travel cost services of the site of the activity, and on-site time.method requires a significanit reformulation of tradi- Households considering international nature tourismtional models. are assumed to attempt to maximize utility. The
The international travel cost method is most utility function of the individual is then solved sub-easily understood by dividing the decision process ject to the production function above and the usualinto several stages. First, the household examines the full income constraint.costs associated with enjoying the various activities This model can be used to specify the total useavailable in each country. Using the knowledge value of international nature trips in temis of thegiven in the first stage, the household miniimizes the maximal amount an individual would be willing tototal cost of nature tourism trip experiences defined pay for the trip and still enjoy a given level ofby a certain bundle of activities. Finally, the house- satisfaction or utility. This implies that the value of ahold uses the information from stages one and two to trip is the difference between the minimurm incomecompare the benefits and (mininiized) costs of a trip required to reach the given initial level of utility at

Annex 3: The International Travel Cost Model 95
choke price levels, minus the minimum income re- Thus, Y* is the minimum expenditure requiredquired to reach the initial utility level at the initial to achieve the same utility level U°, if choke pricesprices. This is explained below. P*v, C*NM, and C*M prevailed for visits to Madagas-
A specific application of the model is that it car and for activities within Madagascar (i.e., if theseseeks to identify the tourists' willingness-to-pay for prices were raised from the base level up to values justthe creation of a new national park (Mantadia). Mer- high enough to choke off demand for internationalcer and Kramer define a total use value (TUV) based travel and in-country activities-in Figure 3.2 in Chap-on two major components: ter 3, the point H is an example of a choke price).
a) decision to visit Madagascar (versus other TUV may be broken down into components incountries); several different ways, but for their purposes, the
b) decision to undertake specific recreational authors rewrite (1) as follows:activities in Madagascar. TUV = e(P*v, C*NM, C*M, ZO, U°) -
With respect to item (b), a further disaggrega- e(Pov, CONM, cOM, Z°, UO)tion is made. Thus the model focuses on two activi-ties within Madagascar: = [e(P*v, C*NM, C*M, Z°, U°) -
(b) (i) Recreation outside Mantadia park; e(P°v, C*NM, C*M, Z, U°)] (4)(b) (ii) Recreation in Mantadia park.
We may write + [e(P°v, C*NU, C*M, Z°, U°) -e(Pov, CONM CTm, Z0 , U0)] (5)
TUV = Y -Y (1) + [e(P0v, CONM C*M, Z°, U°) -e(Pov, CONM, COM, Z0, UO) (6)
The Y's are income levels which may be ex- Note that line (4) indicates the willingness-to-pressed in terms of corresponding expenditure func- pay for (or value of) a simple visit to Madagascar-tions e, as follows: but with no recreational activities undertaken (i.e.,
choke prices C*NM and C*m prevail). Line (5) relaxesthe cost of recreation outside Mantadia (CON1) and
Y° = e(P°V, C°NM, C°M, Z0, U°) (2) indicates the WTP both to visit Madagascar and toundertake activity outside Mantadia park. Finally, byreducing the cost of recreation in Mantadia (C0M),
where P°v = base price of a visit to Madagascar line (6) indicates the value of a visit to Madagascarplus recreational activities both outside and within
C°NM = base cost of recreation outside Mantadia Mantadia.park The above sequencing of components facilitates
the estimation of value attached by tourists to theCOM = base cost of recreation in Mantadia park creation of a new national park. Survey techniques
may then be used to determiine actual cash costs andZ° = vector expressing base levels of other goods time expended by intemational tourists visiting
and services Madagascar, and thereby estimate their WTP for thevarious components.
U° = base utility levelNote
In other words, Y° is the minimum expenditure re-quired to achieve the utility level U0 , given the base 1. This annex is drawn from a detailed paper by Mercerlevels for all prices and costs. and Kramer (1992).
Similarly Y = e(P*v, CNM, CM,S Z, U ) (3)

ANNEX 4: USING A SIMPLEBIODIVERSITY INDEX
This annex summarizes the development of a basic of low biodiversity, such as a sand dune) whereas thebiodiversity index that was developed to facilitate the loss of one hectare if 1,000 ha remain would be muchanalysis of environmental impacts at hydroelectric less.dam sites in Sri Lanka. It may be considered a first This approach to valuation of biodiversity isstep, constrained by scarcity of data, resources and subject to several caveats. First, ecosystems maytime. require some minimum area for long term survival,
Detailed site specific information at potential which implies that the value function would needpower plant sites is unlikely to be available at the to tend to infinity as it approaches that miniimumlong-range system planning stage. Thus, the only value.quantification of biodiversity impacts that appears Second, and perhaps more importantly, the ar-possible at this level of aggregation is a probabilistic gument is sometimes made that the value to be as-estimate that gives the decision-maker information cribed to the habitat associated with some regulatoryabout the likelihood that the detailed environmental or governmental decision depends upon whetherimpact study will reveal adverse effects on an en- what remains is secure. For example, the cost of thedemic species, significant inmpacts on ecosystems of loss of 1 ha of habitat if 1,000 remains rnight behigh biological diversity, or degradation of a habitat valued as negligible, if that remaining habitat isalready in a marginal condition. It should be notedthat endemicity and bio-diversity are not necessarily Table A4.1 Relative Biodiversity Valuecorrelated: an endemic spec:ies may be encounteredin an area of low biodiversity, and areas of high rank ecosystem wbiodiversity may contain no endemic species. It iscertainly true, however, that extinction of an endemicspecies would very likely constitute a "show-stop- 1 lowland wet evergreen 0.98per" at the project stage; and it is also true that at least forestas far as Sri Lanka is concerned, its endemic species 2 lowland moist evergreen 0.98are most likely to be encountered in areas of high forestbiodiversity. 0.90
A biodiversity index wll have several constitu- l o rsent elements. First is the nature of the impacted 4 upper montane forest 0.90system itself. In Table A4.1, the main ecosystems 5 riverine forest 0.75encountered in Sri Lanka are ranked and assigned a 6 dry mixed evergreen 0.50value, wj, that captures the relative biodiversity value forestof different habitats. The scale is to be interpreted asa strict ratio scale (i.e. zero indicates zero amount of villus 0.40the characteristic involved, and a habitat value of 0.1 8 mangroves OAOimplies ten times the value of a habitat assigned the 9 thorn forest 0.313value of 0.01).
The second element concerns the relative valu- 10 grasslands 0.3)ation, because the value of the area lost is a function 11 rubber lands 0.24)of the proportion of the habitat that is lost. For 12 home gardens 0.20example, the loss of the last hectare (ha) of an eco- h 10system would be unacceptable, and hence assigned 13 salt marshesan infnite value (even if the habitat involved were 14 sand dunes 0.10

Annex 4: Using a Simple Biodiversity Index 97
Figure A4.1 Biodiversity Index Value and Reservoir Size in Sri Lanka
1.3-
1.2 _ *KUKU 022
1.1
1 _ GING05
0.s9
0.8
0.7
§ 0.6 - a GING052
1 0.5 _
0.4 _KELA 071iD 3 MAGUO430.3-
0.2 Other smai plvisiunl-ot-river)
0.1 _
0 0750 20 40 60
Reservor area, kM 2
protected from encroachment. On the other hand, if Bi = y Ai wthe remaining 1,000 ha is vulnerable to encroach-ment, then the loss of that 1 ha under considerationmight be assigned a much higher value. where Aj is the ha of ecosystem of typej at site i; and
Such reasoning is not logical, because there is a wj is relative biodiversity value of type j (as definedconfusion between costs and benefits. On the cost inTable A4.1).side, it really does not matter whether the loss is In the case of Sri Lanka, the biodiversity indexattributable to a power plant, or to agricultural devel- is strongly correlated with reservoir size (see Figureopment, or even to illicit felling: the loss is the same A4. 1). This is simply a consequence of the fact thatin both cases. On the other hand, the benefits to all of the larger projects inundate relatively largesociety of these activities may be quite different. Yet amounts of natural forest of high biodiversity value:it is only land use planning at the local or regional this would not necessarily be the case elsewhere.level that can address the costs and benefits of alter- However, when one excludes the five very largenative uses in a systematic way. projects with reservoir sizes in excess of 15 km2, the
Thus the biodiversity index associated with site correlation is quite poor, reflecting the diversity ofi, Bi, is simply defined as ecosystem types encountered at the smaller sites.

ANNEX 5: RECENT WORK ON ECONOMICPOLICIES AND ENVIRONMENTAL
IMPLICATIONS
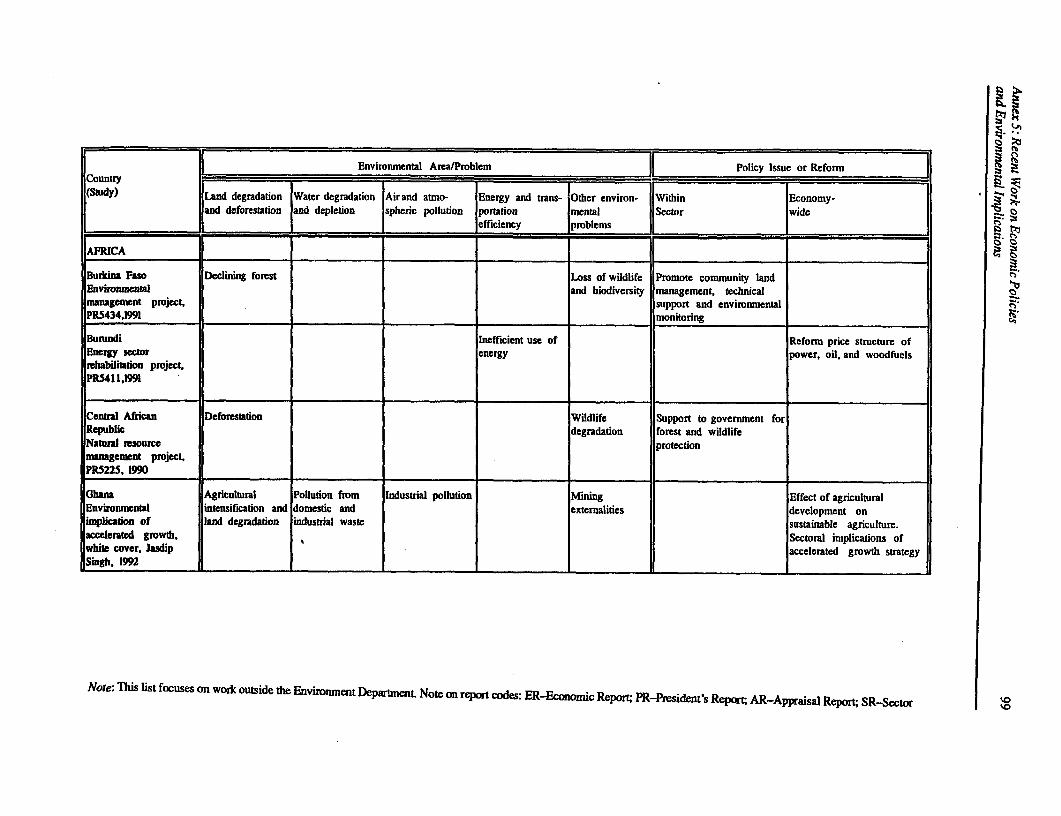
Environmental Area/Problem Policy Issue or ReformCountry . _ - or .eforrn 3[(Study) |Land degradation Water degradation Airand atmo- Energy and trans- Other environ- Witdin Economy-
and deforestation and depletion spheric polludion portation mental Sector wideefficiency problems 2
AFRICA
Burkina Faso Decliing forest Loss of wildlife Promote community landEnvironmental and biodiversity management, technicalmanagemtent project, support and environmentalPRS434,1991 monitoring _
Burundi Inefficient use of Reform price stmucture ofEnergy sector energy power, oil, and woodfuelsrehabilitation project,PR5411,1991
Central African Deforestation Wildlife Support to government forRepublic degradation forest and wildlifeNaturl resource protectionmanagement project,P15225, 1990
Ghana Agricultural Polludon from Industrial pollution Mining Effect of agriculturalEnvironmental intensification and domestic and externalides development onimplication of land degradation industrial waste sustainable agriculture.accelerated growth, Sectoral implications ofwhite cover, Jasdip accelerated growth strategySingl, 1992 . _
Note: This list focuses on work outside the Envirounment DeparmtmenL Note on report codes: ER-Economic Report; PR-President's Report; AR-Appraisal Report; SR-Sector

lvory Coast Deforestation and Trade policy effects on landTadc liberalization and decline of fallow use change (using GIS)deforestation,
conference paper, 1991.Ramon Lopez
Forest protcction; tainingForestry sector project, Deforestation Inefficient wood and investment in woodPR4879.1990 _ __ processing industry
enya Deforestation; Agricultural water Introduce environmental Impact of irrigationForestry development agroforestry depletion regulation: tree planting; investmentsp-Jec, PRS3So0,990 roion flscal subsidies; tenure
formProtected areas andwwddlife services
Need for wildlife Promote communityproject, PR5644, 1992 I management wildlife nanagementLesotho land degradation
Soil conservationL management and and sod erosion programs, such as pastureconservation project, improvement, tree plantingPR4053. 1988
Madagascar Soil emsion, Coastal fishery Improve land security|Enviment pmgram, deforestaion over-use through tidtling; promoteAR8348, 1990 (first environmnental educationphase of BAP)
Malawi Soil esion, Agricultural water Pricing reforms;X |(Economic Report Env deforestation depletion; urban institution buildingMgt. Strtegy) water pollution _ _ _
Maudtius Lack of land use Investment program andEmizomnmental planning institution support for landmonitoring aDd manunagementdevelopment project.{i
PR53811990
Econtomic development LAnd allocation Industrial water Loss of tablish environmental Devise a Nationalwiti envirmental pollution biodiversity institutions and use environmental policymanagement, SR7264, economic incentives for1988 _ -_ pollution abatement
-' ~~~~~~~~tI

I|Mozambique SoDl salinidtion Water-borne Address resource Unanticipated effects of(Olivares) from Inigadon; diseases from undervaluation irrigation developmentrangmve irrigadon
(degradation _ _ XNigeria Deforestation and Water Institutional and policy Establish land security toTowards the il degradation contamination, reforms for specific promote conservation;development of an ' especially among resource areas recommended review ofnviroamenral acdon rural and landless trade policy impacts onlan for Nigeria, gray poor resource-based products;over SR9002,1990
energy pricing reforms . r Rwanda Excess demand Woodfuel pricing and Policies govemingissues and options in for fuelwood taxation fuelwood and petroleumdie energy sector,
substitutionSR8017. 1991 I I O
enegal Soil erosion Promote research on agro-Second agricultural forestry and soilrseareh projet, conservationPR5064 1990Uganda Urban water Institutional and physicalSecond water supply availabiity and improvements in deliveryproject, PR5214, 1990 waste water and treatment capacity;
treatment more pollution controlproposed
Zambia Economic Dependence on Export promotion to reducerecovery program, mining dependence on miningIPR5483, 1991Zimbabwe Land Overgrazing Introduce forestry Need for tenureForest resources degadation, and decline of regulation reforms and re-management and forest loss wildlife distribudon|development project.PR5086, 1990
Economics of Widlife Decline of Devaluation and tourismwildlife and implicadons on wildlifebiodiversity loss
Agriculture sector Inefficient land Promote land equity andmemnorajdum, SR9429, use conservation1991
I W . =~~~~~~~~~~~~~~~~~~~

Environmental Area/Problem Policy Issue or Reform FCountry_(Study) Land degradation Water degradation Airand atmo- Energy and trans- lOther envimn- Within Economy-
|and dcforcstation and depletion spheric pollution portation mcntal Sctor wide_____________randdefresatin 1ad dpicion spheic olltio jemcienc jprbem
_ficiency problems
jASIA Il __ _ ____ i_ _ _ _ _ __ _ _ _ _ ___ ___ ___ __ _
|Bangladesh Fishery I t 1 Feshwater Increase private sector rolesector review, gray fishery in fishery development;cover SR8830, 1991 development improve credit accessIndia Deforestation and Water resource Industry ndusty regulation; Role of population pressureIndia's environment- watershed degradation pollution soil conservation on limited land; protection ofa strategy for World stabilization
program material and energyBank assistance, intensivc industrySR7676, 1989
Mahanshtra funl High incidence of Investment in rural waterwater supply and water-borne supply and sanitationenvironental disease systemssanitaton, AR9202,1991
Industrial pollution Urban water Industrial air Investment, technicalcontrol project, polludon, water pollution assistance, and monitoring|PR5485, 1991 supiy aond at the state levell ~~~~~sanitadion
Integrated watershed Deforestation and ' Industrial pollution Environmental Institutional and investment development (plains) land degradation; impact of energy support for watershedproject, PR5241, soil erosion, projects management; community1990; (hills) prject, watershed managementPR15187, 1990 - degradadon
i _
5
.CZ.1
tII

PI
China Environmental Execssive use Urban air pollution Inefficient coal Institutional reforms Reforn of industrialStrategy paper, of fertilizer and use incentves;green cover SR degradadon of implications of economic re- . o669, 1991 Nick marginal lands stmructring oAnderson srcui
Technical assistance forLiaoning urban Urban water use llution abatement andinfrastructure project, and pollidon ater prieing AR8250. 1991
oEfficiency and Unvestments and policy Investment and policynvitonment l Urban air polluton Widespread coal ptions for reducing coal- options for reducingirpaac of eoal use, use related polludon household energy usegray cover SR89tS,
1991 Technical and institudonalspport for plantatonNational afforestadon ap between anagement and forestproject. AR8487. 1990 forest resources sector planningand use; poor
quality ofplantation efforts
Coal pricing in Inefficient use of Reforms in subsidized coalChina, WBDPI38, coal pricing systemYves Albouy .
.. . .
0wk

Indonesia Contuainated Unsafe solid Investment, technicalSecond Jabotabek urban water waste disposal assistance and policyurban development reforms to reduce water-project, AR8339. 199 related pollution
Third Jabotabek Household ommunity participation inurban development waste disposal aste disposal systemsproject. AR8397. 1990
Trade and Excessive louing Trade policy, gains fromdeforestadon, trde, and implications forconference paper, net welfareCados Braga. 1991
Taxadon nd Urban air pollution Role of taxes and subsidiesenvironment, in energy, transport, andEskdland et al petrochemical industries
Second forestry Deforestadon Technical assistance andinsdtutions n concession monitoringconservation pmject,
PR5320. 1990
Perdlizer restructuring project, Environmental Investment in industryPR5231, 1990 impact of together with environmental
fertilizer use management programYogyakarta upland Soil erosionaea development
Technical support for soilroJect, PR5383, 1991 conservation and watershed
,_______________ __________.___| stabilization ;a
Krea Urban air pollution LNG utilization LNG promotionGas udilization study, to reduec airSR8142,1990 _ pollution ;__
Malaysia Reforstation ad Support for reforestationForestry sector sustainable ased on so-l and glohb; gstudy, green cover, forestry its fi1991. Wiens n _ _ _ _ ' '' __ H

Ii
|NepalsOn erosion and Agricultural developmentSL rst loss policy effects, SAL incorporates resource2imanagement
Papua New Guinea Forest loss Institution buildingThe forestry sector a and forestry investmentsWAP'rev-ew,SR8031, 1990
_
Philippines Deforestation and Mangrov Resource rent taxation andEnvironment and soil emsion degradation and institutional reforms in Env.natural resource coastal fishery SECALsector adjustment depletion
rogrm. red cover.1989 PR5452
Sri Lanka Mining coastal Urban water Excess fuelwood New regulation and energyEnvironmental land degradation pollution demand conservationManagenmentStrategy, greencover SR9649, 1991 l
ailand Forest lss and Urban air and Degradation of Under-pricing of dirty fuels; Growth-orientcd policies notCountry economic soil erosion water pollution resources regulate land use sufficiently sensitive tomemorandum, gray associated with distribution andcover ER9627. 1991 accelerated environmental implicationsigrwth
0

Co-ntry I Environmental Area/Problem Policy Issue or ReformCountry __
(Study) Land degradation Water degradation Airand atmo- Energy and trans. Other environ- Within Economy-and dcforestation and depletion spheric pollution portation |mental Sector wideIAsia. I ~ efficiency problems a
EEurope find Ccmrai IAsia.
IBulgaria
l nefricient energy State enterprise and priceStructural adjustment Use meformsloan project. SAL
P5S88, 1991
Environment strategy Industrial pollution Material and Economic restructuringstudy, yeDlow cover, energy intensive implications for pollution and1991 industry energy
Czechoslovakia Inefficient energy Pricing and regulatoryStructural adjustment use reform in energy sector;an project, PR5583,
establish institutional and1991 lpolicy framework for
environmental protectionTurkey Inefricient Reform power pricing andTurkish electricity electricity use provide technicalauthority rstructuring
assistance forloan project. PR5422, environmental assessment1991 . II
Poland Water pollution Air pollution Promote decentralizedEnvironment from industry mgt approach;management project, institutional support
'PR5256, 1990
Energy market Energy use Energy price reformdevelopment, SR8224, efficiencyj;i99
__ __ _ I IL. i i . ~ ~ ~ ~~~~~~~~~~~~~~~~~~~~~~~~~~~~~~ -B.

tSI
Environmental Area/Problem Policy Issue or ReformCountry(Study) Land degradation Water degradalion Airand atmn- Energy and trans- Other environ- Within Economy- -
and deforestation and depiction spheric polluion portation mental Sector wide , .efficiency problems t;
Middle East and North 1 g 8Africa
Algeria Water resource Assess water use inAgriculture: a new over-exploitation agricultureopportunity for growth,SR7419, 1990
Environmental Land degradaton Agricultural water Industrial polludon Population Hazardous waste Industrial expansionprobiems and issues, depletion from promoted growth and management, and water programs need to beyellow cover in French, heavy industries pressure on treatment coordinated with pollution1991, Nadia Saad limited arabic abatementland, tourismand site
_ l _ _____ _ _ _ .degradation
Egypt Need for land Agricultural water Improve efficiency of futureLand reclamation reclamadon supply investments in landsubsector review, reclamationSR8047, 1990
Environmental issues Water resource Potendal use of Tourism Need for Iegislation andpaper, white cover, scarcity identified natural gas development institutional capacity forNadia Saad, 1990 as most serious rmserves has not management; investmentsenvironmental ensured needed for waterconstraint protection of development
sites
Jordan inefficient energy Oil and energy priceEnergy sector study, use reformsSR7984, 1990
. ,~~~~~~~~~~~~~~~~~~~~~~~~~~~~~~~~~~~~~~~~~~-

0
Tunisia Overgrazing Vulnerability to Low efficiency of watcr use Address increase in herdAgricultural drought and size from fodder subsidyexpenditure review, agricultural water during droughltSR9511, 1991 depletion
Small farmers' potential Inadequate land Inefficient use ofand prospects: a conservation irrigation at farm Water pricing reforn Land tenure, reform landtechnical study. level
markets to promote soilSR9323, 1991 conservation
Yemen Massive tubewell Remove irrigationexpansion and subsidiesgroundwaterdepletion
_
C3

Environmental Area/Problem Policy Issue or ReformiCountry __=__._.._.__. _.___
(Study) Land degradation Water degradation Airand atmo- Energy and trans- Other environ- Within Economy-and deforestation and depletion spheric pollution portation mental problems Sector wide :Z.efficiency
Latin America and -Caribbean
__Argentina Energy price and Assess tax and subsidyEnergy sector study, tax distortions schemesSR7993, 1990
Agricultural sciences Pest control and Increased governmentand institutional increased capacity for environmentaldcvelopment project, chemical management1991 ER residues;overfishing
Environmnental issues Soil erosion, Urban waterpaper, SR8141, 1989 salinization. and pollution Biodiversity Institutional reorganization Undertake natural resourceeforestation losses accountingBolivia eforestation;
Technology improvementAgricultural land degradation to reduce wind erosiontechnology and soil erosion and chemical usCdevelopment project, in the Altiplano1991 ER

|BRzjl Increased logging Trade lib., gains from trade,Tnde and and net welfareEnvironment
conferencepaper,1991, CarlosBraga
National Deforestation and Watkr pollution Airpolludion Migrtion and Strengthen governmentEnvironmental soil erosion deforestation in env. agencies, andProject, AR 8146 northern frontier reguladon
Promote LNG Promote more efficientHydrocarbon subsdtution and energy pricingtransport and increased
processing, ER 1991 efficiency ofpetroleum use
Chile Deforestation Industrial pollution Overfishing Resource undervaluation Economic openness andStructural adjustment and rent-seeking contribution to cleanerand environment
industrial technologiesstudy. 1991.Scarsborough
_
Colombia Industrial pollution Technical assistance toIndustrial government and industrialrestructuring and enterprisesdevelopment project,
ER 1991
Costa Deforestation; Resource undervaluation; Cattle industry subsidiesRica pasture land focus on regulatory promote forest clearing;Country Economic degradation approach inequitable land distributionMemorndum, 1989
^(El-Serafy) ._ _
Dominican Republic Limited energy Remove energy subsidiesIssues and options resources andin the energy sector, distorions
SR8234, 1991 _ _ __o
_. e
tig

Ru r Deforstation. Improve land tenure tcoRural devclopment erosion encourage conservation. -- ~poject, AR9437,199I Reduce poverty and absorb
niral labor to reducepressure on resources
Lower Guayas flood Improve drainage Environmental monitoring. Land titling to encourage -control project. ER works in farms mangrove mnanagement, fann improvements1991 and rivers institutional strengthening
Municipal Waste disposal Investment in infrastructureevelopment and and sewage and technical assistancerban infrastructure infrastructure for environnentalproect ER 1991 mnitoring
Haid Deforestation and Eicessive Technical and financialForestry and soil erosion consumption of support to TFAPenvimnmnental fuelwoodprotection pomject, resourcesAR9307. 1991
Honduras |Dforcstation Vnd Poverty and Support for government ASALaddresses lan(I tenureStructural adjustment soti cmsion environmental resource mgt. efforts and forest mgt. issues.credit ptoject, degradation poverty reductionPR5453
Peru Deforestation Industrial pollution Overfishing Resource undervaluation Economic openness andStructural adjustment and rent-seeking contribution to cleanerstudy, 1991 industrial technologiesScarsborough
Venezuela Deforestation Wasteful use of Decline of wildlif Institutional progress Increase fertilizer andEnvirmnnental issues from catte and agricultural, including first environment pesticide prices to reducein Venezuela, gray ilegal logging industrial, and ministry in LAC; stumpage water contaminationcover SR8272, 1991 household water valuation; water charges
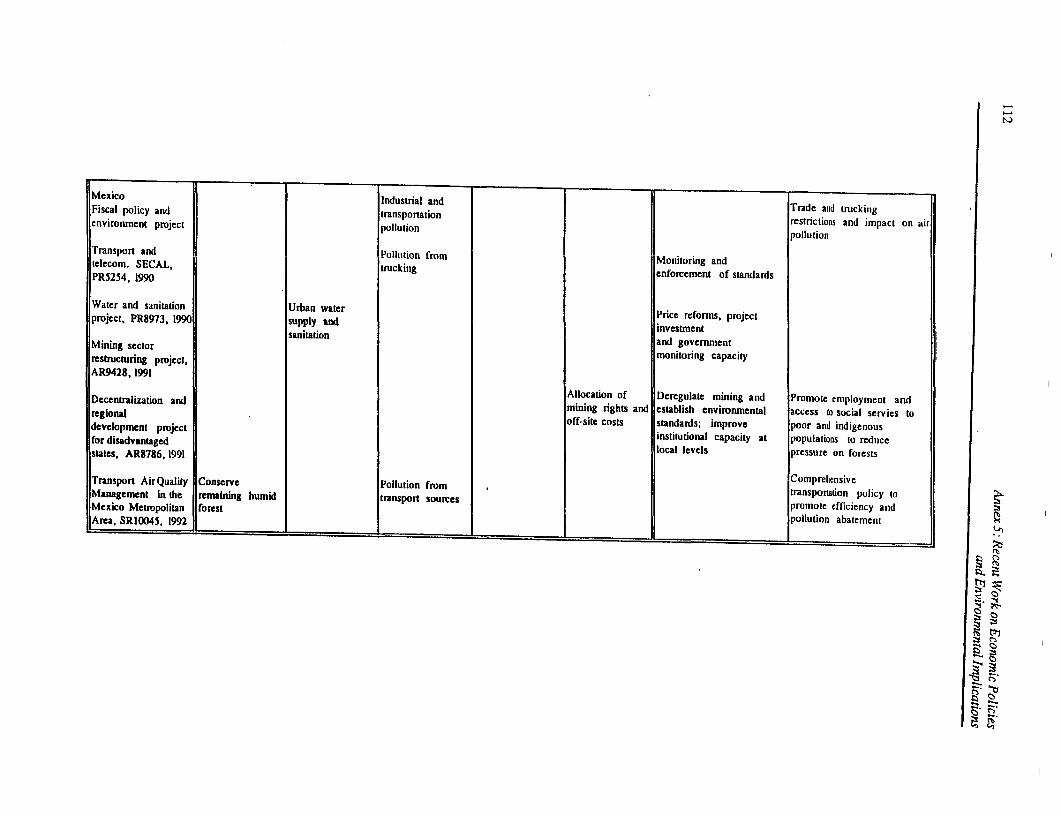
|Mexico Industrial and T Trade and truckingFiscal policy and transportation restrictions and impact on airenvironment project pollution pollution
Transport and Poluio* r- Monitoring andtclecom. SECAL, trucking enforcement of standardsgPR5254, 1.990.
|Water and sanitation Urban water Price reformns, projcct{project, PR89173, 1990 supply aind investmncntsanitation l lMand governgnntdMining sector monitoring capacityrestflcturing project,AR9428, 1991
|Allocation of Deregulate mining and Promote employment andDecentralization an mining rights and cstablish environmental acccss to social servies toregional .rjc|off-site costs standards; improve poor and indigenousdevelopment project institutional capacity at populations to reduccfordisadvantaged t99 local levels pressure on forcstsstates, AR8786, 1991
l l l ~~~~~~~~~~~~~~~~~~~~~~~~~~~~~~~~ComprehensiveTransport Air Quality Conserve Pollution from Ctransportaion policy toManagement in thc remaniing humid transport sourtcs nprmote efficiency andMexico Metropolitan forest pollution abatement aArea, SR10045, 1992 p a Me
I..

Distributors of World Bank PublicationsARCENTINA The Middle EastObeever KENYA SOUTH AFRICA, BOTSWANACaelos Hirsch, SRL 41, Sherif Street Africa Book Servic (EA.) LtL For singie tikiwGalera Guem- Cairo Quaran Hous. Mfangaw Strzt Oxford Univerity PriFlorida 165, 4th Floor-Ofc. 455/465 P.O. Box 45245 Southern Afria1333 Buenas Aires FINLAND Nairobi P.O. Box 1141
Akateeminen KIrjakauppa Cape Town 8C00AUSTRAUA, PAPUA NEW CUINEA. P.O. Box 128 KOREA, REPUBLIC OFFIJI, SOLOMON ISLANDS, SI:00l10 Helsinki 10 Pan Korea Book Corpontion For oreeal'ies Ordm:VANUATU, AND WESTERN SAMOA P.O. Box 101, Kwangwhamun Inational Subcription ServiceD.A. Information Servios FRANCE Seoul P.O. Box 41096648 Whitehors Road World Bank Publiations CrAighauMitcham 3132 66, avenue d'14na MALAYSIA johannesburS2024Victoria 75116 Paris Univermty of Malaya Cooperative
Bookahop, Limited SPAINAUSTRIA GERMANY P.O. Box 1127, Jalan Pantai Baru Mundi-Prensa Librs, S.A.Gerold and Co. UNO-Veriag 59700 Kuala Lumpur Castello37Graben 31 Poppelsdorfer Alle 55 2001M MadridA-IOI Wien D-5300 Bonn 1 MEXICO
WNFOTFC Libria [nternaconal AEDOSBANGLADESH HONG KONG, MACAO Apartado Postil 224860 Consel de Cent. 39Micn Industi Development Asia 2000 Ld. 14060 Tlalpan, Mexio OF. 08009 Barcelona
Asistance Soiety MIDAS) 46.48 Wyndham StreetHouxeS. Road 16 Winning Centre NETHERLANDS SRI LANKA AND THE MALDIVESDhanmondi R/Are 2nd loor De LindeboomInO/ -Publikaties Lake House BookshopDhaka 1209 Central Hong Kong P.O. Box 202 P.O. Box 244
7480 AE Haalksbergen 100, Sir Chittmpilam A.Brach evs INDIA Gardiner MawathaPine View. Ist Floor Allied Publishers PrivateLtd. NEW ZEALAND Colonibo2100 Agrabad Commercial Area 751 Mount Road EBSCO NZ Ltd.Chittgong 4100 Madras -600 002 Private Mail Bag 99914 SWEDEN
New Market Forsingle titrlo76, KD.A. Avenue Brgnch ofta: Auckland Fritzes Fackboksfore,aetKuina 9100 15 J.N. Heredia Marg Regeringsatn 12, Box 1656
Bailard iEstate NIGERIA 510327StockholnBELGIUM Bombay - 400 038 University Pre LimitedJean De Lannoy Three Crowns Building Jericho For sm t :
Av. du Roi 202 13/14 Asf Ali Road Private Mail Bag 5095 Wennergren-Wlliam AB1060 Brussels New Delhi -110 002 [badan P. . Box 1305
S-17125 Sona
CANADA 17 Chittaranan Avenue NORWAYLa Dlffuseur Calcutta -700 072 Narvesen Information Center SWITZERLANDC.. 85, 1501B rue Amp8re Book Department For sixgle riwthBoucherville. Quebec layadeva Hostel Building P.O. Box 6125 Etterad Librarine PayotJ48 5E6 5th Main Road, Gandhinagar N-0602 Osio 6 Case postale 3212
Bangalore - 560 009 CH 1002 LausnneCHILE PAKISTANInvertc GCT S.A. 3-5-1129 Kachiguda Mirza Book Agncy For nawlm oirds:Americo Vespucio Norte 1165 Cron Road 65. ShahrahQuaid-e-Azam lrairie PayotSantiago Hyderabad -500027 P.O. Box No. 729 Service de Abonnements
Lahore 54000 Case poase 3312CHINA Prathana Flab, 2nd Floor H 1002 LausanneChuia Ftnancial & Economie Near Thakom Baug, Navmngpum PERU
Publishing House Ahmedabad -380 009 Editoril Desarrolo SA THAILAND8. Da Fo Si Dong lie Apartado 324 Central DepartmentStoreBeijing Patala House Lima 1 306 Silom Road
16-A Ashok Marg Bangkok
COLOMBIA Lucknow - 226 001 PHILIPPINESInfoenace Ltda. International Book Center TRPDAD & TOBAGO, ANTIGUAApartado Aereo 34270 Central Bazaar Road Suite 1703, GCtyland 10 BARBUDA, BARBADOS,Bogota D.E. 60 Baja Nagar Condominium Tower I DOMINICA GRENADA, GUYANA,
Nagpur 440 010 Ayala Avenue. H.V. dela JAMAICA, MONTSERRAT, ST.COTE D'IVOIRE Cost Extntsion KITTS & NEVIS, ST. LUCA.Centre dEdition et de Diffusion INDONESIA Makati Metro Manila ST. VINCENT I GRENADINES
Africaines (CEDA) Pt Indira limited Systematics Studies Unit04 B.P. 541 Jalan Borobudur 20 POLAND #9 Watts StreetAbidan 04 Plateau P.O. Box 181 International Publishing Service Curm-e
Jakarta 1320 UL Pieknn 31/37 Trinidad West IndiesCYPRUS 00.677 WarzawaCenter of Applied Reserch IRELAND TURKEYCyprus College Covernment Supplies Agency For suoscri;m ordes: Infotei6. Diogenes Street Engorni 4-5 Harcourc Road INS Journals Narlabake Sok. No. USP.O. Box 2006 Dublin2 Ul. Okrezna 3 CagalogluNicosia 02-916 Warzawa Istaibu
ISRAELDENMARK Yozmot Literature Ltd. PORTUGAL UNITD KINGDOMSamfundsUtteratur P.O. Box 56055 Livraria Portugal Microinfo Ltd.Rosnoerns AI# 11 Tel Aviv 61560 Rua Do Carmo 70-74 P.O. Box 3DK-197 FrederiksbergC i200 Lisbon Alton, Hampshire GU342PG
ITALY EnglandDOMINICAN REPUBUC Liosa Commisionaria Sensoni SPA SAUDI ARABIA, QATAREditors Taller. C porA. Via Duca Di Calabria. 1/1 jarir BookStore VENEZUELARestauracion a Lsabel La Cat6llca 309 Casella Postale 552 P.O. Box 3196 ibria del EateAprado de Correos 2190 Z-1 50125 Firenze Riyadh 11471 Aptdo. 60.337Santo Domingo Caracas 1060-A
JAPAN SINGAPORE. TAIWANEGYPT, ARAB REPUBUC OF Eastern Book Service MYANMARBRUNEIAl Ahram Hongo 3-Chome. Bunkyo-ku 113 Information PublcationsAl Caa Street Tokyo Private. Ltd.Cairo Golden Wheel Building
41. Kallang Pudding #04-03Singapore 1334

The World BankHeadquarters European Office Tokyo Office
1818 H Street, N.W. 66, avenue d'Frna Kokusai Building 3-chomWashington, D.C. 75116 Paris, France 1-1 Marunouchi 3-chome
Chiyoda-ku, Tokyo 100, Japan
Telephone: (202) 477-1234 Telephone: (1) 40.69.30.00Facsimile: (202) 477-6391 Facsimile: (1) 40.69.30.66 Telephone: (3) 3214-5001
Telex: wul 64145 WORLDBAN\K Telex: 640651 Facsimile: (3) 3214-3657
RCA 248423 WORLDBK Telex: 26838Cable Address: INTBAFRAD
WASHINGTONDC
Cover design by Walton Rosenquist ISBN 0-8213-2352-0