environmental education: factors behind curriculum ... · environmental education: factors behind...
TRANSCRIPT

ENVIRONMENTAL EDUCATION: FACTORS BEHIND
CURRICULUM ADOPTION
By
SARAH L. HOADLEY
A thesis submitted in partial fulfillment of the requirements for the degree of
MASTERS OF SOCIOLOGY
WASHINGTON STATE UNIVERSITY Department of Sociology
AUGUST 2007

To the Faculty of Washington State University:
The members of the Committee appointed to examine the thesis of Sarah L.
Hoadley find it satisfactory and recommend that it be accepted.
______________________________ Chair ______________________________
______________________________
ii

ENVIRONMENTAL EDUCATION: FACTORS BEHIND CURRICULUM ADOPTION
Abstract
by Sarah L. Hoadley, M.A.
Washington State University AUGUST 2007
Chair: Nella VanDyke
Questions surrounding environmental issues and particularly global warming are
a hot topic in the popular media. In this study, I predict factors that influence U.S. states’
incorporation of environmental curriculum utilizing state theoretical perspectives. While
many scientists, academics and concerned citizens acknowledge the need for
environmental curriculum, few researchers have explored the prevalence of its
availability or the factors behind its adoption. The current research adds to literature on
the state by focusing on education as a form of policy. It also expands the sociology of
education literature by utilizing state theorizing when examining curriculum adoption and
evaluating a subject not previously explored. My findings suggest that business interests,
environmental NGOs, political actors and economic indicators are four factors affecting
curriculum decisions of environmental education. These findings expand state theorizing
and show support for business dominance, Marxist and state-centered theoretical
approaches when examining the issue of environmental curriculum adoption.
iii

TABLE OF CONTENTS
ABSTRACT……………………………………………………………. iii
INTRODUCTION……………………………………………………… 1
LITERATURE REVIEW………………………………………………. 3
BUSINESS DOMINANCE PERSPECTIVES………………….. 4
STATE-CENTERED PERSPECTIVES………………………… 8
DATA AND METHODS……………………………………………..... 10
RESULTS………………………………………………………………. 17
DISCUSSION…………………………………………………………... 20
CONCLUSION…………………………………………………………. 24
TABLES
TABLE 1, VARIABLE AND DATA SOURCE………………… 25
TABLE 2, DESCRIPTIVE STATISTICS.………………………. 26
TABLE 3, LOGISTIC REGRESSION…………………………... 27
TABLE 4, LOGISTIC REGRESSION…………………………… 28
WORKS CITED…………………………………………………………. 29
APPENDIX
CODING SHEET…………………………………………………. 32
CODE BOOK……………………………………………………… 34
iv

Introduction
Education acts as a socializing agent for individuals in society. It both teaches
individuals how to interact and maintain themselves within the capitalist structure and
legitimizes subject areas of most importance and need in our society. Environmental
education is an important area of focus, because global society is currently witnessing an
alarming number of destructive outcomes caused by human environmental degradation.
For example, thousands of plant and animal species have been lost due in part to the
human encroachment on the natural habitat. However, U.S. states vary if they
incorporate environmental education. Although political scientists, sociologists, and
education researchers look at how business and politics affect state policy, few
researchers have focused on factors influencing the specific content of curriculum. I
propose that education policy makers are influenced by economic interests as well as
constituency groups. Specifically, my research seeks to answer the following questions:
What factors contribute to the adoption of environmental education curriculum? Also, do
corporate and political actors play a role in the specific content of curriculum?
Political scientists and sociologists vary on the extent to which they think business
interests influence state policy. Business dominance and Marxist theorists (Block 1987;
Domhoff 1983, 1990; Mills 1956; Useem 1984) suggest that political actors will try to
satisfy business interests while formulating social policy because their very position
relies on business to maintain a healthy economy. Fred Block (1987:13) suggests that
“capitalists attempt to assure responsiveness by the state through various means including
campaign contributions, lobbying activities, and favors to politicians and civil servants”.
State actors receive something from the capitalists and in turn provide capitalist friendly
1

policy. Utilizing Marxist and business dominance theories of the state when looking at
education policy, I predict that states structure education curriculum favorable to the
demands of corporate interests.
Other state theorists disagree about the extent of corporate influence, instead
suggesting that policy makers have a great deal of autonomy (Hooks 1993; Skocpol
1980). State managers rely on citizen support for elected seats in office and therefore
these civil servants must to some degree cater to the demands of the constituency.
Although the state actors may take corporate interests into account, these scholars suggest
that community members and social movements also play a role influencing policy.
Some education researchers echo this state-centered ideology of multiple actors
influencing education decisions. For example, Richard Arum (2000:395) looks at the
organization of the school community and contends that a broader view should be
recognized to include “state regulation, professional associations, and market institutions
as institutional forces…”. This state-centered perspective provides evidence suggesting
that multiple mechanisms affect school policy decisions. However, few education
researchers investigate economic, political and community influences on specific
curriculum topics. My research adds to this literature by exploring the conditions that
contribute to the incorporation of environmental education in the state mandated public
school curriculum.
In order to broaden the understanding of both state and education research I
examine why states have varying environmental education requirements and what factors
influence the adoption of such curriculum. I do so by performing a cross-sectional
content analysis of each state’s public education curriculum content standards, coupled
2

with Census Bureau information, a list of environmental corporate criminals, information
from the National Center for Educational Statistics and a listing of all environmental non-
governmental organizations headquarters in the U.S (referred to as NGO from here on).
Literature Review
State theorists and education scholars provide varying arguments regarding the
degree to which corporations and the community influence education policy. Power elite
and Marxist theorists argue that states provide education that is favorable to corporate
interests (Block 1987; Domhoff 1983, 1990; Mills 1956; Useem 1984). From this
perspective, environmental curriculum would be limited to a modest incorporation of
environmental issues, because corporate polluters do not want states to encourage
environmental activism among citizens. Consistent with this perspective, education
researchers find evidence of corporate influence on both the organizational structure of
schools and curriculum outcomes within the public education system (Apple 1996;
Mitchell and Boyd 2001; Tyack 1974). State-centered theorists, however, focus on
policy as a product of state actors attending to the demands of citizens and social
movements, in addition to corporate interests (Skocpol 1980). In this case, states would
adopt environmental curriculum if pressured by citizens and environmental NGOs.
Similar to this perspective, education researchers consider education policy as a product
of multiple interests, not just the sole interest of the corporate class. In the following
pages I delve into these lines of research and outline the implications of utilizing a
combination of state and state-centered perspectives to argue that 1.) corporate interests
influence education policy and the specific content of curriculum 2.) states’ adoption of
3

environmental education will be determined by multiple factors 3.) states with excessive
environmental degradation will be vested in adopting environmental education in order to
improve the condition of the immediate environment.
Business Dominance Perspectives
State theorists disagree over the extent to which corporate interests influence the
state. Power elite and Marxist theorists (Block 1987; Domhoff 1983, 1990; Mills 1956;
Useem 1984) presume that the corporate class is highly influential in shaping state policy.
Michael Useem (1984) looks at the organization of corporations and contends that
corporate political activities represent a classwide principle of shared interest through the
expansion of influence for informal lobbying, funding of candidates and access to
governmental bodies. For ‘power elite’ theorists, corporations now work on a united
front. Domhoff (1990) similarly suggests that, due to the role of institutions and
structures in capitalist society, industry has seen a dramatic rise in its influence on
politics. My research extends this same theoretical approach by investigating the degree
to which business, or in Domhoff’s words the ‘power elite,’ have influence on state
curriculum content standards. Since manufacturing is a major cause of environmental
degradation, it is in the interest of business or corporate polluters to limit the amount of
information to the public concerning environmental matters. And while corporations
cannot limit all access to such education, I propose that they do play a role in states’
incorporation of environmental curriculum into existing subject areas. In order for
business to continue running profitably, corporate leaders work to influence policy which
promotes capital gains because it benefits the business and state economic conditions.
For example, if a manufacturing plant can produce more product with fewer
4

environmental regulations, then it would behoove business leaders to promote business
interests over environmental concerns. Following this line of reasoning I expect states
with more corporate polluters not to have environmental education requirements, because
business interest would be focused strictly on economics. Environmental sociologists
also address the concern that business will push for policy that represents capital gain. It
is in the interest of business to promote corporate friendly policy because as capitalists,
the goal is economic wealth. Such theorizing suggests that environmental conditions will
reflect the extent of economic wealth achieved by each state (Alario and Freudenburg
2003; Dunlap and Mertig 1992; Fisher and Freudenburg 2004). If a state is successful in
manufacturing, then the expectation is that environmental conditions would not be very
favorable because of the sheer amount of pollution due to production. In line with
environmental sociologists I suggest that business puts pressure on political leaders to
adopt policy which is favorable to economic growth over environmental concerns.
Marxist theorists (Block 1987; Gold, Lo, and Wright 1975; Poulantzas 1978) cast
aside the notion of the one dimensional corporate class model, arguing that the state itself
is set up to promote policy which addresses the long-term needs of further capital
accumulation. Block (1987:8) suggests that the structure of the state acts in a way so
“the capacity of capitalism to rationalize itself is the outcome of a conflict among three
sets of agents- the capitalist class, the managers of the state apparatus, and the working
class”. This perspective suggests that theoretical arguments limited to the direct
influence of corporate class actors may be unrealistic. In many instances members of the
class are either in direct competition with one another, which limits accumulation, or
have limited capacity to look for long-term solutions and thus rely on short-term answers
5

for further gains. Thus, it is difficult for the corporate class as a unified body to
rationalize reform activity. The corporate and working classes have influential power,
but the structure of the state is such that it will act for further capital accumulation even if
this is in direct opposition to corporate or citizen demands. Block (1987:22) states,
“Working-class pressures, for example, might lead to an expansion of educational
resources available for the working class, but there is every likelihood that the content of
the education will be geared to the needs of accumulation…”. This Marxist reasoning
suggests the state structure has the power to determine policy and this will reflect
decisions based on capital growth for the state. In line with such theorizing, the current
research considers the possibility of the state structure rather than the corporate class as a
defining link between political influence and education reform. I do so by measuring
both political and economic indicators for each state.
Why would corporate interests care about education curriculum? The corporate
class cares about specific curriculum content simply because of the significant role that
educational institutions perform for society. Education socializes youth and prepares
them for the work environment. Michael Apple (1996) focuses on the political factors
related to adopting a national curriculum. Apple (1996:25) concludes that “…
unfortunately, rightist groups are indeed setting the political agenda in education …”. He
refers to the rightist groups as a combination of business interests, the New Right and
neoconservative intellectuals (27-28). Apple (1996:95) concludes “the existing
curriculum is never a neutral assemblage of knowledge … it is always based on an
assertion of cultural authority”. In a capitalist society cultural authority represents the
6

perpetuation of economic accumulation. But this accumulation, in many instances, does
not reflect environmental preservation. Apple (1996:96) suggests:
The relationship between schooling and economic, political, and cultural power is not an afterthought. It is a constitutive part of the very being of schooling … Understanding this requires that we see schools—and the curricula, teaching, and evaluation that go on in them—in ways that do not make invisible these connections between what we do as educators and the larger relations of power. Education researchers including Apple (1996) have demonstrated a corporate
influence on education consistent with business dominance and Marxist theories of the
state. For example, David Tyack (1974) utilizes a historical investigation of public urban
schools and concludes that a reform took place in the early twentieth century which
established a corporate organization of administration in public schools. The political
actors involved in the reform were, according to Tyack (1974:137), “leading business and
professional men”. A major function of this reform was to change public curriculum to
fit the corporate class needs of a complacent and uniform work force. Michael Apple
(1996:28) similarly contends that capitalists, “… aim at providing the educational
conditions believed necessary for increasing international competitiveness, profit, and
discipline …”. In addition, Mitchell and Boyd (2001) suggest that reading and
mathematics curriculum within the U.S. has become more uniform in response to trends
in globalization and external social and political processes. My research adds to the
education literature theoretically by applying theories of the state when examining
specific curriculum adoption. Connecting the education and political literature, I seek to
understand the organizational influences that drive the curriculum content of
environmental education.
7

Following Mitchell and Boyd’s (2001) theoretical argument for reading and
mathematics, I add to this body of literature by addressing this issue for environmental
education. Few researchers examine the extent to which corporate interests shape the
content of education curriculum. Based on the political, environmental and education
research discussed thus far, I expect that states with higher numbers of corporate polluters
and a business friendly atmosphere will not have environmental education. In line with
this reasoning I expect states with Republican political control not to have environmental
standards because generally speaking Republicans support pro-business activities.
Business (and specifically manufacturing) is often a source of various forms of air and
water pollution (Jorgenson 2006, forthcoming 2007). It behooves these organizations to
keep this information out of public schools, because a negative response might mean a
capital loss. The money that corporations generate also benefits the state economic
structure, so even if it is the state structure and not business that is influencing
curriculum, it would benefit all involved to go with decisions that promote capital. In
addition to training workers, it might be that corporate interests want schools to restrict
environmental education. Limiting citizen’s knowledge of environmental issues limits
the questioning of harmful practices and continues the steady flow of production.
State-Centered Perspectives
Other state theorists agree with Block’s (1987) belief that state managers and the
working class play a role in policy reform, but they disagree about the extent of influence
the corporate class plays (Hooks 1993; Skocpol 1980). For state-centered theorists such
as Skocpol (1980) state actors must also act on demands from community members and
social movements rather than just the corporate class. Those in political power need to
8

provide legislation that acts in the interest of the constituency voting them into office. In
certain circumstances, it behooves state organizations to implement anti-corporate or
anti-working class policy because in the long run capital accumulation will still be
attained even if a particular population experiences a negative short-term effect. This
theorizing indicates that it is too limiting to simply see all state managers as agents who
act solely for corporate interests. State agents are also influenced by various social
movements and community members.
If states are experiencing more environmental problems, then it is likely that
community members and NGOs may try to influence state managers to incorporate more
environmental education so positive action could be taken to help the states overall
environmental conditions. More toxic waste could mean more environmental education
because state actors are responding to community demands. Members of the community
would care because they have a vested interest in places they lay stake to as ‘home’ and
they do not want to live in environmentally hazardous conditions. This ideology has
been termed “NIMBY,” by the environmental justice scholars meaning, not in my back
yard. An entire literature on Environmental Justice specifically looks at how
communities respond to various kinds of environmental hazards (Jones and Rainey 2006;
Petrie 2006; Stephenson 2005). Although community responses are not always
successful at combating these negative outcomes, this area of literature does serve as an
example of how important it is to consider measurements of community response when
looking at all kinds of policy including education policy. I capture community interest by
including measures of the number of environmental NGO headquarters for each state. A
9

state with several environmental organizations suggests a citizenry who are active,
organized and environmentally conscious.
Other education researchers echo the state-centered approach and investigate
community factors associated with education policy. When discussing the concept of the
school community, Arum (2000) points out that we should apply a broad definition of the
school community. Amy Binder (2000, 2002) takes this approach looking at curriculum
challenges of creationism and afrocentrism in three metropolis areas. Binder (2000,
2002) concludes, similar to what Skocpol (1980) suggested, that varying community
responses to creationism and afrocentrism result in different levels of incorporation of
curriculum. Likewise, social movement theory also predicts that social movement
organizations will have an impact on policy (Amenta, Carruthers and Zylan 1992;
Andrews 1997; Giugni, McAdam and Tilly 1999; McAdam 1999; McAdam and Su
2002). Taking this approach of applying a broad definition to the school community, I
examine political, environmental and social factors that may be associated with
curriculum reform.
Data and Methods
Utilizing individual states as the unit of analysis, I compiled a data set to
investigate factors associated with the incorporation of environmental curriculum. The
number of cases is 50 (curriculum data for Washington D.C. was not available
throughout data collection due to web site construction, so I dropped this case from the
analyses). The data collected are a cross-sectional content analysis of state curriculum
content standards and data from the U.S. Census Bureau, a list of environmental
10

corporate criminals, information from the National Center for Educational Statistics and a
listing of environmental NGO headquarters in the U.S., as I describe in more detail below
(see Table 1 for variables and data sources, see Table 2 for descriptive statistics). In
order to explore the relationship between state curriculum and contextual factors, I
downloaded the curriculum content standards from each state and developed a coding
sheet (see Appendix). The independent variables are measures of the political and
environmental context including environmental performance, environmental
mobilization, political, economic and school indicators.
Dependent Variables
I performed a cross-sectional content analysis on standards of curriculum for
environmental education to construct the dependent variables measuring environmental
education. I collected this information from each state’s Department of Education web
sites in the spring of 2006 from early January through late May. I then coded the
curriculum content standards (see coding sheet Appendix).
The first dependent variable identifies whether the state specifically labeled
“environmental education” in the content standards. I operationalized this variable with a
dichotomous measure coded 1 if the state labeled the curriculum as environmental, or 0 if
not. I obtained this coding by performing a key word search on the home page looking
for “environmental education”. This variable serves as my first indicator of the state’s
overall interest in environmental education. It was clear from the pilot sample that states
discussed issues like conservation and interdependence in existing subject areas even if
they did not label it specifically as environmental education. In fact, the data indicate
only 17 of the 50 states (34%) labeled curriculum as environmental education. Therefore
11

I also evaluated each subject areas (science, social studies, and health) main contents to
determine if any environmental education concepts existed within this curriculum that
was not labeled. I defined a second dependent variable measuring environmental
education by coding whether the state incorporates environmental education beginning in
Kindergarten even if not specifically labeled. Scientists and education researchers have
both addressed the importance of providing this type of curriculum from an early age
(Hudson 2001; Orr 2002; Balsamo 2005). I operationalized this variable with a
dichotomous measure coded 1 if a state had such curriculum beginning in Kindergarten,
and 0 if not. Twenty-nine or 58% of the states require environmental education at this
age even though they do not necessarily label the curriculum as environmental education.
Such a measure represents strong environmental education, because it shows the state’s
willingness and understanding of environmental concerns and a need for action.
Independent Variables
To explore the various factors influencing education policy, I include five sets of
independent variables. The independent variables include measures of the social,
political and educational context that may influence environmental curriculum for each
state. I choose 1994 as my data collection year, because the earliest year curriculum was
revised was 1995 (Alabama, Colorado, and Montana) and I wanted my independent
variables to be measured before this date. Due to the timing of Presidential elections, I
measured the popular vote cast for President in 1992. Specifically, I focus on five sets of
independent variables that center on- environmental performance, environmental
mobilization, political, economic, and educational indicators (see Table 1 for variables
and data sources).
12

The first set of variables looks specifically at environmental performance in each
state. My first measure is the number of corporate polluters found in each state. The
count of corporate polluters came from the corporate polluters list compiled by Russell
Mokhiber, looking at the top 100 corporate criminals of the 1990s. This list includes 14
categories of crime, but for this project only environmental offenses were used, which
resulted in an N=38. I tallied these 38 cases according to the number of offenses for each
state (www.corporatecrimereporter.com). The second variable is the number of
hazardous waste sites in each state. This measure was constructed by dividing the
number of hazardous waste sites listed on the National Priority List by the total acreage
of state land. The third variable is the amount of toxic release in each state. This
measure was constructed by evaluating how much toxic release was emitted divided by
the total state acreage. I collected both the toxic release and hazardous waste site
information from the Census Bureau Statistical Abstract (U.S. Bureau of the Census
1995, 1997). All of these variables, in addition to the percentage of employees
concentrated in manufacturing discussed below help test my competing hypotheses. The
first outcome might be that higher percentages of toxic release and hazardous waste sites
might have a negative effect on curriculum, which would reflect a state response. This
supports my business dominance and Marxist (first) hypothesis that business and the state
structure influence education. If business dominance and Marxist theories of the state are
correct and corporate interests do influence state policy then I would expect a high
concentration of corporate polluters and toxic releases to coincide with not having
environmental education. On the other hand, political actors might experience pressure
from citizens and social movements to clean up the environmental conditions, which
13

supports my state-centered (second) hypothesis that constituency concerns influence
education decisions. Political actors would feel compelled to act on citizen demands
because they are voted into office by the constituency.
The second set of variables capture environmental mobilization which illustrates
the institutional factors associated with environmentalism. The environmental
mobilization measure includes a count of how many environmental NGO headquarters
are in each state, demonstrating community involvement and constituency concerns. The
count of environmental NGO headquarters came from The Encyclopedia of Associations,
vol. 11. The state-centered hypothesis declares: states with pollution and environmental
organizations will have environmental education requirements. Constituents would be
organized in states with environmental NGO headquarters and the political actors may
feel pressure to fill the demands of the voters.
The third set of independent variables focus on political representation because
we would expect liberals to support pro-environmental curriculum more than
conservatives. These measures are labeled political indicators and all four were
measured dichotomously. The first variable equals 1 if the majority of the state voted for
the Democratic candidate for president, and 0 if not. The second variable equals 1 if the
state elected in a Democrat Governor, or 0 if not. The third variable equals 1 if the state
had both a majority Democrat in the Senate and the House of Representatives, and 0 if
not. The final variable equals 1 if the state had a mixture of Democrat and Republican
representation in the Senate and the House of Representatives, and a 0 if not. All four
variables were constructed from the Census Bureau Statistical Abstract (U.S. Bureau of
the Census 1997). 1 Special thanks to Erik Johnson for sharing these data.
14

The fourth set of independent variables gives an idea of the type of reliance each
state has for industry that may be causing environmental degradation. I include two
measures of a state’s wealth. The first is a ratio of the state’s expenditures to the
revenues and the second is a percentage of how many of the community members are
living below the poverty line. The wealth of a state helps illustrate the potential for
business to influence policy. If a state is relatively poor, it is more likely to rely on
business to maintain a healthy economy, thus allowing more business influence on
policy. In addition, I include a measure of the percentage of the work eligible population
in the state working in manufacturing. Such a measure could have one of two effects. If
this measure has a negative effect on environmental education, it may be because the
citizenry rely on manufacturing for income so they influence policy to maintain business
and state profit. If the size of the manufacturing sector has a positive effect on
environmental education, it may be because the citizenry sees the pollution, feels the
effects, and takes action to promote environmental regulations because they want a
healthy environment to raise their families and enjoy life. All three measures of state
industry reliance come from the Census Bureau Statistical Abstract (U.S. Bureau of the
Census 1995).
The final variable is the number of schools in a state turned into a dummy
variable labeled as a 1 if a state has an above average number of schools (above average
was 1,954 schools or above) and 0 if not (National Center for Educational Statistics
1994). This particular variable acts as a control variable for my analyses. I control for
the number of schools in a state to focus on political and economic factors for curriculum
adoption and comprehensiveness in relation to the size of the educational system. I used
15
a dichotomous measure because the number of schools was collinear with the number of
corporate polluters. In addition to the number of schools as a control variable, the
number of hazardous waste sites and toxic releases also act as control variables in my
analyses. It was important for me to include such measures because these environmental
indicators reflect if environmental pollution is an issue in a state. Although these three
control variables are not theoretically driven, they do help to control for the
environmental performance and educational institutional size for the analyses.
I began my analyses by conducting diagnostics to make certain my data did not
violate statistical assumptions. Findings indicated that some variables were correlated
with population, so instead of including this as a control variable I transformed variables
and divided by the total population of the state to include this control. Both the number
of corporate polluters and the number of NGOs include such a control. In addition, I also
transform several variables to control for state size by dividing by the total state acreage.
Both the number of hazardous waste sites and toxic releases were transformed in this
manner. Thus, I was able to control for both population and state size by transforming
variables. Other collinearity problems were solved by transforming variables as
described above.
Logistic Regression
To test my hypotheses, I conducted logistic regression on my two dependent
variables, both of which are measured as dummy variables. The purpose of these
analyses was to predict what factors account for the incorporation of environmental
curriculum. The first model predicts how a state performs environmentally by evaluating
if industry pollutes and to what extent. The second model illustrates the effects of
16

community presence. The third model evaluates the relevance of political parties. And
the fourth and fifth models look at the multiple factors together.
Results
I began by investigating the first dependent variable, which measures whether a
state has curriculum labeled as environmental or not. Model 1 of Table 3 examines the
extent to which corporate polluters, hazardous waste sites and toxic releases influence the
adoption of environmental education. The first theoretical assumption suggests that
having corporate polluters will negatively influence the adoption of environmental
education. The results indicate that having corporate polluters is significant (p<.10), but
rather than it having a negative effect as business dominance and Marxist theories
predict, having corporate polluters is positively associated with the inclusion of
environmental education. Model 1 shows that each additional corporate polluter is
associated with a 1.6 times greater likelihood that a state will adopt environmental
education. This significance remains through Model 5, which shows little support for the
business dominance and Marxist theorizing. This finding suggests that perhaps
constituency as opposed to business concerns play a more significant role in curriculum
adoption as state-centered theorists suggest.
Model 2 tests the second theoretical assumption, which suggests that having
environmental NGOs would have a positive influence on environmental education and
reflects environmental mobilization. The results indicate a non-significant effect,
suggesting little support for the state-centered approach that constituency concerns
17
influence the adoption of environmental standards. This finding is puzzling when
considering the finding discussed above. Future research would evaluate this in more
depth and consider alternative variables that could represent varying aspects of a
constituency.
Model 3 examines the influence of political indicators. The results show an
interesting outcome, which suggests that local political actors play a significant role in
education policy. Having a Democratic Governor has a significant positive effect on
environmental curriculum. Including the other indicators (Models 4 & 5) increases the
significance of the Democratic Governor to the p<.05 level. Having a Democratic
Governor is associated with an 8.49 times greater likelihood that a state will adopt
environmental education. Such results indicate that while it is important to have a
Democratic Governor for a state to adopt environmental curriculum, it appears as though
constituency groups are not a significant factor in whether a state has any explicitly
distinguished form of environmental education. All three economic indicators in Model
5 also show non-significance. In addition, including the number of schools in Model 5
shows a non-significant effect.
The above results identify the factors associated with states adopting
environmental curriculum. Next I explore how the theoretical assumptions relate to the
comprehensiveness of mandated environmental education (the dependent variable is
coded as a 1 if the state mandates environmental material starting in Kindergarten
whether labeled or not, and 0 if not). Model 1 of Table 4 examines the extent to which
having corporate polluters, hazardous waste sites and toxic releases influence the
comprehensiveness of environmental education beginning in Kindergarten. The first
18

theoretical assumption suggests that having corporate polluters negatively impacts
environmental education. The results indicate that having corporate polluters is not
significant until Model 5, when all other variables are included in the analyses
(significant p<.10). These results are consistent with both business dominance and
Marxist theorizing, which would predict a negative effect for this variable because if
business is polluting then business interests would not want to promote environmental
education. Having corporate polluters is associated with a 0.477 times less likelihood
that a state will include environmental education in existing subject areas beginning in
Kindergarten whether labeled or not.
Model 2 tests the second theoretical assumption which suggests that having
environmental NGOs will positively influence comprehensive environmental education,
and reflects environmental mobilization. The results indicate a significant effect (p<.05),
lending support to the state-centered approach that constituency concerns influence
comprehensive environmental education. Each additional environmental NGO
headquarter in a state is associated with a 3.97 times greater likelihood of that state
providing environmental education starting in Kindergarten whether labeled or not. This
measure retains significance in the saturated model. Thus, having more environmental
NGO headquarters in a state is significantly related to environmental education policies.
Model 3 examines the influence of political indicators. Having both a Democratic
Congress and Mixed Congress is significant at the p<.10 level. However, these variables
become non-significant as other variables are added to the model. The Democratic
Governor variable becomes significant in Model 4 first at the p<.10 level and then in
Model 5 at the p<.05 level. Having a Democratic Governor is associated with a 7.82
19

times greater likelihood of that state providing environmental education than states with
governors from other political parties. Such results are consistent with my expectation
that having both environmental NGO headquarters and liberal political actors influences
the comprehensiveness of environmental education. In addition, in Model 5 having a
population below the poverty line is also significant at the p<.05 level. A state has a 1.47
greater likelihood of having environmental education in Kindergarten whether labeled or
not, if some of the state population is below the poverty line. This is counter to my
predictions, because I would expect a state with financial concerns to be focused on
economics which generally favors corporate policy over environmental concerns.
Finally, Model 5 shows that the effect of the number of schools in a state is non-
significant. The number of schools in a state does not significantly affect the
comprehensiveness of environmental education beginning in Kindergarten.
Discussion
My research adds to both state literature and sociology of education by evaluating
the factors of environmental curriculum adoption and comprehensiveness. My findings
suggest that environmental performance (especially if a state has corporate polluters),
environmental mobilization, political actors, and an economic indicator influence a
state’s decision to adopt and include comprehensiveness of this education in existing
subjects. More specifically and in line with specific aspects of business dominance,
Marxist and state-centered perspectives, I find that business, the state structure, and
constituency demands play a role in a state’s adoption of and comprehensiveness of
environmental education. Past state research focused on various forms of reform, but
20

never specifically education policy. Education researchers consider how state actors,
corporate influence and constituency demands influence education reform, but seldom
consider effects on specific curriculum. While the business dominance perspective solely
focuses on business in relation to reform, the Marxist perspective also includes the state
and the working class as influential powers. According to business dominance and
Marxist theorizing, states with a conservative political representation and a larger number
of corporate polluters are apt not to have environmental education. A political system
dominated by conservatives would suggest a business friendly environment to advance
the capitalist free market economic structure. I find mixed support for both the business
dominance and Marxist perspectives. Table 3 indicates a positive effect for
environmental education which suggests the opposite of what business dominance and
Marxist perspectives propose. On the other hand Table 4 indicates a negative effect and
is suggesting a relationship between business and policy consistent with business
dominance and Marxist theorizing. One implication of this finding is that it appears as
though business does have some sort of influence on the comprehensiveness of
environmental content standards, but not for the adoption of such curriculum. State
actors must perform a balancing act and meet the demands of citizens and NGOs as the
state-centered perspective suggests. But state actors must also meet the demands of
corporations as the business dominance and Marxist perspectives suggest.
The current research fills a gap in both the state and education literature, by
focusing specifically on environmental education. A possible weakness in my analyses is
the lack of ability to look at the specific actors involved in curriculum reform. It is
possible that corporate influence has additional relationships to education not currently
21

measured. As an example, perhaps a relationship exists between corporate polluters and
a state’s Governor. It could be that corporate polluters serve on committees that have
influence on state politics. Such an interaction would suggest that corporate influence
would show up in the political indicators rather than in corporate measures. A possible
way to get at such a relationship in future research is to incorporate network analysis to
investigate how the corporate class is involved in each state’s reform.
To further the understanding of constituency demands on state actors for
education decisions, I utilize the second theoretical perspective incorporating state-
centered reasoning. According to this perspective, states with a Democratic political
representation, more environmental NGO headquarters, and those experiencing
environmental pollution will be more prone to the incorporation of environmental
standards. If citizens are aware of environmental pollution, more pressure will be placed
on political actors to incorporate environmental education. My findings show mixed
results. While constituency concerns appear to be significant for the second dependent
variable looking at the comprehensiveness of environmental education, they are not
significant when looking at the first dependent variable based on adoption of
environmental education. Perhaps it is easier for NGOs to have influence on specific
education projects rather than having an effect on the adoption of curriculum. In many
states NGOs provide information and resources for specific community projects and
these include an environmental focus. Perhaps these mixed finding are a result of
constituency concerns being addressed through programming in the schools rather than
petitioning for curriculum adoption.
22

State curriculum standards are influenced by political actors and social
movements. I find such a relationship by looking at a new area of curriculum. Utilizing
state theory shows that state actors affect education decisions. As current environmental
conditions continue to degrade, understanding the influential forces that contribute to
environmental education will be important at the local, state and national level. Some
education scholars have gone as far as speculating that how we plan for environmental
education now will have substantial effects on the environmental state in the future
(Hudson 2001; Orr 2002).
While the current research incorporates both environmental performance and
mobilization indicators, it does so while also recognizing that additional variables might
be useful in explaining further the factors behind environmental education curriculum
adoption and comprehensiveness. With incorporation of supplementary indicators, such
as environmental standards, the current research could be expanded upon. For example,
it might be helpful in future research to include other environmental mobilization
indicators like a time series investigation of a state’s environmental legislation.
Extending the analysis to include a time series dimension would allow for tracking the
individual state’s circumstances surrounding environmental legislation in relation to
environmental education.
As a result of the current findings, I suggest that evaluating the incorporation of
environmental education in public schools is aided by combining aspects of business
dominance, Marxist and state-centered theorizing. However, to better understand the
corporate and community influence on education, future research could benefit from
looking at specific actors involved in curriculum reform.
23

Conclusion
The results indicate that political actors, specifically a state’s Governor,
environmental NGO headquarters, corporate polluters and the economic situation of a
state’s population have an influence on environmental curriculum and
comprehensiveness. The analyses reveal mixed findings, which indicate that further
empirical testing is needed surrounding this subject matter.
While my study explores a new area of research, to improve and expand the
project I would like to look at a time series analysis following the states that have
curriculum labeled as environmental education. Understanding the conditions of a state
prior to and after the inception of environmental education could provide new insight into
the social actors and organizations that influence education decisions.
States’ environmental education standards are important for all in the global
society to understand because the environment will continue to be a topic of debate and
concern in the years to come. From a local level, empowering future citizenry with
environmental knowledge is necessary information which can be incorporated into
existing subject areas such as science and social studies. To reduce air pollution, provide
clean and safe water supplies and encourage rather than destroy biological diversity,
students must be given the tools and hands on experience to understand real world
results.
24

TABLE 1: Variable and Data Source Category Variable Data Source
Dependent Environmental Education labeled Department of Education websites Environmental Education in K Department of Education websites Independent Environmental Performance Indicators Number of corporate polluters Corporate Crime Reporter by Russell Mokhiber www.corporatecrimereporter.com Number of hazardous waste sites 1995 Census Statistical Abstract Amount of toxic releases 1997 Census Statistical Abstract Environmental Mobilization Indicators Number of non-governmental organizations (NGOs) The Encyclopedia of Associations Political Indicators Majority popular vote for President 1997 Census Statistical Abstract Majority popular vote for Governor 1997 Census Statistical Abstract Control of House and Senate 1997 Census Statistical Abstract Economic Indicators Ratio of expenditures to revenue 1996 Census Statistical Abstract Percent below poverty line 1997 Census Statistical Abstract
Percent of population in manufacturing 1995 Census Statistical Abstract
School Indicators Number of schools in state National Center for Educational Statistics
www.nces.ed.gov/
25

TABLE 2: Descriptive Statistics Variables Range Mean/Freq Dependent Environmental Education labeled 0-1 0= 66% 1= 34% Environmental Education in K 0-1 0= 42% 1= 58% Independent Number of corporate polluters 0-6 0.7 (1.39) Number of hazardous waste sites 1-108 25.66 (26.40) Toxic releases
(1,000 pounds) 512-
213,061 39,339 (43,730) Number of environmental NGO headquarters 0-62 6.96 (10.25) Majority Democratic vote for President '92 0-1 0= 36% 1= 64% Democratic Governor 0-1 0= 64% 1=36% Democractic House and Senate 0-1 0= 86% 1= 14% Mixed House and Senate 0-1 0= 36% 1= 64% Ratio of expenditures to revenues 0.78-1.08 0.92 (0.59) Percent below poverty line 7.6-25.7 13.07 (3.93) Number of manufacturing employees 10-1,771 366 (368) Number of schools in state- dummy 222-9690 0= 64% 1= 36% Note: Numbers in parentheses are standard deviation for non-dichotomous measures.
N=50
26

TABLE 3: Logistic Regression of Environmental Education on Selected Independent Variables, 1994 Model 1 Model 2 Model 3 Model 4 Model 5 Top Corporate Polluters 0.474* 0.548** 0.569* (0.253) (0.283) (0.330) [1.606] [1.729] [1.767] Number of Hazardous Waste Sites- intesity -147.867 -128.243 -202.547 (160.921) (162.776) (239.452) [6.060] [2.020] [1.080] Number of Toxic Releases-intensity -0.459 -0.952 -0.362 (0.975) (1.287) (1.500) [0.632] [0.386] [0.697] Number of Environmental NGO Headquarters 0.715 0.914 0.341 (0.616) (0.850) (1.283) [2.044] [2.493] [1.406] Majority Vote for Democrat President 0.396 1.054 0.812 (0.811) (1.059) (1.060) [1.486] [2.869] [2.253] Democrat Governor 1.155* 1.802** 2.138** (0.651) (0.808) (0.959) [3.175] [6.067] [8.487] Democrat Congress -1.971 -2.222 -1.593 (1.381) (1.604) (1.898) [0.139] [0.108] [0.203] Mixed Congress -0.907 -2.034* -1.698 (0.899) (1.206) (1.213) [0.404] [0.131] [0.183] Ratio of Expenditures to Revenues 1.750 (7.170) [5.753] Percent Below Poverty Line -0.040 (0.146) [0.960] Percent Population in Manufacturing 12.181 (9.830) [0.195] Number of Schools-dummy 0.891 (1.287) [2.439] Constant -0.662 -0.938** -0.573 -0.857 -4.319 (0.450) (0.393) (0.665) (0.767) (7.141) Pseudo R2 0.090 0.021 0.088 0.229 0.297 N=50 Notes: Standard errors are in parentheses; Odd ratios are in brackets. ***p<.01 **p<.05 *p<.10
27
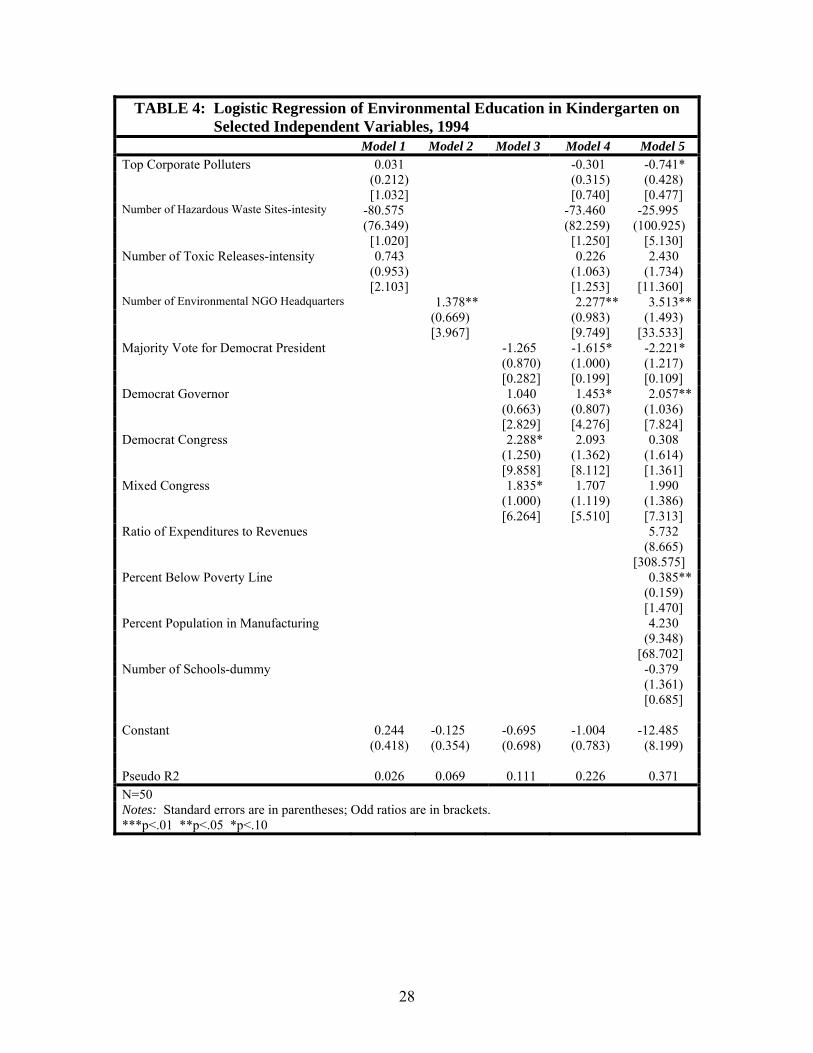
TABLE 4: Logistic Regression of Environmental Education in Kindergarten on Selected Independent Variables, 1994 Model 1 Model 2 Model 3 Model 4 Model 5 Top Corporate Polluters 0.031 -0.301 -0.741* (0.212) (0.315) (0.428) [1.032] [0.740] [0.477] Number of Hazardous Waste Sites-intesity -80.575 -73.460 -25.995 (76.349) (82.259) (100.925) [1.020] [1.250] [5.130] Number of Toxic Releases-intensity 0.743 0.226 2.430 (0.953) (1.063) (1.734) [2.103] [1.253] [11.360] Number of Environmental NGO Headquarters 1.378** 2.277** 3.513** (0.669) (0.983) (1.493) [3.967] [9.749] [33.533] Majority Vote for Democrat President -1.265 -1.615* -2.221* (0.870) (1.000) (1.217) [0.282] [0.199] [0.109] Democrat Governor 1.040 1.453* 2.057** (0.663) (0.807) (1.036) [2.829] [4.276] [7.824] Democrat Congress 2.288* 2.093 0.308 (1.250) (1.362) (1.614) [9.858] [8.112] [1.361] Mixed Congress 1.835* 1.707 1.990 (1.000) (1.119) (1.386) [6.264] [5.510] [7.313] Ratio of Expenditures to Revenues 5.732 (8.665) [308.575] Percent Below Poverty Line 0.385** (0.159) [1.470] Percent Population in Manufacturing 4.230 (9.348) [68.702] Number of Schools-dummy -0.379 (1.361) [0.685] Constant 0.244 -0.125 -0.695 -1.004 -12.485 (0.418) (0.354) (0.698) (0.783) (8.199) Pseudo R2 0.026 0.069 0.111 0.226 0.371 N=50 Notes: Standard errors are in parentheses; Odd ratios are in brackets. ***p<.01 **p<.05 *p<.10
28

Works Cited
Alario, Margarita and William R. Freudenburg. 2003. “The Paradoxes of Modernity: Scientific Advances, Environmental Problems, and Risks to the Social Fabric?” Sociological Forum. 18:193-214. Amenta, Edwin, Bruce G. Carruthers and Yvonne Zylan. 1992. “A Hero for the Aged? The Townsend Movement, the Political Mediation Model, and U.S. Old-Aged Policy, 1934-1950” American Journal of Sociology. 98:308-339. Andrews, Kenneth T. 1997. “The Impacts of Social Movements on the Political Process: The Civil Rights Movement and Black Electoral Politics in Mississippi” American Sociological Review. 62:800-819. Apple, Michael W. 1996. Cultural Politics and Education. Teachers College, Columbia University. Arum, Richard. 2000. “Schools and Communities: Ecological and Institutional Dimensions.” Annual Review of Sociology. 26:395-418. Balsamo, James Jr. 2005. “Our Future is in the Hands of Our Young People! Believe it! Embrace it!” Journal of Enivornmental Health. 67:4-6. Binder, Amy J. 2000. “Why Do Some Curricular Challenges Work While Others Do Not? The Case of Three Afrocentric Challenges.” Sociology of Education. 73:69-91. ----------. 2002. Contentious Curricula Afrocentrism and Creationism in American Public Schools. Princeton University Press. Block, Fred. 1987. Revising State Theory Essays in Politics and Postindustrialism. Temple University Press. Domhoff, G. William. 1983. Who Rules America Now? Simon & Schuster, Inc. ----------. 1990. The Power Elite and the State How Policy is Made in America. Walter de Gruyter, Inc. Dunlap, Riley E. and Angela G. Mertig. 1992. American Environmentalism: The U.S. Environmental Movement, 1970-1990. Taylor & Francis. Fisher, Dana R. and William R. Freudenburg. 2004. “Postindustrialization and Environmental Quality: An Empirical Analysis of the Environmental State.” Social Forces. 83(1):157-188.
29

Gale Research Inc. 1956-2003. The Encyclopedia of Associations, vol. 1, National Organizations of the U.S. Detroit, MI: Gale Research Co. Giugni, Marco, Doug McAdam and Charles Tilly (eds). 1999. How Social Movements Matter. University of Minnesota Press. Gold, David, Clarence Lo and Erik Wright. 1975. “Recent Developments in Marxist Theories of the Capitalist State.” Monthly Review. 27:29-43. Hooks, Greg. 1993. “The Weakness of Strong Theories: The U.S. State’s Dominance of the World War II Investment Process.” American Sociological Review. 58:37-53. Hudson, Stewart J. 2001. “Challenges for Environmental Education: Issues and Ideas for the 21st Century.” Bioscience. 51:283-289. Jones, Robert Emmet and Shirley A. Rainey. 2006. “Examining Linkages between Race, Environmental Concern, Health and Justice in a Highly Polluted Community of Color.” Journal of Black Studies. 36:473-496. Jorgenson, Andrew K. 2006. “The Transnational Organization of Production and Environmental Degradation: A Cross-National Study of the Effects of Foreign Capital Penetration on Organic Water Pollution Intensity.” Social Science Quarterly. 87:711-730. ----------. Forthcoming (permission granted from Dr. Jorgenson to use this piece) 2007. “Does Foreign Investment Harm the Air We Breath and the Water We Drink? A Cross-National Study of Carbon Dioxide Emissions and Organic Water Pollution in Less-Developed Countries, 1975-2000.” Organization & Environment. McAdam, Doug. 1999 [1982]. Poltical Process and the Development of Black Insurgency, 1930-1970. University of Chicago Press. McAdam, Doug and Yang Su. 2002. “The War at Home: Antiwar Protests and Congressional Voting, 1965 to 1973.” American Sociological Review. 67:696-721. Mills, C. Wright. 1956. The Power Elite. Oxford University Press. Mitchell, Douglas E. and William L. Boyd. 2001. “Curriculum Politics in Global Perspective.” Educational Policy. 15:58-75. National Center for Educational Statistics. 1994. U.S. Department of Education. www.nces.ed.gov .
30

Orr, David W. 2002. “Imagine a World Where our Leaders are Educated.” The Ecologist. 32:38-40. Petrie, Michelle. 2006. “Environmental Justice in the South: An Analysis of the Determinants and Consequences of Community Involvement in Superfund.” Sociological Spectrum. 25:471-489. Poulantzas, Nicos. 1978. State, Power, Socialism. New Left Books. Skocpol, Theda. 1980. “Political Response to Capitalist Crisis: Neo-Marxist Theories of the State and the Case of the New Deal.” Politics and Society. 10:155-201. Stephenson, Bruce. 2005. “Urban Environmental History: The Essence of a Contradiction.” Journal of Urban History. 31:887-898. Tyack, David B. 1974. “Part IV- Centralization and the Corporate Model: Contest for Control of Urban Schools, 1890-1940.” From The One Best System. Harvard Press. U.S. Bureau of the Census. 1995, 1996, 1997. Census Statistical Abstract. Washington, DC: U.S. Government Printing Office. www.census.gov. Useem, Michael. 1984. The Inner Circle Large Corporations and the Rise of Business Political Activity in the U.S. and U.K. Oxford University Press.
31

Date: _________________________ State: _________________________ Websites: _______________________________________________________________ _______________________________________________________________ _______________________________________________________________ Year of last curriculum revision: ______________________ Envr. Education:
□ Yes □ No
□ Yes and link to non-profit org. □ No, but link to non-profit
□ Other ________________________________________________ Beginning Grade Level:
□ Kindergarten □ First Grade □ Second Grade
□ Third Grade □ Fourth Grade □ Fifth Grade
□ Sixth Grade □ Seventh Grade □ Eighth Grade
□ High School □ Other ______________________________ Subject area of focus:
□ Science □ Social Studies □ Science & Social Studies
□ Health □ Technology □ Government and Citizenship
□ Combination __________________________________________________
□ Other ________________________________________________________
32

Focus: ______________________________________________________________________________________
______________________________________________________________________________________
______________________________________________________________________________________
______________________________________________________________________________________
______________________________________________________________________________________
______________________________________________________________________________________
______________________________________________________________________________________
Standards:
______________________________________________________________________________________
______________________________________________________________________________________
______________________________________________________________________________________
______________________________________________________________________________________
______________________________________________________________________________________
Teaching Methods:
□ Books/Texts □ Field Trips □ Hands on experience
□ Instruction □ NGO Programs □ Technology
□ Other _______________________________________________________ Comments:
33

CODE BOOK The contents within various web sites will be examined to determine the level of environmental education opportunities in public education and the level of environmental activity within each U.S. state. These measurements will be determined by evaluating U.S. Census Bureau information, a list of environmental corporate criminals, information from the National Center for Educational Statistics, and a list of environmental NGO headquarters in the U.S. 1. Date 2. State Standard Census codes. 3. Population Size Using Census Statistical Abstract, this information was pulled from the 1997 Statistical Abstract, Section 1-Population. http://www.census.gov/compendia/statab/
POP '94 Total (1,000)- resident population total 4. Websites Each states Department of Education web site. 5. Date of Last Curriculum RevisionDate of last curriculum revision was determined by investigating each states department of education web site. If states have environmental education in multiple subject areas that had been revised at different time periods, then the last possible revision date was used. So, for example if Illinois had environmental education in both social studies and science, but the revisions of curriculum in these areas was revised at different time periods social studies 1995, science 2000, then the date used for the last curriculum revision would be 1995. YLCR- year of last curriculum revision 6. Environmental Education EEY- environmental education yes EEYw/L- environmental education yes with links to information EEN- environmental education no EENw/L- environmental education no, but with links to information EEO- environmental education other First I performed a general search on each states department of education web site to see if anything labeled as environmental appears. Even if a state did not explicitly say they had environmental education when I did the search, I still evaluated the actual curriculum to see if environmental education materials are still incorporated, but just not labeled.
34

7. Beginning at what education level BGLK- beginning grade level kindergarten BGL1- beginning grade level 1st grade BGL2- beginning grade level 2nd grade BGL3- beginning grade level 3rd grade BGL4- beginning grade level 4th grade BGL5- beginning grade level 5th grade BGL6- beginning grade level 6th grade BGL7- beginning grade level 7th grade BGL8- beginning grade level 8th grade BGLHS- beginning grade level high school BGLO- beginning grade level other This measure reflects the grade level that environmental education is first introduced to students. This measure reflects both environmental education that is labeled as such and curriculum that is not specifically labeled environmental education, but is still incorporated in existing subject areas (science, social studies, and health). 8. Subject area focus SAFS- subject area of focus science SAFST- subject area of focus science and technology SAFLS- subject area of focus life science SAFESS- subject area of focus earth and space science SAFE- subject area of focus ecology SAFES- subject area of focus environmental science SAFPSP- subject area of focus science personal and social perspective SAFBS- subject area of focus biological science SAFPS- subject area of focus physical science SAFSS- subject area of focus social science SAFG- subject area of focus geography SAFGC- subject area of focus government and civics SAFEC- subject areas of focus economics SAFHI- subject area of focus history SAFH- subject area of focus health SAFEH- subject area of focus environmental health SAFHL- subject area of focus healthy lifestyles SAFPCH- subject area of focus personal and community health SAFRAR- subject area of focus risk assessment and reduction SAFT- subject area of focus technology SAFFCS- subject area of focus family and consumer science SAFVS- subject area of focus vocational studies SAFC- subject area of focus cultural Here the specific subject area/s that educators are to focus on was identified.
35

9. Focus of Curriculum FC- focus on conservation FRC- focus on responsible citizenship FE- focus on ecology FI- focus on interdependence FPA- focus on pollution awareness FHP- focus on historical perspective FT- focus on technology FEH- focus on environmental health FIA- focus on informed action Here the record of curriculum objectives was determined. A focus on conservation discussed conservation of resources or the 3 r’s reduce, reuse, and recycle. A focus on responsible citizenship discussed reasoning/logic of scarcity, particularly in economic terms. A focus on ecology discussed how living organisms function. A focus on interdependence discussed interdependence of physical environment and humans. A focus on pollution awareness discussed pollution as a health problem. A focus on the historical perspective discussed the relationship between human communities and the physical environment (human relationship with climate, subsistence, resources, geography). A focus on technology discussed how technology impacts culture and the environment. A focus on environmental health discussed how the human body is affected by environmental conditions. A focus on informed action discussed how community activities can promote a healthy environments and also participating in local community projects. 10. Teaching Methods: TMBT- teaching method books/texts TMI- teaching method instruction TMFT- teaching method field trips TMNGOP- teaching method NGO programs TMHE- teaching method hands on experience TMT- teaching method technology TMO- teaching method other Here the types of activities were identified and coded. 11. Percent (%) Below Poverty Line Using Census Statistical Abstract, this information was pulled from the 1997 Statistical Abstract, Section 14-Income, Expenditures, and Wealth. http://www.census.gov/compendia/statab/
%PBPL '94- percent of persons below poverty level
36

12. Ratio State Revenues to ExpendituresUsing Census Statistical Abstract, this information was pulled from the 1996 Statistical Abstract, Section 9-State and Local Government. This measure indicates the economic situation of the state. http://www.census.gov/compendia/statab/ Measured by dividing the state revenue by the expenditures. Ratio EXP/REV - revenue divided by expenditures by state for 1994 13. President Using Census Statistical Abstract, this information was pulled from the 1997 Statistical Abstract, Section 8-Elections. Indicates presidential political representation for the state. http://www.census.gov/compendia/statab/ PVCP '92 Total (1,000)- popular vote cast for President 1992 total PVCP '92 Dem (1,000)- popular vote cast for President 1992 Democrat PVCP '92 Rep (1,000)- popular vote cast for President 1992 Republican
MPVCP’92- majority popular vote case for President, 0=Democrat, 1=Republican
R4P- Republican for president, 1=Yes, 0=No D4P- Democrat for president, 1=Yes, 0=No
14. Governor Using Census Statistical Abstract, this information was pulled from the 1997 Statistical Abstract, Section 8-Elections. If states held elections in 1992 instead of 1994, then I still used the 1997 Statistical Abstract, Section 8-Elections, but for 1992 instead of 1994 (includes- Delaware, Indiana, Missouri, Montana, New Jersey, North Carolina, North Dakota, Utah, Virginia, Washington, West Virginia). Indicates governor political representation for the state. http://www.census.gov/compendia/statab/For VC&GE ’94 LP- leading party, coded as 0=Democrat, 1=Republican, 2=Independent. VC&GE '94 Total (1,000)- vote cast for Governor elected by state 1994 total VC&GE '94 LP- vote cast for Governor elected 1994 leading party VC&GE '94 %LP- vote cast for Governor elected 1994 percentage of leading party
GLP- Governor leading party, 0=Democrat, 1=Republican, 2=Independent RG- Republican Governor, 1=Yes, 0=No DG- Democrat Governor, 1=Yes, 0=No IG- Independent Governor, 1=Yes, 0=No
37

15. Majority in Senate Using Census Statistical Abstract, this information was pulled from the 1997 Statistical Abstract, Section 8-Elections. If states held elections in 1992 instead of 1994, then I used the 1996 Statistical Abstract, Section 8-Elections (includes- Alabama, Alaska, Arkansas, Colorado, Georgia, Idaho, Illinois, Iowa, Kansas, Kentucky, Louisiana, New Hampshire, North Carolina, South Carolina, South Dakota). Indicates senate political representation for the state. http://www.census.gov/compendia/statab/For VCS ’94 LP- leading party, coded as 0=Democrat, 1=Republican. VCS '94 Total (1,000)- vote cast for U.S. Senators 1994 total VCS '94 LP- vote cast for U.S. Senators 1994 leading party VCS '94 %LP- vote cast for U.S. Senators 1994 percentage leading party 16. Majority in House of RepresentativesUsing Census Statistical Abstract, this information was pulled from the 1997 Statistical Abstract, Section 8-Elections. If states held elections in 1992 instead of 1994, then I used the 1996 Statistical Abstract, Section 8-Elections (includes Louisiana only). Indicates house of representative political representation for the state. http://www.census.gov/compendia/statab/For VCr ’94 LP- leading party, coded as 0=Democrat, 1=Republican, 2=Independent. VCR '94 Total (1,000)- vote cast for U.S. Representatives 1994 total VCR '94 LP- vote cast for U.S. Representatives 1994 leading party
VCR '94 %LP- vote case for U.S. Representatives 1994 percentage leading party
17. Composition of Congress by Political Party Affiliation-StatesUsing Census Statistical Abstract, this information was pulled from the 1997 Statistical Abstract, Section 8-Elections. Looking at the 103rd Congress 1993 (closest to 1994). Indicates congressional political representation for the state. http://www.census.gov/compendia/statab/
CCR '93 D- composition of congress for Representatives 1993 number of Democrats CCR '93 R- composition of congress for Representatives 1993 number of Republicans
CCS '93 D- composition of congress for Senators 1993 number of Democrats CCS '93 R- composition of congress for Senators 1993 number of Republicans CR&S’93- control of House of Representative and Senate, 0=Democrat, 1=Republican, 2=Mixed RC- Republican control, 1=Yes, 0=No
DC- Democrat control, 1=Yes, 0=No MC- Mixed control, 1=Yes, 0=No
38

18. Concentration of Corporate PollutersUsing the Corporate Crime Reporter by Russell Mokhiber, the top 100 corporate criminals of the decade 1990s, looking only at environmental offenses (N=38). www.corporatepredators.org/top100.html www.corporatecrimereporter.com
# Top CEC '90s- number of corporate criminals for 1990s by state that appear on the Corporate Crime Reporter
19. Count of Environmental Organizations Headquartered in the U.S. by state. Washington D.C. had a total of 82, but I did not code any other data for Washington D.C. The count of environmental NGO headquarters came from The Encyclopedia of Associations, vol. . Special thanks to Erik Johnson for sharing these data.
CEOH- Count of how many environmental organizations headquarters by state.
20. Number of Hazardous Waste Sites on National Priority ListUsing Census Statistical Abstract, this information was pulled from the 1995 Statistical Abstract, Section 6-Geography and Environment. Indicates the overall environmental performance of a state. http://www.census.gov/compendia/statab/
HWS '94- hazardous waste sites on the National Priority list by state 1994 total sites HWS '94 F- hazardous waste sites on the National Priority list by state 1994 Federal HWS '94 NF- hazardous waste sites on the National Priority list by state 1994 Non-
Federal 21. Toxic ReleasesUsing Census Statistical Abstract, this information was pulled from the 1997 Statistical Abstract, Section 6-Geography and Environment. Indicates the overall environmental performance of a state. http://www.census.gov/compendia/statab/ TR '94 (1,000 of pounds)- toxic releases by state 1994 in thousands of pounds 22. Percentage of Work Eligible Employees in ManufacturingUsing Census Statistical Abstract, this information was pulled from the 1995 Statistical Abstract, Section 13-Labor Force, Employment, and Earnings. http://www.census.gov/compendia/statab/ The number of work eligible employees was divided by the number of employees working in manufacturing. ME’94- percent of employees in manufacturing 22. Number of SchoolsUsing the National Center for Education Statistics, this information was recorded and then turned into a dummy variable indicating either an above average number or below average number of public schools. http://nces.ed.gov/ NOS- number of public schools NOSD- number of public schools turned into a dummy, 1=above average, 0=below average
39