environmental footprint comparison · pdf fileenvironmental footprint comparison tool a tool...
TRANSCRIPT

ENVIRONMENTAL FOOTPRINT COMPARISON TOOL
A tool for understanding environmental decisions related to the pulp and paper industry
© 2013 National Council for Air and Stream Improvement. All rights reserved.
EFFECTS OF DECREASED WATER USE
Table of Contents
General Overview
Energy Use Kraft mill heat balance Scaling of heat transfer surfaces Limitations on effluent temperatures Energy use at mills
Greenhouse Gases GHG emissions for different fuel types
Chlorinated Compounds Pulp washing and bleach chemical
consumption
Land and Wood Use
Odor Microbial growth in process waters Odor in the finished product
Emissions to Air Organic air emissions Inorganic air emissions
Discharge to Water Effective liquor loss reduction and
spill control Limitations on effluent temperatures
Solid Waste
ENVIRONMENTAL FOOTPRINT COMPARISON TOOL
A tool for understanding environmental decisions related to the pulp and paper industry
© 2013 National Council for Air and Stream Improvement. All rights reserved.
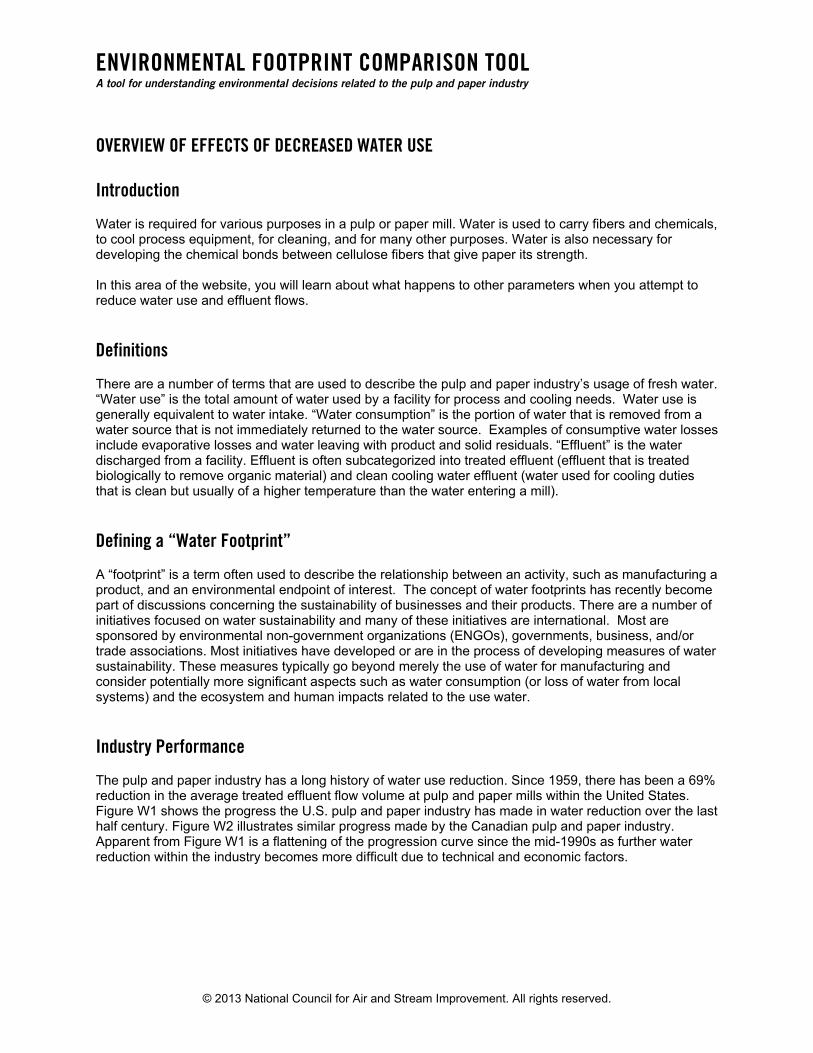
OVERVIEW OF EFFECTS OF DECREASED WATER USE Introduction Water is required for various purposes in a pulp or paper mill. Water is used to carry fibers and chemicals, to cool process equipment, for cleaning, and for many other purposes. Water is also necessary for developing the chemical bonds between cellulose fibers that give paper its strength. In this area of the website, you will learn about what happens to other parameters when you attempt to reduce water use and effluent flows.
Definitions There are a number of terms that are used to describe the pulp and paper industry’s usage of fresh water. “Water use” is the total amount of water used by a facility for process and cooling needs. Water use is generally equivalent to water intake. “Water consumption” is the portion of water that is removed from a water source that is not immediately returned to the water source. Examples of consumptive water losses include evaporative losses and water leaving with product and solid residuals. “Effluent” is the water discharged from a facility. Effluent is often subcategorized into treated effluent (effluent that is treated biologically to remove organic material) and clean cooling water effluent (water used for cooling duties that is clean but usually of a higher temperature than the water entering a mill).
Defining a “Water Footprint” A “footprint” is a term often used to describe the relationship between an activity, such as manufacturing a product, and an environmental endpoint of interest. The concept of water footprints has recently become part of discussions concerning the sustainability of businesses and their products. There are a number of initiatives focused on water sustainability and many of these initiatives are international. Most are sponsored by environmental non-government organizations (ENGOs), governments, business, and/or trade associations. Most initiatives have developed or are in the process of developing measures of water sustainability. These measures typically go beyond merely the use of water for manufacturing and consider potentially more significant aspects such as water consumption (or loss of water from local systems) and the ecosystem and human impacts related to the use water. Industry Performance The pulp and paper industry has a long history of water use reduction. Since 1959, there has been a 69% reduction in the average treated effluent flow volume at pulp and paper mills within the United States. Figure W1 shows the progress the U.S. pulp and paper industry has made in water reduction over the last half century. Figure W2 illustrates similar progress made by the Canadian pulp and paper industry. Apparent from Figure W1 is a flattening of the progression curve since the mid-1990s as further water reduction within the industry becomes more difficult due to technical and economic factors.

Effects of Decreased Water Use General Overview
© 2013 National Council for Air and Stream Improvement. All rights reserved.
0
20
40
60
80
100
120
140
160
1955 1965 1975 1985 1995 2005
Year
Mea
n E
fflu
ent
Dis
char
ge
(m3 /a
dm
t)
Figure W1. Reductions in Effluent Flow over Time in the U.S. Pulp and Paper Industry. [Squares are production weighted means from NCASI (1983); circles are means from
Miner and Unwin (1991); diamonds are production weighted means from NCASI (2009a). Effluent discharge is water discharged from the waste treatment facility. Some mills
include cooling water discharge in their reported effluent flow, while other mills do not.]

Effects of Decreased Water Use General Overview
© 2013 National Council for Air and Stream Improvement. All rights reserved.
0
50
100
150
200
250
1950 1960 1970 1980 1990 2000 2010 2020
Year
Mean
Effluent Discharge
(m
3/admt)
Figure W2. Reductions in Effluent Flow over Time in the Canadian Pulp and Paper Industry [Source: Forest Products Association of Canada]
Water profiles published for the forest products sector in the U.S. and Canada (NCASI 2009a, 2010) illustrate the nature and extent of water use, recycle, and release associated with the North American forest products sector. Forests act to process precipitation into high-quality surface waters, and in North America, most surface waters are derived from forested areas. Forest management can affect water quality, but the use of forestry best management practices greatly minimizes harmful effects. Manufacturing of pulp and paper is water-use intensive relative to most other industries, although the amount of water consumed (i.e., evaporated or exported with product or residuals) represents a small fraction of the overall water used. Opportunities for Improvement There continue to be a number of significant water use reduction opportunities within pulp and paper mills. These opportunities are generally site-specific in nature, and require the consideration of a given operation’s unique characteristics. Decisions made by a given facility incorporate consideration of the related co-benefits and trade-offs that are discussed elsewhere in this Tool. A number of references have detailed information on water use reduction within the pulp and paper industry, to help guide specific facilities towards approaches that may be appropriate for their operations. One reference (NCASI 2009b) looks at the operating practices at low water use mills in North America and Scandinavia and has a section on water conservation principles, with many specific examples of mill opportunities for water reduction. A second publication on water use reduction within the pulp and paper

Effects of Decreased Water Use General Overview
© 2013 National Council for Air and Stream Improvement. All rights reserved.
industry (Browne 2001) provides overviews of water reduction possibilities by mill process type, as well as engineering methods and techniques for reducing water. Challenges to Further Water Reduction Recycling of water used in the pulp and paper process is limited by the accumulation of dissolved matter from wood and other raw materials entering the process. Using recycled water within the process entails replacing fresh water with recycled water. Contaminants will accumulate within the process if the recycle stream contains contaminants not present in the fresh water, or present at higher concentrations. Some of the problems associated with contaminant accumulation are deposition and scaling, foaming, corrosion, stream dead load, and degradation of the end product quality parameters. While strategies for controlling these contaminants can be developed, the degree to which further water reduction can be achieved becomes a site-specific challenge. References Browne, T.C. (Editor). 2001. Water use reduction in the pulp and paper industry, 2nd ed. Montreal: Pulp
and Paper Research Institute of Canada. Miner, R., and Unwin, J. 1991. Progress in reducing water use and wastewater loads in the U.S. paper
industry. Tappi Journal 74(8):127-131. National Council for Air and Stream Improvement, Inc. (NCASI). 1983. A compilation of data on the
nature and performance of wastewater management systems in the pulp and paper. Special Report 83-09. New York: National Council of the Paper Industry for Air and Stream Improvement, Inc.
National Council for Air and Stream Improvement, Inc. (NCASI). 2009a. Water profile for the United
States forest products industry. Technical Bulletin No. 960. Research Triangle Park, NC: National Council for Air and Stream Improvement, Inc.
National Council for Air and Stream Improvement, Inc. (NCASI). 2009b. Water use performance and
practices at low water use mills. Technical Bulletin No. 968. Research Triangle Park, NC: National Council for Air and Stream Improvement, Inc.
National Council for Air and Stream Improvement, Inc. (NCASI). 2010. Water profile of the Canadian
forest products industry. Technical Bulletin No. 975. Research Triangle Park, NC: National Council for Air and Stream Improvement, Inc.

ENVIRONMENTAL FOOTPRINT COMPARISON TOOL
A tool for understanding environmental decisions related to the pulp and paper industry
© 2013 National Council for Air and Stream Improvement. All rights reserved.
EFFECTS OF DECREASED WATER USE ON ENERGY USE Overview In general, as mills reduce water use, energy use is also reduced until the point at which effluent flows are very low. The relationships between effluent flows and energy use, however, are complex and there are many ways to reduce water use that will not affect energy use. In addition, the relationship will vary from one type of mill to another. Comparisons across dissimilar sub-sectors of the industry are generally not valid. In other words, a facility in a sub-sector of the industry characterized by low effluent flows does not necessarily also have low energy use. Decreased water use may increase concentrations of chemicals that exacerbate scaling problems. If increased scaling occurs on heat transfer surfaces, energy requirements may increase, although these problems are usually addressed via chemical additives. More information on the relationship between water use and energy requirements is available at the links below. For the inverse question – that is, what would happen to water use if a facility tries to decrease energy use – the answer is different. The inverse question is examined in the section of this Tool on Effects of Decreased Energy Consumption on Water Use. More information Kraft mill heat balance Scaling of heat transfer surfaces Limitations on effluent temperatures Energy use at mills

ENVIRONMENTAL FOOTPRINT COMPARISON TOOL
A tool for understanding environmental decisions related to the pulp and paper industry
© 2013 National Council for Air and Stream Improvement. All rights reserved.
EFFECTS OF DECREASED WATER USE ON ENERGY USE Kraft Mill Heat Balance Most of the energy that enters a pulp and paper mill exits via effluent and cooling tower exhaust. Syberg and Barynin (1998) examined the impact of water reduction on the overall kraft mill heat balance. Theoretical steam reductions and equipment and process changes necessary to reduce water usage were discussed. The decrease in water usage in mills has resulted in a shift of the heat rejection from the wastewater treatment system to cooling towers. Table W1 shows the major kraft pulp mill heat sinks.
Table W1. Major Pulp Mill Heat Sinks, Mill Values (mill values from Syberg and Barynin 1998)
Heat Sink Pulp Mill Total Heat to Process (%)1 Typical Range (%) Cooling tower(s) and effluent 74 65-80 Dryer exhaust 13 6-27 Recovery boiler flue gas exhaust 9 6-12 Bleach plant scrubber vent gases 3 0-10 Pulp <1 ~1 The energy in effluents and removed via cooling towers is of low quality. From Table W1, approximately 70% of process heat at kraft mills is being discharged via the effluent stream and cooling tower(s) so there is the theoretical possibility for large heat recovery. Unfortunately, this heat is of low quality and of little value for use elsewhere in the mill process. Figure W2 shows that as the amount of heat to the process increases, the amount of heat that must be rejected, usually via a cooling tower water circuit, increases.
Figure W2. Heat to Process vs. Net Heat Rejected (mill data from Syberg and Barynin 1998)
Effects of Decreased Water Use on Energy Use Kraft Mill Heat Balance
© 2013 National Council for Air and Stream Improvement. All rights reserved.
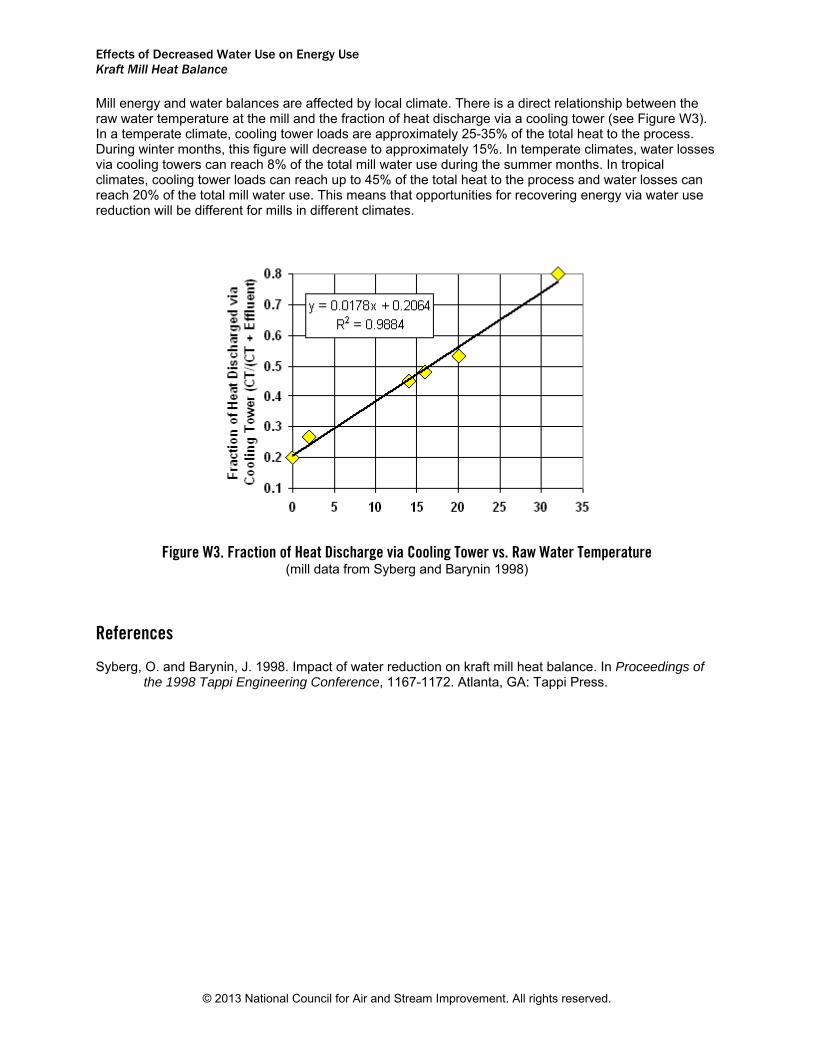
Mill energy and water balances are affected by local climate. There is a direct relationship between the raw water temperature at the mill and the fraction of heat discharge via a cooling tower (see Figure W3). In a temperate climate, cooling tower loads are approximately 25-35% of the total heat to the process. During winter months, this figure will decrease to approximately 15%. In temperate climates, water losses via cooling towers can reach 8% of the total mill water use during the summer months. In tropical climates, cooling tower loads can reach up to 45% of the total heat to the process and water losses can reach 20% of the total mill water use. This means that opportunities for recovering energy via water use reduction will be different for mills in different climates.
Figure W3. Fraction of Heat Discharge via Cooling Tower vs. Raw Water Temperature
(mill data from Syberg and Barynin 1998) References Syberg, O. and Barynin, J. 1998. Impact of water reduction on kraft mill heat balance. In Proceedings of
the 1998 Tappi Engineering Conference, 1167-1172. Atlanta, GA: Tappi Press.

ENVIRONMENTAL FOOTPRINT COMPARISON TOOL
A tool for understanding environmental decisions related to the pulp and paper industry
© 2013 National Council for Air and Stream Improvement. All rights reserved.
EFFECTS OF DECREASED WATER USE ON ENERGY USE Scaling of Heat Transfer Surfaces Decreased water use may increase concentrations of chemicals that exacerbate scaling problems. If increased scaling occurs on heat transfer surfaces, energy requirements may increase, although these problems are usually addressed via chemical additives. Aluminum and silicon In sufficient concentrations, silicon and aluminum can form sodium aluminosilicates ( 4NaAlSiO · sXNa31 2 where .etc,,2OHSO,COX 2
4-2
3 ) in the evaporator area. Na-Al-Silicates
form hard, glassy scales in the evaporators that reduce the heat transfer rate and are the most difficult evaporator scales to remove in kraft pulp mills. The solubility of Na-Al-Silicates in the black liquor is dependent upon the hydroxide concentration, lignin content, and the concentration of sodium and potassium ions (Ulmgren 1982, 1987). Calcium carbonate Deposition of calcium carbonate is a major problem in many areas of the mill that operate under alkaline conditions. Calcium carbonate exhibits an inverse solubility with temperature (i.e., the solubility of calcium carbonate decreases with increasing temperature), so scaling problems are typically encountered on heat transfer surfaces. In the bleach plant, calcium carbonate scaling can be found in alkaline stages (pH range 8-12) such as Extraction (E) and Peroxide (P) stages, on “hot” areas such as heat transfer surfaces (Berglin et al. 2002). Calcium carbonate is a persistent scaling problem in pulp digesters, typically forming in the upper heating zone and circulation heaters (Markham and Bryce 1980; Hartler and Libert 1972). Scale formation on heat transfer surfaces leads to increased steam usage in the digester. Calcium carbonate is known to form scales in the evaporation area (Grace 1977; Frederick and Grace 1979a), but can be effectively mitigated via black liquor heat treatment (Frederick and Grace 1979b). Chlorides Chlorides can form sticky deposits in the upper heat transfer section of the kraft recovery boiler. The chloride deposits reduce heat transfer from the hot flue gas to the water tubes, reducing net steam generation from the recovery boiler. References Berglin, N., Lindgren, K., Lundqvsit, F, Samuelsson, Å, Sarman, S, and Ulmgren, P. 2002. Process model
for the bleach plant. In Proceedings 7th international conference of new available technologies, 47-51. June 4-6. Stockholm.
Frederick, W.J. and Grace, T.M. 1979a. Analysis of scaling in a black liquor evaporator. AIChE
Symposium Series 75: 95. Frederick, W.J. and Grace, T.M. 1979b. Preventing calcium carbonate scaling in black liquor evaporators.
Southern Pulp and Paper Manufacturer 9: 21-29. Grace, T.M. 1977. Evaporator scaling. Southern Pulp and Paper Manufacturer 8: 16-23.

Effects of Decreased Water Use on Energy Use Scaling of Heat Transfer Surfaces
© 2013 National Council for Air and Stream Improvement. All rights reserved.
Hartler, N., Libert, J. 1972. Structure and composition of scale in continuous kraft digesters. Svensk
Paperstidning 75(2): 65-70. Markham, L.D. and Bryce, J.R.G. 1980. Formation of calcium carbonate scale in a continuous digester.
Tappi Journal 63(4): 125-127. Ulmgren, P. 1982 Consequences of build-up of non-process chemical elements in closed kraft recovery
cycles – Aluminosilicate scaling, a chemical mode. Pulp & Paper Canada 8: TR27-TR32. Ulmgren, P. 1987. The removal of aluminum from the recovery system of a closed kraft pulp mill. Nordic
Pulp & Paper Research Journal 1: 4-9. http://dx.doi.org/10.3183/NPPRJ-1987-02-01-p004-009

ENVIRONMENTAL FOOTPRINT COMPARISON TOOL
A tool for understanding environmental decisions related to the pulp and paper industry
© 2013 National Council for Air and Stream Improvement. All rights reserved.
EFFECTS OF DECREASED WATER USE ON ENERGY USE Limitations on Effluent Temperatures Increasing the reuse of water within mill processes typically results in an increase in the temperature of untreated wastewater. This occurs because excess low-grade heat from the process is lost in a smaller, and therefore warmer, volume of water. Nearly all pulp and paper mill wastewaters are subject to biological treatment and the temperature of the wastewater entering the treatment system is very important to effective treatment of the wastewater. The microorganisms in biological treatment plants are often classified according to the temperature range within which optimal growth is achieved. Mesophilic organisms, the type found in essentially all of the industry’s treatment systems, thrive in a temperature range between 20 and 40oC, with an optimal temperature of between 30 and 35°C. Full-scale operating data and laboratory experiments conducted to evaluate the effects of temperatures in the range of 35 to 49ºC indicate that the optimal biorate likely exhibits a plateau over the range of 35 to 45ºC, above which a rapid decline in biorate is observed. When increased reuse of mill process water increases the temperature of mill wastewater above 35 to 40ºC, it is often necessary to install a cooling system for the wastewater prior to biological effluent treatment. Thus, the advantages of increasing the reuse of mill process water must sometimes be weighed against the capital costs, operating expenses, and environmental impact (e.g., consumptive water loss due to evaporation) associated with wastewater cooling.

ENVIRONMENTAL FOOTPRINT COMPARISON TOOL
A tool for understanding environmental decisions related to the pulp and paper industry
© 2013 National Council for Air and Stream Improvement. All rights reserved.
EFFECTS OF DECREASED WATER USE ON ENERGY USE Energy Use at Mills Kraft Mills | Mechanical Pulp Mills | Paper, Board, Tissue and Pulp Machines | Recycling and Deinking Mills Overview Nygaard compared the energy requirements among the major pulping types. His results, shown in Table W2, illustrate that kraft and TMP/CTMP consume approximately equivalent amounts of energy. The majority of energy for kraft pulping is used for process heating while the majority of energy for TMP/CTMP is for electrical energy to drive refiners. Deinking facilities have approximately 25% of the energy requirements of kraft and TMP/CTMP mills. Table W2. Total Energy Consumption for Different Pulp Facilities Excluding Paper Machines (Nygaard 1997) Electrical Power(kWh/adt) Process Heat(kWh/adt) Total(kWh/adt) Kraft 560 2500 3060 TMP/CTMP 3000 200 3200 Deinked pulp 600 220 820
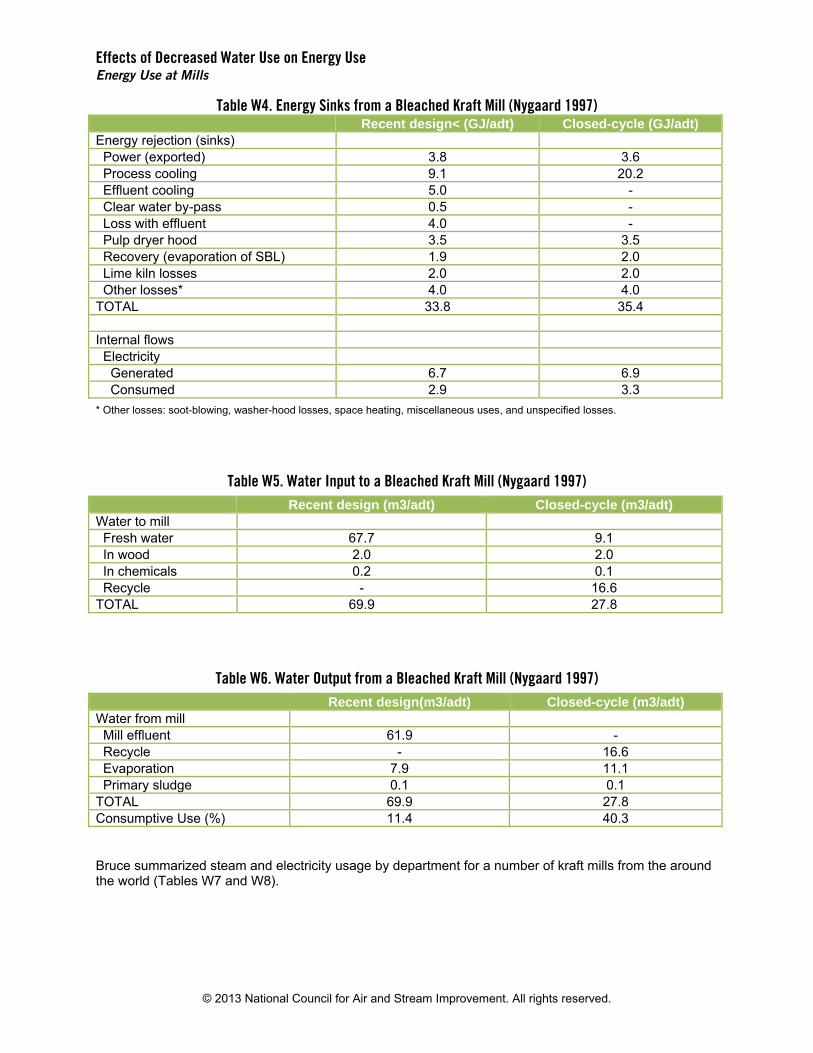
Energy Balance at Kraft Mills The overall energy balance has been estimated for a bleached kraft mill and is given in Table W3 and Table W4. The bleaching sequence for the simulated mill is ODEODEpD. Electrostatic precipitator (ESP) dust is assumed to be purged to maintain the chloride levels at or below 20 g/L NaCl in the white liquor. The corresponding overall water balance for the bleached kraft mill is given in Table W5 and Table W6. For mills that internally recycle water used in some or all process operations, the energy balance shifts considerably. For these configurations that use a “closed-cycle” concept, water consumption, defined as the portion of water removed from the local watershed or ecosystem that is not directly returned to the immediate environment in the form of liquid discharge from a mill, carries with it a much larger percentage of the overall energy leaving the system.
Table W3. Energy Sources to a Bleached Kraft Mill (Gleadow et al. 1997) Recent design (GJ/adt) Closed-cycle (GJ/adt) Energy sources Recovery boiler (BLS) 20.7 22.3 Power boiler (bark, wood waste, fuel) 11.1 11.1 Lime kiln (fuel) 2.0 2.0 TOTAL 33.8 35.4
Effects of Decreased Water Use on Energy Use Energy Use at Mills
© 2013 National Council for Air and Stream Improvement. All rights reserved.
Table W4. Energy Sinks from a Bleached Kraft Mill (Nygaard 1997) Recent design< (GJ/adt) Closed-cycle (GJ/adt) Energy rejection (sinks) Power (exported) 3.8 3.6 Process cooling 9.1 20.2 Effluent cooling 5.0 - Clear water by-pass 0.5 - Loss with effluent 4.0 - Pulp dryer hood 3.5 3.5 Recovery (evaporation of SBL) 1.9 2.0 Lime kiln losses 2.0 2.0 Other losses* 4.0 4.0 TOTAL 33.8 35.4 Internal flows Electricity Generated 6.7 6.9 Consumed 2.9 3.3 * Other losses: soot-blowing, washer-hood losses, space heating, miscellaneous uses, and unspecified losses.
Table W5. Water Input to a Bleached Kraft Mill (Nygaard 1997) Recent design (m3/adt) Closed-cycle (m3/adt) Water to mill Fresh water 67.7 9.1 In wood 2.0 2.0 In chemicals 0.2 0.1 Recycle - 16.6 TOTAL 69.9 27.8
Table W6. Water Output from a Bleached Kraft Mill (Nygaard 1997) Recent design(m3/adt) Closed-cycle (m3/adt) Water from mill Mill effluent 61.9 - Recycle - 16.6 Evaporation 7.9 11.1 Primary sludge 0.1 0.1 TOTAL 69.9 27.8 Consumptive Use (%) 11.4 40.3 Bruce summarized steam and electricity usage by department for a number of kraft mills from the around the world (Tables W7 and W8).

Effects of Decreased Water Use on Energy Use Energy Use at Mills
© 2013 National Council for Air and Stream Improvement. All rights reserved.
Table W7. Department Steam Consumption (GJ/adt) (Bruce 1998) Softwood Hardwood Department Typical 1980 Model Mill Recent Mill Designs A B C D E F Steam & Chemical Recovery 4.9 1.2 3.3 1.7 2.6 1.6 1.1 0.9 Pulp Drying 4.4 2.3 2.7 2.7 4.5 3.1 4.1 3.0 Evaporation and Stripping 4.1 3.3 3.9 4.2 5.4 4.2 3.8 3.0 Digesting, Washing, Screening 4.1 1.8 2.3 2.0 3.3 3.2 1.9 2.2 Bleaching 3.5 0.0 2.8 0.4 0.6 0.4 3.4 0.6 Recausticizing & Kiln 0.5 0.0 0.4 0.3 0.0 0.0 0.0 0.3 Woodroom 0.3 0.0 0.0 0.0 0.0 0.2 0.4 0.4 Chemical Preparation 0.3 0.1 0.3 0.4 0.4 0.3 0.2 0.3 O2 Delignification 0.0 0.4 1.3 0.5 0.2 0.2 0.3 0.0 Totals 22.1 9.1 17.0 12.2 17.0 13.2 15.5 10.7 NOTES: Typical 1980 Mill is based upon a 1980 survey of 17 Canadian and 7 Nordic mills. Model Mill is based upon a hypothetical mill designed for energy efficiency.
1. South American softwood mill designed in the 1990s 2. South American softwood mill designed in the 1990s 3. North American softwood mill designed in the 1990s 4. European softwood mill designed in the 1990s 5. North American hardwood mill designed in the 1990s 6. European hardwood mill designed in the 1990s
Table W8. Department Power Consumption (kWh/adt) (Bruce 1998) Softwood Hardwood Department Model Mill Recent Mill Designs A B C D E F Steam & Chemical Recovery 90 191 18 124 110 91 150 Pulp Drying 165 155 150 143 140 114 122 Evaporation and Stripping 35 125 75 98 30 125 28 Digesting, Washing, Screening, O2 Delignification
125 168 181 180 205 156 156
Bleaching 55 124 33 132 110 92 94 Recausticizing & Kiln 60 30 61 23 25 14 19 Woodroom 55 24 43 37 20 68 28 Water & Effluent Treatment 40 68 108 56 40 85 45 Totals 625 885 669 793 680 745 642 NOTE: Model Mill is based upon a hypothetical mill designed for energy efficiency
1. North American softwood mill designed in the 1990s 2. North American softwood mill designed in the 1990s 3. Chilean softwood mill designed in the 1990s 4. European softwood mill designed in the 1990s 5. North American hardwood mill designed in the 1990s 6. European hardwood mill designed in the 1990s
References Bruce, D. 1998. Benchmarking energy consumption and identifying opportunities for conservation. In
Proceedings of the 1998 84th annual meeting of the technical section of Canadian Pulp and Paper Association. Part B. January 27-30 1998, Montreal, Canada.

Effects of Decreased Water Use on Energy Use Energy Use at Mills
© 2013 National Council for Air and Stream Improvement. All rights reserved.
Gleadow, P., Hastings, C., Barynin, J., Schroderus, S., and Warnqvist, B. 1997. Towards closed-cycle kraft: ECF versus TCF case studies. Pulp & Paper Canada, 98(4): T100-T110.
Nygaard, J. 1997. Energy aspects of mechanical pulp, chemical pulp and recycled fibres. In Proceedings
1997 Tappi International Mechanical Pulping Conference, 17-27. Atlanta, GA: Tappi Press. Mechanical Pulp Mills Overview Nygaard compared the energy requirements among the major pulping types. His results, shown in Table W9, illustrate that kraft and TMP/CTMP consume approximately equivalent amounts of energy. The majority of energy for kraft pulping is used for process heating while the majority of energy for TMP/CTMP is for electrical energy to drive refiners. Deinking facilities have approximately 25% of the energy requirements of kraft and TMP/CTMP mills. Table W9. Total Energy Consumption for Different Pulp Facilities Excluding Paper Machines (Nygaard 1997) Electrical Power (kWh/adt) Process heat (kWh/adt) Total (kWh/adt) Kraft 560 2500 3060 TMP/CTMP 3000 200 3200 Deinked pulp 600 220 820 Energy requirements for mechanical pulp mills Jackson and Wild summarized electricity and steam usage by department for a modern mechanical pulp mill (see Table W10). The numbers generated are for a 500 bdmt/d single-line TMP mill using a fiber supply consisting of 50% chips and 50% logs. Electricity for the refiner motors comprises approximately 81% of the total electricity usage.

Effects of Decreased Water Use on Energy Use Energy Use at Mills
© 2013 National Council for Air and Stream Improvement. All rights reserved.
Table W10. Overall Electrical Requirements for a Modern 500 bdmt/day TMP Mill (Jackson and Wild 1999)
Area
Pumps
Agitators
ScreensBlowers & fans
Mechanical drives
Refiner motors
Total % of total
Material handling
Chips 7 119 998 1124 Logs 7 119 3010 3126 Average 7 119 2004 2130 3.4 TMP Chip pretreatment
346 4 45 1751 2146 3.4
Mainline refining
224 566 37083 37873 60.1
Low consistency refining
93 4 2083 2180 3.5
Screening & cleaning
447 224 447 1118 1.8
Rejects treatment
432 652 298 30 875 10771 13058 21.1
Dewatering 186 30 37 253 0.4 Bleaching 596 596 0.9 Heat recovery 335 335 0.5 WW management
216 216 0.3
Effluent treatment
1006 745 112 1863 3.0
Total 3664 1104 745 969 5349 49937 61768 100 % of Total 5.9 1.8 1.2 1.6 8.7 80.8 100 References Jackson, M. and Wild, N. 1999. Mechanical pulp mills. In energy cost reduction in the pulp and paper
industry, T.C. Browne, tech. ed. Montreal: Pulp and Paper Research Institute of Canada (Paprican).
Nygaard, J. 1997. Energy aspects of mechanical pulp, chemical pulp and recycled fibres. In Proceedings
1997 Tappi International Mechanical Pulping Conference, 17-27. Atlanta, GA: Tappi Press.

Effects of Decreased Water Use on Energy Use Energy Use at Mills
© 2013 National Council for Air and Stream Improvement. All rights reserved.
Paper, Board, Tissue, and Pulp Machines Total energy requirements for paper machines vary depending upon grade (see Table W11). In general, paper mills that have higher specific water consumption (i.e., water consumed per ton of paper product) will have higher energy consumption due to heating pulp stock and whitewater.
Table W11. Energy Requirements for Different Recycling and Deinking Process Steps (Williamson 1999) Steam
consumption Gas
consumption
Electrical consumption Grade (GJ/adt) (GJ/adt) (GJ/adt) (kWh/adt) Newsprint 3.4 – 5.5 - 1.2 – 2.3 420-630 Coated groundwood 5.1 – 5.6 - 2.0 – 2.9 550 – 820 Uncoated woodfree 4.3 – 7.2 - 2.0 – 2.4 550 – 670 Coated woodfree 3.7 – 7.7 - 1.6 – 3.2 440 – 900 Linerboard 3.4 – 8.8 - 1.8 – 2.4 515 – 660 Tissue 2.6 – 4.5 2.0 – 2.4 3.0 – 3.8 835 – 1050 The typical energy breakdown among process areas for a newsprint machine is given in Table W12.
Table W12. Typical Energy Consumption by Area for a Newsprint Machine (Schmidt 1981) Steam consumption Electrical consumption Process Area (GJ/adt) (GJ/adt) (kWh/adt) Stock preparation 0.66 0.36 100 Forming, pressing 0.3 0.51 142 Drying, finishing 3.2 0.16 45 Auxiliary systems - 0.15 42 Total 4.16 1.18 329 References Williamson, P.N. (ed.). 1999. Paper, board, tissue and pulp machines. Chapter 7 in Energy cost reduction
in the pulp and paper industry: A monograph. Montreal: Pulp and Paper Research Institute of Canada (Paprican).
Schmidt, K. 1981. Saving process energy in the papermaking industry. Paper 196(10): 20-26, 40.

Effects of Decreased Water Use on Energy Use Energy Use at Mills
© 2013 National Council for Air and Stream Improvement. All rights reserved.
Recycling and Deinking Mills Overview Nygaard compared the energy requirements among the major pulping types. His results, shown in Table W13, illustrate that kraft and TMP/CTMP consume approximately equivalent amounts of energy. The majority of energy for kraft pulping is used for process heating while the majority of energy for TMP/CTMP is for electrical energy to drive refiners. Deinking facilities have approximately 25% of the energy requirements of kraft and TMP/CTMP mills. Table W13. Total Energy Consumption for Different Pulp Facilities Excluding Paper Machines (Nygaard 1997)
Electrical Power(kWh/adt) Process Heat(kWh/adt) Total (kWh/adt) Kraft 560 2500 3060 TMP/CTMP 3000 200 3200 Deinked pulp 600 220 820 Energy for Recycling and Deinking Total energy requirements at deinking facilities will typically vary from 300 to 1000 kWh/adt depending upon the final product and process design (see Table W14).
Table W14. Energy Requirements for Different Recycling and Deinking Process Steps (Williamson 1999) Typical Energy Consumption (kWh/adt)
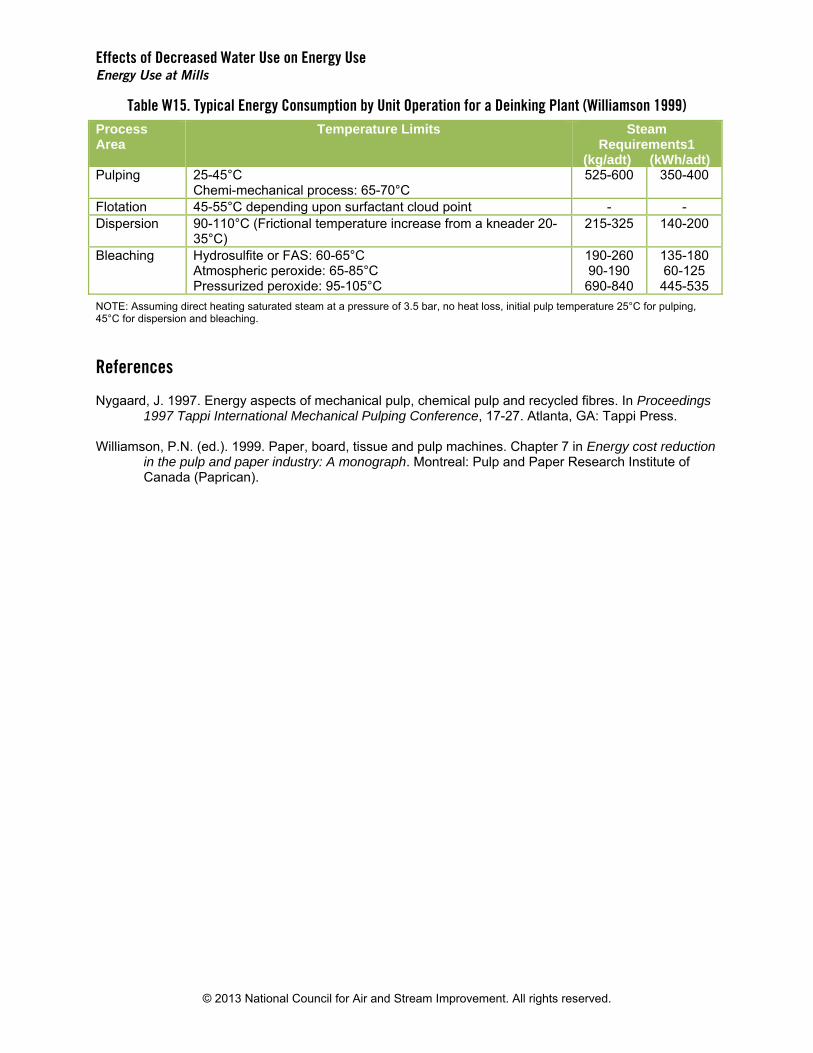
Unit Operation Electrical power Steam energy Pulping 62-74 0-400 Coarse screening 25-40 - Flotation 38-90 - Lightweight cleaning 15-29 - Heavyweight cleaning 27-40 - Fine screening 31-69 - Washing/Thickening 17-19 - Kneading/Dispersion/Bleaching 30-100 0-535 The typical energy breakdown among unit operations at a deinking plant is given in Table W15.
Effects of Decreased Water Use on Energy Use Energy Use at Mills
© 2013 National Council for Air and Stream Improvement. All rights reserved.
Table W15. Typical Energy Consumption by Unit Operation for a Deinking Plant (Williamson 1999) Process Area
Temperature Limits Steam Requirements1
(kg/adt) (kWh/adt) Pulping 25-45°C
Chemi-mechanical process: 65-70°C 525-600 350-400
Flotation 45-55°C depending upon surfactant cloud point - - Dispersion 90-110°C (Frictional temperature increase from a kneader 20-
35°C) 215-325 140-200
Bleaching Hydrosulfite or FAS: 60-65°C Atmospheric peroxide: 65-85°C Pressurized peroxide: 95-105°C
190-260 90-190 690-840
135-180 60-125 445-535
NOTE: Assuming direct heating saturated steam at a pressure of 3.5 bar, no heat loss, initial pulp temperature 25°C for pulping, 45°C for dispersion and bleaching. References Nygaard, J. 1997. Energy aspects of mechanical pulp, chemical pulp and recycled fibres. In Proceedings
1997 Tappi International Mechanical Pulping Conference, 17-27. Atlanta, GA: Tappi Press. Williamson, P.N. (ed.). 1999. Paper, board, tissue and pulp machines. Chapter 7 in Energy cost reduction
in the pulp and paper industry: A monograph. Montreal: Pulp and Paper Research Institute of Canada (Paprican).

ENVIRONMENTAL FOOTPRINT COMPARISON TOOL
A tool for understanding environmental decisions related to the pulp and paper industry
© 2013 National Council for Air and Stream Improvement. All rights reserved.
EFFECTS OF DECREASED WATER USE ON GREENHOUSE GAS EMISSIONS Overview Because water use can affect energy requirements, there can be a link between water reuse and greenhouse gas emissions. Greenhouse gas emissions are, however, also affected by a large number of other much more important factors, and thus the co-benefits from water use reduction are relatively small. To understand the effects of water use on energy consumption, which can affect greenhouse gas emissions, examine the section of this Tool dealing with water use and energy. For the inverse question – that is, what would happen to water use if a facility tries to decrease greenhouse gases – the answer is different. The inverse question is examined in the section Effects of Decreased Greenhouse Gas Emissions on Water Use. More Information GHG emissions from different fuel types

ENVIRONMENTAL FOOTPRINT COMPARISON TOOL
A tool for understanding environmental decisions related to the pulp and paper industry
© 2013 National Council for Air and Stream Improvement. All rights reserved.
EFFECTS OF DECREASED WATER USE ON GREENHOUSE GAS EMISSIONS GHG Emissions for Different Fuel Types Greenhouse gas emissions are determined by the type of fuel used and the amount of fuel used. Water reuse can have a modest effect on the amounts of fuel used but will not affect the selection of fuel. The effects of recycling on energy use are discussed in the Recycling section of this Tool. The effects of fuel type are evident in comparing CO2 emission factors. CO2 Emission Factors CO2 emission factors vary depending upon the fossil fuel type. Table W16 displays emission factors for common fossil fuels used in the pulp and paper industry. Further information on GHG emissions due to fossil fuel use is included elsewhere in this tool under GHGs.
Table W16. CO2 Emission Factors for Various Fossil Fuels Fossil Fuel CO2 Emission Factor(kg CO2/GJ LHV) Petroleum coke 99.8 Coal 92.7 Residual fuel oil 76.6 Distillate fuel oil 73.4 Kerosene 71.2 Gasoline 69.9 Liquefied propane gas 62.5 Natural gas 55.9 Biomass fuels 0.0* * Biomass fuels are “carbon neutral,” but do release methane (CH4) and nitrous oxide (N2O) when combusted. For more information on this topic, see the Greenhouse Gas section of this Tool.
ENVIRONMENTAL FOOTPRINT COMPARISON TOOL
A tool for understanding environmental decisions related to the pulp and paper industry
© 2013 National Council for Air and Stream Improvement. All rights reserved.
EFFECTS OF DECREASED WATER USE ON CHLORINATED COMPOUNDS Overview When water is reused extensively, the effects on use and discharge of chlorine-containing compounds will depend on how and where water is being reused. Chlorides, which can cause corrosion problems, tend to concentrate when water is reused. Therefore, mills pursuing aggressive water reuse programs may find that it is helpful to reduce the use of chlorine-containing compounds. In cases such as these, however, the reduction in water use itself does not actually facilitate a reduction in use of chlorine-containing chemicals so it would not be a considered a co-benefit in this context. The inverse relationship (i.e., the effects of reducing chlorinated organic chemical use on water reuse) does involve co-benefits, which are explored in the section Effects of Reducing Chlorinated Compounds on Water Use. There are two areas worth noting where increasing water reuse might directly affect chlorinated chemical use. First, increased water reuse, especially around the paper machine, for instance, can increase the need for biocides, which may contain chlorinated chemicals. Second, if water use is reduced by reducing the amount of washing accomplished in the bleach plant, the demand for bleaching chemicals may increase and some of these chemicals may be chlorinated. More information on the interaction between chlorine-containing chemicals and water use is available at the links below. More information Pulp washing and bleach chemical consumption

ENVIRONMENTAL FOOTPRINT COMPARISON TOOL
A tool for understanding environmental decisions related to the pulp and paper industry
© 2013 National Council for Air and Stream Improvement. All rights reserved.
EFFECTS OF DECREASED WATER USE ON CHLORINATED COMPOUNDS Pulp Washing and Bleach Chemical Consumption Pulp is washed between bleaching stages to remove soluble organic and inorganic materials from the pulp mat. When wash water is reduced, more dissolved material is retained with the pulp, which can consume costly bleaching chemicals in subsequent bleaching stages. Larger wash liquor ratios produce a cleaner pulp, reducing the chemical requirements for delignification, bleaching, and neutralization reactions. The wash liquor ratio is defined as the amount of wash liquor entering the system divided by the amount of water leaving the system with the pulp mat. A common rule of thumb is that 1 kg of sodium sulfate (Na2SO4) carryover consumes approximately 0.5 kg ClO2. Table W17 shows the effect of wash liquor ratio on chemical consumption in the extraction and hypochlorite stages of a (CD)EHDED bleaching sequence when direct counter-current washing is employed.
Table W17. Effect of Wash Liquor Ratio on Chemical Consumption in the E1- and H-Stages of a (CD)EHDED Bleaching Sequence (Dence and Reeve 1996)
Washer
Wash Liquor Ratio
Chemical Consumption (% on pulp, Cl2 for H stage, NaOH for E1 stage)
H 1.25 3.0 H 1.15 3.3 H 1.00 4.7 E1 1.30 1.45 E1 1.15 1.60 E1 1.00 2.40
Washing following delignification stages is the primary method of removing lignin from pulp. In a bleaching sequence such as DED, inefficient extraction stage washing will result in carryover of colored material to the final chlorine dioxide stage, which can increase chemical consumption of chlorine dioxide. Figure W4 shows the effect of efficient inter-stage washing. Washing efficiency in the figure is defined as the percent of dissolved solids generated in the extraction stage removed by the washer (i.e., a washer with 83% efficiency would removed 83% of the dissolved solids generated in the E-stage)

Effects of Decreased Water Use on Chlorinated Compounds Pulp Washing and Bleach Chemical Consumption
© 2013 National Council for Air and Stream Improvement. All rights reserved.
Figure W4. Impact of Washing Efficiency on D-stage Bleaching Chemical Requirements for Partially Delignified Softwood Kraft Pulp
(Dence and Reeve 1996)
References
Dence, C.W. and Reeve, D.W. (eds) 1996. Water reuse and recycle. Section VI, Chapter 6 in Pulp bleaching principles and practice, 647-673. Atlanta, GA: Tappi Press.
ENVIRONMENTAL FOOTPRINT COMPARISON TOOL
A tool for understanding environmental decisions related to the pulp and paper industry
© 2013 National Council for Air and Stream Improvement. All rights reserved.
EFFECTS OF DECREASED WATER USE ON LAND AND WOOD USE Overview In general, water use can be reduced without affecting wood consumption. Reducing water use may have a small beneficial effect on wood consumption if the water is reused in a way that also reduces losses of fiber.

ENVIRONMENTAL FOOTPRINT COMPARISON TOOL
A tool for understanding environmental decisions related to the pulp and paper industry
© 2013 National Council for Air and Stream Improvement. All rights reserved.
EFFECTS OF DECREASED WATER USE ON ODOR Overview In most cases, mills can reduce water use without affecting odors in or around the mill. In some cases, however, especially involving mills that are approaching zero discharge, odor problems can occur in mill water systems and even in the product being manufactured. These odor problems are related to the growth of bacteria that thrive on the increased levels of organic matter and temperatures in very tightly closed water systems. More information on the effects of water reuse on odor can be found by following the links below.
More Information Microbial growth in process waters Odor in the finished product

ENVIRONMENTAL FOOTPRINT COMPARISON TOOL
A tool for understanding environmental decisions related to the pulp and paper industry
© 2013 National Council for Air and Stream Improvement. All rights reserved.
EFFECTS OF DECREASED WATER USE ON ODOR Microbial Growth in Process Waters Oxygen dissolved in process water initially accelerates the growth of aerobic bacteria, which in turn consume dissolved oxygen. Closed systems typically contain low concentrations of dissolved oxygen of around 1 mg/l. Low oxygen contents favor the growth anaerobic bacteria, consisting primarily (90%) of the group Bifidiobacterium subtile. Low oxygen conditions also favor the existence of sulfate-reducing bacteria. These bacteria are found in low concentrations in process water but can exist in large concentrations under slime deposits (Jung and Kutzner 1978). Table W18 shows microorganism concentrations between two paper mills; one operating at low effluent conditions (20 m3/mt) and one operation at effectively zero effluent conditions.
Table W18. Microorganisms in Process Water in Paper Mills Using Waste Paper
(adapted from Geller and Göttsching 1982) Description Specific Effluent Volume, (m3/mt) Unit 0 20 Colony count, aerobic 110 290 106 col/ml Colony count, anaerobic 920 15 106 col/ml Yeast and molds 90 230 104 col/ml Bacterial spores, aerobic 10-4 10-4 titer (ml) Bacterial spores, anaerobic 10-3 10-3 titer (ml) Sulfate-reducing bacteria 10-4 10-4 titer (ml) Coliforms 10-5 10-6 titer (ml)
References Geller, A. and Göttsching, L. 1982. Closing water system completely in the Federal Republic of Germany.
Tappi Journal 65(9): 97-101. Jung, W.K. and Kutzner, H.-J. 1978. Microbiologic problems associated with closed process water
systems in the paper industry. European Journal of Applied Microbiology and Biotechnology 5(2): 215-224.

ENVIRONMENTAL FOOTPRINT COMPARISON TOOL
A tool for understanding environmental decisions related to the pulp and paper industry
© 2013 National Council for Air and Stream Improvement. All rights reserved.
EFFECTS OF DECREASED WATER USE ON ODOR Odor in the Finished Product Robertson (2006) provides a brief overview of odor sources from finished products. Other good reviews of odors in final product are contained in Wiik and Helle (1998) and Pugh and Guthrie (2000). Volatile Fatty Acids Volatile fatty acids (VFAs) are a microbial odor source at mills, especially closed recycled boards mills. VFAs are produced by anaerobic bacteria during fermentation. The most common VFAs are acetic acid, propanoic acid, butyric acid, valeric acid and is-valeric acid. Nalco has reported that mills with VFA concentrations exceeding 700-1000 ppm are among most problem cases. Butyric, propanoic, and valeric acids can cause odor problems even at low concentrations. VFAs are found in the finished product, at the clarifier and dryer vents. They can be found in paper machine areas that have stagnant conditions and high nutrient loadings such as broke, coated broke, and starch chests. Fatty acids only become an odor problem if they are volatilized. The volatile form of VFAs is the uncharged, molecular form. The acid dissociation constant (pKa) values of some of the carboxylic acids are given in Table W19. The carboxylic acids in Table W19 dissociate in pH range of 3-5, so more alkaline pH levels favor decreased volatilization. Anaerobic bacteria, on the other hand, favor neutral to alkaline conditions.
Table W19. Dissociation Constants of Carboxylic Acids at 0.1 m Ionic Strength, Equilibrium Constants Valid at 25°C (values taken from Robertson 2006) Compound log10K Formic 3.752 Acetic 4.756 Glycolic 3.831 Propanoic 4.874 Butanoic 4.817
Hydrogen Sulfide Hydrogen sulfide can be a byproduct of anaerobic activity in pulp and paper mill process waters. The human nose is sensitive to hydrogen sulfide levels at concentrations of less than 1 ppm and thus, at low concentrations, its presence can be a nuisance. At high concentrations, hydrogen sulfide can be toxic and explosive so it is important to control the potential for its formation in process waters. Musty Geosmin Humans can detect geosmin and MIB (2-methylisovorneol) levels as low as 4 and 9 nanograms per liter, respectively. These compounds are associated with “earthy” or “musty” odors. Geosmin and MIB are metabolic by-products of “mold-like” filamentous bacteria and blue-green algae and are released into the water upon the death of these organisms. Geosmin and MIB may be formed in wastewater treatment systems and can be generated in paperboard when mills reuse a portion of their activated sludge in pulp furnish.

Effects of Decreased Water Use on Odor Odor in the Finished Product
© 2013 National Council for Air and Stream Improvement. All rights reserved.
Non-Microbial Fatty Acids Unsaturated fatty acids may oxidize to volatile odor-causing compounds having a paint-like or rancid smell. Thoroughly washing pulps minimizes the rancid odor problem, but pulp storage increases the auto-oxidation process. Hexanal, an example of a compound that can result from the auto-oxidation process, has a grassy, fruity, or green smell and can be a problem in some paper products. References Pugh, S. and Guthrie, J.T. 2000. Development of taint and odour in cellulosic carton-board packaging
systems. Cellulose 7:247-262. http://dx.doi.org/10.1023/A:1009222410875 Robertson, L. 2006. Odor source, location determines approach to finished product issues. Pulp & Paper
80(2): 38-42. Wiik, K. and Helle, T. 1998. Problems with paper odour – Possible ways to solve them. In Proceedings,
EUCEPA symposium 1998 – Chemistry in papermaking, 307-315. http://www.chemeng.ntnu.no/research/paper/Publications/1998/eucepa-98.pdf

ENVIRONMENTAL FOOTPRINT COMPARISON TOOL
A tool for understanding environmental decisions related to the pulp and paper industry
© 2013 National Council for Air and Stream Improvement. All rights reserved.
EFFECTS OF DECREASED WATER USE ON EMISSIONS TO AIR Overview When a pulp and paper facility reduces the amount of water used, chemical concentrations and temperatures in the mill water system often increase. This can result in increased emissions of a number of volatile compounds found in mill water systems. For instance, a typical water reduction strategy in chemical pulp mills is to recycle evaporator condensate to the brownstock area. This can double or triple methanol air emissions in process vents. Mills using elemental chlorine free (ECF) bleaching, that seek to recycle a portion or all of their bleach plant effluent to the recovery area, may find substantial increases in gaseous hydrochloric acid (HCl(g)) emissions from the kraft recovery boiler. Reducing water use can reduce energy requirements, resulting in reductions of combustion-related emissions to air. The inverse question, regarding the effects of reducing combustion-related air emissions on water use, is examined in the section of this Tool on SOx and NOx. More information on the relationship between water reuse and emissions to air can be found by following the links below. More information Organic air emissions Inorganic air emissions

ENVIRONMENTAL FOOTPRINT COMPARISON TOOL
A tool for understanding environmental decisions related to the pulp and paper industry
© 2013 National Council for Air and Stream Improvement. All rights reserved.
EFFECTS OF DECREASED WATER USE ON EMISSIONS TO AIR Organic Air Emissions In general, reduced water usage will increase concentrations of organic material and increase process flow temperatures; both factors tend to contribute to increased emissions of hazardous air pollutants (HAPs) and volatile organic compounds (VOCs). At low concentrations, the equilibrium behavior of VOCs can be described by Henry’s Law, which is a directly proportional relationship between liquid and gas concentrations of a constituent at a given temperature. NCASI has conducted extensive sampling to characterize HAP and VOC emissions from kraft mills (Jain 1996). Methanol was the primary HAP constituent from most sources sampled and methanol air emissions were, in most mill cases, linearly dependent upon liquid methanol concentrations. Jain discusses the impact of reduced water usage on methanol and HAP emissions in the brownstock washing area, oxygen delignification area, smelt dissolving tanks, bleach plants, and paper machines. The general conclusion is that reduced water usage will increase HAP and VOC emissions from process vents (Jain 1996). Other authors have reached similar conclusions. Venkatesh et al. (1997) conducted sampling at several mills and applied process simulation for mill-wide methanol balances. Figure W5 shows the linear relationship between liquid and air concentrations for paper machines and pulp dryers, based upon data from NCASI (1994) and Venkatesh et al. (1997). Gu et al. (1998) extended Venkatesh’s modeling concept to include variation of process temperature upon methanol equilibrium, mass transfer rates to predict deviations from equilibrium, and model validation with a number of mill concentrations. Gu et al. (1988) showed that recycling evaporator condensate can double or triple methanol air emissions in process vents in the brownstock washing area.
Figure W5. Methanol Emissions from Paper Machines/Pulp Dryers Based upon Mills Data [filled diamonds from NCASI 1994; open squares from Venkatesh et al. 1997]

Effects of Decreased Water Use on Emissions to Air Organic Air Emissions
© 2013 National Council for Air and Stream Improvement. All rights reserved.
References Gu, Y., Edwards, L., Haynes, J.B., and Euhus, L.E. 1998. Application of modular computer simulation for
VOC prediction in development of pulp and paper mill closure technology. Tappi Journal 81(2): 173-176.
Jain, A.K. 1996. Impact of water system closure on HAP and VOC emission from process vents. In
Proceedings of the Tappi Minimum Effluent Mill Symposium, 69-78. Atlanta, GA: Tappi Press. National Council [of the Paper Industry] for Air and Stream Improvement, Inc. (NCASI) 1994. Volatile
organic emissions form pulp and paper mill sources, Part VII: Pulp dryers and paper machines at integrated chemical pulp mills. Technical Bulletin No 681. New York, NY: National Council of the Paper Industry for Air and Stream Improvement, Inc.
Venkatesh, V., Lapp, W.L., and Parr, J.L. 1997. Millwide methanol balances: Predicting and evaluating
HAP emissions by utilizing process simulation techniques. Tappi Journal 82(2): 171-176.

ENVIRONMENTAL FOOTPRINT COMPARISON TOOL
A tool for understanding environmental decisions related to the pulp and paper industry
© 2013 National Council for Air and Stream Improvement. All rights reserved.
EFFECTS OF DECREASED WATER USE ON EMISSIONS TO AIR Inorganic Air Emissions Elemental chlorine free (ECF) mills that seek to reduce water use by recycling a portion or all of their bleach plant effluent my find substantial increases in gaseous hydrochloric acid (HCl(g)) emissions. U.S. EPA has promulgated laws limiting HCl(g) emission. Adams examined the effect of increased chloride recycle to the kraft recovery cycle and determined that the loss of chloride due to HCl(g) leaving with the recovery boiler stack can be substantial (Adams 1994). A general chloride balance for kraft mills shows the importance of this HCl(g) export vector, which is anticipated to become more prominent over time with increased recycle of chloride-containing bleach plant filtrates to the recovery area.
Table W20. General Chloride Balance for Kraft Mills (Adams 1994) Stream
Typical Cl (kg/odt)
Range Cl (kg/odt)
Inputs Wood 0.05 0-15 Process water 0.2 0.01-10 Chemical make-up purchased 0.1 0.05-0.4 ClO2 generator 0.25 0.1-0.8 Bleach plant filtrates 10 4-70 Losses Pulp 0.2 0.08-0.8 RB stack dust 0.01 0.005-0.05 HCl 0.5 0-2.5 Spills and misc. 0.15 0.05-0.5
References Adams, T.N. 1994. Overview of closed-cycle technology for kraft pulping and bleaching. Report Number
One. Project 3684/F017. Atlanta, GA: Institute of Paper Science and Technology. https://smartech.gatech.edu/xmlui/bitstream/handle/1853/511/F017_001_02211994.pdf

ENVIRONMENTAL FOOTPRINT COMPARISON TOOL
A tool for understanding environmental decisions related to the pulp and paper industry
© 2013 National Council for Air and Stream Improvement. All rights reserved.
EFFECTS OF DECREASED WATER USE ON DISCHARGES TO WATER Overview Mills that reduce water use will often find that discharges of biochemical oxygen demand (BOD), chemical oxygen demand (COD), and total suspended solids (TSS) are also reduced. This is because water reuse programs often include practices such as liquor loss and spill control, which tend to reduce effluent flows as well as decrease losses of organic matter and solids. In addition, the performance of wastewater treatment plants is often improved when wastewater volumes are reduced. In some cases, however, water reuse programs cause increases wastewater temperatures or concentrations of some parameters, resulting in reduced wastewater treatment plant performance and increased discharges of BOD, COD, and TSS. The relationships between effluent flows and wastewater loads of BOD, COD, and TSS are complex and there are many ways to reduce water use that will not affect wastewater loads at all. The inverse question is examined in the section Effects of Decreased BOD/COD & TSS on Water Use. Comparisons across dissimilar sub-sectors of the industry are generally not valid. In other words, facilities in a sub-sector of the industry characterized by low effluent flows do not necessarily also have low discharges of BOD, COD, and TSS. More information on the interactions between reducing effluent flows and the discharge of various parameters to wastewater is available at the links below. More information Effective liquor loss reduction and spill control Limitations on effluent temperatures

ENVIRONMENTAL FOOTPRINT COMPARISON TOOL
A tool for understanding environmental decisions related to the pulp and paper industry
© 2013 National Council for Air and Stream Improvement. All rights reserved.
EFFECTS OF DECREASED WATER USE ON DISCHARGES TO WATER Effective Liquor Loss Reduction and Spill Control Consistently meeting effluent quality objectives involves effective management of losses of organic material to sewer and successful use of wastewater treatment systems. While the recovery of pulping chemicals is a central component of virtually all1 chemical pulping facilities, there are ongoing routine losses of these chemicals, due to the complex nature of the processing systems, which are either recovered back into the process or are sent to wastewater treatment. In contrast to “spills” of spent pulping liquor, “losses” occur on a relatively ongoing basis, given that daily facility operations result in both intentional and unintentional releases of dilute spent liquor into the process sewer system. These losses, which are different from larger spills, can occur within the pulp processing and pulping chemical recovery systems, from pumps, valves, knotters, screens, washers, and other equipment, as well as through intentional diversions from the evaporators (e.g., during boil-outs), digesters (e.g., during hard or soft cooks), and during start-up and shutdown operations. Losses can also occur unintentionally through human error, tank overfilling, or mechanical failure. These losses do not typically lead to a regulatory exceedance, but can contribute to effluent characteristics such as color and foam. Reducing and recovering losses of spent pulping liquors can result in better performance of wastewater treatment systems, decreased “pass through” of substances that may resist biological degradation, and incremental benefits to the mill’s energy generation and chemical cost profiles (NCASI 1982, 2006; Amendola et al. 1996; USEPA 1997). The bleach plant contributes approximately 2.5 kg COD/ton of pulp for each Kappa point drop in the bleach plant. Planned discharge from the brownstock washers and screening is approximately 1 kg COD/kg saltcake lost. The remaining COD contribution to the effluent treatment plant can be attributed to unplanned discharges and range from 1 kg/ton pulp to 40 kg/ton pulp. Dynamic simulation is a useful tool for liquor loss evaluation and spill collection system design (Lundström et al. 2003). NCASI Special Report 12-02 provides perspective on designing and implementing best management practices for reducing in-plant spent pulping liquor losses, along with a summary of potential benefits (NCASI 2012). NCASI Technical Bulletin No. 341 describes spill management at four mills (NCASI 1981). Spill management techniques at mills are also reviewed in NCASI Technical Bulletin No. 557 (NCASI 1988).
References Amendola, G.A., K. Vice, and N. McCubbin, 1996. Design considerations for cost-effective kraft and
sulfite pulping liquor control systems. In TAPPI Minimum Effluent Symposium Proceedings. January 1996.
Lundström, A., Annergren, G., Berglin, N., and Agebjörn, J. 2003. Spill – A significant discharge that can be reduced. Paper Technology 44(3): 51-55.
1 While all kraft pulping facilities recover their spent pulping liquor, there are constraints facing sulphite pulping mills that do not use magnesium as a pulping base. Very few non-magnesium base sulphite mills are in operation today.

Effects of Decreased Water Use on Discharges to Water Effective Liquor Loss Reduction and Spill Control
© 2013 National Council for Air and Stream Improvement. All rights reserved.
National Council [of the Paper Industry] for Air and Stream Improvement, Inc. (NCASI). 1981. Development of a management strategy for intermittent losses. Technical Bulletin No. 341. New York, NY: National Council of the Paper Industry for Air and Stream Improvement, Inc.
National Council [of the Paper Industry] for Air and Stream Improvement, Inc. (NCASI). 1982. Effluent
foam control practices. Technical Bulletin No. 378. Research Triangle Park, NC: National Council for Air and Stream Improvement, Inc.
National Council [of the Paper Industry] for Air and Stream Improvement, Inc. (NCASI). 1988. Pulp and
paper mill in-plant and closed cycle technologies – A review of operating experience, current status, and research needs. Technical Bulletin No. 341. New York, NY: National Council of the Paper Industry for Air and Stream Improvement, Inc.
National Council for Air and Stream Improvement, Inc. (NCASI). 2006. Review of color control
technologies and their applicability to modern kraft pulp mill wastewater. Technical Bulletin No. 919. Research Triangle Park, NC: National Council for Air and Stream Improvement, Inc.
National Council for Air and Stream Improvement (NCASI), 2012. NCASI Special Report No. 12-02.
Approaches for in-plant reduction of spent pulping liquor losses. Research Triangle Park, NC: National Council for Air and Stream Improvement, Inc.
United States Environmental Protection Agency (USEPA). 1997. Technical support document for best management practices for spent pulping liquor management, spill prevention, and control. EPA 821-R-97-015. Washington, DC: United States Environmental Protection Agency.

ENVIRONMENTAL FOOTPRINT COMPARISON TOOL
A tool for understanding environmental decisions related to the pulp and paper industry
© 2013 National Council for Air and Stream Improvement. All rights reserved.
EFFECTS OF DECREASED WATER USE ON DISCHARGES TO WATER Limitations on Effluent Temperatures One of the effects of increased water reuse is often an increase in wastewater temperatures. At some level, an increase in wastewater temperature can affect wastewater treatment operations. Temperature affects chemical reaction kinetics and microbiological growth (NCASI 1985). The mesophilic temperature range (20-35°C) is optimal for the growth of bacteria. In the thermophylic temperature range (50°C) organisms form difficult-to-remove spores. Dissolved oxygen begins to decrease in the range of 49-55°C, reducing the growth of aerobic bacteria and promoting the growth of anaerobic bacteria (Gudlauski 1996). Sulfate-reducing bacteria produce odorous toxic and explosive gases (H2S and H2), which can react with ferrous ions, accelerating corrosion (Von Holy 1988). Flippin and Eckenfelder (1994) examined the effects of final effluent temperatures on the performance of an activated sludge plant treating pulp mill effluents. Their major conclusions were temperatures exceeding 40°C adversely impact treatment plant performance by 1) suppressed BOD removal; 2) increased effluent solids concentration; and 3) poorer sludge settleability. In some cases, the adverse impact was noted at temperatures as low as 32°C. References Flippin, T.H. and Eckenfelder Jr., W.W. 1994. Effects of elevated temperature on the activated sludge
process. In Proceedings of the 1994 TAPPI Environmental Conference, 947-949. Atlanta, GA: Tappi Press.
Gudlauski, D.G. 1996. Whitewater system closure means managing microbiological build-up. Pulp &
Paper 70(3):161-165. National Council [of the Paper Industry] for Air and Stream Improvement, Inc. (NCASI). 1985. Modification
of the NCASI ASB treatment plant model for simulating conditions when basin temperatures exceed 35°C. NCASI Technical Bulletin 477. New York, NY: National Council of the Paper Industry for Air and Stream Improvement, Inc.
Von Holy, A. 1988. Microbiologically induced corrosion – Are we on target? Paper Southern Africa 2:23-
27.

ENVIRONMENTAL FOOTPRINT COMPARISON TOOL
A tool for understanding environmental decisions related to the pulp and paper industry
© 2013 National Council for Air and Stream Improvement. All rights reserved.
EFFECTS OF DECREASED WATER USE ON SOLID WASTE Overview In most cases, there is no reason to expect a significant change in solid waste generation when water use is reduced. Some methods for reducing water use also result in lower losses of fiber, so some co-benefits are possible.