environmental science by john bradley & dr david johnston – licensed under the creative...
TRANSCRIPT
Environmental Science
By John Bradley & Dr David Johnston – licensed under the Creative Commons Attribution – Non-Commercial – Share Alike License
http://creativecommons.org/licenses/by-nc-sa/2.5/
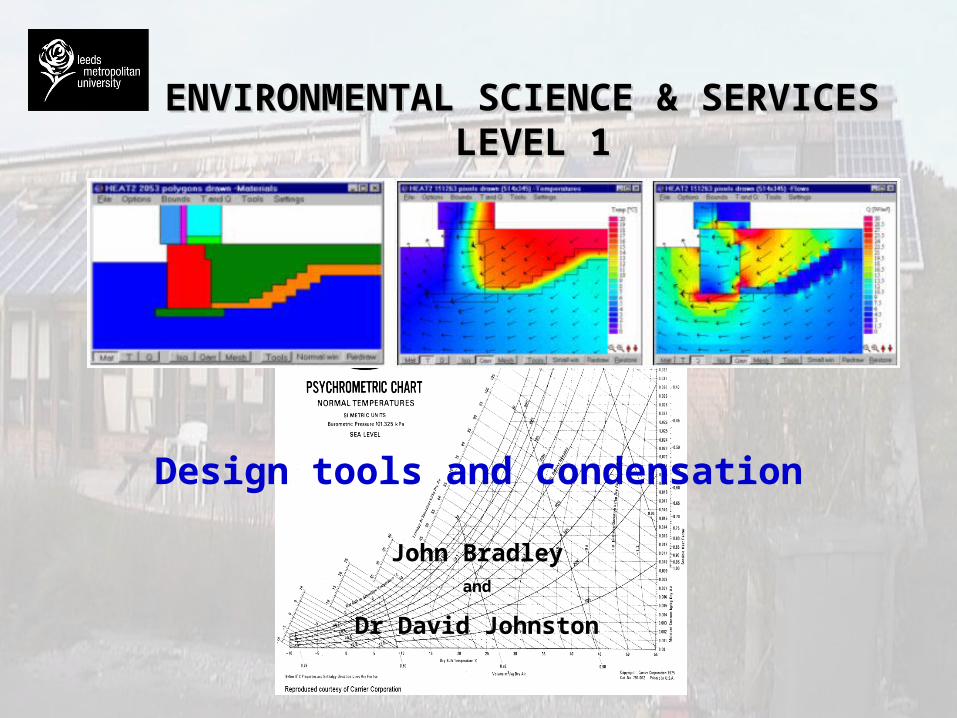
ENVIRONMENTAL SCIENCE & SERVICES ENVIRONMENTAL SCIENCE & SERVICES LEVEL 1LEVEL 1
Design tools and condensation
John Bradleyand
Dr David Johnston
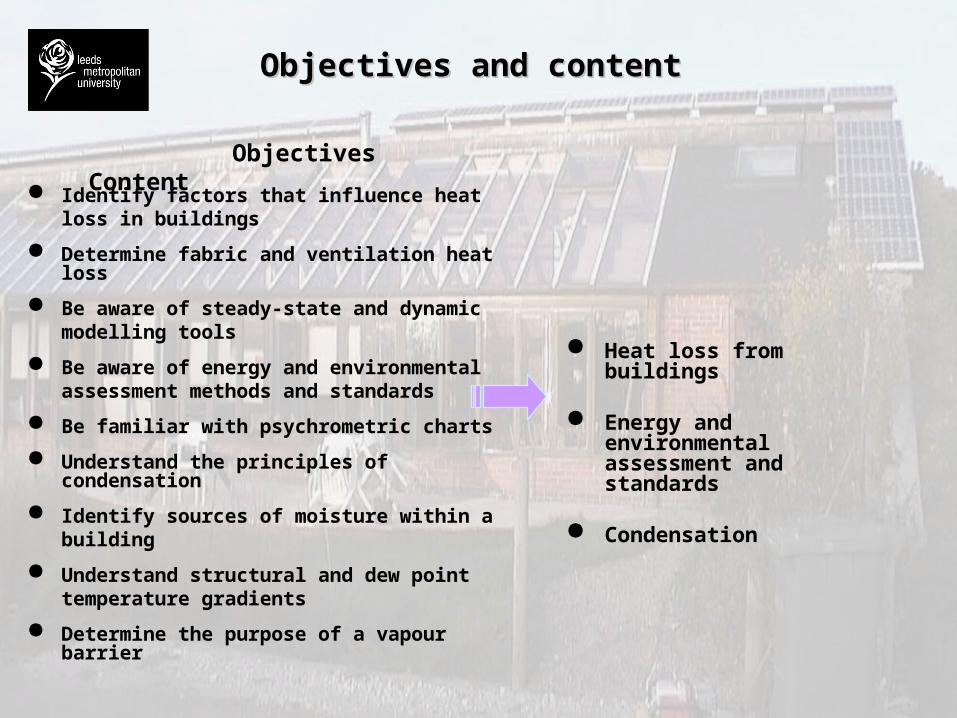
Objectives and contentObjectives and content
Identify factors that influence heat loss in buildings
Determine fabric and ventilation heat loss
Be aware of steady-state and dynamicmodelling tools
Be aware of energy and environmentalassessment methods and standards
Be familiar with psychrometric charts
Understand the principles of condensation
Identify sources of moisture within a building
Understand structural and dew pointtemperature gradients
Determine the purpose of a vapour barrier
Heat loss from buildings
Energy and environmental assessment and standards
Condensation
Objectives Content
Heat loss from buildings
Factors affecting heat loss
Calculation of heat loss
Steady state methods
Dynamic methods
Factors affecting heat lossFactors affecting heat loss
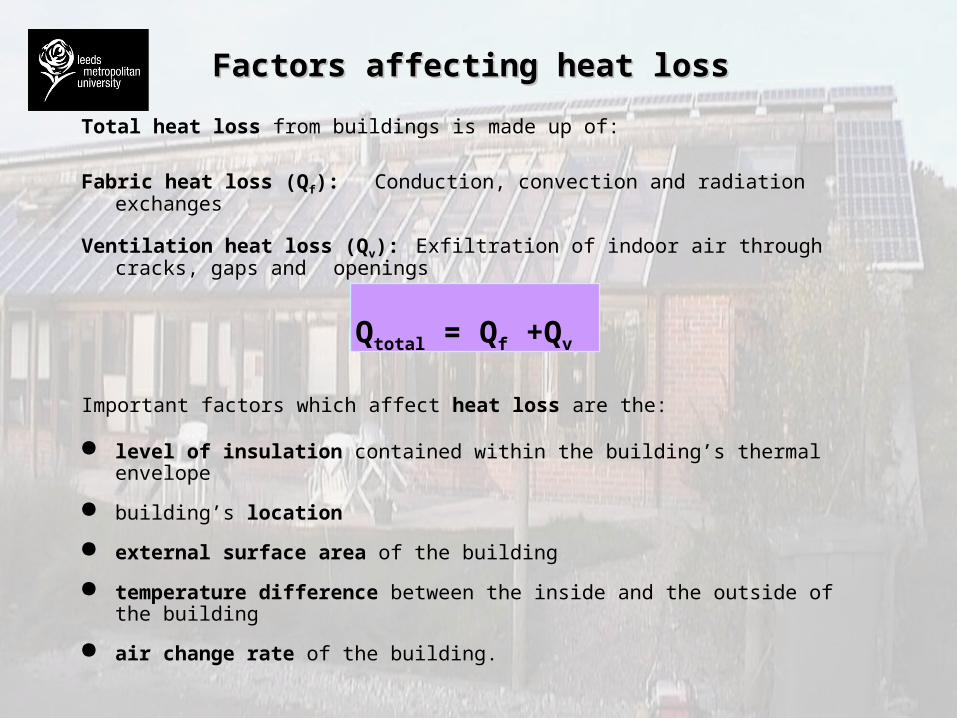
Total heat loss from buildings is made up of:
Fabric heat loss (Qf): Conduction, convection and radiation exchanges
Ventilation heat loss (Qv): Exfiltration of indoor air through cracks, gaps and openings
Qtotal = Qf +Qv
Important factors which affect heat loss are the:
level of insulation contained within the building’s thermal envelope
building’s location
external surface area of the building
temperature difference between the inside and the outside of the building
air change rate of the building.
Calculation of heat loss Calculation of heat loss
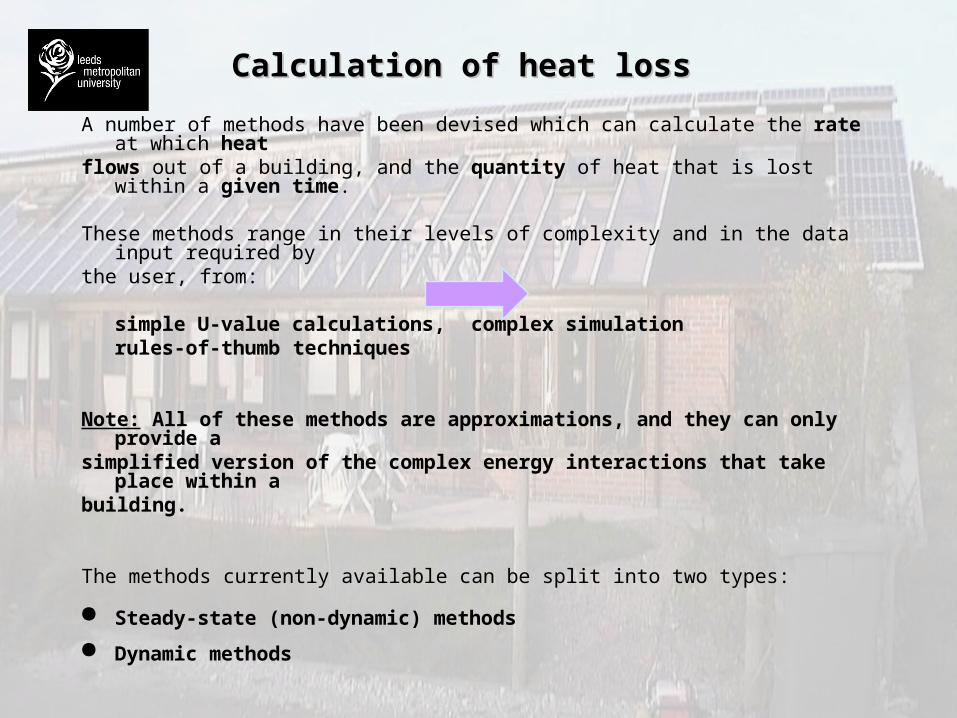
A number of methods have been devised which can calculate the rate at which heat flows out of a building, and the quantity of heat that is lost within a given time.
These methods range in their levels of complexity and in the data input required bythe user, from:
simple U-value calculations, complex simulationrules-of-thumb techniques
Note: All of these methods are approximations, and they can only provide a
simplified version of the complex energy interactions that take place within a building.
The methods currently available can be split into two types:
Steady-state (non-dynamic) methods
Dynamic methods
Steady-state (non-dynamic) methodsSteady-state (non-dynamic) methods
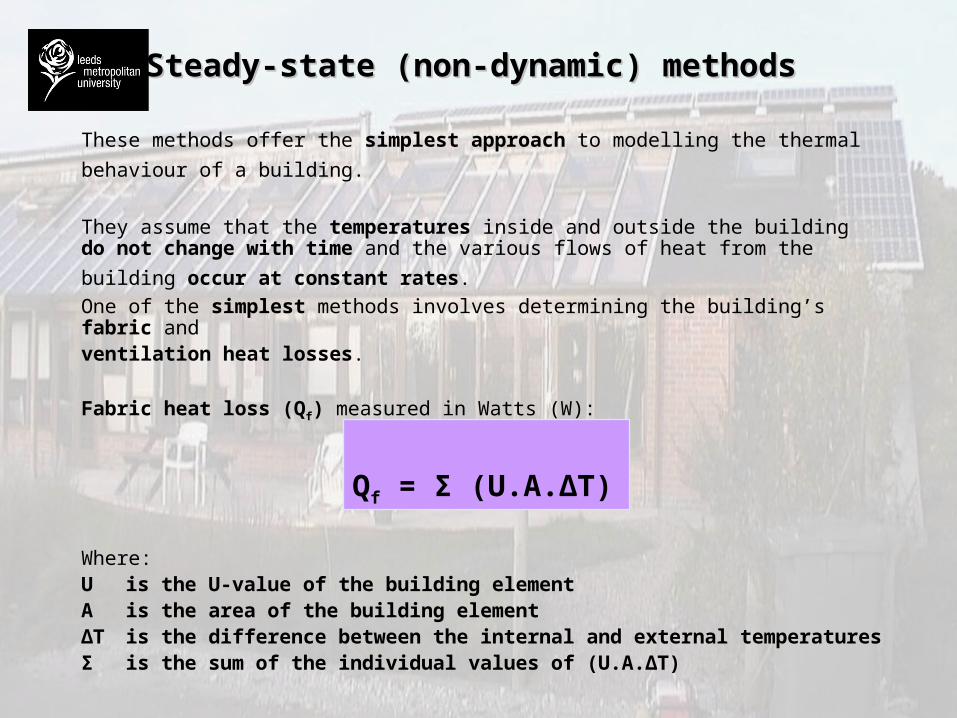
These methods offer the simplest approach to modelling the thermal behaviour of a
building.
They assume that the temperatures inside and outside the building do not change
with time and the various flows of heat from the building occur at constant rates. One of the simplest methods involves determining the building’s fabric and ventilation heat losses.
Fabric heat loss (Qf) measured in Watts (W):
Qf = Σ (U.A.ΔT)
Where:U is the U-value of the building elementA is the area of the building elementΔT is the difference between the internal and external temperaturesΣ is the sum of the individual values of (U.A.ΔT)
Steady-state (non-dynamic) methodsSteady-state (non-dynamic) methods
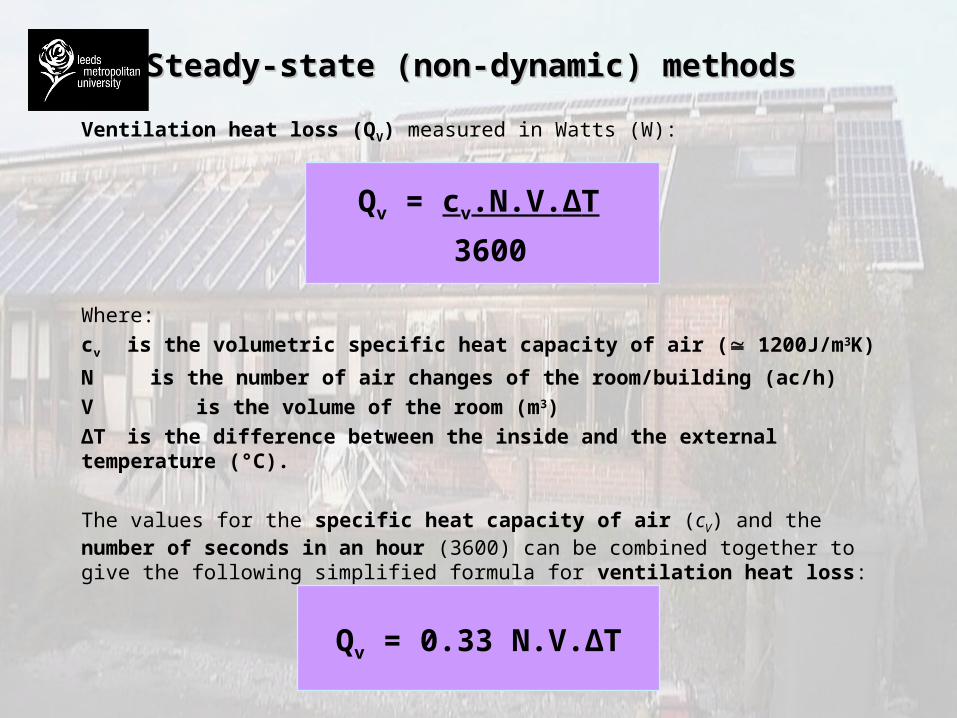
Ventilation heat loss (QV) measured in Watts (W):
Qv = cv.N.V.ΔT
3600
Where:
cv is the volumetric specific heat capacity of air ( 1200J/m3K)
N is the number of air changes of the room/building (ac/h)
V is the volume of the room (m3)
ΔT is the difference between the inside and the external temperature (°C).
The values for the specific heat capacity of air (cV) and the number of seconds in an hour (3600) can be combined together to give the following simplified formula for ventilation heat loss:
Qv = 0.33 N.V.ΔT
Steady-state (non-dynamic) methodsSteady-state (non-dynamic) methods
A number of other steady-state modelling tools are available. These include: Degree Day Method. LT4 Method. BREDEM (Building Research Establishment Domestic Energy Model).
In the UK, BREDEM is one of the most widely used non-dynamic approaches to
modelling the space heating requirement of dwellings.
The core of BREDEM consists of a two-zone model, which reflects the fact that
most dwellings are run with the living room temperature several degrees above that
of the rest of the house. Typical factors included in the BREDEM calculation are: Transmission and ventilation losses. Efficiency and responsiveness of the heating system. The user's choice of temperatures and heating periods. Solar gains. Internal and external temperatures.
Dynamic methodsDynamic methods
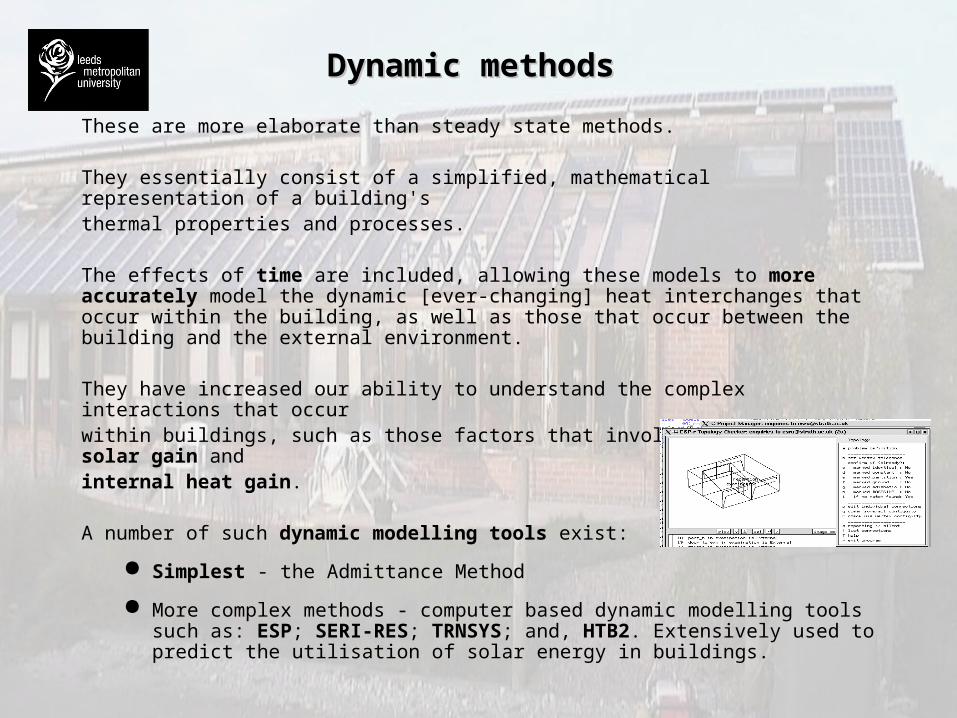
These are more elaborate than steady state methods.
They essentially consist of a simplified, mathematical representation of a building's thermal properties and processes.
The effects of time are included, allowing these models to more accurately model the dynamic [ever-changing] heat interchanges that occur within the building, as well as those that occur between the building and the external environment.
They have increased our ability to understand the complex interactions that occur within buildings, such as those factors that involve thermal mass, solar gain and internal heat gain.
A number of such dynamic modelling tools exist:
Simplest - the Admittance Method
More complex methods - computer based dynamic modelling tools such as: ESP; SERI-RES; TRNSYS; and, HTB2. Extensively used to predict the utilisation of solar energy in buildings.
Dynamic methodsDynamic methods
Dynamic thermal models are essential for:
Assessing the importance of thermal mass to the performance of the building Estimating peak temperatures Estimating the energy benefits of passive solar energy Estimating the energy benefits of internal free heat gains Assessing the performance of any building in which free heat gains cover
most or all of the space heating load (e.g. superinsulated buildings) Assessing the importance of control systems and strategies (optimum start
controls, etc.)
However, there are a number of problems associated with dynamic thermal
models. These include:
All practical implementations are 1 dimensional - buildings are 3 dimensional, and the effects of corners etc. may be important.
All implementations require careful approximation and exercise of judgement
All formations make approximations regarding solar data and ventilation.
Actual versus predicted heat lossActual versus predicted heat loss
However sophisticated the modeling of heat loss it will only be an approximation of the actual heat lost in a building. A co-heating test can show the actual heat lost from a building.
A co-heating test is a method of measuring the actual heat loss (both fabric and background ventilation) in W/K attributable to an unoccupied dwelling. It involves heating the inside of a dwelling electrically, using electric resistance point heaters, to an elevated mean internal temperature (typically 25°C) over a specified period of time, typically between 1 to 3 weeks. By measuring the amount of electrical energy that is required to maintain the elevated mean internal temperature each day, the daily heat input (in Watts) to the dwelling can be determined. The greater the energy input required to maintain a particular temperature differential, the greater the heat loss.
Actual versus predicted heat lossActual versus predicted heat loss
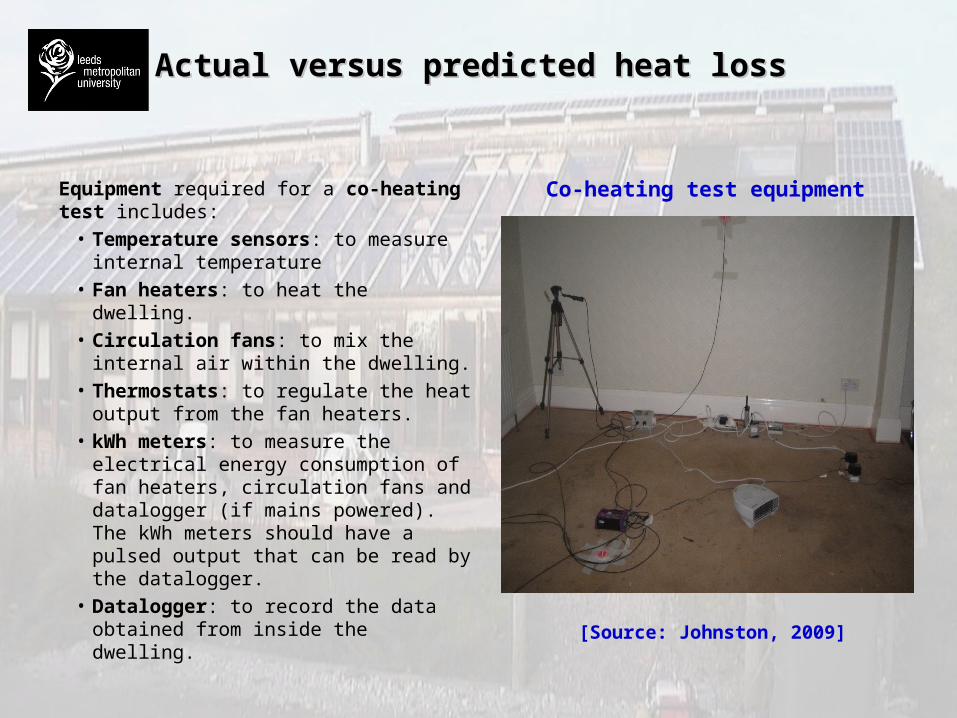
Equipment required for a co-heating test includes:
• Temperature sensors: to measure internal temperature
• Fan heaters: to heat the dwelling. • Circulation fans: to mix the internal air
within the dwelling.• Thermostats: to regulate the heat
output from the fan heaters.• kWh meters: to measure the electrical
energy consumption of fan heaters, circulation fans and datalogger (if mains powered). The kWh meters should have a pulsed output that can be read by the datalogger.
• Datalogger: to record the data obtained from inside the dwelling.
Co-heating test equipment
[Source: Johnston, 2009]
Actual versus predicted heat lossActual versus predicted heat loss
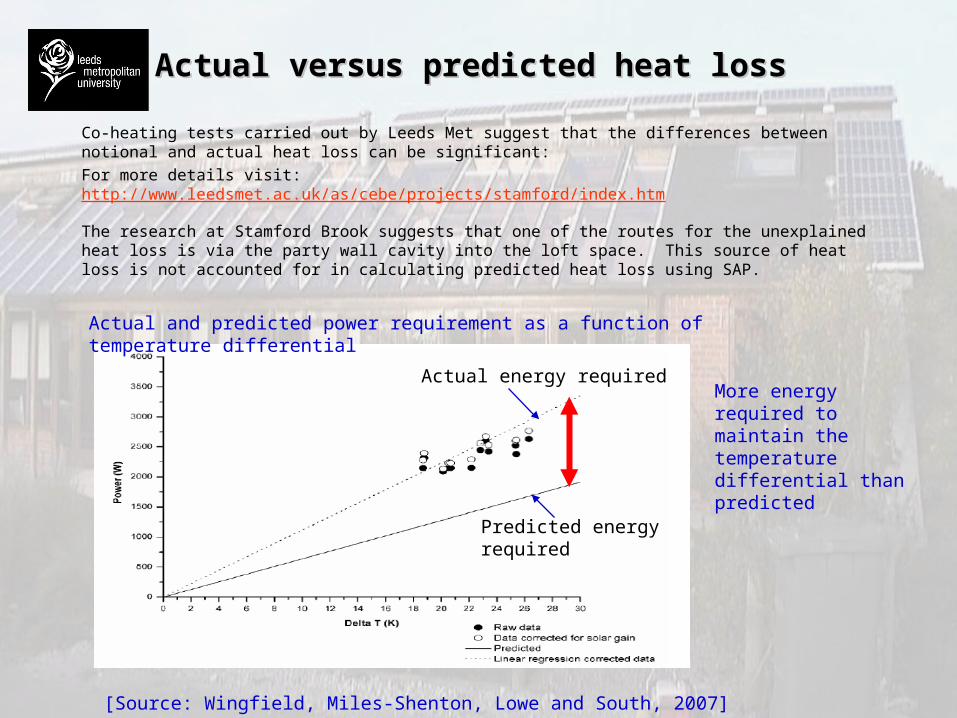
Co-heating tests carried out by Leeds Met suggest that the differences between notional and actual heat loss can be significant:
For more details visit: http://www.leedsmet.ac.uk/as/cebe/projects/stamford/index.htm
The research at Stamford Brook suggests that one of the routes for the unexplained heat loss is via the party wall cavity into the loft space. This source of heat loss is not accounted for in calculating predicted heat loss using SAP.
[Source: Wingfield, Miles-Shenton, Lowe and South, 2007]
More energy required to maintain the temperature differential than predicted
Predicted energy required
Actual energy required
Actual and predicted power requirement as a function of temperature differential
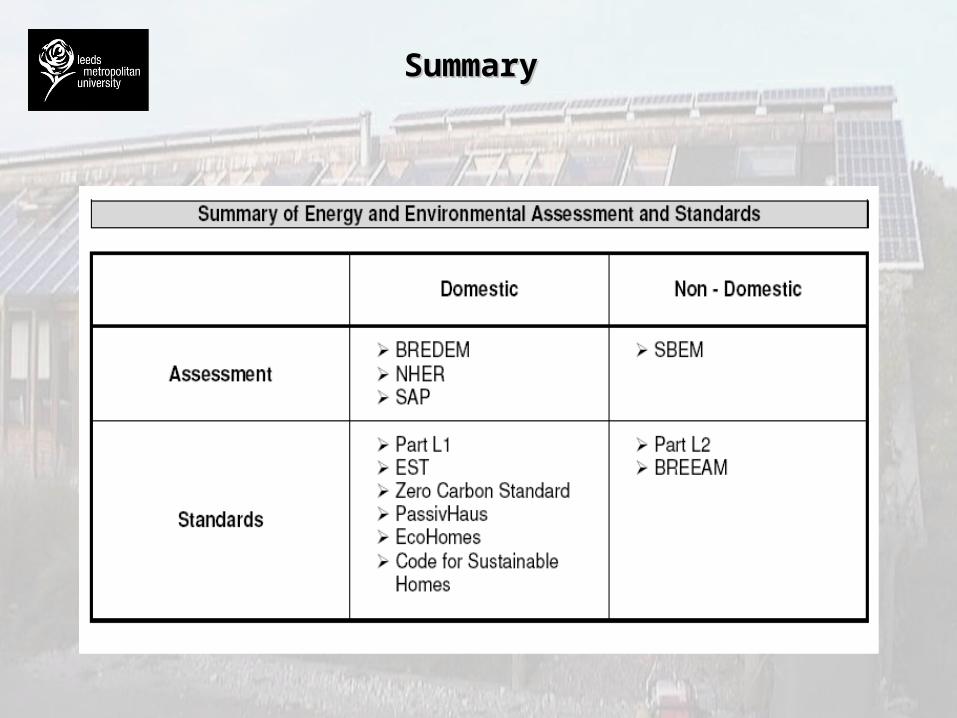
Energy and environmental assessment and standards
Domestic buildings: assessment methods
SAP
Domestic buildings: standards
Code for Sustainable Homes
Non-domestic buildings: assessment methods
Non-domestic buildings: standards
Domestic buildings: assessment methods
The assessment methods used for most of the UK’s energy standards for domestic buildings are based on BREDEM, the Building Research Establishment Domestic Energy Model. This predicts annual fuel use, fuel costs and CO2
emissions under a standard occupancy pattern (rating refers to the dwelling, not the way it is used by a particular household). BREDEM is the basis of both the National Home Energy Rating and the Standard Assessment Procedure
The National Home Energy Rating (NHER) is the leading domestic energy rating scheme in the UK. The NHER rating of a dwelling is based on the estimated total annual fuel use (for space heating, water heating, cooking, lighting and the use of appliances), per square metre of floor space, under standard occupancy. It is expressed on a scale of 0 (very inefficient) to 20 (very low carbon).
SAP is the Government's Standard Assessment Procedure for Energy Rating of Dwellings. SAP 2005 is adopted by government as part of the UK national methodology for calculation of the energy performance of buildings. It is used to demonstrate compliance with Building Regulations for dwellings (Part L) and to provide energy ratings for dwellings.
SAPSAP
The SAP rating is based on the energy costs associated with space heating, water heating, ventilation and lighting, less cost savings from energy generation technologies. It is adjusted for floor area so that it is independent of dwelling sizefor a given built form. The SAP rating is expressed on a scale of 1 to 100, the higher the number the lower the running costs.
The Environmental Impact rating is based on the annual CO2 emissionsassociated with space heating, water heating, ventilation and lighting, less the emissions saved by energy generation technologies. It is adjusted for floor area sothat it is independent of dwelling size for a given built form. The EnvironmentalImpact rating is expressed on a scale of 1 to 100, the higher the number the better the standard.
The Dwelling CO2 Emission Rate is a similar indicator to the EnvironmentalImpact rating, used for compliance with Building Regulations. It is equal to theannual CO2 emissions per unit floor area for space heating, water heating,ventilation and lighting, less the emissions saved by energy generation technologies, expressed in kg/m2/year.
The methodology is compliant with the Energy Performance of Buildings Directive.
The Government’s Standard Assessment Procedure (SAP) for assessing the energy
performance of dwellings provides the following indicators:
Domestic buildings: standardsDomestic buildings: standards
Building Regulations AD Part L1
Energy Saving Trust Best Practice Energy Standards Good Practice: 10% better than Part L1 Best Practice: 25% improvement on Part L1 Advanced Practice: 60% improvement on Part L1
AECB Silver and Gold energy standards
Passivhaus Standard: developed in Germany, supported by EU
Commission as pan-European standard for low carbon dwellings
EcoHomes Scheme: assesses buildings against a wide range
of environmental criteria and rates them as Pass, Good,
Very Good and Excellent. In part, superceded by:
The Code for Sustainable Homes: to be used in the design
and construction of new homes in England
There are a number of standards by which domestic energy and environmental performance can be measured:
Code for Sustainable HomesCode for Sustainable Homes
Launched in December 2006 with the publication of ‘Code for Sustainable Homes: Astep change in sustainable home building practice”. This introduced a single nationalstandard to be used in the design and construction of new homes in England, basedon the BRE’s EcoHomes scheme.
The Code is a set of sustainable design principles covering performance in nine areas:
Energy and CO2
Water Materials Surface water run-off Waste Pollution Heath and well being Management Ecology
In each of these categories, performance targets are proposed in excess of theminimum needed to satisfy Building Regulations, but are considered to be soundbest practice, technically feasible, and within the capability of the building industry tosupply.
The Code uses a rating system of one to six stars
Non-domestic buildings: assessment methods
The EU Energy Performance of Buildings Directive (EPBD) requires each member state to create a methodology for the calculation of the energy performance of buildings.
The Simplified Building Energy Model (SBEM) has been developed by BRE for
government as the default calculation for non-domestic buildings in the UK, and to enable building regulations compliance checks and energy ratings to be carried out on a consistent basis.
SBEM is a computer programme that provides an analysis of a building’s energyconsumption. It calculates monthly energy use and CO2 emissions of a buildinggiven a description of the building geometry, construction, use and HVAC andlighting design. These are then compared with those of a notional building.
Non-domestic buildings: standards
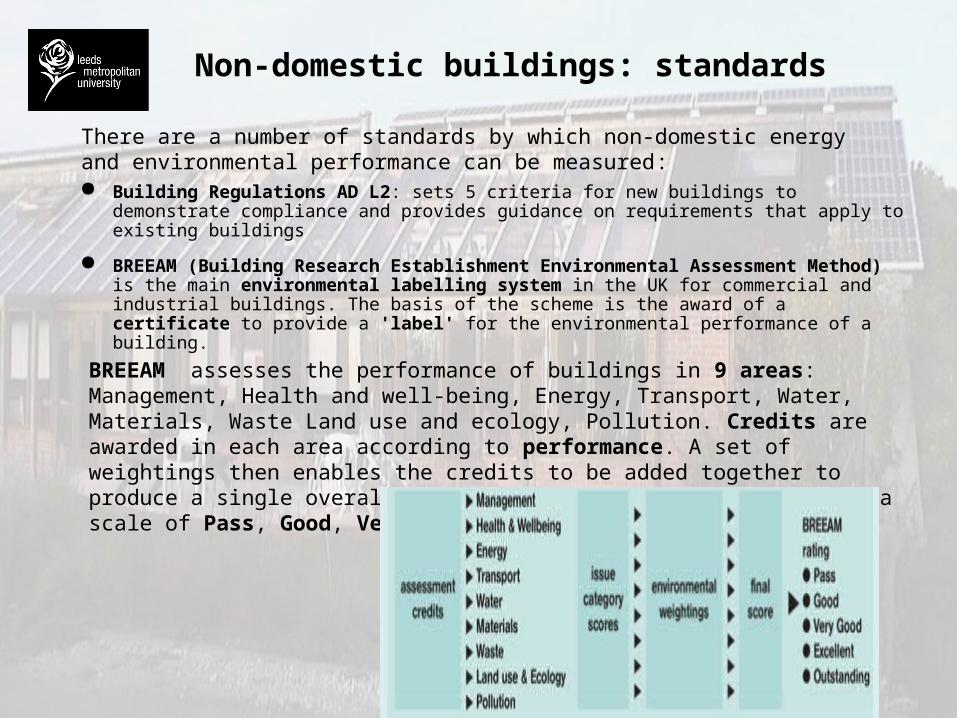
Building Regulations AD L2: sets 5 criteria for new buildings to demonstrate compliance and provides guidance on requirements that apply to existing buildings
BREEAM (Building Research Establishment Environmental Assessment Method) is the main environmental labelling system in the UK for commercial and industrial buildings. The basis of the scheme is the award of a certificate to provide a 'label' for the environmental performance of a building.
There are a number of standards by which non-domestic energy and environmental performance can be measured:
BREEAM assesses the performance of buildings in 9 areas: Management, Health and well-being, Energy, Transport, Water, Materials, Waste Land use and ecology, Pollution. Credits are awarded in each area according to performance. A set of weightings then enables the credits to be added together to produce a single overall score. The building is then rated on a scale of Pass, Good, Very Good, Excellent and Outstanding.
SummarySummary
Condensation
Humidity
Condensation in buildings
Structural temperature gradient
Dew point temperature gradient
Interstitial condensation risk
Minimising condensation risk
HumidityHumidity
Moisture in the air, or humidity, influences the heat balance and comfort of thehuman body, the durability of building materials and also causes condensation inbuildings
Air always contains some water vapour (wv) ie has humidity. The amount of waterthat can be present in air is related to the ambient temperature. Warmer air cancontain more moisture than cooler air. When the upper limit of wv is reached, the airis saturated.
The actual amount of wv in the air relative to the maximum saturation level is therelative humidity (RH). The temperature at which air is fully saturated (ie at 100% RH) is the dew point temperature. If the temperature falls below the dew point temperature, the air cannot contain all the wv present and some wv will condense into a liquid (ie condensation will occur).
Water vapour is a gas, suspended in air. It exerts a pressure which increases with wv content and/or temperature. The pressure exerted by the molecules of wv contained in the air is the vapour pressure. Pressure and temperature differentials will cause warm, humid air to diffuse to colder areas, colder surfaces and permeate colder structures, leading to cooling of the air and possible condensation.
Humidity: definitionsHumidity: definitions
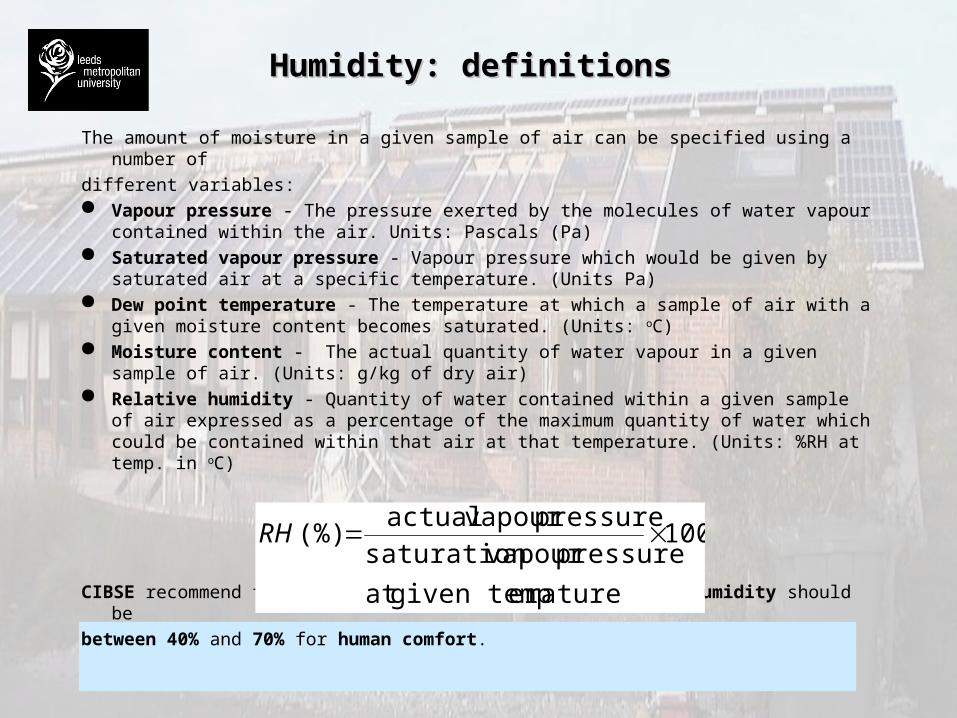
The amount of moisture in a given sample of air can be specified using a number of
different variables: Vapour pressure - The pressure exerted by the molecules of water vapour
contained within the air. Units: Pascals (Pa) Saturated vapour pressure - Vapour pressure which would be given by saturated
air at a specific temperature. (Units Pa) Dew point temperature - The temperature at which a sample of air with a given
moisture content becomes saturated. (Units: oC) Moisture content - The actual quantity of water vapour in a given sample of air.
(Units: g/kg of dry air) Relative humidity - Quantity of water contained within a given sample of air
expressed as a percentage of the maximum quantity of water which could be contained within that air at that temperature. (Units: %RH at temp. in oC)
CIBSE recommend that for most applications, the relative humidity should be
between 40% and 70% for human comfort.
100
eraturegiven tempat
pressure vapour saturation
pressure vapour actual(%) RH
Humidity: sources ofHumidity: sources of
If no moisture is added to the internal air of a building, then condensation would
not be significant. However, in practice this is not the case.
The majority of the moisture within buildings comes from: Building occupants - sweating and breathing.
However, moisture also comes from: Cooking Clothes washing Clothes drying The use of un-flued heating appliances Industrial processes
Table A10.12 in the CIBSE Guide (CIBSE, 1999) gives estimates of the amount of
moisture likely to be produced from a variety of sources.
In addition, building materials will absorb moisture from the environment. This
moisture will then be released back into the atmosphere when the internal
conditions allow it.
Humidity: Psychrometric Chart
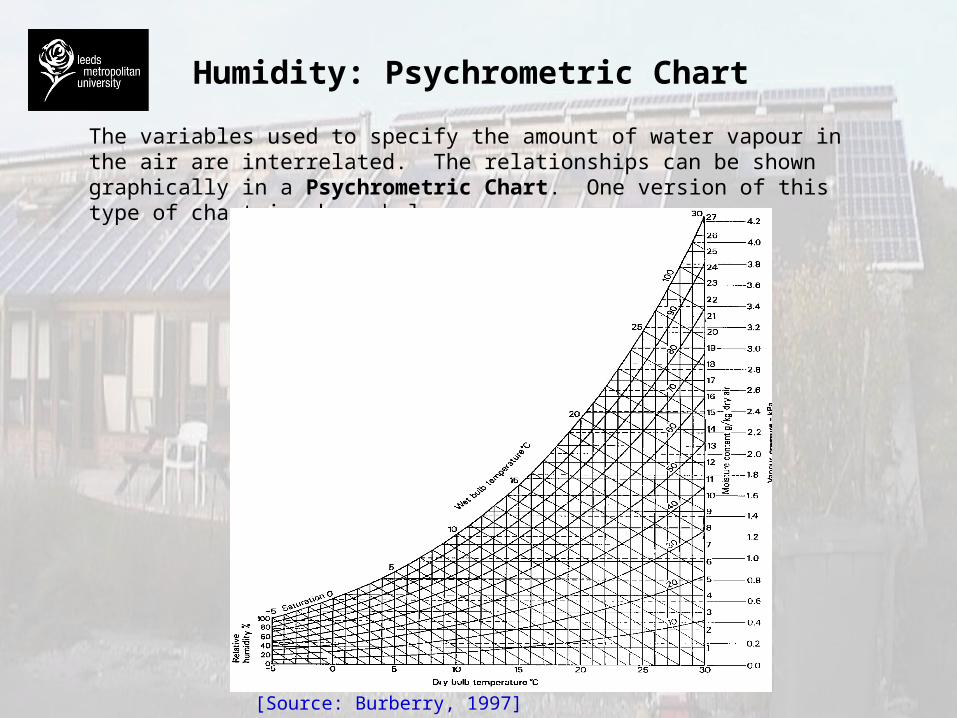
The variables used to specify the amount of water vapour in the air are interrelated. The relationships can be shown graphically in a Psychrometric Chart. One version of this type of chart is shown below:
[Source: Burberry, 1997]
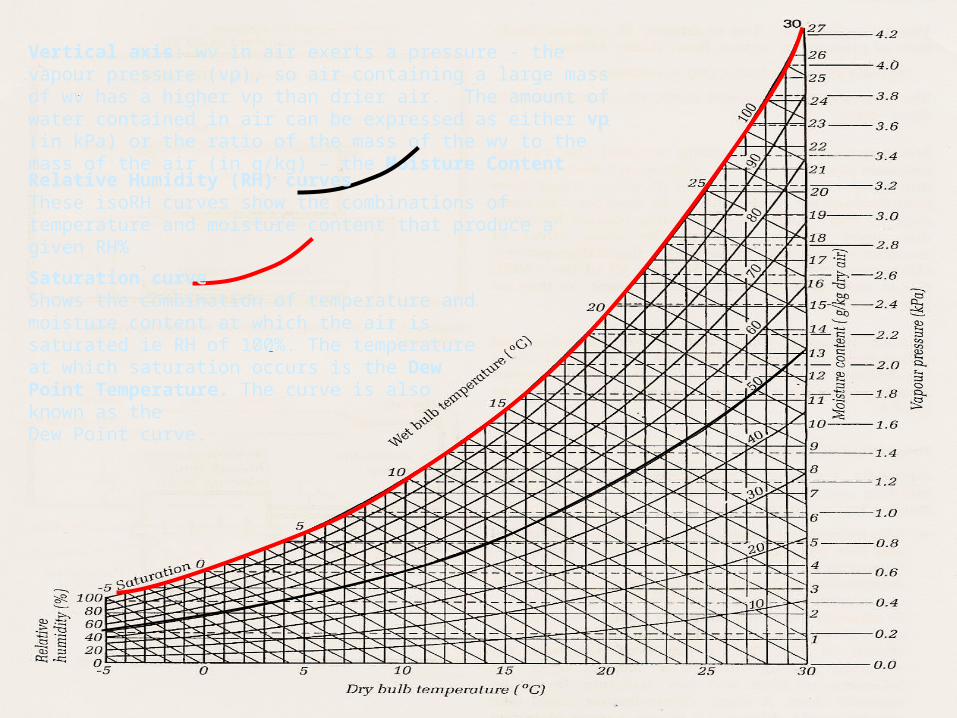
Vertical axis: wv in air exerts a pressure - the vapour pressure (vp), so air containing a large mass of wv has a higher vp than drier air. The amount of water contained in air can be expressed as either vp (in kPa) or the ratio of the mass of the wv to the mass of the air (in g/kg) – the Moisture Content
Relative Humidity (RH) curvesThese isoRH curves show the combinations of temperature and moisture content that produce a given RH%
Saturation curveShows the combination of temperature and moisture content at which the air is saturated ie RH of 100%. The temperature at which saturation occurs is the Dew Point Temperature. The curve is also known as theDew Point curve.
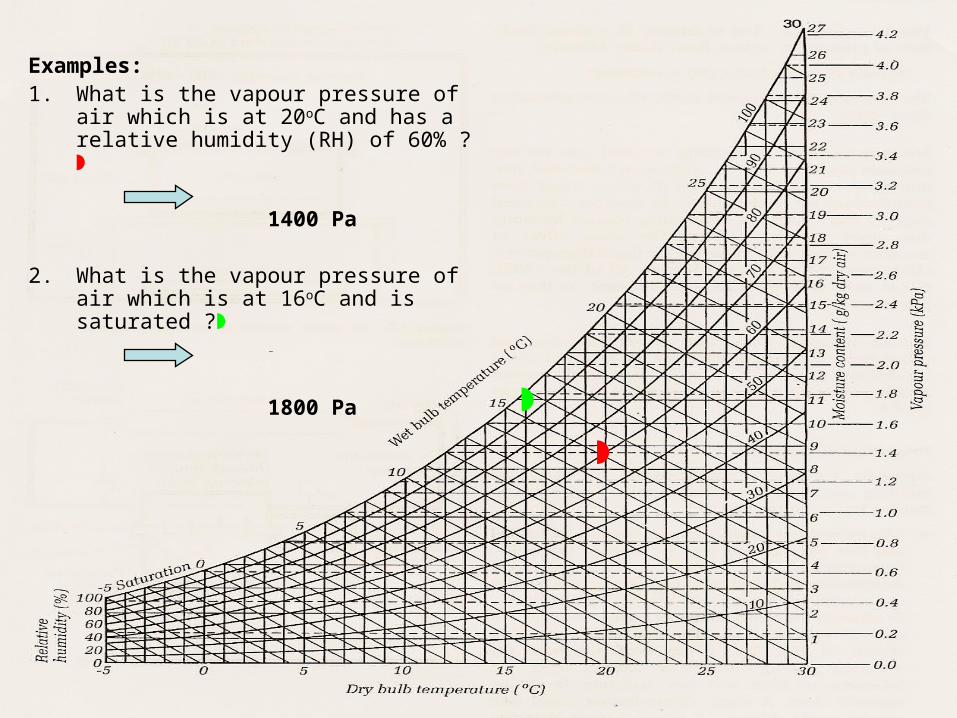
Examples:1. What is the vapour pressure of air which is
at 20oC and has a relative humidity (RH) of 60% ?
1400 Pa
2. What is the vapour pressure of air which is at 16oC and is saturated ?
1800 Pa
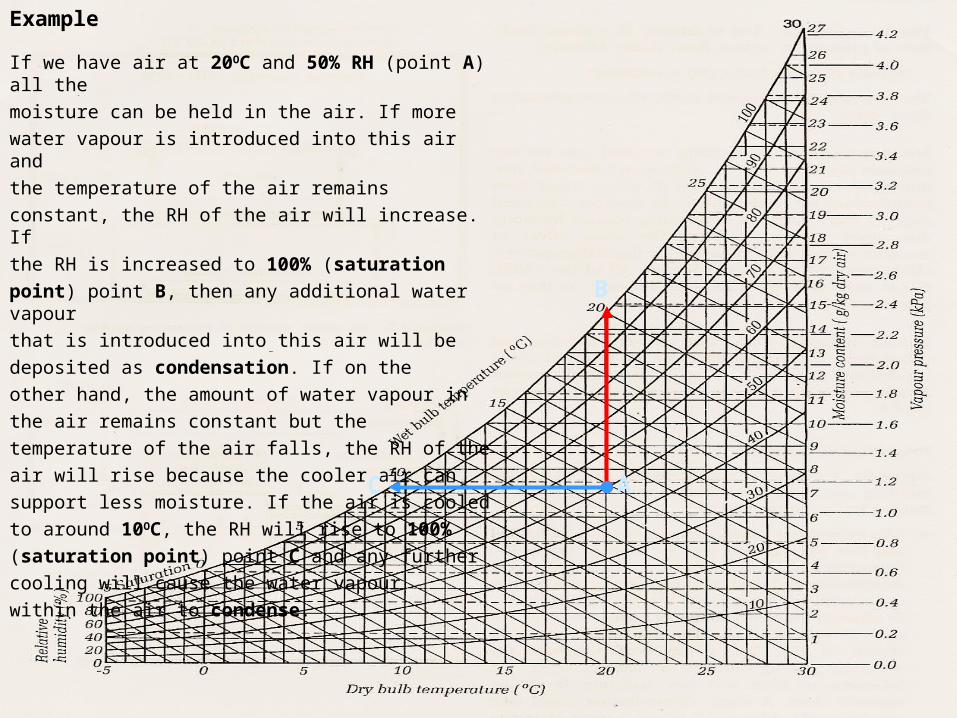
Example
If we have air at 20OC and 50% RH (point A) all the
moisture can be held in the air. If more
water vapour is introduced into this air and
the temperature of the air remains
constant, the RH of the air will increase. If
the RH is increased to 100% (saturation
point) point B, then any additional water vapour
that is introduced into this air will be
deposited as condensation. If on the
other hand, the amount of water vapour in
the air remains constant but the
temperature of the air falls, the RH of the
air will rise because the cooler air can
support less moisture. If the air is cooled
to around 10OC, the RH will rise to 100%
(saturation point) point C and any further
cooling will cause the water vapour
within the air to condense.
A
B
C
Condensation in buildingsCondensation in buildings
There are two types of condensation:
Surface - occurs on surfaces of the building envelope which are at or below the dew point of the air immediately adjacent to them
Interstitial - occurs within or between the layers of the building envelope when the temperature of some part of the structure within the building envelope equals or drops below the dew point temperature.
Surface condensation may occur: On the internal surface of external elements of a building. On cold pipes and cisterns within a building.
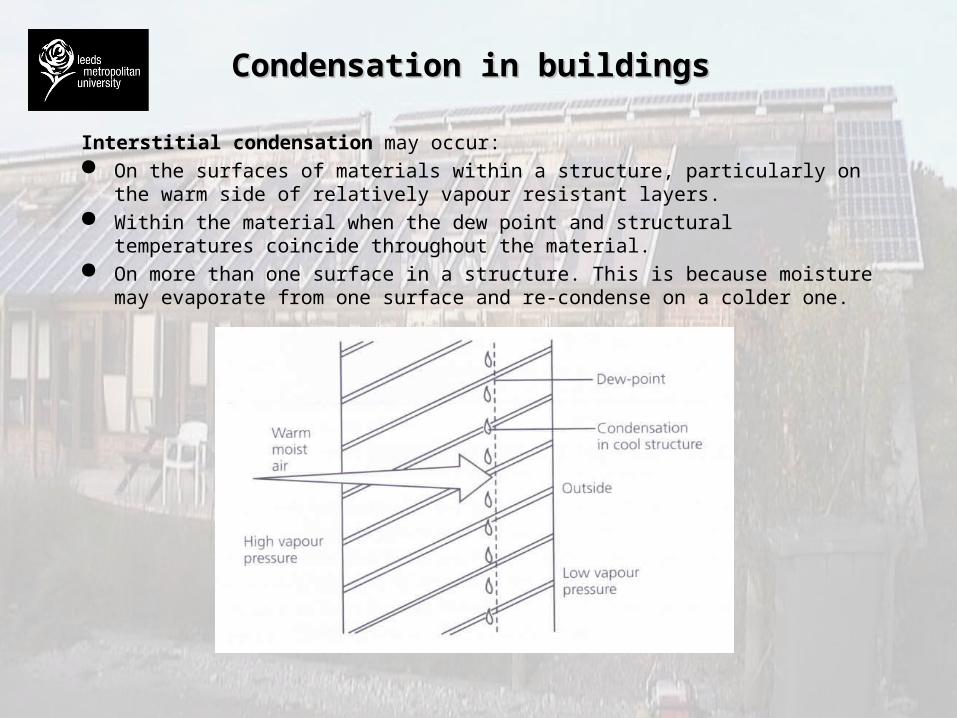
Condensation in buildingsCondensation in buildings
Interstitial condensation may occur: On the surfaces of materials within a structure, particularly on the warm side of
relatively vapour resistant layers. Within the material when the dew point and structural temperatures coincide
throughout the material. On more than one surface in a structure. This is because moisture may
evaporate from one surface and re-condense on a colder one.
Interstitial condensation [Source: McMullan, 2007]
Condensation in buildingsCondensation in buildings
The dampness caused by condensation can result in the following problems: Lead to mould growth Damage decorations and fittings Make insulating materials less effective Damage important structural materials, i.e. steelwork and timber In severe conditions it may even lead to structural failure
In addition, condensation can cause: Dimensional changes Reduction of thermal resistance Migration of salts and the liberation of chemicals Electrical failure
Structural temperature gradientStructural temperature gradient
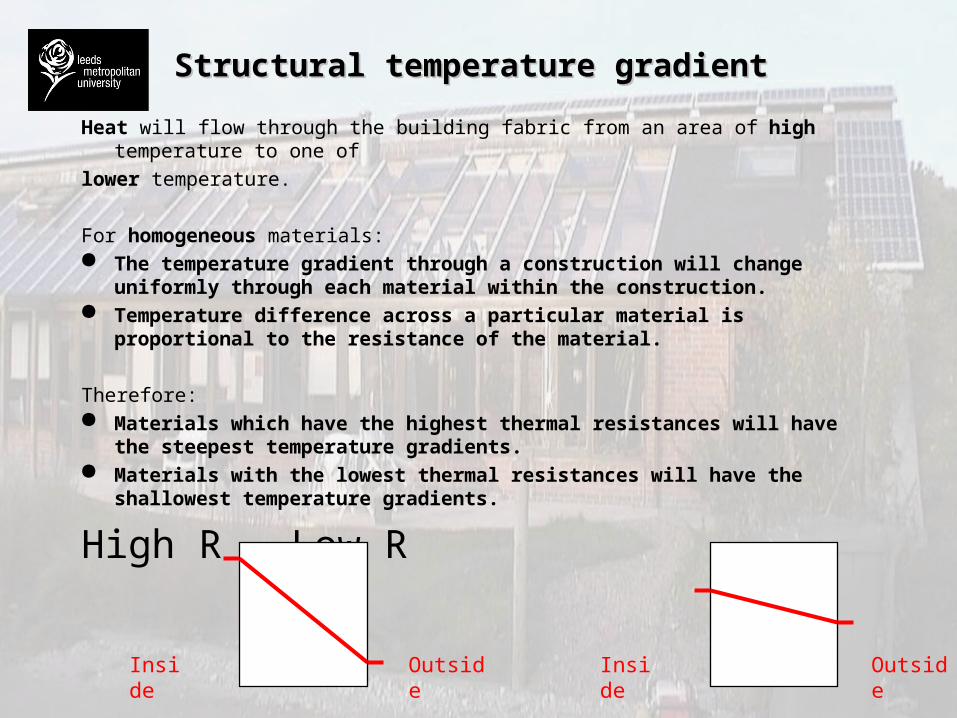
Heat will flow through the building fabric from an area of high temperature to one of
lower temperature.
For homogeneous materials: The temperature gradient through a construction will change uniformly
through each material within the construction. Temperature difference across a particular material is proportional to the
resistance of the material.
Therefore: Materials which have the highest thermal resistances will have the
steepest temperature gradients. Materials with the lowest thermal resistances will have the shallowest
temperature gradients.
High R Low R
Inside InsideOutside Outside
Structural temperature gradientStructural temperature gradient
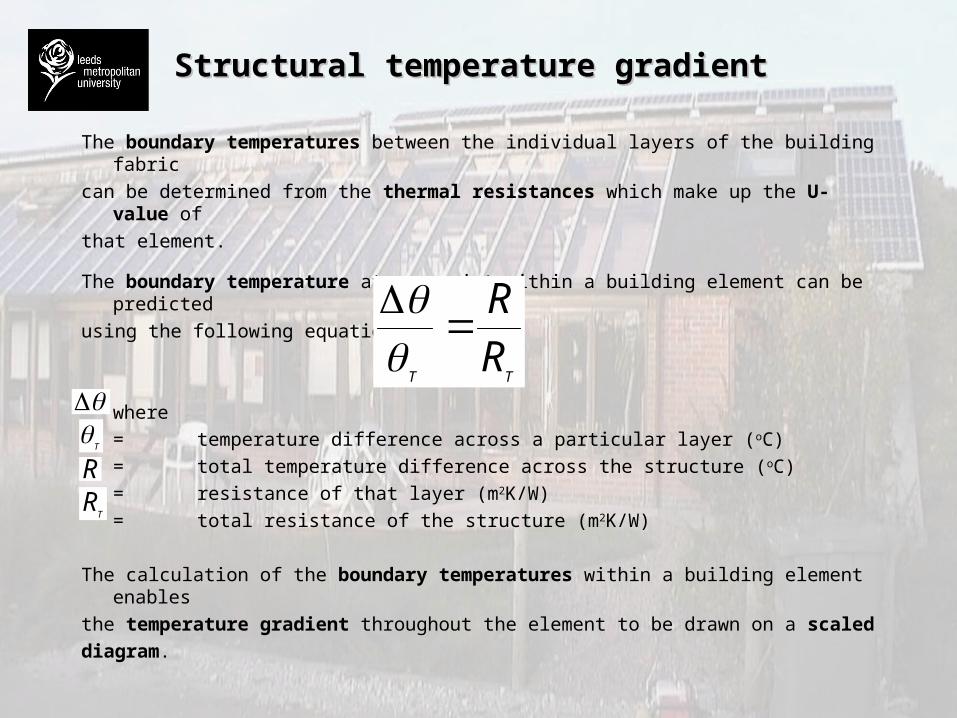
The boundary temperatures between the individual layers of the building fabric
can be determined from the thermal resistances which make up the U-value of
that element.
The boundary temperature at any point within a building element can be predicted
using the following equation:
where
= temperature difference across a particular layer (oC)
= total temperature difference across the structure (oC)
= resistance of that layer (m2K/W)
= total resistance of the structure (m2K/W)
The calculation of the boundary temperatures within a building element enables
the temperature gradient throughout the element to be drawn on a scaled
diagram.
TTR
R
T
R
TR
Structural temperature gradient: exampleStructural temperature gradient: example
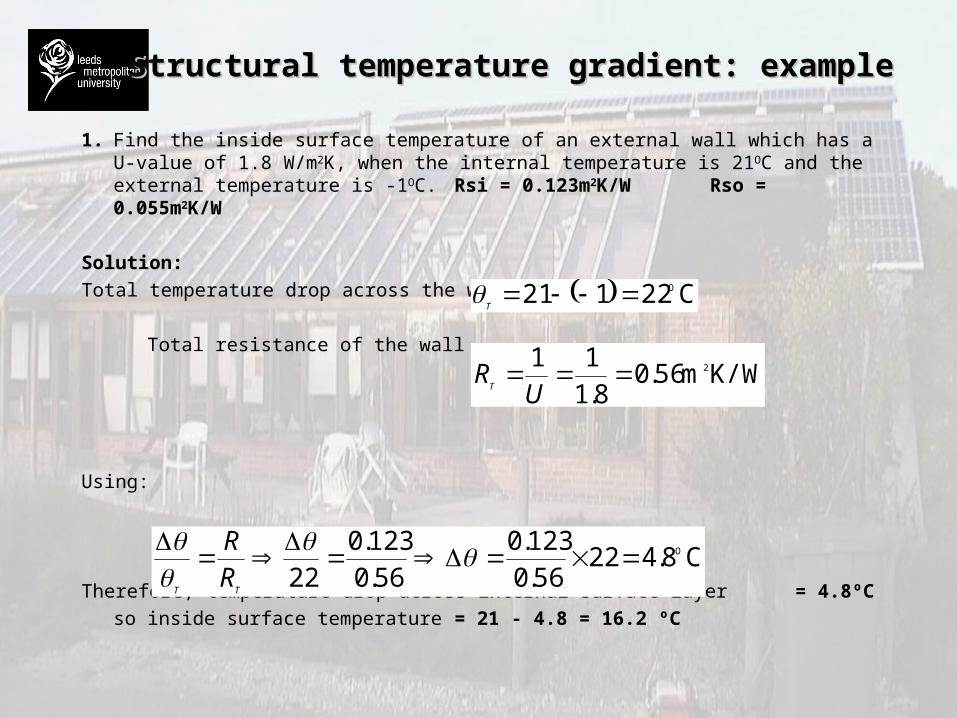
1. Find the inside surface temperature of an external wall which has a U-value of 1.8 W/m2K, when the internal temperature is 21OC and the external temperature is -1OC. Rsi = 0.123m2K/W Rso = 0.055m2K/W
Solution:
Total temperature drop across the wall
Total resistance of the wall
Using:
Therefore, temperature drop across internal surface layer = 4.8ºC
so inside surface temperature = = 21 - 4.8 = 16.2 ºC
C22121 OT
K/Wm56.08.1
11 2U
RT
C8.42256.0123.0
56.0123.0
22O
TTRR
Dew point temperature gradientDew point temperature gradient
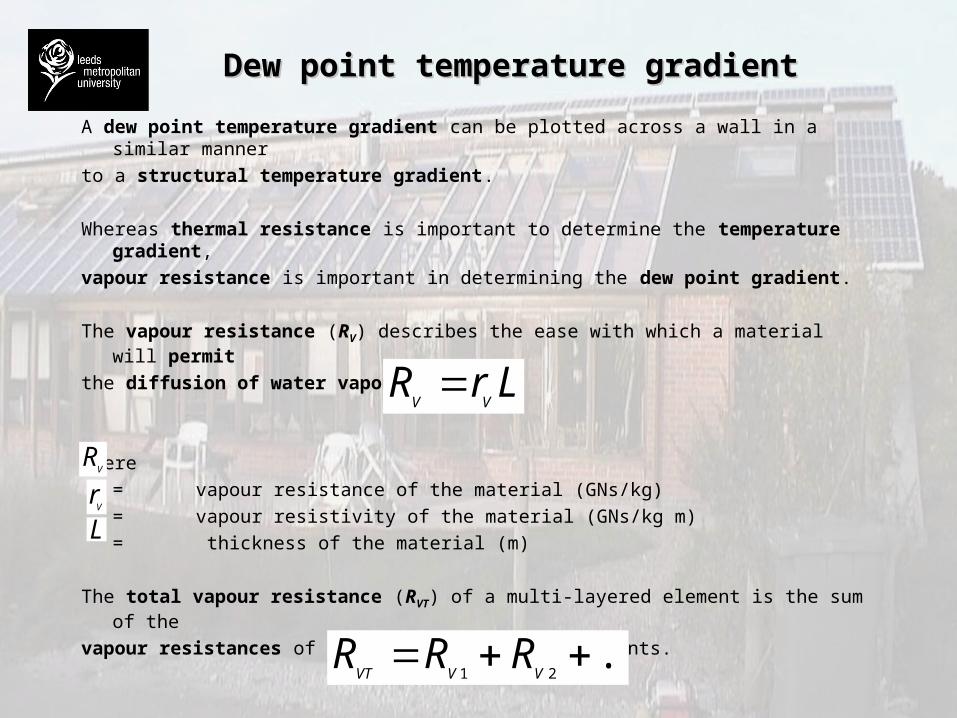
A dew point temperature gradient can be plotted across a wall in a similar manner
to a structural temperature gradient.
Whereas thermal resistance is important to determine the temperature gradient,
vapour resistance is important in determining the dew point gradient.
The vapour resistance (RV) describes the ease with which a material will permit
the diffusion of water vapour.
where
= vapour resistance of the material (GNs/kg)
= vapour resistivity of the material (GNs/kg m)
= thickness of the material (m)
The total vapour resistance (RVT) of a multi-layered element is the sum of the
vapour resistances of all of the separate components.
LrRVV
VR
VrL
...21
VVVTRRR
Vapour resistivityVapour resistivity
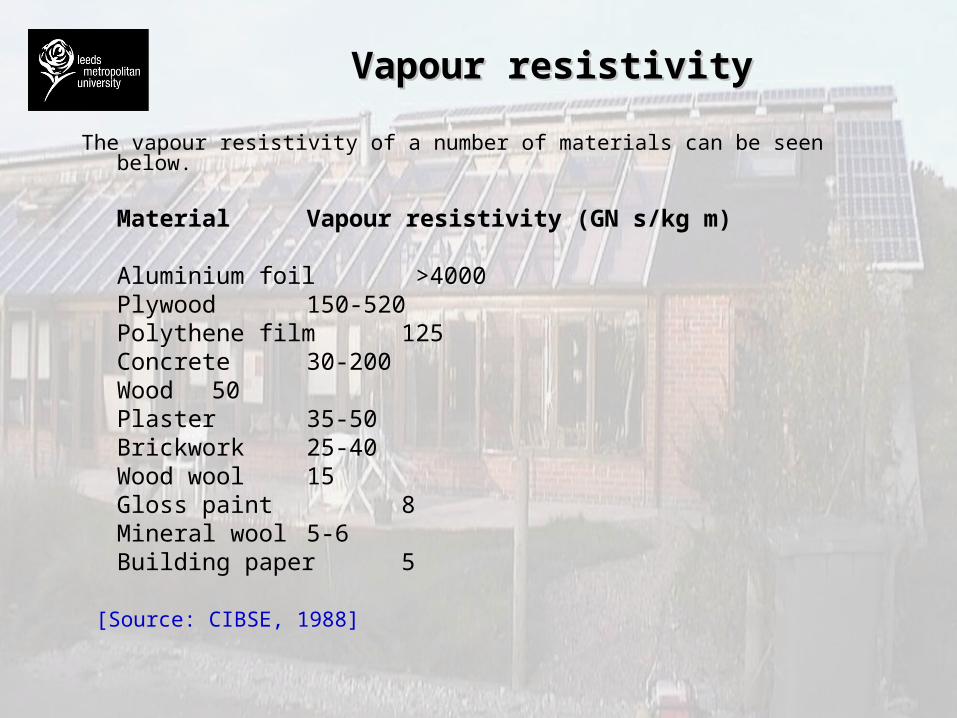
The vapour resistivity of a number of materials can be seen below.
Material Vapour resistivity (GN s/kg m)
Aluminium foil >4000Plywood 150-520Polythene film 125Concrete 30-200Wood 50Plaster 35-50Brickwork 25-40Wood wool 15Gloss paint 8Mineral wool 5-6Building paper 5
[Source: CIBSE, 1988]
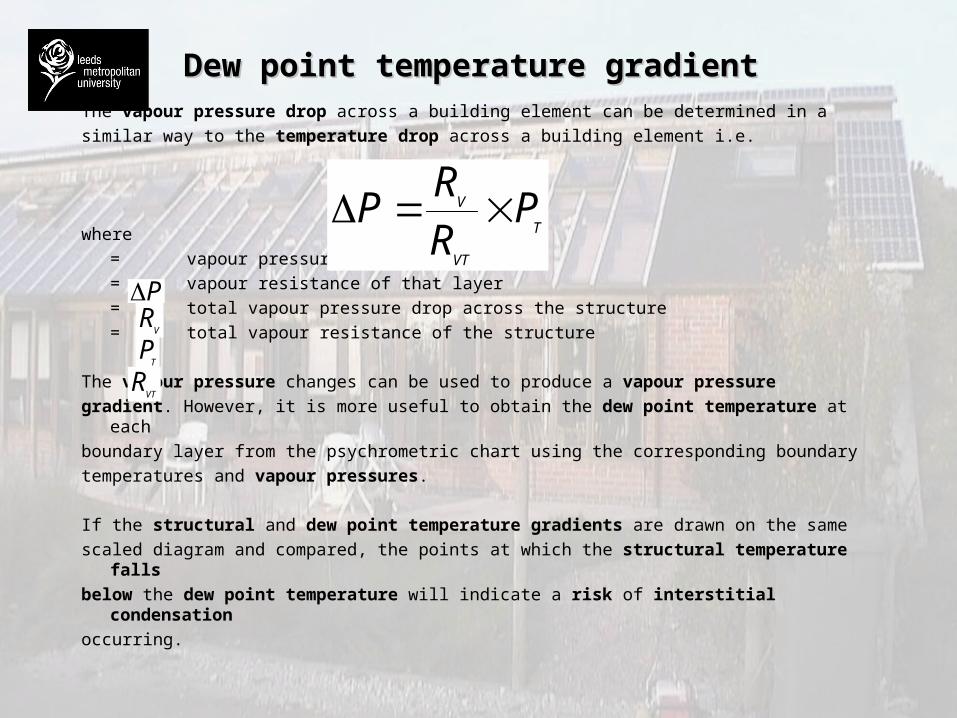
Dew point temperature gradientDew point temperature gradientThe vapour pressure drop across a building element can be determined in a
similar way to the temperature drop across a building element i.e.
where
= vapour pressure drop across a layer
= vapour resistance of that layer
= total vapour pressure drop across the structure
= total vapour resistance of the structure
The vapour pressure changes can be used to produce a vapour pressure
gradient. However, it is more useful to obtain the dew point temperature at each
boundary layer from the psychrometric chart using the corresponding boundary
temperatures and vapour pressures.
If the structural and dew point temperature gradients are drawn on the same
scaled diagram and compared, the points at which the structural temperature falls
below the dew point temperature will indicate a risk of interstitial condensation
occurring.
T
VT
V PR
RP
VR
VTR
P
TP
Interstitial condensation risk analysisInterstitial condensation risk analysis
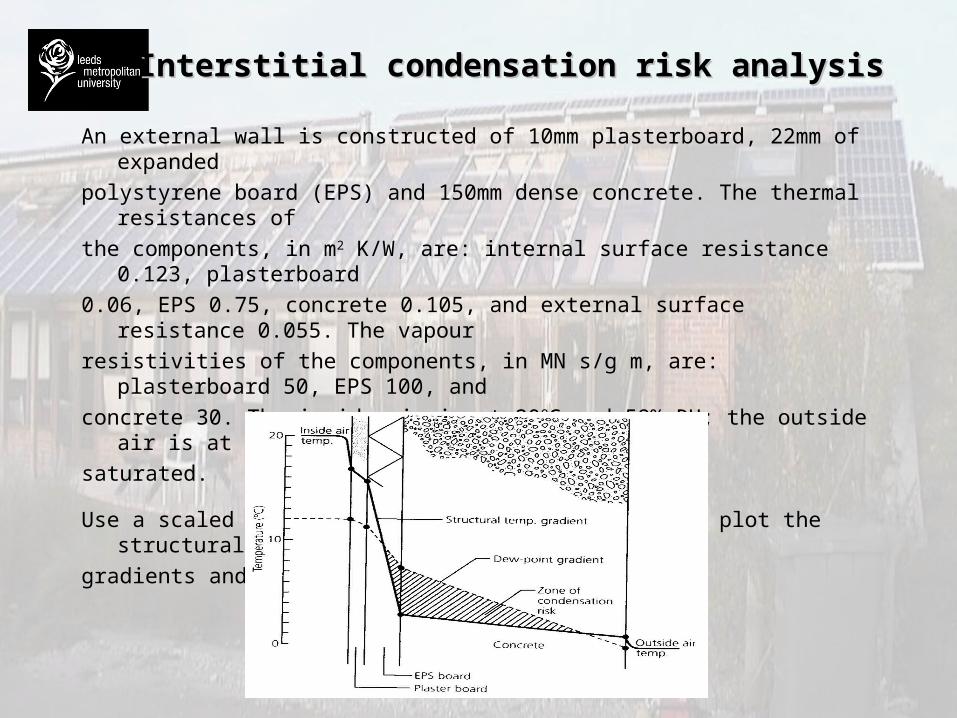
An external wall is constructed of 10mm plasterboard, 22mm of expanded
polystyrene board (EPS) and 150mm dense concrete. The thermal resistances of
the components, in m2 K/W, are: internal surface resistance 0.123, plasterboard
0.06, EPS 0.75, concrete 0.105, and external surface resistance 0.055. The vapour
resistivities of the components, in MN s/g m, are: plasterboard 50, EPS 100, and
concrete 30. The inside air is at 20OC and 59% RH; the outside air is at 0OC and
saturated.
Use a scaled cross section diagram of the wall to plot the structural temperature
gradients and the dew point gradients, like this:
Interstitial condensation risk analysisInterstitial condensation risk analysis
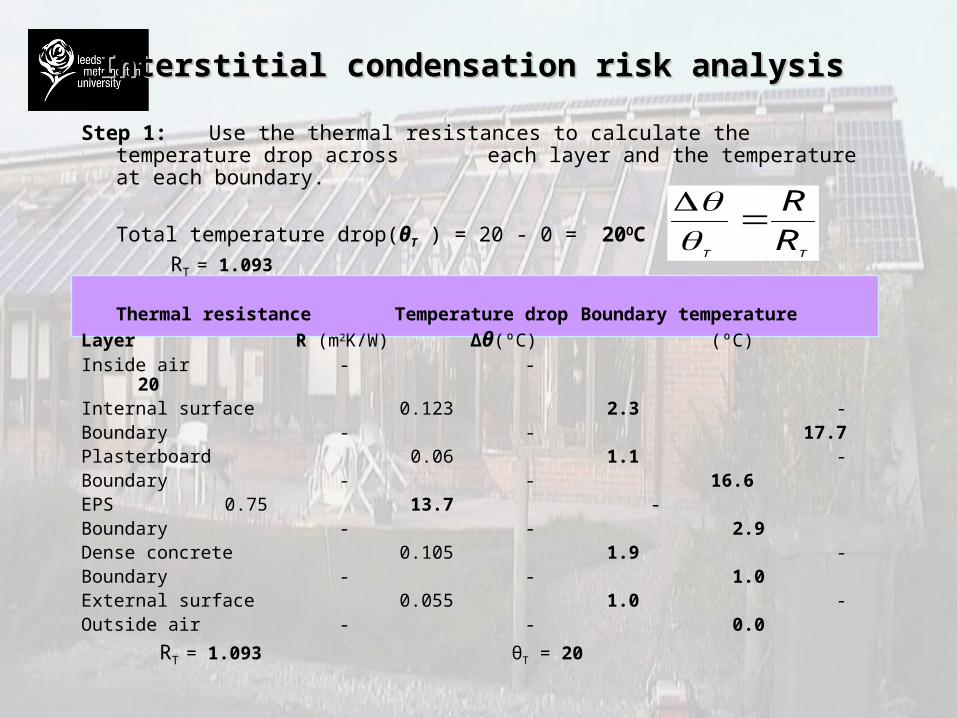
Step 1: Use the thermal resistances to calculate the temperature drop across each layer and the temperature at each boundary.
Total temperature drop(θT ) = 20 - 0 = 20OC
RT = 1.093
Thermal resistance Temperature drop Boundary temperature
Layer R (m2K/W) Δθ(ºC) (ºC)Inside air - - 20Internal surface 0.123 2.3 -Boundary - - 17.7Plasterboard 0.06 1.1 -Boundary - - 16.6EPS 0.75 13.7 -Boundary - - 2.9Dense concrete 0.105 1.9 -Boundary - - 1.0External surface 0.055 1.0 -Outside air - - 0.0
RT = 1.093 θT = 20
TTR
R
Interstitial condensation risk analysisInterstitial condensation risk analysis
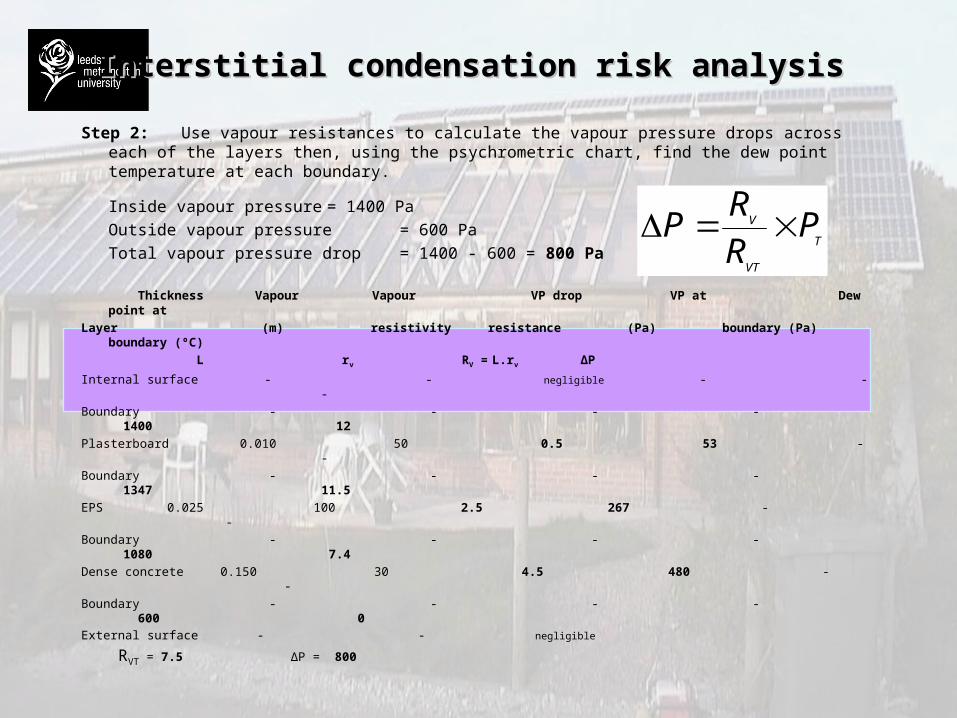
Step 2: Use vapour resistances to calculate the vapour pressure drops across each of the layers then, using the psychrometric chart, find
the dew point temperature at each boundary.
Inside vapour pressure = 1400 Pa
Outside vapour pressure = 600 Pa
Total vapour pressure drop = 1400 - 600 = 800 Pa
Thickness Vapour Vapour VP drop VP at Dew point at
Layer (m) resistivity resistance (Pa) boundary (Pa) boundary (ºC)
L rv RV = L.rv ΔP
Internal surface - - negligible - - -
Boundary - - - - 1400 12
Plasterboard 0.010 50 0.5 53 - -
Boundary - - - - 1347 11.5
EPS 0.025 100 2.5 267 - -
Boundary - - - - 1080 7.4
Dense concrete 0.150 30 4.5 480 - -
Boundary - - - - 600 0
External surface - - negligible
RVT = 7.5 ΔP = 800
T
VT
V PR
RP
Interstitial condensation risk analysisInterstitial condensation risk analysis
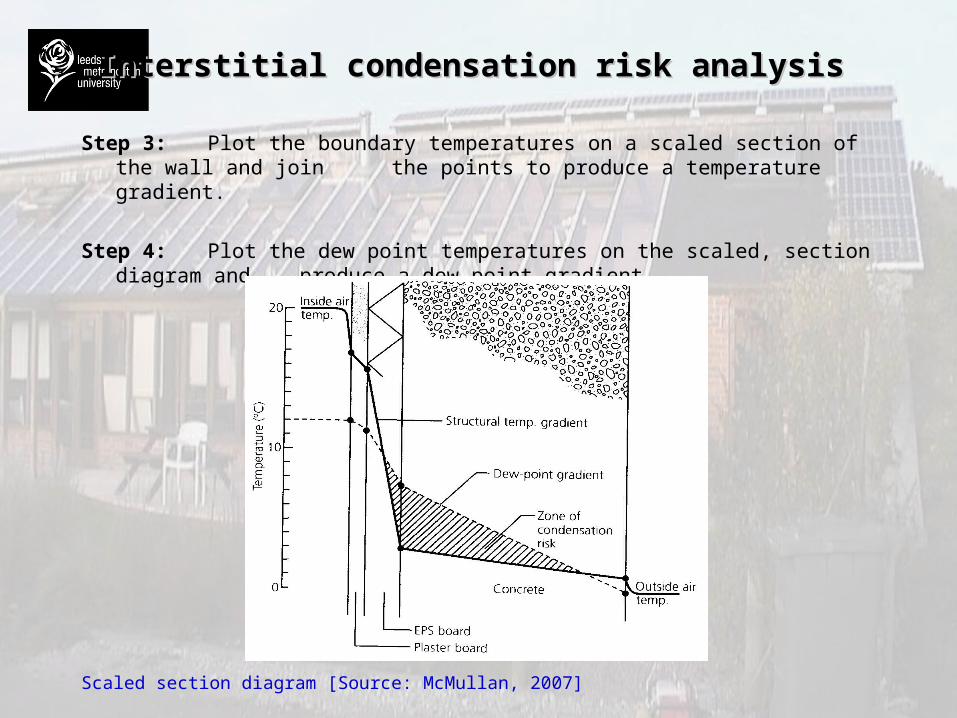
Step 3: Plot the boundary temperatures on a scaled section of the wall and join the points to produce a temperature gradient.
Step 4: Plot the dew point temperatures on the scaled, section diagram and produce a dew point gradient.
Scaled section diagram [Source: McMullan, 2007]
Minimising condensation risk: Vapour barriersMinimising condensation risk: Vapour barriers
In walls constructed from permeable materials, water vapour can pass through the
structure, and evaporate from the outside surface.
However, if a wall has an impermeable outer face, evaporation will be prevented,
and the material may become saturated. This may lead to deterioration of the
building fabric and structure and mould growth.
The risk of interstitial condensation in building elements can be reduced if water
vapour is prevented from permeating through the construction.
Although no material is a perfect barrier to the transfer of water vapour some
materials do offer an acceptably high resistance. Such materials when used in this
way are called vapour barriers or a vapour check e.g., aluminium foil and
polythene sheeting - all of which have high vapour resistances.
Vapour barriers should be fitted to the warm side of the structure to minimise
vapour penetration.
Minimising condensation risk: DesignMinimising condensation risk: Design
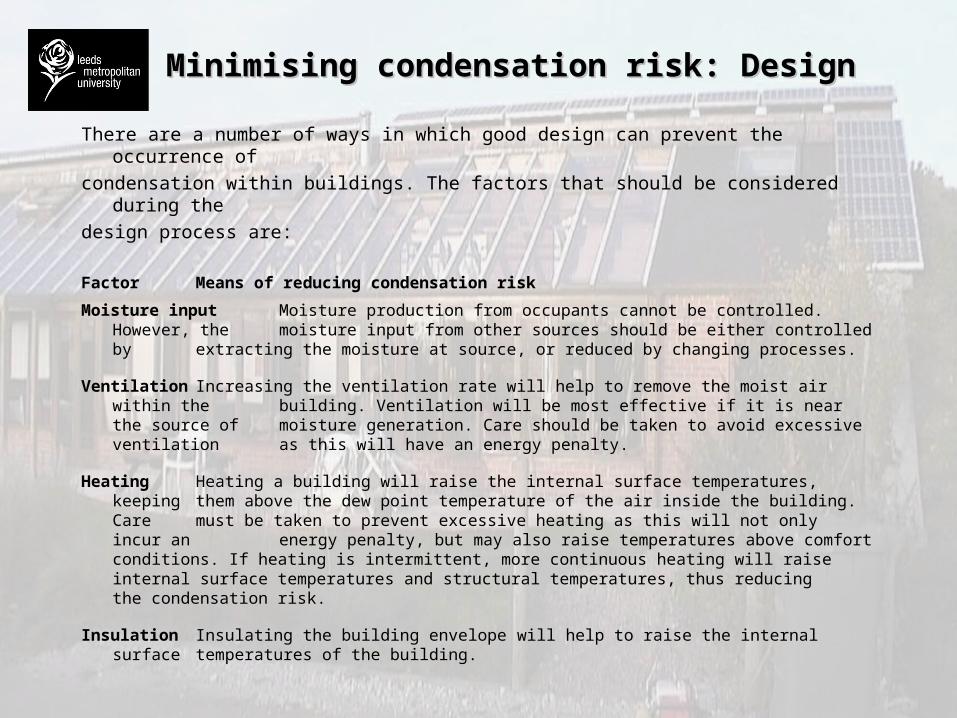
There are a number of ways in which good design can prevent the occurrence of
condensation within buildings. The factors that should be considered during the
design process are:
Factor Means of reducing condensation risk Moisture input Moisture production from occupants cannot be controlled. However, the
moisture input from other sources should be either controlled by extracting the moisture at source, or reduced by changing processes.
Ventilation Increasing the ventilation rate will help to remove the moist air within the building. Ventilation will be most effective if it is near the source of moisture generation. Care should be taken to avoid excessive ventilation as this will have an energy penalty.
Heating Heating a building will raise the internal surface temperatures, keeping them above the dew point temperature of the air inside the building. Care must be taken to prevent excessive heating as this will not only incur an energy penalty, but may also raise temperatures above comfort conditions. If heating is intermittent, more continuous heating will raise internal surface temperatures and structural temperatures, thus reducing the condensation risk.
Insulation Insulating the building envelope will help to raise the internal surface temperatures of the building.
ReferencesReferences
BSI (2005) BS 5250: Code of Practice for Control of Condensation in Dwellings. London: British Standards Institution.
BURBERRY, P. (1997) Environmental Services 8th Edition. Mitchell’s Building Construction Series
CIBSE (1999) Volume A Design Data, 5th Edition. London: Chartered Institution of Building Services Engineers
CIBSE (2004) Guide to Energy Efficiency, London: Chartered Institution of Building Services Engineers
CIBSE (2006) Energy Assessment and Reporting Methodology, London: Chartered Institution of Building Services Engineers
CIBSE (2007) , Environmental Design Guide A, London: Chartered Institution of Building Services Engineers
CIBSE (2007 a) Sustainability Guide, London: Chartered Institution of Building Services Engineers
DEFRA (2005) The Government’s Standard Assessment Procedure for Energy Rating of Dwellings 2005 Edition, Watford: BRE
JOHNSTON, D. (2009) GHA monitoring programme – Phase 1. Report Number 1 – Draft Co-heating Testing Proposal Leeds: Leeds Metropolitan University
McMULLAN, R. (2007) Environmental Science in Buildings. 6th Edition, London: MacMillan
RIBA (2007) Low Carbon Standards and Assessment Methods London: Royal Institute of British Architects
UK Green Building Council (2007) Report on Carbon Reductions in Non-Domestic Buildings London: DCLG
WINGFIELD, J. BELL, M. MILES-SHENTON, D. LOWE, B. and SOUTH, T. (2007) Interim Report Number 7 – Co-heating tests and Investigation of party Wall Thermal Bypass. Partners in Innovation Project: CI 39/3/663. Leeds: Leeds Metropolitan University.