environmental water delivery: koondrook … water delivery: koondrook-perricoota forest increased...
TRANSCRIPT
EnvironmEntal WatEr DElivErY Koondrook-Perricoota Forest
SEPtEmBEr 2011 v1.0

Hale, J and SKM (2011). Environmental Water Delivery: Koondrook-Perricoota Forest. Prepared
for Commonwealth Environmental Water, Department of Sustainability, Environment, Water,
Population and Communities.
ISBN: 978-1-921733-27-7
SEWPaC acknowledges the following individuals and organisations that have been consulted in
the preparation of this document:
Murray-Darling Basin Authority
Digby Jacobs (NSW Office of Water)
Linda Broekman (Forests NSW)
Garry Smith (DG Consulting)
Daren Barma (Barma Water Resources)
Ben Gawne (Murray-Darling Freshwater Research Centre)
Published by the Commonwealth Environmental Water Holder for the Australian Government.
© Commonwealth of Australia 2011.
This work is copyright. Apart from any use as permitted under the Copyright Act 1968, no part
may be reproduced by any process without prior written permission from the Commonwealth.
Requests and enquiries concerning reproduction and rights should be addressed to Department
of Sustainability, Environment, Water, Population and Communities, Public Affairs, GPO Box 787
Canberra ACT 2601 or email [email protected]
Information presented in this document may be copied for personal use or published for
education purposes, provided that any extracts are fully acknowledged.
The views and opinions expressed in this publication are those of the authors and do not
necessarily reflect those of the Australian Government or the Minister for Sustainability,
Environment, Water, Population and Communities.
While reasonable efforts have been made to ensure that the contents of this publication
are factually correct, the Commonwealth does not accept responsibility for the accuracy
or completeness of the contents, and shall not be liable for any loss or damage that may be
occasioned directly or indirectly through the use of, or reliance on, the contents of this publication.
Image Credits
Black Box Trees © MDBA; Photographer David Kleinert
Red Gum Bark © MDBA; Photographer Keith Ward

i
EnvironmEntal WatEr DElivErY Koondrook-Perricoota Forest
SEPtEmBEr 2011 v1.0

Environmental Water Delivery: Koondrook-Perricoota ForestIncreased volumes of environmental water are now becoming available and this will allow us to pursue a larger and broader program of environmental watering. It is particularly important therefore that we seek regular input and suggestions from the community as to how we can achieve the best possible approach. As part of our consultation process we will be seeking information on:
• community views on environmental assets and the health of these assets
• views on the prioritisation of environmental water use
• potential partnership arrangements for the management of environmental water
• possible arrangements for the monitoring, evaluation and reporting (MER) of environmental water use.
This document has been prepared to provide information on the environmental assets and potential environmental water use in the Koondrook-Perricoota Forest.
The Koondrook-Perricoota Forest supports significant ecological values, in particular river red gum forest and woodlands. Potential water use options for the Koondrook-Perricoota Forest include: providing flows to support vegetation condition and extent; providing flows to inundate permanent and semi-permanent wetlands and a portion of the floodplain to enhance channel and wetland habitats; providing flows to support life cycle processes of water-dependent fauna such as waterbirds and fish; and providing flows to prevent build-up of organic matter on the floodplain.
A key aim in undertaking this work was to prepare scalable water use strategies that maximise the efficiency of water use and anticipate different climatic circumstances. Operational opportunities and constraints have been identified and delivery options prepared. This has been done in a manner that will assist the community and environmental water managers in considering the issues and developing multi-year water use plans.
The work has been undertaken by consultants on behalf of the Commonwealth Department of Sustainability, Environment, Water, Population and Communities. Previously prepared work has been drawn upon, and discussions have occurred with organisations such as the New South Wales Office of Environment and Heritage, New South Wales Office of Water, and the Murray-Darling Basin Authority.
Management of environmental water will be an adaptive process. There will always be areas of potential improvement. Comments and suggestions including on possible partnership arrangements are very welcome and can be provided directly to: [email protected] . Further information about Commonwealth environmental water can be found at www.environment.gov.au/ewater .
Commonwealth Environmental Water Department of Sustainability, Environment, Water, Population and Communities GPO Box 787, Canberra ACT 2601 Tel: +61 2 6275 9245

iii
2. OverviewContents
1. overview 2
1.1 Scope and purpose of the document 2
1.2 Catchment and river system overview 3
1.3 Overview of river operating environment 5
2. Ecological values, processes and objectives 6
2.1 Ecological values 6
2.2 Ecological objectives 8
3. Watering objectives 9
4. Environmental water requirements 14
4.1 Baseline flow characteristics 14
4.2 Environmental water demands 19
4.3 Summary of environmental water demands 20
5. operating regimes 22
5.1 Introduction 22
5.2 Identifying target environmental flow recommendations 22
5.3 Delivery triggers 23
5.4 Wetland regulators 25
5.5 Storage releases 27
5.6 Delivery of water for high flow events 27
5.7 Travel time 27
5.8 Flooding 28
5.9 Weir flow control 29
5.10 Interactions with other assets 29
5.11 Water delivery costs 29

iv Environmental Water Delivery Koondrook-Perricoota Forest
6. Governance 30
6.1 Delivery partners, roles and responsibilities 30
6.2 Approvals, licenses, legal and administrative issues 30
6.3 Trading rules and system accounting 31
6.4 Water use plans 35
7. risk assessment and mitigation strategies 36
8. Environmental Water reserves 38
8.1 Environmental water holdings and provisions 38
8.2 Seasonal allocations 42
8.3 Water availability forecasts 47
9. monitoring evaluation and improvement 50
9.1 Existing monitoring programs and frameworks 50
9.2 Operational water delivery monitoring 53
9.3 Key parameters for monitoring and evaluating ecosystem response 53
10. opportunities 55
11. Bibliography 56
appendix 1: Significant flora and fauna 58
appendix 2: operational monitoring report template 60
appendix 3: Baseline streamflows at key locations 61
appendix 4: risk assessment framework 68
v
FiguresFigure 1: Location of the Koondrook-Perricoota Forest. 4
Figure 2: Vegetation and wetland habitats in the Koondrook-Perricoota Forest. 7
Figure 3: Vegetation associations, geomorphic setting and flood regime. 9
Figure 4: Koondrook-Perricoota Forest flood area at 30,000 and 35,000 ML/d downstream of Torrumbarry Weir. 15
Figure 5: Historical Torrumbarry Weir Pool Level, 1987–2011. 17
Figure 6: Historical Torrumbarry Weir Pool Level, 1998–2011. 17
Figure 7: Natural flow paths through Koondrook-Perricoota Forest. 18
Figure 8: Location of Flow Regulators. 26
Figure 9: Murray River example event – Spring 2000. 28
Figure 10: Trading zone boundaries. 32
Figure 11: October seasonal allocations for the Murray system. 42
Figure 12: April seasonal allocations for the Murray system. 43
Figure 13: Example of inundation monitoring undertaken by Forests NSW in 2010. 50
Figure 14: Proposed Flow Monitoring. 52

vi Environmental Water Delivery Koondrook-Perricoota Forest
TablesTable 1: Ecological objectives for targeted water use. 8
Table 2: Water requirements for key ecological values in the Koondrook-Perricoota Forest. 10
Table 3: Proposed water use management objectives (all flows are quoted for the flow at the Koondrook-Perricoota Forest inlet regulator). 11
Table 4: Commence to flow for overbank flows into Koondrook-Perricoota Forest. 14
Table 5: Modelled streamflows (ML/d) for the Murray River downstream of Torrumbarry Weir (1895–2009). 16
Table 6: Average recurrence interval for each flow target. 19
Table 7: Range of additional volumes required to achieve the desired environmental flow in given climate years. 20
Table 8: Range of additional volume to achieve the desired environmental flow across all climate years. 21
Table 9: Change in recurrence intervals under proposed watering regime. 21
Table 10: Identifying seasonal target environmental flow recommendations. 23
Table 11: Summary of operational regime for achievement of proposed environmental objectives. 24
Table 12: Wetland regulator and effluent creek capacities. 25
Table 13: Risk associated with water delivery in the Koondrook-Perricoota Forest. 37
Table 14: Commonwealth environmental water holdings (as at October 2010). 40
Table 15: Environmental water currently held by other agencies in Murray River downstream of Barmah Choke. 41
Table 16: Likely allocation against Commonwealth environmental water holdings, under different climate scenarios. 44
Table 17: Likely volume available to the environment from Commonwealth environmental water holdings (as at October 2010). 45
Table 18: Flow monitoring in the Murray River near Koondrook-Perricoota Forest. 51
Table 19: Monitoring plan for environmental water use. 54
vii
List of AcronymsAEW Adaptive Environmental Water
AWD Available Water Determination
CEWH Commonwealth Environmental Water Holder
CMA Catchment Management Authority
COAG Council of Australian Governments
DO Dissolved Oxygen
DSE Victorian Department of Sustainability and Environment
EWAs Environmental Water Allowances
FNSW Forests New South Wales
MDB Murray-Darling Basin
MDBA Murray-Darling Basin Authority
MEP Monitoring Evaluation Plan
MIL Murray Irrigation Limited
MLDRIN Murray Lower Darling Rivers Indigenous Nations
MLD EWAG Murray Lower Darling Environmental Water Advisory Group
Murray CMA Murray Catchment Management Authority
MWWG Murray Wetlands Working Group
NSW New South Wales
NOW NSW Office of Water
OEH NSW Office of Environment and Heritage
RERP Rivers Environmental Restoration Program
SEWPaC Department of Sustainability, Environment, Water, Population and Communities
TLM The Living Murray

viii Environmental Water Delivery Koondrook-Perricoota Forest
1. Overview
Part 1:Management Aims
2 Environmental Water Delivery Koondrook-Perricoota Forest
1. Overview
1.1 Scope and purpose of the document
The purpose of this document is to propose scalable strategies for environmental water use based on the environmental requirements of selected assets. Processes and mechanisms will be outlined that will enable water use strategies to be implemented in the context of river operations and delivery arrangements, water trading and governance, constraints and opportunities. The document proposes large-scale water use options for the application of environmental water.
To maximise the system’s benefit, three scales of watering objectives have been expressed:
1. Water management area (individual wetland features/sites within an asset).
2. Asset objectives (related to different water resource scenarios).
3. Broader river system objectives across and between assets.
These objectives provide the basis for the proposed water use strategies and the premise for which the operational delivery document has been developed.
Assets and potential watering options have been identified for regions across the Basin. This work has been undertaken as three steps:
1. Existing information for selected environmental assets has been collated to establish asset profiles, which include information on hydrological requirements and the management arrangements necessary to deliver water to meet ecological objectives for individual assets.
2. Water use options have been developed for each asset to meet watering objectives under a range of volume scenarios. Use of environmental water will aim to maximise environmental outcomes at multiple assets, where possible. Water use options will provide an “event ready” basis for the allocation of environmental water. Options are expected to be integrated into a five-year water delivery program.
3
3. Processes and mechanisms required to operationalise environmental water delivery have been documented and include:
− delivery arrangements and operating procedures
− water delivery accounting methods (in consultation with operating authorities) that are either currently in operation at each asset or methodologies that could be applied for accurate accounting of inflow, return flows and water ‘consumption’
− decision triggers for selecting any combination of water use options
− approvals and legal mechanisms for delivery and indicative costs for implementation.
This document outlines options for the delivery of water to the Koondrook-Perricoota Forest for environmental outcomes. It should be noted, however, that the Koondrook-Perricoota Forest is within the larger water planning area of the Central Murray Floodplain (Yarrawonga to the Wakool junction). The actions and activities proposed within this document must be considered in conjunction with adjoining asset plans for the Barmah-Millewa Forest, Gunbower Forest and the Edward-Wakool system, as well as delivery plans for hydrologically connected assets such as the Lower Goulburn floodplain, Broken Creek and the Campaspe River.
1.2 Catchment and river system overview (general)
Koondrook-Perricoota is within the Murray-Darling Basin (MDB) on the floodplain of the Murray River downstream of the Torrumbarry Weir between Moama and Barham on the NSW side of the border. The MDB covers over one million square kilometres and comprises 14 per cent of the continent. Agriculture is the dominant economic activity in the MDB with pastoral and dryland farming (sheep, cattle and grain crops) the dominant land use. Approximately 75 per cent of the nation’s irrigation is within the MDB and it dominates the landscape in portions of the catchment.
Within the MDB, Koondrook-Perricoota is located in the Murray River catchment. The upper Murray River catchment straddles New South Wales and Victoria, extending along the length of the Murray River from its headwaters in the Great Dividing Range to its convergence with the Wakool River downstream of Swan Hill. The Murray River originates on the western slopes of the Great Dividing Range, south of Thredbo, and flows in a westerly direction. Major tributaries within the upper slopes include the Swampy Plain River, Corryong, Cudgewa, Limestone and Burrowye Creeks, as well as the Mitta Mitta River, which connects Dartmouth Dam to Hume Dam.
The upper Murray River from Hume Dam to the Wakool River junction is a braided stream with a complex network of major and minor anabranches, including the Edward-Wakool River system which offtakes between Yarrawonga and Barmah and converges with the main stem of the Murray River at the Wakool River junction downstream of Swan Hill. Downstream of Albury, below Hume Dam, the major tributaries of the Murray River include Billabong Creek, the Murrumbidgee River and the Darling River, which enter from the north, and the Kiewa, Ovens, Goulburn, Campaspe and Loddon Rivers and Broken Creek, which enter from the south (CSIRO 2008).
Koondrook-Perricoota Forest is part of the NSW Central Murray State Forests Ramsar site and is contiguous with Gunbower Forest, which is on the southern (Victorian) side of the Murray River. The Ramsar site also includes Werai Forest on the Edward River and Millewa Forest on the Murray River upstream (Figure 1). Koondrook-Perricoota Forest spans two local government areas (Murray Shire Council and Wakool Shire Council). The 34,500 hectare site is completely gazetted as State Forests comprising of Koondrook State Forest, Perricoota State Forest and Campbells Island State Forest, with the majority of the site (approximately 80 per cent) production forestry. However, there are areas within the State Forests that are zoned as special protection and harvesting exclusion areas which are managed for conservation and in which timber harvesting is not permitted (Harrington and Hale 2011).

4 Environmental Water Delivery Koondrook-Perricoota Forest
Fig
ure
1: L
oc
atio
n o
f the
Ko
ond
roo
k-Pe
rric
oo
ta F
ore
st (
SEW
PaC
201
1).
5
1.3 overview of river operating environment
The principle sources of water for the Koondrook-Perricoota Forest are:
• the Murray River upstream of Hume Dam where water is stored in Hume and Dartmouth Dams
• the Ovens River, which provides unregulated river inflows to the Murray River below Hume Dam
• Broken Creek, which provides irrigation drainage and some winter runoff
• the Goulburn River, where water is stored in Lake Eildon
• the Campaspe River, where water is stored in Lake Eppalock.
The major flow regulating structures on the Murray River system upstream of Koondrook-Perricoota Forest are Dartmouth Dam (3,856 GL), Hume Dam (3,005 GL), Yarrawonga Weir (118 GL), Lake Eildon (3,334 GL), Lake Eppalock (305 GL) and Torrumbarry Weir (37 GL).
Hume, Eildon and Eppalock Dams are managed primarily to capture inflows in winter and spring and release water as regulated flow to supply consumers. Irrigated agriculture is the largest consumer of water. Water for consumptive users is delivered via several main routes:
• Murray River flow below Hume Dam is diverted from Yarrawonga Weir to the north via Mulwala Canal (Murray Irrigation Limited) and to the south via Yarrawonga Main Channel (Murray Valley Irrigation Area). Hume Dam also supplies water down the Murray River, although deliveries are subject to the constraints of the Barmah Choke.
• Murray River flow is also diverted at Torrumbarry Weir (via National Channel to the Torrumbarry Irrigation Area), which is located directly upstream of Koondrook-Perricoota Forest.
• Goulburn River flow below Lake Eildon is diverted to the Waranga Basin and via the East Goulburn Main Channel at Goulburn Weir to the Shepparton and Greater Goulburn Irrigation Areas.
• Campaspe River flow into Lake Eppalock is diverted directly to Bendigo or released downstream for diversion by irrigators along the Campaspe River.
Koondrook-Perricoota Forest receives water from Murray River overbank flows downstream of Torrumbarry Weir. Works planned as a part of The Living Murray works plan will allow water to be diverted into Koondrook-Perricoota Forest from the Torrumbarry weir pool via new infrastructure (Torrumbarry Cutting) under regulated flow conditions.
The Koondrook-Perricoota Forest also includes Campbells Island State Forest which is located just downstream of the Koondrook-Perricoota Forest. Campbells Island State Forest receives water from the Murray River just downstream of Barham township via Little Murray River (which also supplies Merran Creek via the Merran Cutting).

6 Environmental Water Delivery Koondrook-Perricoota Forest
2. Ecological values, processes and objectives
2.1 Ecological values
Koondrook-Perricoota Forest, together with Gunbower Forest on the southern bank of the Murray River, form the second largest river red gum (Eucalyptus camaldulensis) forest in south-eastern Australia (the largest being Barmah-Millewa). The site is listed as a wetland of international importance under the Ramsar convention and is one of three groups of forests that make up the NSW Central Murray State Forests Ramsar site. The NSW Central Murray State Forests site meets the following Ramsar criteria:
• 1 – representative and / or rare wetland types
• 2 – presence of threatened species
• 4 – supporting critical life-stages
• 5 – regularly supports > 20,000 waterbirds
• 8 – importance for native fish.
However, the majority of these are due mostly to the values of the Millewa Forest (which also form part of the Ramsar site) rather than Koondrook-Perricoota. Koondrook-Perricoota contributes to criteria:
• 1 – due to the river red gum forests and woodlands
• 2 – presence of the nationally threatened species swamp wallaby grass, Murray cod, and potentially supporting the Australasian bittern although the latter has been recorded infrequently.
It may also contribute to criterion 8 although the importance of Koondrook-Perricoota Forest for native fish has not been fully resolved (Harrington and Hale 2011).
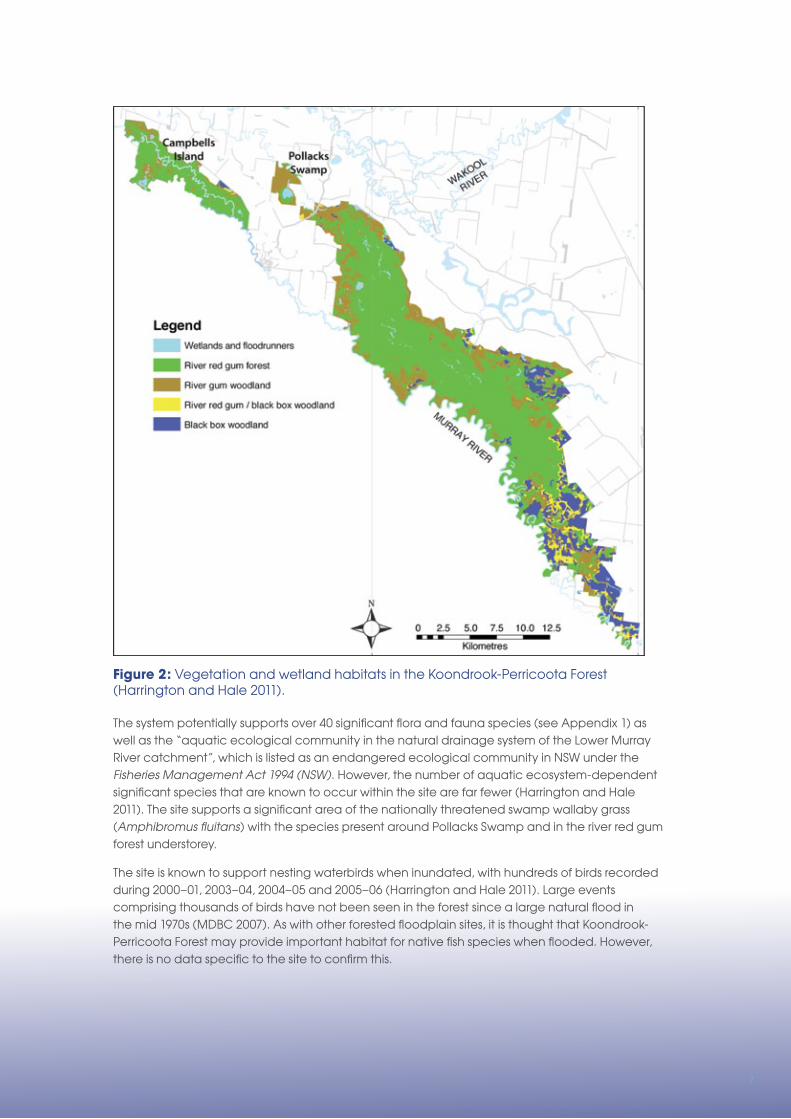
The majority of the Koondrook-Perricoota Forest (82 per cent) is river red gum forest and woodland with smaller areas of black box (Eucalyptus largiflorens) woodland, grey box (Eucalyptus microcarpa) and terrestrial vegetation communities, the latter of which are predominately in the southern part of the site (Figure 2). Wetlands cover a relatively small proportion of the site (less than 5 per cent), which includes Pollacks Swamp (disconnected from the major area of the forest) and a number of intermittent flood runners (Figure 2).
7
Figure 2: Vegetation and wetland habitats in the Koondrook-Perricoota Forest (Harrington and Hale 2011).
The system potentially supports over 40 significant flora and fauna species (see Appendix 1) as well as the “aquatic ecological community in the natural drainage system of the Lower Murray River catchment”, which is listed as an endangered ecological community in NSW under the Fisheries Management Act 1994 (NSW). However, the number of aquatic ecosystem-dependent significant species that are known to occur within the site are far fewer (Harrington and Hale 2011). The site supports a significant area of the nationally threatened swamp wallaby grass (Amphibromus fluitans) with the species present around Pollacks Swamp and in the river red gum forest understorey.
The site is known to support nesting waterbirds when inundated, with hundreds of birds recorded during 2000–01, 2003–04, 2004–05 and 2005–06 (Harrington and Hale 2011). Large events comprising thousands of birds have not been seen in the forest since a large natural flood in the mid 1970s (MDBC 2007). As with other forested floodplain sites, it is thought that Koondrook-Perricoota Forest may provide important habitat for native fish species when flooded. However, there is no data specific to the site to confirm this.

8 Environmental Water Delivery Koondrook-Perricoota Forest
The environmental values of Koondrook-Perricoota Forest have been (and continue to be) impacted by altered hydrological regimes. There has been a reduction in the frequency and duration of spring inundation within the site, which has led to a wide range of impacts to ecological values. This has been exacerbated by the prolonged drought between 2000 and 2010, with no wide scale inundation of the forest during this period, and in some areas of the forest even longer.
The temporal loss of inundated floodplain forest habitat has resulted in a decline in waterbird breeding and impacted native fish. There is evidence of a decline in tree health with only 5 per cent of the forest considered in ‘good’ condition in 2009 (Cunningham et al. 2009). In addition, the extended period of dry conditions led to an excessive build up of organic matter on the floodplain that upon re-wetting in spring 2010 resulted in blackwater events in receiving water bodies such as the Thule Creek, Barbers Creek and Wakool River (MDBC 2010).
2.2 Ecological objectives
Proposed ecological objectives for the Koondrook-Perricoota Forest have been developed to maintain (or improve) the condition of the key environmental attributes. These are provided in Table 1.
Table 1: Ecological objectives for targeted water use.
Broad objective location Ecological targets
To maintain and enhance channel and wetland habitats.
Intermittent flood runners, permanent wetlands (e.g. Swan Lagoon) intermittent wetlands (e.g. Pollack Swamp).
Provide connectivity between aquatic habitats for fish passage.
Promote productivity to maintain food webs and ecosystem function for in-channel flora and fauna.
Provide habitat for aquatic fauna (fish, turtles, frogs, invertebrates).
Maintain extent and enhance condition of aquatic vegetation.
To restore floodplains. River red gum forests and woodlands (28,500 ha).
Maintain extent and improve condition of river red gum forests and woodlands.
Promote successful breeding of waterbirds.
Provide fish passage and allow biota to complete flow-driven critical life cycle processes such as spawning, seed setting and dormant stages.
Maintain extent of swamp wallaby grass.
Prevent excessive build-up of organic matter on the floodplain surface to minimise impacts to receiving waters from low oxygen blackwater events.
Black box woodland (5,000 ha).
Maintain the health of black box woodlands.
Promote productivity to maintain food webs and ecosystem function for in-channel flora and fauna.
Maintain connectivity between main channel and floodplain.
Provide fish passage and allow biota to complete flow driven critical life cycle processes such as spawning, seed setting and dormant stages.

9
3. Watering objectives
Proposed watering objectives have been developed to provide a water regime sufficient to maintain the ecological values of the site and to meet the ecological objectives provided in Table 1. Wetland habitats and vegetation communities within the site are distributed according to geomorphology, which affects the frequency and duration of inundation (Figure 3). This illustrates the gradient from the most frequently flooded wetlands that occur at the lowest elevations through the majority of the site, which is river red gum forest at mid elevations, through to river red gum woodland and finally box woodlands at the highest elevations on the floodplain.
Figure 3: Vegetation associations, geomorphic setting and flood regime (MDBA in prep.).
Inundation of the floodplain produces a boom in productivity and is an important cue to initiate reproductive life cycle stages in wetland-dependent flora and fauna. Floodwaters must be of sufficient duration for species to complete life cycle stages such as nest building, egg laying and fledging of young in waterbirds, or flowering and seed set in aquatic flora. Temperature cues may also be important and as such the timing of inundation is also critical. Equally, appropriate floodwater recession is critical to avoid floodplain stranding of fish.

10 Environmental Water Delivery Koondrook-Perricoota Forest
The water requirements upon which the watering objectives for the Koondrook-Perricoota Forest have been informed are summarised in Table 2.
Table 2: Water requirements for key ecological values in the Koondrook-Perricoota Forest (MDBA in prep.).
Ecological value inundation frequency
Duration of inundation
timing of inundation
maximum time between events
Permanent wetlands 80–100% of years 9–12 months Year round 1 year
Intermittent wetlands and floodrunners
60–90% of years 2–8 months Winter /spring 1 year
River red gum forest 30–90% of years 4 months (min.) Winter /spring 5 years
River red gum woodland 10–40% of years 1–4 months Winter /spring 7 years
Black box woodland 10–40% of years 1–4 months Spring/summer 7 years
Waterbird breeding Opportunistic 4–10 months Spring/summer 6 years
Native fish Opportunistic 4 months (min.) Winter /spring 4 years
The water use management objectives provided in Table 3 have been developed on the assumption that the Koondrook-Perricoota Flood Enhancement Works, scheduled for completion in 2011 (though likely to be delayed by some months into 2012 due to wet conditions), are in place. This has a major impact on the volumes of water and river flows required to inundate areas of the forest. Campbells Island is outside the footprint of the Koondrook-Perricoota Flood Enhancement Works and thresholds for inundation of this 2,800 hectare forest could not be located when preparing this delivery document; but it is expected that it will be considerably higher than that for the remainder of the site once the flood enhancement works are in place. As such, this area is not considered further in this document, but is recognised as an area for further work.

11
Tab
le 3
: Pro
po
sed
wa
ter u
se m
ana
ge
me
nt o
bje
ctiv
es
(all
flow
s a
re q
uote
d fo
r the
flo
w a
t the
Ko
ond
roo
k-Pe
rric
oo
ta F
ore
st in
let r
eg
ula
tor)
.
ma
na
ge
me
nt o
bje
ctiv
es
for s
pe
cifi
c w
ate
r ava
ilab
ility
sc
en
ario
s
Extr
em
e d
ry
Go
al:
avo
id d
am
ag
e to
ke
y
ec
olo
gic
al a
sse
ts
Dry
Go
al:
Ensu
re e
co
log
ica
l ca
pa
city
fo
r re
co
very
Me
dia
n
Go
al:
ma
inta
in e
co
log
ica
l he
alth
a
nd
resi
lien
ce
We
t
Go
al:
imp
rove
an
d e
xte
nd
he
alth
y
aq
ua
tic e
co
syst
em
s
Wa
ter
ava
ilab
ility
min
imu
m a
lloc
atio
n o
n re
co
rd30
th p
erc
en
tile
ye
ar
50th p
erc
en
tile
ye
ar
70th p
erc
en
tile
ye
ar
1,0
00
ML/
d fo
r 60
da
ys (
co
mm
en
cin
g
Jun
e t
o N
ove
mb
er)
to
inu
nd
ate
p
erm
an
en
t w
etla
nd
s a
nd
flo
od
run
ne
rs.
Ma
inta
in a
nd
en
ha
nc
e c
ha
nn
el a
nd
w
etla
nd
ha
bita
ts:
• P
rovi
de
co
nn
ec
tivit
y b
etw
ee
n
aq
ua
tic h
ab
itats
for fi
sh p
ass
ag
e.
• P
rom
ote
pro
du
ctiv
ity
to m
ain
tain
fo
od
we
bs
an
d e
co
syst
em
fu
nc
tion
fo
r in
-ch
an
ne
l flo
ra a
nd
fau
na
.
• P
rovi
de
ha
bita
t fo
r aq
ua
tic fa
un
a
(fish
, tu
rtle
s, f
rog
s, in
vert
eb
rate
s).
• M
ain
tain
ext
en
t a
nd
en
ha
nc
e
co
nd
itio
n o
f aq
ua
tic v
eg
eta
tion
.
1,50
0 M
L/d
for 6
0 d
ays
(c
om
me
nc
ing
Ju
ne
to
No
vem
be
r) t
o in
un
da
te
pe
rma
ne
nt
an
d s
em
i-p
erm
an
en
t w
etla
nd
s, la
go
on
s a
nd
flo
od
run
ne
rs.
Ma
inta
in a
nd
en
ha
nc
e c
ha
nn
el a
nd
w
etla
nd
ha
bita
ts:
• P
rovi
de
co
nn
ec
tivit
y b
etw
ee
n
aq
ua
tic h
ab
itats
for fi
sh p
ass
ag
e.
• P
rom
ote
pro
du
ctiv
ity
to m
ain
tain
fo
od
we
bs
an
d e
co
syst
em
fu
nc
tion
fo
r in
-ch
an
ne
l flo
ra a
nd
fau
na
.
• P
rovi
de
ha
bita
t fo
r aq
ua
tic fa
un
a
(fish
, tu
rtle
s, f
rog
s, in
vert
eb
rate
s).
• M
ain
tain
ext
en
t a
nd
en
ha
nc
e
co
nd
itio
n o
f aq
ua
tic v
eg
eta
tion
.
2,0
00
ML/
d fo
r 90
da
ys (
co
mm
en
cin
g
Jun
e t
o N
ove
mb
er)
to
inu
nd
ate
p
erm
an
en
t a
nd
se
mi-
pe
rma
ne
nt
we
tlan
ds,
an
d a
po
rtio
n o
f th
e
floo
dp
lain
(4,
00
0 h
ec
tare
s).
Ma
inta
in a
nd
en
ha
nc
e c
ha
nn
el a
nd
w
etla
nd
ha
bita
ts:
• A
ll ta
rge
ts.
Re
sto
re fl
oo
dp
lain
:
• M
ain
tain
ext
en
t a
nd
imp
rove
c
on
diti
on
of r
ive
r re
d g
um
fore
sts.
• P
rom
ote
su
cc
ess
ful b
ree
din
g o
f w
ate
rbird
s (s
ho
rt li
fe c
ycle
e.g
. w
ate
rfo
wl)
.
• P
rovi
de
fish
pa
ssa
ge
th
rou
gh
exi
stin
g
fish
wa
ys lo
ca
ted
at
an
d in
sid
e
the
fore
st (
mo
re fi
shw
ays
ma
y b
e
co
nst
ruc
ted
in t
he
fu
ture
). A
lso
, to
a
llow
bio
ta t
o c
om
ple
te fl
ow
-driv
en
c
ritic
al l
ife c
ycle
pro
ce
sse
s. T
he
se
inc
lud
e s
pa
wn
ing
, se
ed
se
ttin
g a
nd
d
orm
an
t st
ag
es
tha
t a
re c
om
ple
ted
d
urin
g d
iffe
ren
t p
ha
ses
of t
he
w
ett
ing
an
d d
ryin
g c
ycle
.
• M
ain
tain
ext
en
t o
f sw
am
p w
alla
by
gra
ss.
• P
reve
nt
exc
ess
ive
bu
ild-u
p o
f o
rga
nic
ma
tte
r on
th
e fl
oo
dp
lain
su
rfa
ce
to
min
imis
e im
pa
cts
to
re
ce
ivin
g w
ate
rs.
6,0
00
ML/
d fo
r 50
da
ys (
co
mm
en
cin
g J
un
e t
o
No
vem
be
r).
Follo
we
d b
y 3,
400
ML/
d fo
r 55
da
ys.
Ma
nip
ula
tion
of r
eg
ula
tors
to
ma
na
ge
flo
od
re
ce
ssio
n.
Inu
nd
atio
n o
f 17,
800
he
cta
res
of fl
oo
dp
lain
fore
st.
Ma
inta
in a
nd
en
ha
nc
e c
ha
nn
el a
nd
we
tlan
d
ha
bita
ts:
• A
ll ta
rge
ts.
Re
sto
re fl
oo
dp
lain
s:
• M
ain
tain
ext
en
t a
nd
imp
rove
co
nd
itio
n o
f riv
er
red
gu
m fo
rest
s a
nd
wo
od
lan
ds.
• M
ain
tain
th
e h
ea
lth o
f bla
ck
bo
x w
oo
dla
nd
s.
• P
rom
ote
su
cc
ess
ful b
ree
din
g o
f wa
terb
irds
(lo
ng
lif
e c
ycle
e.g
. co
lon
ial n
est
ers
).
• P
rovi
de
fish
pa
ssa
ge
th
rou
gh
exi
stin
g fi
shw
ays
lo
ca
ted
at
an
d in
sid
e t
he
fore
st (
mo
re fi
shw
ays
m
ay
be
co
nst
ruc
ted
in t
he
fu
ture
). A
lso
, to
allo
w
bio
ta t
o c
om
ple
te fl
ow
-driv
en
crit
ica
l life
cyc
le
pro
ce
sse
s. T
he
se in
clu
de
sp
aw
nin
g, s
ee
d s
ett
ing
a
nd
do
rma
nt
sta
ge
s th
at
are
co
mp
lete
d d
urin
g
diff
ere
nt
ph
ase
s o
f th
e w
ett
ing
an
d d
ryin
g c
ycle
.
• P
reve
nt
exc
ess
ive
bu
ild-u
p o
f org
an
ic m
att
er
on
th
e fl
oo
dp
lain
su
rfa
ce
to
min
imis
e im
pa
cts
o
f lo
w o
xyg
en
bla
ckw
ate
r eve
nts
to
rec
eiv
ing
w
ate
rs.

12 Environmental Water Delivery Koondrook-Perricoota Forest
1. Overview

Part 2: Water Use Strategy

14 Environmental Water Delivery Koondrook-Perricoota Forest
4. Environmental water requirements
4.1 Baseline flow characteristics
The relationship between Murray River flow downstream of Torrumbarry Weir and overbank flows into the forest is shown in Table 4. A minimum flow of 15,000 ML/d is required for the commencement of flooding of low lying parts of the forest via the weir pool. A revised river-forest flow relationship for overbank flows has been provided and is included in the table below (FNSW pers. comm. 2011). These overbank flows are independent of the infrastructure works underway, as the works are designed to provide water to the forest under regulated conditions.
Table 4: Commence to flow for overbank flows into Koondrook-Perricoota Forest (FNSW 2009; FNSW pers. comm. 2011).
murray river Flow (d/s torrumbarry Weir) (ml/d) inflow to the forest via overbank flows (ml/d)
0 0
10,000 0
15,000 145
20,000 540
22,000 982
24,000 1,568
30,000 4,632
40,000 10,353
45,000 12,717
48,510 14,533
53,510 16,670
60,000 19,709
15
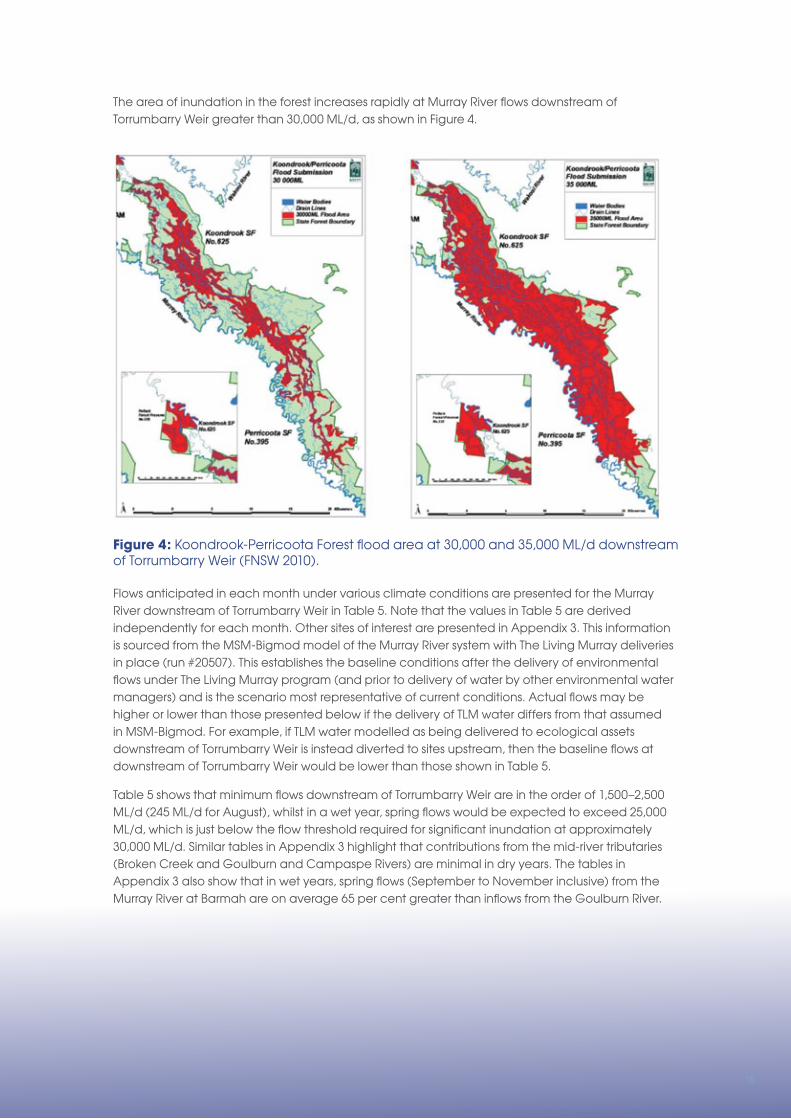
The area of inundation in the forest increases rapidly at Murray River flows downstream of Torrumbarry Weir greater than 30,000 ML/d, as shown in Figure 4.
Figure 4: Koondrook-Perricoota Forest flood area at 30,000 and 35,000 ML/d downstream of Torrumbarry Weir (FNSW 2010).
Flows anticipated in each month under various climate conditions are presented for the Murray River downstream of Torrumbarry Weir in Table 5. Note that the values in Table 5 are derived independently for each month. Other sites of interest are presented in Appendix 3. This information is sourced from the MSM-Bigmod model of the Murray River system with The Living Murray deliveries in place (run #20507). This establishes the baseline conditions after the delivery of environmental flows under The Living Murray program (and prior to delivery of water by other environmental water managers) and is the scenario most representative of current conditions. Actual flows may be higher or lower than those presented below if the delivery of TLM water differs from that assumed in MSM-Bigmod. For example, if TLM water modelled as being delivered to ecological assets downstream of Torrumbarry Weir is instead diverted to sites upstream, then the baseline flows at downstream of Torrumbarry Weir would be lower than those shown in Table 5.
Table 5 shows that minimum flows downstream of Torrumbarry Weir are in the order of 1,500–2,500 ML/d (245 ML/d for August), whilst in a wet year, spring flows would be expected to exceed 25,000 ML/d, which is just below the flow threshold required for significant inundation at approximately 30,000 ML/d. Similar tables in Appendix 3 highlight that contributions from the mid-river tributaries (Broken Creek and Goulburn and Campaspe Rivers) are minimal in dry years. The tables in Appendix 3 also show that in wet years, spring flows (September to November inclusive) from the Murray River at Barmah are on average 65 per cent greater than inflows from the Goulburn River.

16 Environmental Water Delivery Koondrook-Perricoota Forest
Table 5: Modelled streamflows (ML/d) for the Murray River downstream of Torrumbarry Weir (1895–2009) (Source: MSM-Bigmod run #20507).
month very dry year
(minimum on record)
Dry Year
(30th percentile daily flow)
median year
(50th percentile daily flow)
Wet year
(70th percentile daily flow)
Jul 1,752 6,073 9,271 18,278
Aug 245 6,924 13,124 24,475
Sep 2,118 7,938 15,286 26,881
Oct 2,113 6,375 10,322 19,228
Nov 1,659 6,601 8,873 12,869
Dec 1,913 6,458 7,919 9,562
Jan 2,548 5,173 5,777 6,516
Feb 2,573 4,860 5,677 6,441
Mar 2,118 3,700 4,311 4,781
Apr 1,880 4,398 5,413 6,572
May 1,537 3,849 4,898 6,851
Jun 1,902 3,642 5,236 9,075
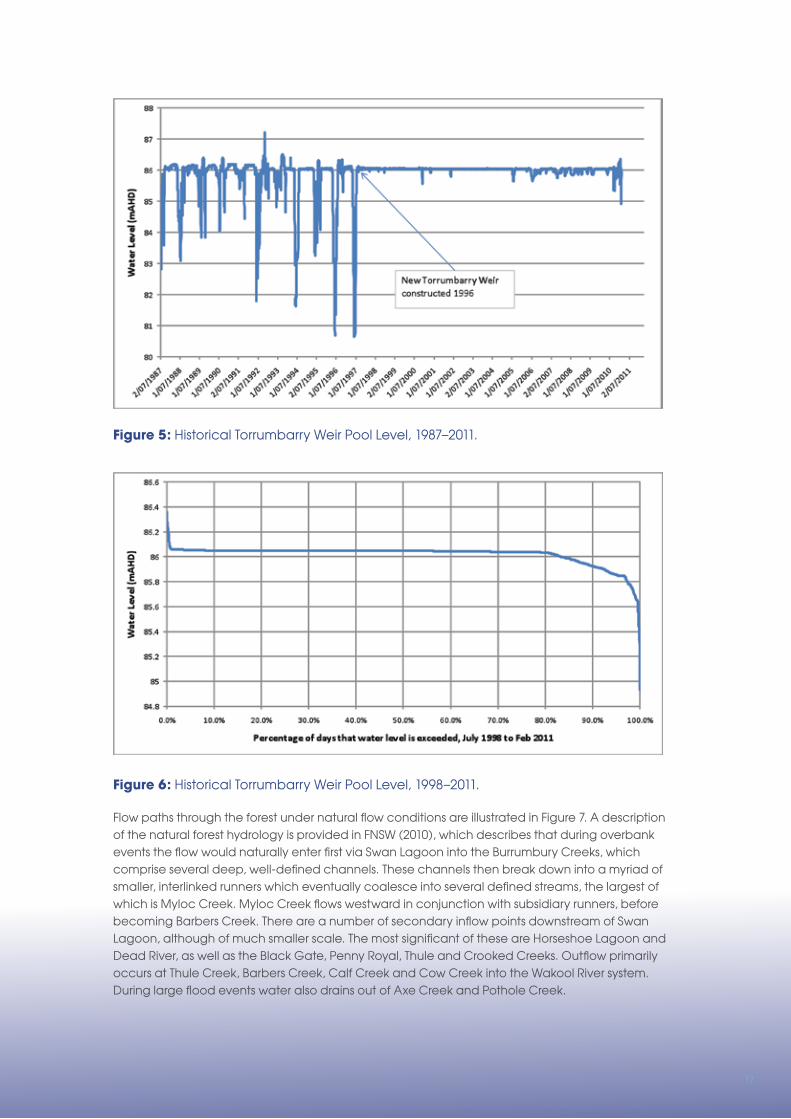
With the construction of the Torrumbarry Cutting, up to 6,000 ML/d may be diverted into the forest when the Torrumbarry Weir pool is within plus or minus 0.05 metres of the full supply level (86.05 mAHD) (FNSW 2009). The Torrumbarry Cutting will enable water to be diverted into the forest without significantly raising Murray River water levels. In accordance with the Murray River system operating manual (MDBA 2010), since the construction of the new Torrumbarry Weir in 1996, the weir pool is generally maintained at the full supply level, as shown in Figure 5. Minor drawdown occurs for maintenance and the weir was drawn down and then surcharged during the 2010–11 floods. A level duration curve of historical weir pool data since the late 1990s, shown in Figure 6, indicates that the weir pool is above the desired minimum operating level for the Torrumbarry Cutting (86.0 mAHD) on around 85 per cent of days under current operation. This indicates that there are unlikely to be any significant constraints on the use of the Torrumbarry Cutting due to weir operation.
17
Figure 5: Historical Torrumbarry Weir Pool Level, 1987–2011.
Figure 6: Historical Torrumbarry Weir Pool Level, 1998–2011.
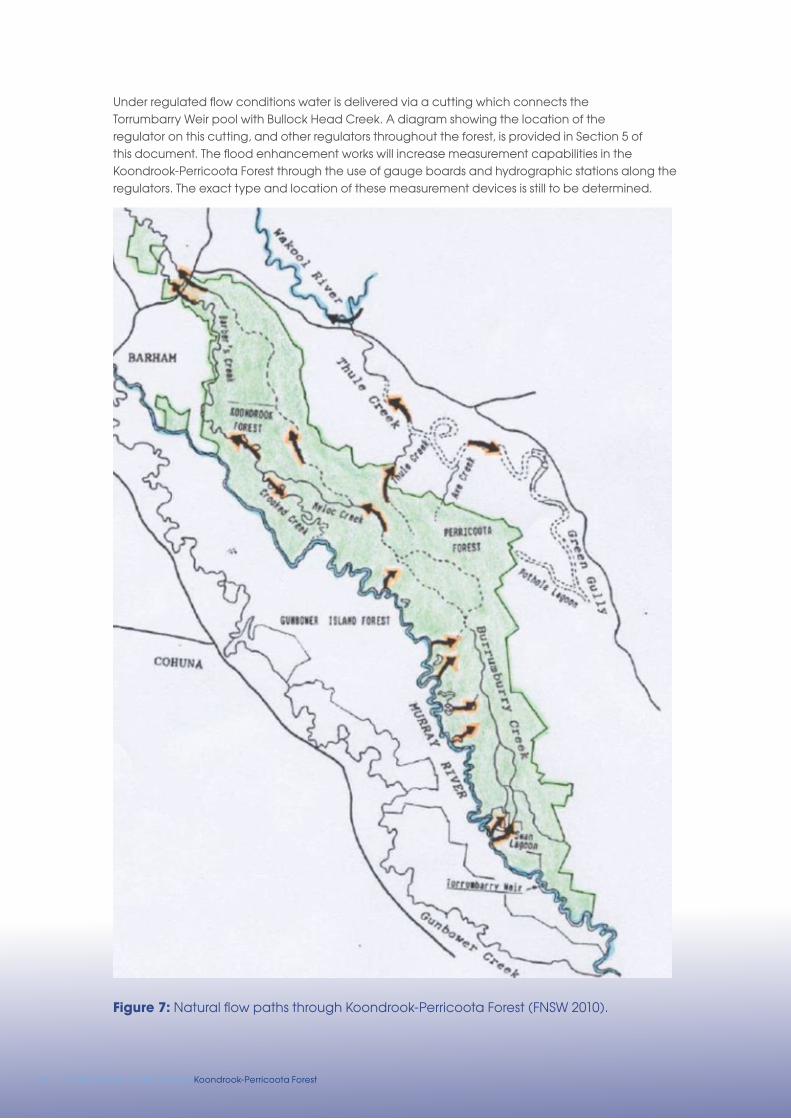
Flow paths through the forest under natural flow conditions are illustrated in Figure 7. A description of the natural forest hydrology is provided in FNSW (2010), which describes that during overbank events the flow would naturally enter first via Swan Lagoon into the Burrumbury Creeks, which comprise several deep, well-defined channels. These channels then break down into a myriad of smaller, interlinked runners which eventually coalesce into several defined streams, the largest of which is Myloc Creek. Myloc Creek flows westward in conjunction with subsidiary runners, before becoming Barbers Creek. There are a number of secondary inflow points downstream of Swan Lagoon, although of much smaller scale. The most significant of these are Horseshoe Lagoon and Dead River, as well as the Black Gate, Penny Royal, Thule and Crooked Creeks. Outflow primarily occurs at Thule Creek, Barbers Creek, Calf Creek and Cow Creek into the Wakool River system. During large flood events water also drains out of Axe Creek and Pothole Creek.
18 Environmental Water Delivery Koondrook-Perricoota Forest
Under regulated flow conditions water is delivered via a cutting which connects the Torrumbarry Weir pool with Bullock Head Creek. A diagram showing the location of the regulator on this cutting, and other regulators throughout the forest, is provided in Section 5 of this document. The flood enhancement works will increase measurement capabilities in the Koondrook-Perricoota Forest through the use of gauge boards and hydrographic stations along the regulators. The exact type and location of these measurement devices is still to be determined.
Figure 7: Natural flow paths through Koondrook-Perricoota Forest (FNSW 2010).

19
4.2 Environmental water demands
In Section 3 of this document flow targets were specified for different climate years. The flow targets (for inflow to the forest) for different climate years range from 1,000 ML/d for 60 days in a very dry year through to 6,000 ML/d for 50 days followed by 3,400 ML/d for 55 days in a wet year. The different flow targets may be supplied either via natural flooding (i.e. overbank flows in the river reach downstream of Torrumbarry Weir) or directly from the Torrumbarry Weir pool via the ‘Torrumbarry Cutting’ currently being constructed as a part of The Living Murray works program.
The frequency at which the flow targets are supplied from overbank flows or deliveries through the Torrumbarry Cutting was estimated using data extracted from the MSM-Bigmod model. The results of this analysis are shown Table 6. These results show that under current conditions with The Living Murray water deliveries already in place (run #20507), the wet year target flow magnitude would be met in 5.2 years out of every 10 years (all years). This figure is described as ‘all years’ because the event can occur within or outside of the wet climate year that it is designated as a target event for, for example it may occur in a median year instead, and so all data has been considered for all climate years. The model also found that in most instances the required event duration would not be supplied (the required duration would be met in 1.5 years out of every 10 years). If only wet years are considered, the wet year flow target is reached in 6.7 years out of every 10 wet years, but the specified duration is only reached in 2.5 wet years out of 10. Actual recurrence intervals may be higher or lower than those presented below if the delivery of TLM water differs from that assumed in MSM-Bigmod. For example, if TLM water modelled as being delivered to Koondrook-Perricoota Forest is instead diverted to other TLM sites, then the average recurrence interval of events would be lower than those shown below.
The median duration of events of naturally occurring overbank flows with TLM watering for the target wet year flow recommendation was only 43 days compared to a target of 105 days. This suggests that watering events are commencing, but are not being completed under the modelled TLM deliveries. The assumptions used in the TLM modelling and the driver for ceasing event delivery requires further investigation.
Table 6: Average recurrence interval for each flow target.
Climate Year
Event number of years in 10
with event of any duration
(all years)
number of years in 10 with
an event of the specified duration (all
years)
number of years in 10 with event of any duration (climate years
only)
number of years in 10 with
an event of the specified
duration (climate years only)
Wet 6,000 ML/d for 50 days followed by 3,400 ML/d
for 55 days
5.2 1.5 6.7 (in wet years only)
2.5 (in wet years only)
Median 2,000 ML/d for 90 days 6.1 1.6 5.7 (in median years only)
1.4 (in median years only)
Dry 1,500 ML/d for 60 days 6.1 3.1 5.6 (in dry years only)
2.2 (in dry years only)
Very dry 1,000 ML/d for 60 days 6.7 3.2 6.2 (in extreme dry years only)
0.6 (in extreme dry years only)
Under The Living Murray, the target watering regime is to deliver 6,000 ML/d for 50 days followed by 3,400 ML/d for 55 days (i.e. the wet year flow target) one in every three years. This means that significant volumes of water are already being delivered for the wet year event and environmental water managers only need to supplement these events by extending the duration when The Living Murray accounts are insufficient to complete the event for the full duration.

20 Environmental Water Delivery Koondrook-Perricoota Forest
The estimated range of volumetric requirements is shown in Table 7 for each desired event. These volumes are in addition to any water delivered under The Living Murray program. The triggers for implementing each flow recommendation in this analysis are in line with the operational triggers outlined in Section 5. Hydrologic analysis for this delivery plan is based on static output from MSM-Bigmod, that is, feedback loops within the system have not been incorporated into the modelling. For example, return flows from watering the Barmah-Millewa Forest have not been incorporated and so the river flow values used for Koondrook-Perricoota Forest are not dynamically responsive to changes in water levels. If MSM-Bigmod was to be used interactively, that is, feedback loops be incorporated in the modelling, then an investigation into greater flexibility in delivery rules and improved understanding of the volumes required to be delivered may be possible.
The required delivery volume may vary considerably from year to year depending on the ability to forecast flow conditions prior to deciding whether to proceed with the event. The volume required, summarised in Table 7, is therefore indicative only. Actual volumes should be based, as best as possible, on MDBA operational model forecasts.
Table 7: Range of additional volumes required to achieve the desired environmental flow in given climate years.
Climate Year
Event no. of years in 10 event is triggered in
given climate years
average volume
provided in given
climate years (Gl/year)
maximum volume
provided (Gl/year)
average volume
provided in all climate years
(Gl/year)
Wet 6,000 ML/d for 50 days followed by 3,400 ML/d for 55 days
3.9 32.8 393.9 10.3
Medium 2,000 ML/d for 90 days 8.1 100.1 180.0 18.5
Dry 1,500 ML/d for 60 days 7.8 63.6 90.0 12.8
Very dry 1,000 ML/d for 60 days 9.4 40.3 60.0 12.0
Total 53.7
Return flow volumes from the watering of Koondrook-Perricoota Forest can be significant and have been estimated at 70–84 per cent of delivered flows (FNSW et al. 2008). The figures in Table 7 do not include an allowance for return flows, which could substantially reduce the net volume required if those return flows can be re-credited to environmental water managers. Further discussion on return flows is provided in Section 6.
4.3 Summary of environmental water demands
The environmental water demands from the range of proposed events are shown in Table 8. This table indicates that the volume required to supply all of the proposed events averages 54,000 ML per year but could range from no requirement to over 390,000 ML per year in any given year. Demands for water are significantly greater in medium years than in dry to very dry years. This calculation was based on supplementing the existing flows, including current TLM deliveries. Actual shortfall volumes may be higher or lower than those presented below if the delivery of TLM water differs from that assumed in MSM-Bigmod. For example, if TLM water modelled as being delivered to Koondrook-Perricoota Forest is instead diverted to other TLM sites, then the additional volume required to achieve the target flows would be greater than those shown below.

21
Table 8: Range of additional volume to achieve the desired environmental flow across all climate years.
Climate Year
minimum annual volume in given
climate years (Gl/year)
maximum annual volume in given
climate years (Gl/year)
average annual volume in given
climate years (Gl/year)
average annual volume, averaged over
all climate years (Gl/year)
Wet 0.0 393.9 32.8 10.3
Medium 0.0 180.0 100.1 18.5
Dry 0.0 90.0 63.6 12.8
Very dry 0.0 60.0 40.3 12.0
All years 53.7
The effect of the proposed environmental flow recommendations on the average and maximum interval between events is shown in Table 9. This table shows, for example, that by utilising environmental water in the manner proposed, the target flow for the very dry year would be provided in almost all years and the frequency of occurrence of all events would be significantly increased. As stated previously, these results are based on hydrologic data from MSM-Bigmod which has The Living Murray deliveries already in place. The target duration for the wet year event is not reached (i.e. provided 5.6 years in 10 in wet years rather than in all wet years), because not all designated wet years have an overbank flow to initiate watering the forest.
Table 9: Change in recurrence intervals under proposed watering regime.
Climate year
Event no. of years in 10 with event of specified
duration (all years)
no. of years in 10 with event of specified
duration (climate years only)
Current Proposed Current Proposed
Wet 6,000 ML/d for 50 days followed by 3,400 ML/d for 55 days
1.5 1.8 2.5 5.6
Medium 2,000 ML/d for 90 days 1.6 4.0 1.4 10.0
Dry 1,500 ML/d for 60 days 3.1 6.0 2.2 10.0
Very Dry 1,000 ML/d for 60 days 3.2 8.8 0.6 10.0

22 Environmental Water Delivery Koondrook-Perricoota Forest
5. Operating regimes
5.1 introduction
This section presents proposed operational triggers for implementation of the environmental flow proposals. These triggers should be used as a guide and refined based on operational experience after watering events. Operational water delivery includes several steps including:
• Identifying target environmental flow recommendations for the coming season.
• Defining triggers to commence and cease delivering those recommended flows.
• Defining triggers for opening or closing environmental flow regulators.
• Identifying any constraints on water delivery, such as the potential for flooding of private land, delivery costs, limits on releases from flow regulating structures, interactions with other environmental assets and possible downstream effects such as risk of blackwater events.
5.2 identifying target environmental flow recommendations
The selection of target environmental flows in each of the different climate years is triggered in this document by the combined Victorian and NSW Murray allocations at the start of July (allocations to Victorian high reliability water shares, Victorian low reliability water shares, NSW high security water shares and NSW general security water shares) as shown in Table 10. Allocations have been used as a surrogate for seasonal river flow conditions. Allocations have been detailed from the start of July as these allocations provide the volumes available for the June–November watering actions proposed in this document (see Table 3 and Table 11).
Using these triggers, very dry years occur approximately 30 per cent of the time, dry years occur approximately 20 per cent of the time, median years occur approximately 18 per cent of the time and wet years occur approximately 32 per cent of the time.
23
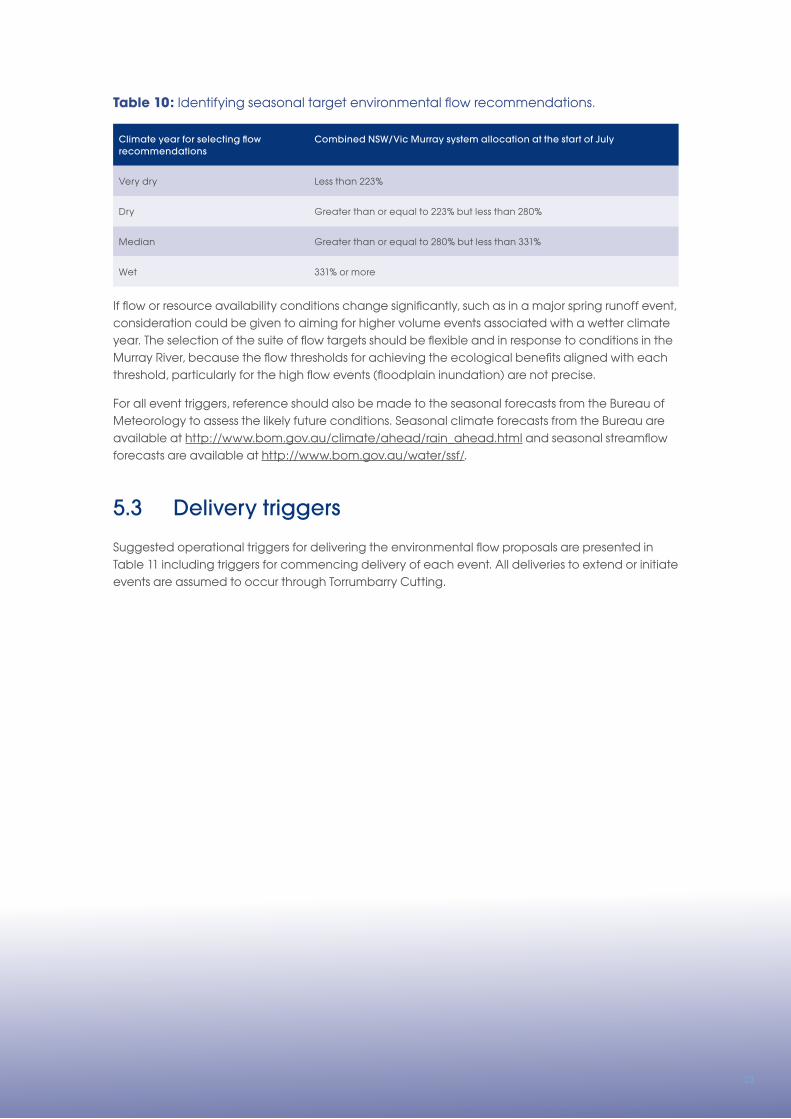
Table 10: Identifying seasonal target environmental flow recommendations.
Climate year for selecting flow recommendations
Combined nSW/vic murray system allocation at the start of July
Very dry Less than 223%
Dry Greater than or equal to 223% but less than 280%
Median Greater than or equal to 280% but less than 331%
Wet 331% or more
If flow or resource availability conditions change significantly, such as in a major spring runoff event, consideration could be given to aiming for higher volume events associated with a wetter climate year. The selection of the suite of flow targets should be flexible and in response to conditions in the Murray River, because the flow thresholds for achieving the ecological benefits aligned with each threshold, particularly for the high flow events (floodplain inundation) are not precise.
For all event triggers, reference should also be made to the seasonal forecasts from the Bureau of Meteorology to assess the likely future conditions. Seasonal climate forecasts from the Bureau are available at http://www.bom.gov.au/climate/ahead/rain_ahead.html and seasonal streamflow forecasts are available at http://www.bom.gov.au/water/ssf/.
5.3 Delivery triggers
Suggested operational triggers for delivering the environmental flow proposals are presented in Table 11 including triggers for commencing delivery of each event. All deliveries to extend or initiate events are assumed to occur through Torrumbarry Cutting.

24 Environmental Water Delivery Koondrook-Perricoota Forest
Table 11: Summary of operational regime for achievement of proposed environmental objectives.
Climate year
Flow objective (flow into forest)
Season/ timing
average return period
trigger for delivery trigger for ceasing delivery
(if applicable)
Very dry 1,000 ML/d for 60 days
Jun – Nov Every very dry year
Commence delivery to extend a commenced event if:
• an overbank event occurs naturally
• a managed event commences
• by 1 September
Whichever occurs earlier.
n/a
Dry 1,500 ML/d for 60 days
Jun – Nov Every dry year
Commence delivery to extend a commenced event if:
• an overbank event occurs naturally
• a managed event commences
• by 1 September
Whichever occurs earlier.
n/a
Median 2,000 ML/d for 90 days
Jun – Nov Every median year
Commence delivery to extend a commenced event if:
• an overbank event occurs naturally
• a managed event commences
• by 1 September
Whichever occurs earlier.
If risks to private property and infrastructure are likely.
Wet 6,000 ML/d for 50 days followed by 3,400 ML/d for 55 days
Jun – Nov Every wet year
Commence delivery to extend a commenced event if:
• an overbank event occurs naturally
• a managed event commences.
Consider not delivering if 6,000 ML/d event is of short (<7 days) duration and account volumes are low.
Also, if risks to private property and infrastructure are likely.
The integration of water delivery to achieve multiple ecological outcomes, for example the coordination of watering events at multiple locations, has not been considered in this document and requires further investigation.

25
5.4 Wetland regulators
There are various regulators and effluent creeks which allow water to enter Koondrook-Perricoota Forest from the Murray River. The capacity of the regulators is as shown in Table 12 (MDBA 2010) and locations are shown in Figure 8. The table shows that the regulators and effluent creeks commence to flow when the Murray River downstream of Torrumbarry Weir exceeds 15,000 ML/d. This flow threshold is higher than the 50th percentile daily flow at this site in all months except August (the 50th percentile daily flow for August is 15,286 ML/d).
The operation of the inlet regulators will differ for natural, managed and hybrid events (FNSW 2009):
• Entirely natural events – Swan Lagoon regulator will be open and water will enter the forest via Swan Lagoon and other effluent creeks. The Torrumbarry Cutting regulator will remain closed throughout the event.
• Entirely managed events – Torrumbarry Cutting regulator will be open and water will enter the forest via the Torrumbarry Cutting. Swan Lagoon regulator will remain closed throughout the event.
• Hybrid event – Swan Lagoon regulator will be open and water will enter the forest via Swan Lagoon and other effluents. The Torrumbarry Cutting will be opened as required to supplement or extend the flow event.
Table 12: Wetland regulator and effluent creek capacities (MDBA 2010).
regulator/effluent creek murray river (d/s torrumbarry) commence to flow (ml/d)
Capacity at murray river (d/s torrumbarry) flows of
30,000 ml/d (ml/d)
Swan Lagoon 15,000 4,600
Burrumbury Creek 16,000 Not specified
Fire Hut 18,000 Not specified
Thule 17,000 Not specified
Crooked Creek During overbank flows only Not specified
Little Forest 21,500 at Barham Not specified
CI Lagoon 17,000 at Barham Not specified
Waddy Creek (Merran Creek) 2,000 at Barham Not specified
Little Merran Creek (Merran Creek) 1,400 at Barham 1,000
Outflows from the forest can also be regulated. There are four regulators that can be used to pool water in the forest – Barbers overflow, Barbers Creek, Cow Creek and Calf Creek. The sum of the capacity of these four regulators under regulated flow conditions is currently planned to be 250 ML/d. The return channel on Crooked Creek can be used to measure outflows up to 1,850 ML/d from the forest back to the Murray River.

26 Environmental Water Delivery Koondrook-Perricoota Forest
Figure 8: Location of Flow Regulators (MDBA 2010b).

27
5.5 Storage releases
The release capacities of upstream Murray River storages (Hume Dam, Yarrawonga Weir and Torrumbarry Weir) and Lake Eildon on the Goulburn River are not a constraint to delivering environmental flows to the Koondrook-Perricoota Forest. The physical release capacity of Hume Dam is in excess of the downstream constraints on releases due to flooding of private land. The release capacity of Lake Eildon and both Yarrawonga Weir and Torrumbarry Weir are not a constraint in delivering environmental flows downstream. However, flow constraints at the Barmah Choke will constrain releases to downstream.
Flooding constraints and flow peak attenuation between the storage release points (Hume Dame and Lake Eildon) and Koondrook-Perricoota do however constrain the ability to deliver large releases (such as would be required for overbank flows) to Koondrook-Perricoota. These constraints are discussed further in the following sub-sections.
5.6 Delivery of water for high flow events
The ability to deliver water to the forest from Torrumbarry Weir pool means that flood events can be created or extended under regulated flow conditions without the need to raise the river level above bankfull flow. Koondrook-Perricoota Forest is still likely to receive water under natural floods, and any watering of upstream ecological assets such as the Barmah-Millewa Forest or the Lower Goulburn floodplain could contribute to overbank flooding at Koondrook-Perricoota Forest. The advantage of overbank events is that they have the potential to reach all of the forest, whereas the regulated supply from the Torrumbarry Weir Pool can only reach part of the forest. Significant attenuation of flood peaks occurs as floods pass through the Barmah-Millewa Forest and the Lower Goulburn floodplain. Significant losses of water to these assets can also occur with large uncertainties in the volumes of these losses from event to event. For these reasons no specific strategy is recommended for the delivery of overbank events from further upstream, other than to respond to those events when they occur by extending their duration as required to meet the recommended flows and manage recessions.
5.7 travel time
The travel time along the Murray River under regulated flow conditions is approximately four days from Hume Dam to Yarrawonga Weir and a further seven days from Yarrawonga Weir to Torrumbarry Weir. Large volumes of regulated releases can also be delivered from Lake Eildon via the Goulburn River. The travel time from Lake Eildon to the Murray River confluence under regulated flow conditions is approximately seven days.
An example of a high flow event for the Murray River downstream of Torrumbarry is shown in Figure 9. This example shows that high flows recorded downstream of Yarrawonga are significantly attenuated by the Barmah-Millewa Forest (some data missing) and contribute to long periods of sustained high flows at Torrumbarry Weir with low rates of rise and fall. Peak flow events recorded on the Goulburn River at McCoys Bridge then contribute to peak events at Torrumbarry on top of the more constant high flows from the Murray River.
Based on the hydrographs at these sites it is difficult to discern the travel time between Yarrawonga and Torrumbarry, however the travel time from McCoys Bridge to Torrumbarry appears to be in the order of six or seven days.

28 Environmental Water Delivery Koondrook-Perricoota Forest
Figure 9: Murray River example event – Spring 2000.
5.8 Flooding
During natural (i.e. overbank) flooding events, outflow from Koondrook-Perricoota Forest is primarily through Thule, Barbers, Calf and Cow Creeks which return flows to the Murray River via the Wakool System. FNSW (2009) notes that during large flood events water also drains from the forest via Axe and Pothole Creeks and floods into some adjoining private property.
As a part of the flood enhancement works, downstream structures are being constructed to regulate water flowing out of the forest. In terms of flooding impacts, a levee is being constructed around the downstream perimeter of the forest to protect adjoining properties from flooding. The location of this 43 kilometre levee is shown as the dashed line on Figure 8. The levee has a level of 78.8 mAHD. Its height varies from zero to approximately four metres above the floodplain (FNSW 2010). Despite the construction of the levy, there are still some potential flooding issues in the vicinity of Barbers Creek and outflows from the downstream regulators will need to be managed to avoid any local flooding in this area. The 250 ML/d is the current cumulative planned limit on releases from the downstream regulators and is specified to prevent this flooding. This means that flows from other regulators accumulating at Barbers Creek regulator should not create flows in excess of 250 ML/d at Barbers Creek regulator. Barbers Creek has several blockbanks which are used to pool water for diversion to landholders. If bywashes are constructed around the blockbanks, then up to approximately 500 ML/d may be released from the regulators.
Forests NSW is currently investigating opportunities to increase releases from the forest up to 2,000 ML/d, which is an approximate bankfull flow in the creek. This would potentially require alternative access to be provided to landholders to enable the blockbanks to be removed, together with a range of other measures (L.Broekman, Forests NSW, pers.comm. 21/4/11). Resolving these flooding issues will be important for improved delivery of environmental flows, as the full 6,000 ML/d capacity through the Torrumbarry Cutting cannot currently be utilised for the desired duration due to the outlet flow constraints.

29
5.9 Weir flow control
The desired maximum 6,000 ML/d of flow through the Torrumbarry Cutting is achievable when the Torrumbarry Weir pool is within 5 centimetres of full supply level. The weir pool may be drawn down occasionally for maintenance or flood control, which could occasionally limit environmental water managers’ ability to use the cutting.
5.10 interactions with other assets
The Koondrook-Perricoota Forest forms part of the Central Murray Floodplain which includes Gunbower Forest, Barmah-Millewa Forest, Lower Goulburn floodplain and the Edward-Wakool system. Deliveries of water to these upstream and adjacent assets have the potential to interact with flow behaviour in the Koondrook-Perricoota Forest through the provision of overbank flows or the ability to re-divert return flows re-credited to environmental water managers from upstream. Water from the Koondrook-Perricoota Forest can interact with the lower Wakool system via effluent creeks near Barham and downstream ecological assets on the Murray River, such as the Lindsay, Mulcra and Wallpolla Islands.
The flow recommendations in this document are consistent with those for Gunbower Forest in that all deliveries are proposed under regulated flow conditions.
5.11 Water Delivery Costs
5.11.1 Delivery CostsState Water’s delivery costs for the Murray system for 2011–12 include a usage charge of $4.89/ML plus an annual fee for high security of $2.85/ML and for general security of $2.32/ML. See the following reference for details: http://www.statewater.com.au/Customer+Service/Water+Pricing.
Any water sourced from Victorian water shares for delivery to the Koondrook-Perricoota Forest would first be transferred to a NSW Murray system account and State Water’s delivery costs would apply.
5.11.2 Regulated river water management chargesThe NSW Office of Water also charges water users to recover a share of the costs incurred for providing water planning and management services, including managing the quantity and quality of water available to water users. In 2011–12 these charges for the NSW Murray system are $0.90/ML for usage and $1.38/ML of entitlement per unit share.
See http://www.water.nsw.gov.au/Water-management/water-management-charges/default.aspx for more information.
5.11.3 Carryover CostsState Water does not charge for carryover.
Goulburn-Murray Water does not charge for carryover up to 100 per cent of entitlement volume, but does charge per megalitre for water shares transferred from the Spillable Water Account to an Allocation Bank Account. The fee for transferring water from the spillable water account back to an allocation bank account is $4.52/ML for the Murray system. See http://www.g-mwater.com.au/customer-services/carryover#1 for more information.
30 Environmental Water Delivery Koondrook-Perricoota Forest
6. Governance
6.1 Delivery partners, roles and responsibilities
The major strategic partners in delivering water to the Koondrook-Perricoota Forest include:
• NSW Office of Environment and Heritage as the manager of the Adaptive Environmental Water and Murray Additional Environmental Allowance (AEA) in the Water Sharing Plan for the NSW Murray and Lower Darling Regulated Rivers Water Sources.
• MDBA as the operator of the Murray system storage, weirs and locks.
• State Water Corporation as operator of the water delivery infrastructure.
• Forests NSW as operators of the flow regulators into and out of Werai Forest.
• Murray Catchment Management Authority as a stakeholder in the development and implementation of watering plans.
• Victorian Department of Sustainability and Environment and NSW Office of Environment and Heritage as holders of water for the Barmah-Millewa Allowance.
• NSW Office of Water as managers of the NSW water resource.
6.2 approvals, licenses, legal and administrative issues
6.2.1 Water shepherding and return flowsReturn flows from the Koondrook-Perricoota Forest are significant and have been estimated to be 70–84 per cent of delivered flows (FNSW et al. 2008). Similarly, return flows from delivery of water to upstream ecological assets could potentially be re-used to deliver water to Koondrook-Perricoota Forest. There are a number of regulators that will be constructed as a part of the flood enhancement works to return flows to the system. These include:
• The return channel and Crooked Creek regulator return flows directly to the Murray River and have the ability to regulate return flows of up to 1,850 ML/d (FNSW 2009), which suggests that not all return flows from the forest are expected to pass via this mechanism.
31
• Other downstream regulators including Thule Creek regulator, Calf Creek regulator, Cow Creek regulator, Barbers Creek regulator and Barbers Overflow regulator which return flows to the Wakool System. During managed watering events these regulators will be used to retain water in the forest, rather than pass water downstream. During managed watering events up to 250 ML/d may be passed to Barbers Creek, however flows should not exceed this figure in order to prevent flooding. During natural watering events, all regulators will be operated to maintain natural flow paths through, and out of, the forest.
The monitoring of these regulators, discussed further in Section 9, will allow accurate accounting of return flows and net water use in the forest during managed events.
In NSW, Section 45 of the Water Sharing Plan for the NSW Murray and Lower Darling Regulated Rivers Water Sources (which recommenced from 1 July 2011) allows water allocations to be re-credited in accordance with return flow rules established under Section 75 of the Water Management Act 2000 (NSW). Under the present water sharing arrangements within the context of the Murray-Darling Basin Agreement and NSW Water Sharing Plan rules, gaining “recredits” for water in the Murray River downstream of the Koondrook-Perricoota Forest are not possible. However, water released for environmental purposes may be passed through NSW and not diverted for consumptive use as part of the NSW resource at times when the NSW Murray is in a period of unregulated flow. This would not strictly result in a re-credit, but would amount to the entitlement allocation not being used in NSW at the time therefore rendering it available to be accounted downstream of the forest. Any such arrangement would require an application to the NSW Commissioner of Water.
In these situations NSW consults with Victoria via the Water Liaison Working Group on the effects of the sharing of losses and inflows relevant to each individual State water shares. NSW Office of Water needs time to prepare how it will manage the water resources it has at its disposal and as such applying for water to be treated in this manner should be undertaken early in the planning process (D.Jacobs, NOW, pers.comm. 29/07/11).
6.3 trading rules and system accounting
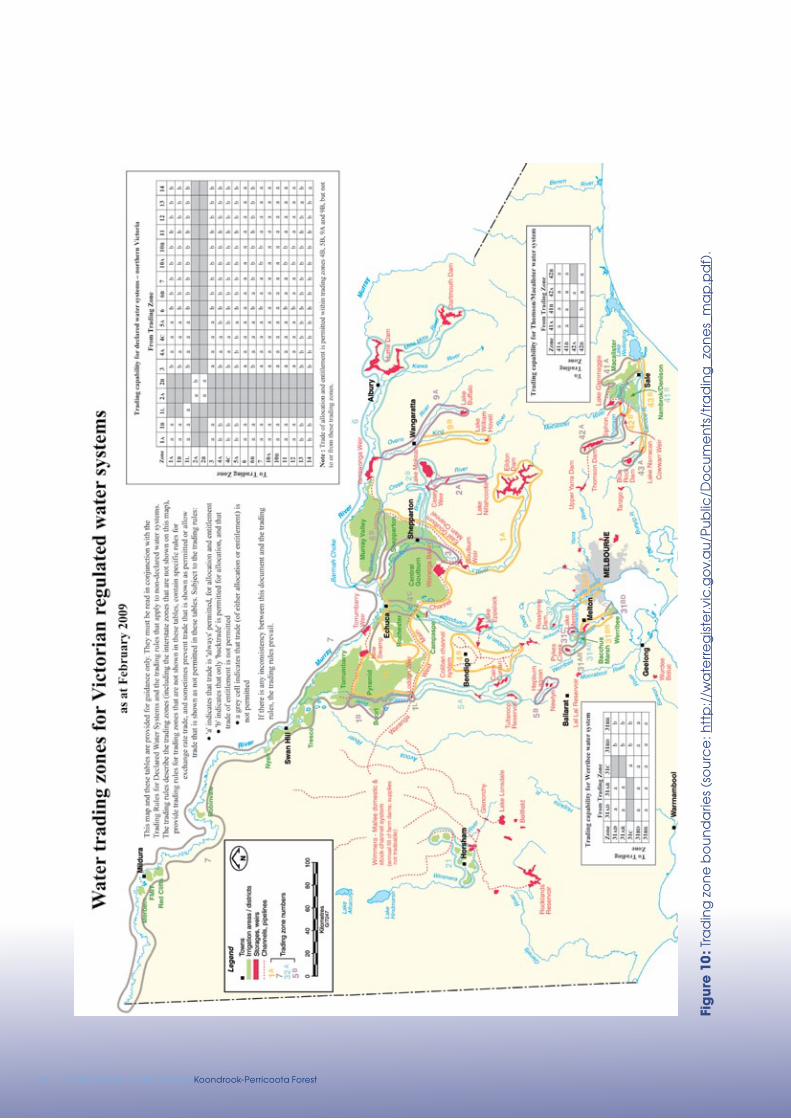
6.3.1 Water tradingA map of the trading zones for the southern Murray-Darling Basin is shown in Figure 10.
32 Environmental Water Delivery Koondrook-Perricoota Forest
Fig
ure
10: T
rad
ing
zo
ne b
ou
nda
ries
(so
urc
e: h
ttp
://w
ate
rreg
iste
r.vic
.go
v.a
u/P
ub
lic/D
oc
um
ent
s/tr
ad
ing
_zo
nes_
ma
p.p
df)
.

33
Fig
ure
10: T
rad
ing
zo
ne b
ou
nda
ries
(so
urc
e: h
ttp
://w
ate
rreg
iste
r.vic
.go
v.a
u/P
ub
lic/D
oc
um
ent
s/tr
ad
ing
_zo
nes_
ma
p.p
df)
.
Koondrook-Perricoota Forest is located in Trading Zone 11 (NSW Murray below Barmah Choke).
From Trading Zone 11, allocation and entitlement trade can occur to:
• Zone 6: Victorian Murray Dartmouth to Barmah
• Zone 7: Victorian Murray Barmah to South Australia
• Zone 10A: NSW Murray above Barmah
• Zone 10B: Murray Irrigation Limited
• Zone 11: NSW Murray below Barmah (within system trade)
• Zone 12: South Australian Murray.
From Trading Zone 11, allocation trade up to the volume of back trade to date (but no entitlement trade) can occur to:
• Zone 1A: Greater Goulburn
• Zone 1B: Boort
• Zone 3: Lower Goulburn
• Zone 4A: Campaspe
• Zone 4C: Lower Campaspe
• Zone 5A: Loddon
• Zone 6B: Lower Broken Creek
• Zone 13: Murrumbidgee
• Zone 14: Lower Darling.
The volume of back trade at any given time is listed at: www.waterregister.vic.gov.au/Public/Reports/InterValley.aspx
Allocation and entitlement trade can occur into Trading Zone 11 from:
• Zone 1A: Greater Goulburn
• Zone 1B: Boort
• Zone 3: Lower Goulburn
• Zone 4A: Campaspe
• Zone 4C: Lower Campaspe
• Zone 5A: Loddon
• Zone 6B: Lower Broken Creek
• Zone 7: Victorian Murray Barmah to South Australia
• Zone 11: NSW Murray below Barmah (within system trade)
• Zone 12: South Australian Murray
• Zone 13: Murrumbidgee
• Zone 14: Lower Darling.

34 Environmental Water Delivery Koondrook-Perricoota Forest
Allocation trade up to the volume of back trade to date (but no entitlement trade) can occur into Trading Zone 11 from:
• Zone 6: Victorian Murray Dartmouth to Barmah
• Zone10A: NSW Murray above Barmah
• Zone 10B: Murray Irrigation Limited.
Additional Trading Rules
All trade (except to unregulated tributaries) is with an exchange rate of 1.00. Trade into Murray Irrigation Limited Areas (Trading Zone 10B) currently attracts a 10 per cent loss of share volume. This 10 per cent loss only applies when using the Murray Irrigation Limited channel system to deliver water and does not apply to water delivered via rivers (D. Jacobs, NOW, pers. comm. 8/12/10).
Permanent trade is currently limited to 4 per cent per year from irrigation districts in Victoria. Goulburn-Murray Water advises via media releases when these limits are reached for individual irrigation districts. There are various exemptions for this limit specified in the trading rules on the Victorian Water Register. For more information on water trading rules, see the Victorian Water Register (http://waterregister.vic.gov.au/).
A service standard for allocation trade processing times has been implemented by the Council of Australian Governments (COAG):
• Interstate – 90 per cent of allocation trades between NSW/Victoria processed within 10 business days.
• Interstate – 90 per cent of allocation trades to/from South Australia processed within 20 business days.
• Intrastate – 90 per cent of allocation trades processed within five business days.
This means that environmental water managers must make any allocation trades well in advance of a targeted runoff event.
Water trading attracts water trading fees. If the Australian Government conducts its own water trading without the use of a broker, the fees are currently less than $200. See the Victorian Water Register for Victorian fee schedules at http://www.waterregister.vic.gov.au/Public/ApplicationFees.aspx or State Water’s website at http://www.statewater.com.au/Customer+Service/Water+Trading for fees in NSW.

35
6.3.2 Water storage accountingIn the NSW Murray, water allocated against regulated river (high security) access licences and regulated river (conveyance) access licences cannot be carried over. For regulated river (general security) access licences in the Murray Water Source, up to 50 per cent may be carried over. These carryover rules are based on the Water Sharing Plan for the NSW South Wales Murray and Lower Darling Regulated Rivers Water Sources, which was suspended between 2006 and 30 June 2011 due to prolonged drought conditions, but recommenced from 1 July 2011 with the recent improvements in resource availability.
Water storage accounting for the Victorian Murray system is annual water accounting (July to June) with some carryover. In the Victorian Murray, unlimited storage carryover is allowed, but water above 100 per cent of the water share volume can be quarantined in a spillable water account when there is risk of spill. Any water in the spillable water account cannot be accessed until the risk of spill has passed. If a spill occurs, water in the Spillable Water Accounts is the first to spill. Annual deduction for evaporation is 5 per cent of the carried over volume. The fee for transferring water from the spillable water account back to the allocation bank account is $4.52/ML for the Murray system. See http://www.g-mwater.com.au/customer-services/carryover#1 for more information.
For more information on carryover, see http://www.g-mwater.com.au/customer-services/carryover/lbbcarryover.
6.4 Water use plans
There are a number of plans that are currently in development or in draft stage for environmental water management in the Koondrook-Perricoota Forest. The MDBA is developing the Koondrook-Perricoota Icon Site Environmental Water Management Plan to guide the use of environmental water under the Living Murray (MDBA in prep). Forests NSW have developed a Preliminary Operating Plan (draft) as part of the Flood Enhancement Project (FNSW 2009) for the management of regulated floods into the forest via the planned infrastructure works. In addition, Koondrook-Perricoota Forest is identified as a hydrological indicator site for the development of the Murray-Darling Basin Plan (MDBA 2010).
The environmental water provisions in the Water Sharing Plan for the New South Wales Murray and Lower Darling Regulated Rivers Water Sources 2003 are implemented by the OEH. The plan sets out provisions for planned environmental water (Barmah-Millewa Allowance, Barmah-Millewa Overdraw, Lower Darling Environmental Contingency Allowance, and a Murray Regulated River Water Source Additional Environmental Allowance and Adaptive Environmental Water). Of these only the Murray Regulated River Water Source Additional Environmental Allowance and Adaptive Environmental Water are of direct relevance to the Koondrook-Perricoota Forest, though in most instances some water from the Barmah-Millewa Allowance would flow through to the forest.
The OEH intends to produce an Annual Watering Plan for each regulated water source in which they have a decision making role. This watering plan will cover use of Environmental Water Allowances and any licences nominated as Adaptive Environmental Water (DECW 2010). During the 2009–10 season the Murray Lower Darling Environmental Water Advisory Group (MLD EWAG) was established to provide advice on the management of environmental water within the NSW Murray Valley.

36 Environmental Water Delivery Koondrook-Perricoota Forest
7. Risk Assessment and mitigation strategies
Potential risks of delivering environmental water to the Koondrook-Perricoota Forest were assessed as part of the Flood Enhancement Project (GHD 2010). The risk assessment outlined in Table 13 provides an indication of these risks. It should be noted that risks are not static and require continual assessment to be appropriately managed. Changes in conditions will affect the type of risks, the severity of their impacts and the mitigation strategies that are appropriate for use. As such, a risk assessment must be undertaken prior to the commencement of water delivery. A framework for assessing risks has been developed by SEWPaC and is included at Appendix 4.
The most significant risk is to receiving waters, such as the Wakool River and to a lesser extent, Murray River, from blackwater events. Releases of water from floodplain forests can result in low dissolved oxygen blackwater events as organic matter on the floodplain surface is rapidly metabolised by microorganisms (Baldwin 2009; Gilligan et al. 2009). This poses a serious risk to native fish and significant fish deaths have resulted from this process as recently as spring and summer 2010–11. However the risk to native fish (and other aquatic fauna) from low dissolved oxygen can potentially be mitigated by careful management to ensure sufficient flushing flows, and timing of water releases during cooler months rather than during summer.
The flooding of Koondrook-Perricoota Forest in spring 2010 resulted in the movement of organic matter that had accumulated on the floodplain over 16 years. There is therefore a lower likelihood of a widespread blackwater event from floodplain inundation in the next year or two, as there has been less time for litter to accumulate on the floodplain surface over time. An appropriate environmental watering regime will avoid organic build up and so will also help to mitigate this risk.
Environmental flows may also result in an increase in the abundance and types of invasive species within the system. Carp (Cyprinus carpio) are already present in the system, and experience from adjacent areas such as Barmah-Millewa has shown that floodplain inundation can favour carp spawning and recruitment (Stuart and Jones 2002). In addition, floodwaters can carry propagules for invasive plant species, and it is possible that native macrophytes could be displaced by invasive species such as arrowhead (Sagittaria graminea). However, the increased risk from environmental water delivery (above normal river operations) on the spread of invasive species is unknown. Weeds such as arrowhead, which favour stable water levels, may well already be distributed through the suitable habitat the system and would not survive periods of dry conditions, if transported into intermittent and ephemeral streams and wetlands.
A rapid reduction in river discharge interrupts plant growth and fauna breeding and can strand fish on the floodplain. Environmental watering options have been developed to mitigate this risk by releasing environmental water to reduce recession rates. However, rapid recession is also a risk associated with environmental water releases and may occur if a watering event is interrupted. When environmental watering events are planned, the rate of recession should be considered and measures put in place to minimise the risk of rapid recession.

37
Tab
le 1
3: R
isk
ass
oc
iate
d w
ith w
ate
r de
live
ry in
the
Ko
ond
roo
k-Pe
rric
oo
ta F
ore
st.
ris
k ty
pe
De
scrip
tion
like
liho
od
Co
nse
qu
en
ce
ris
k le
vel
miti
ga
tion
Bla
ckw
ate
rB
lac
kwa
ter e
ven
ts h
ave
be
en
rec
ord
ed
with
th
e re
lea
se
of w
ate
r aft
er p
rolo
ng
ed
dry
or l
ow
flo
w p
erio
ds.
Th
is c
an
o
cc
ur f
rom
in-c
ha
nn
el l
itte
r bu
ild-u
p a
s w
ell
as
wh
en
flo
od
wa
ters
are
retu
rne
d t
o s
tre
am
s o
ff fl
oo
dp
lain
su
rfa
ce
s.
Un
like
ly
– Li
kely
, d
ep
en
din
g o
n
an
tec
ed
en
t c
on
diti
on
s in
flo
od
pla
in.
Ma
jor
Hig
hB
lac
kwa
ter r
isks
ma
y b
e re
du
ce
d b
y:
• p
rovi
din
g re
co
mm
en
de
d fl
oo
dp
lain
in
un
da
tion
reg
ime
s th
at
avo
id s
ust
ain
ed
p
erio
ds
with
ou
t flo
od
ing
• a
void
ing
flo
od
pla
in in
un
da
tion
in w
arm
su
mm
er m
on
ths.
Pest
pla
nts
an
d a
nim
als
Ca
rp b
ree
din
g is
like
ly t
o b
e fa
vou
red
by
larg
e
flow
eve
nts
in t
he
fore
sts
as
is t
he
sp
rea
d o
f th
e
no
xio
us
we
ed
arr
ow
he
ad
.
Like
lyM
ino
rM
ed
ium
Flo
w o
ptio
ns
for d
isru
ptio
n o
f ca
rp s
pa
wn
ing
c
an
be
inve
stig
ate
d. H
ow
eve
r, a
ny
me
asu
res
wo
uld
ne
ed
to
ma
inta
in n
ativ
e fi
sh s
pa
wn
ing
.
We
ed
co
ntr
ol m
ea
sure
s to
lim
it th
e s
pre
ad
a
nd
de
cre
ase
th
e a
bu
nd
an
ce
of a
rro
wh
ea
d
sho
uld
be
exp
lore
d.
Ac
id s
ulp
ha
te s
oils
Co
nd
itio
ns
thro
ug
ho
ut
the
fore
sts
are
no
t c
on
sid
ere
d li
kely
to
co
nta
in p
ote
ntia
l ASS
.R
are
Mo
de
rate
Low
No
ne
req
uire
d.
Ra
pid
rec
ess
ion
A ra
pid
fall
in w
ate
r le
vels
ca
n le
ad
to
a re
du
ctio
n in
re
cru
itme
nt
of fi
sh a
nd
wa
terb
irds,
as
we
ll a
s im
pa
cts
to
w
etla
nd
flo
ra.
Poss
ible
Mo
de
rate
Me
diu
mD
esi
gn
en
viro
nm
en
tal r
ele
ase
s w
ith a
su
itab
le
floo
d re
ce
ssio
n.
Re
cre
atio
na
l ac
ce
ssSo
me
tra
ck
ac
ce
ss c
an
be
cu
t d
urin
g fl
oo
d e
ven
ts.
Len
gth
en
ing
th
e d
ura
tion
of t
he
se e
ven
ts w
ith
en
viro
nm
en
tal w
ate
r de
live
ries
ma
y le
ng
the
n t
he
pe
riod
fo
r wh
ich
pa
rts
of t
he
fore
sts
ca
nn
ot
be
ac
ce
sse
d b
y re
cre
atio
na
l use
rs.
Poss
ible
Min
or
Low
Wo
rk w
ith o
the
r sta
keh
old
ers
to
ass
ess
ac
ce
ss
risks
in fl
oo
d e
ven
ts a
nd
ad
just
wa
terin
g
ac
co
rdin
gly
. Co
mm
un
ity
ed
uc
atio
n t
o
info
rm o
n b
en
efit
s o
f flo
od
ing
in fl
oo
dp
lain
e
co
syst
em
s.
Flo
od
ing
of p
riva
te la
nd
Re
lea
ses
fro
m t
he
do
wn
stre
am
reg
ula
tors
into
Ba
rbe
rs
Cre
ek
mu
st p
ass
th
rou
gh
priv
ate
lan
d a
nd
ha
ve t
he
p
ote
ntia
l to
ca
use
flo
od
ing
un
de
r so
me
circ
um
sta
nc
es.
Poss
ible
Mo
de
rate
Me
diu
mEn
viro
nm
en
tal w
ate
r ma
na
ge
rs t
o b
e u
pd
ate
d
of i
nve
stig
atio
ns
by
Fore
sts
NSW
on
th
is is
sue
.

38 Environmental Water Delivery Koondrook-Perricoota Forest
8. Environmental Water Reserves
8.1 Environmental water holdings and provisions
8.1.1 Water planning responsibilitiesThe water sharing plan for the NSW Murray and Lower Darling Regulated Rivers Water Sources was suspended in November 2006 due to prolonged drought conditions but recommenced on July 1 2011. Water sharing is administered by the NSW Office of Water.
The adaptive environmental water allocated under the water sharing plan is overseen by OEH. Annually, OEH prepares an adaptive environmental water plan for the Murray Valley (DECCW 2010). During the 2009–10 season the Murray Lower Darling Environmental Water Advisory Group (MLD EWAG) was established to provide advice on the management of environmental water within the NSW Murray Valley and Lower Darling. This includes representatives from the Murray CMA, Lower Murray-Darling CMA, Murray-Darling Freshwater Research Centre, Murray Lower Darling Customer Service Committee, NSW Murray Darling Wetlands, State Water Corporation, NSW Office of Water, NSW Office of Environment and Heritage, Department of Primary Industries (Fisheries), the Murray Lower Darling Rivers Indigenous Nations (MILDRIN) and Forests NSW.
Structures in the Koondrook-Perricoota Forest are controlled by Forests NSW under the direction of the MDBA and operated by State Water.
8.1.2 Environmental water provisionsMinimum flow requirements are not specified in the water sharing plan for the NSW Murray and Lower Darling Regulated Rivers Water Sources, rather a volume of water is allocated to the environment as Adaptive Environmental Water. Similarly, the Victorian environmental entitlements do not specify minimum channel flows in the Murray River.
During the irrigation season, flows in the Murray River are generally running above natural streamflows because of irrigation deliveries. During the non-irrigation season, minimum flows in the Murray River are provided from Victorian tributaries.

39
Minimum flows from Victorian tributaries downstream of the Barmah-Millewa Forest are outlined in the water delivery documents for the Lower Goulburn floodplain and the Campaspe River. This includes:
• Minimum flows in Goulburn-Murray Water’s Goulburn River Bulk Entitlement, which requires a minimum average monthly flow at the McCoys Bridge gauging station of 350 ML/d for the months of November to June inclusive (at a daily rate of no less than 300 ML/d) and 400 ML/d for the months of July to October inclusive (at a daily rate of no less than 350 ML/d). Refer to Peter Cottingham & Associates and SKM (2011).
• Minimum flows of 20–70 ML/d in the Campaspe River from the Campaspe Siphon to the Murray River as specified in Goulburn-Murray Water’s Campaspe System Bulk Entitlement. Refer to Peter Cottingham & Associates and SKM (2011b).
• No minimum flows specified for Broken Creek outflows, however minimum flows are often delivered along Broken Creek to manage water quality. Refer to Peter Cottingham & Associates and SKM (2011c).
Whilst not specified in the water sharing plan or environmental entitlements, minimum Murray River flows are maintained for operational purposes. Downstream of Yarrawonga Weir a minimum flow of 1,800 ML/d is maintained “to provide minimum flows for riparian and water quality requirements” (MDBA 2010). When releases drop below 4,000 ML/d irrigation deliveries at Moira Lake are affected and when flows at Tocumwal drop below 6,000 ML/d the Bullatale Creek irrigators who access water from Lower Toupna Creek can be affected (MDBA 2010). The MDBA notifies these parties if minimum flows drop below these values.
Minimum flow requirements downstream of Torrumbarry Weir in the Murray River operations manual are uncertain. A minimum flow of 1,800 ML/d at Torrumbarry is suggested to provide flows for riparian and water quality requirements (MDBA 2010).
8.1.3 Current water holdingsCommonwealth environmental water holdings (as at October 2010) in the southern Murray-Darling Basin connected system are summarised in Table 14. Licences have been identified separately upstream and downstream of the Barmah Choke, as this can sometimes be a restriction on trade. The volume available downstream of the Choke is up to approximately 308 GL whilst licences above the Choke can provide up to an additional 194 GL if traded to downstream of the Choke, although trade from upstream to downstream of the Choke is limited. Note that the Murrumbidgee, Loddon, Victorian Murray and South Australian allocations would need to be traded to the NSW Murray downstream of the Choke prior to use for Koondrook-Perricoota Forest.

40 Environmental Water Delivery Koondrook-Perricoota Forest
Table 14: Commonwealth environmental water holdings (as at October 2010).
System licence volume (ml) Water share type
NSW Murray above Barmah Choke 0.0 High security
155,752.0 General security
VIC Murray above Barmah Choke 32,361.3 High reliability water share
5,674.1 Low reliability water share
Ovens* 0.0
Total above Barmah Choke 32,361.3 High security/reliability
161,426.1 Low security/reliability
NSW Murray below Barmah Choke 386.0 High security
32,558.0 General security
VIC Murray below Barmah Choke 78,721.9 High reliability water share
5,451.3 Low reliability water share
Murrumbidgee** 64,959.0 General security
0.0
Goulburn 64,919.6 High reliability water share
10,480.0 Low reliability water share
Broken*** 0.0
0.0
Campaspe 5,124.1 High reliability water share
395.4 Low reliability water share
Loddon 1,179.0 High reliability water share
527.3 Low reliability water share
South Australia 43,297.4 High reliability
Total below Barmah Choke 193,628.0 High security/reliability
114,371.0 Low security/reliability
* Commonwealth environmental water holdings includes 70.0 ML of regulated river entitlement on the Ovens System, however this water cannot be traded outside of the Ovens Basin.
** Commonwealth environmental water holdings includes 20,820 ML of supplementary water shares on the Murrumbidgee System, however this water cannot be traded outside of the Murrumbidgee Basin.
*** Commonwealth environmental water holdings includes 20.0 ML of high reliability water share and 4.2 ML of low reliability water share on the Broken System, however this water cannot be traded outside of the Broken Basin.

41
Environmental water currently held in the Murray River downstream of the Choke by other agencies is listed in Table 15. Only volumes downstream of the Choke have been listed as these other water shares are generally tied to use at specific locations which may preclude trading to downstream of the Choke from upstream of the Choke. This table indicates that significant volumes of water could be available from other environmental entitlements in the Murray River downstream of the Choke. This does not include any water delivered to Barmah-Millewa Forest and along the Goulburn River under The Living Murray and State government entitlements, which can potentially contribute several hundred gigalitres more environmental water to the Murray River at Torrumbarry Weir.
Table 15: Environmental water currently held by other agencies in Murray River downstream of Barmah Choke.
Water holding volume Comments
Water Sharing Plan for the NSW Murray and Lower Darling Regulated Rivers Water Sources – Adaptive Environmental Water
30,000 unit shares conveyance (broadly equivalent to ~15,000 ML high security and ~15,000 ML low security)
2,027 unit shares high security (2,027 ML)
The plan was suspended but recommenced from 1 July 2011.
Water Sharing Plan for the NSW Murray and Lower Darling Regulated Rivers Water Sources – Murray Additional Environmental Allowance
0.03 ML per unit share of high security (~6,000 ML)
Can be carried over and up to 28,000 ML.
Murray River – Flora and Fauna Conversion Further Amending Order (2009) – Flora and Fauna (Victoria)
27,600 ML high reliability water share
Murray River – Flora and Fauna Conversion Further Amending Order (2009) – The Living Murray (Victoria)
2,080 ML high reliability water share
58,537 ML low reliability water share
34,300 ML unregulated flow
Unregulated flow entitlement only available when MDBA declares its availability.
The Living Murray – NSW Murray system 1,887 high security
134,387 general security
350,000 ML supplementary
12,965 ML unregulated
Unclear how much of this is above or below the Choke.
Minister for Environment (in Trust for Snowy Recovery) – Snowy Environmental Reserve (Victoria)
29,794 ML high reliability water share Unclear how much of this is above or below the Choke.
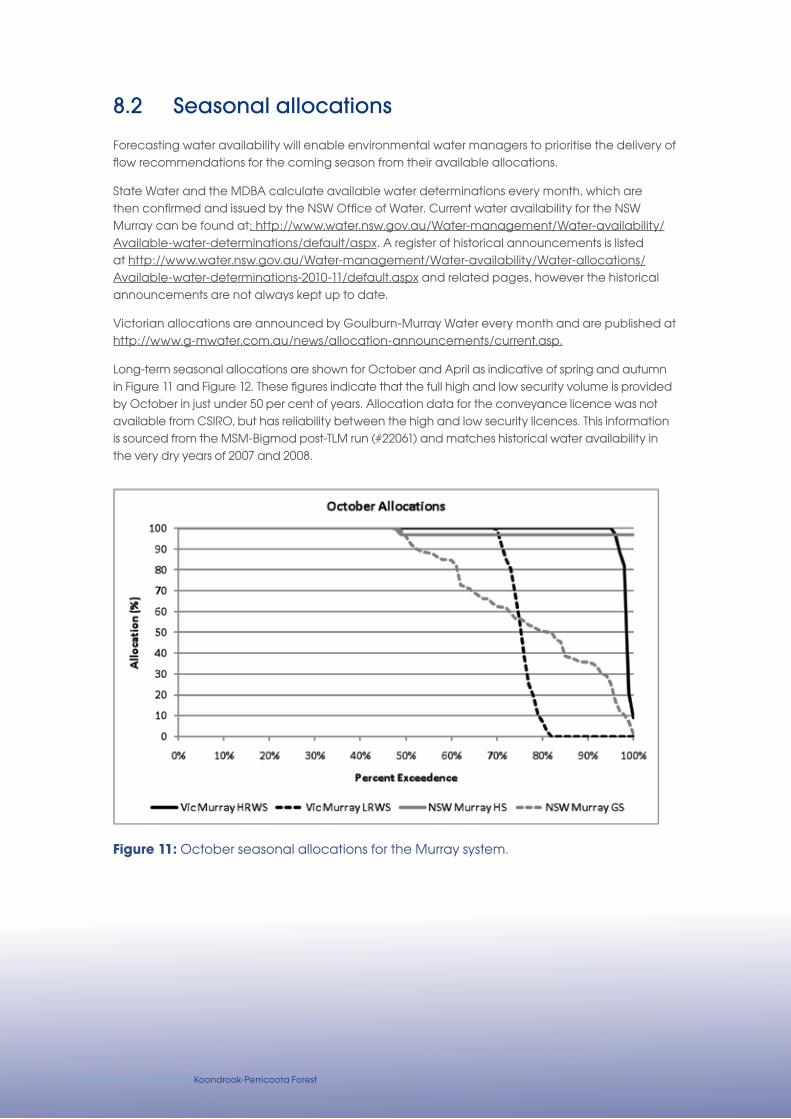
42 Environmental Water Delivery Koondrook-Perricoota Forest 43
8.2 Seasonal allocations
Forecasting water availability will enable environmental water managers to prioritise the delivery of flow recommendations for the coming season from their available allocations.
State Water and the MDBA calculate available water determinations every month, which are then confirmed and issued by the NSW Office of Water. Current water availability for the NSW Murray can be found at: http://www.water.nsw.gov.au/Water-management/Water-availability/Available-water-determinations/default/aspx. A register of historical announcements is listed at http://www.water.nsw.gov.au/Water-management/Water-availability/Water-allocations/Available-water-determinations-2010-11/default.aspx and related pages, however the historical announcements are not always kept up to date.
Victorian allocations are announced by Goulburn-Murray Water every month and are published at http://www.g-mwater.com.au/news/allocation-announcements/current.asp.
Long-term seasonal allocations are shown for October and April as indicative of spring and autumn in Figure 11 and Figure 12. These figures indicate that the full high and low security volume is provided by October in just under 50 per cent of years. Allocation data for the conveyance licence was not available from CSIRO, but has reliability between the high and low security licences. This information is sourced from the MSM-Bigmod post-TLM run (#22061) and matches historical water availability in the very dry years of 2007 and 2008.
Figure 11: October seasonal allocations for the Murray system.

42 Environmental Water Delivery Koondrook-Perricoota Forest 43
Figure 12: April seasonal allocations for the Murray system.
The allocation expected to be available (in terms of announced allocation) to the environment under different climate conditions is summarised in Table 16. The volume of water expected to be available to the environment under different climate conditions is summarised in Table 17 based on October 2010 water holdings. The calculation of the volume of water expected to be available to the environment under each climate condition is based on the volume and type of entitlements held and the expected announced allocation for each climate condition (from modelling).
The tables show, for example, that the Commonwealth Government could expect to have minimal (less than 1,000 ML) water available in the NSW Murray River below the Choke in spring in a very dry year and 33,000 ML of water available below the Choke in a wet year. If water is traded from other locations within the connected southern Murray-Darling Basin, then up to 53,000 ML could be available in spring in a very dry year and up to 501,000 ML could be available in spring in a wet year, subject to any trading constraints.
Tables 16 and 17 were provided by SKM and based on allocation information from a MSM-Bigmod model of the Murray River system with The Living Murray deliveries in place (run #22061).

44 Environmental Water Delivery Koondrook-Perricoota Forest 45
Tab
le 1
6: L
ike
ly a
lloc
atio
n a
ga
inst
Co
mm
onw
ea
lth e
nviro
nm
ent
al w
ate
r ho
ldin
gs,
und
er d
iffe
rent
clim
ate
sc
ena
rios.
riv
er S
yste
mSe
cu
rity
reg
iste
red
En
title
me
nts
(m
l)
(oc
t 201
0)
Wa
ter a
vaila
bili
ty
oc
tob
er a
lloc
atio
n (
%)
ap
ril a
lloc
atio
n (
%)
ve
ry d
ryD
rym
ed
ian
We
tv
ery
dry
Dry
me
dia
nW
et
NSW
Mu
rra
y a
bo
ve B
arm
ah
Ch
oke
Ge
ne
ral s
ec
urit
y15
5,75
2.0
162
9610
012
100
100
100
Vic
toria
n M
urr
ay
ab
ove
Ba
rma
h C
ho
keH
igh
relia
bili
ty w
ate
r sh
are
32,3
61.3
9
100
100
100
2910
010
010
0
Low
relia
bili
ty w
ate
r sh
are
5,67
4.1
099
100
100
010
010
010
0
Ove
ns
Hig
h re
liab
ility
wa
ter s
ha
re70
.0
100
100
100
100
100
100
100
100
NSW
Mu
rra
y b
elo
w B
arm
ah
Ch
oke
Hig
h s
ec
urit
y38
6.0
9797
9710
097
100
100
100
Ge
ne
ral s
ec
urit
y32
,558
.0
162
9610
012
100
100
100
Vic
toria
n M
urr
ay
be
low
Ba
rma
h C
ho
keH
igh
relia
bili
ty w
ate
r sh
are
78,7
21.9
9
100
100
100
2910
010
010
0
Low
relia
bili
ty w
ate
r sh
are
5,45
1.3
099
100
100
010
010
010
0
Mu
rru
mb
idg
ee
Ge
ne
ral s
ec
urit
y64
,959
.0
1042
5564
1068
100
100
Sup
ple
me
nta
ry20
,820
.0
00
010
00
00
100
Go
ulb
urn
Hig
h re
liab
ility
wa
ter s
ha
re64
,919
.6
2010
010
010
028
100
100
100
Low
relia
bili
ty w
ate
r sh
are
10,4
80.0
0
454
960
1778
100v
Bro
ken
Hig
h re
liab
ility
wa
ter s
ha
re20
.0
196
9798
110
010
010
0
Low
relia
bili
ty w
ate
r sh
are
4.2
00
00
010
010
010
0
Ca
mp
asp
eH
igh
relia
bili
ty w
ate
r sh
are
5,12
4.1
3310
010
010
043
100
100
100
Low
relia
bili
ty w
ate
r sh
are
395.
4 0
100
100
100
010
010
010
0
Lod
do
nH
igh
relia
bili
ty w
ate
r sh
are
1,17
9.0
010
010
010
00
100
100
100
Low
relia
bili
ty w
ate
r sh
are
527.
3 0
254
960
1678
100
Sou
th A
ust
ralia
Hig
h re
liab
ility
43,2
97.4
44
100
100
155
6210
010
010
2
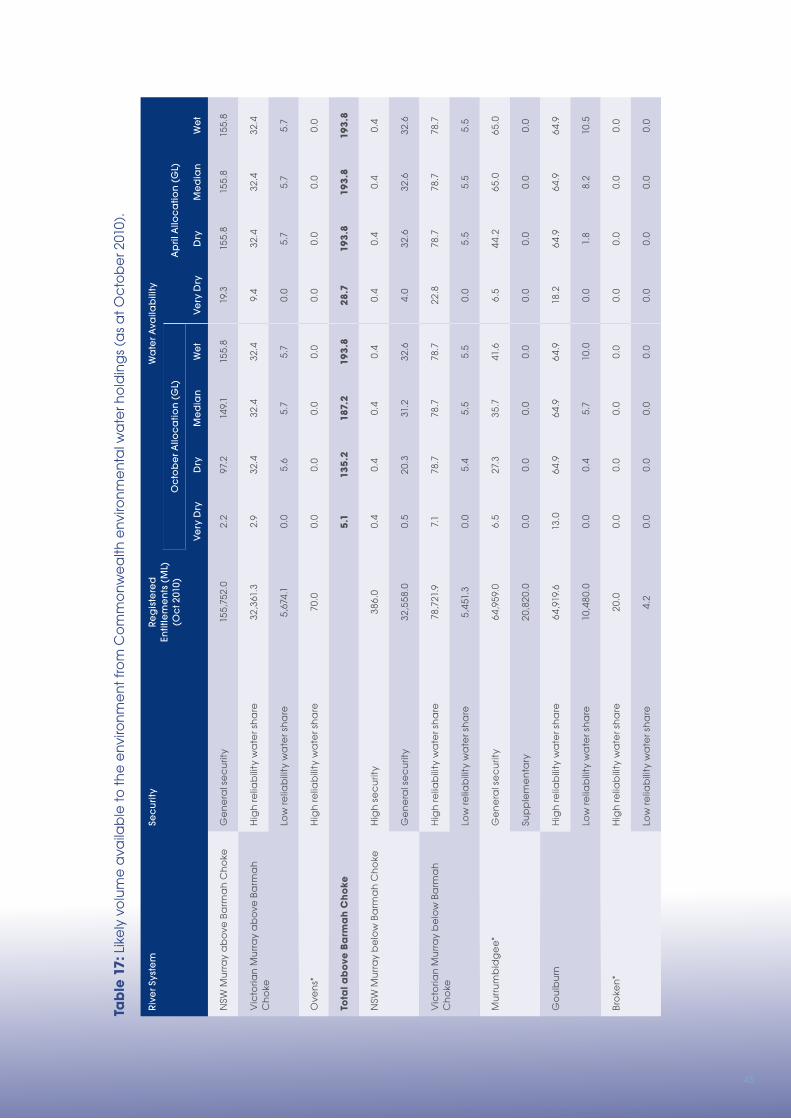
44 Environmental Water Delivery Koondrook-Perricoota Forest 45
Tab
le 1
7: L
ike
ly v
olu
me
ava
ilab
le to
the
env
iron
me
nt fr
om
Co
mm
onw
ea
lth e
nviro
nm
ent
al w
ate
r ho
ldin
gs
(as
at O
cto
be
r 201
0).
riv
er S
yste
mSe
cu
rity
reg
iste
red
En
title
me
nts
(m
l)
(oc
t 201
0)
Wa
ter a
vaila
bili
ty
oc
tob
er a
lloc
atio
n (
Gl)
ap
ril a
lloc
atio
n (
Gl)
ve
ry D
ryD
rym
ed
ian
We
tv
ery
Dry
Dry
me
dia
nW
et
NSW
Mu
rra
y a
bo
ve B
arm
ah
Ch
oke
Ge
ne
ral s
ec
urit
y15
5,75
2.0
2.2
97.2
149.
115
5.8
19.3
155.
815
5.8
155.
8
Vic
toria
n M
urr
ay
ab
ove
Ba
rma
h
Ch
oke
Hig
h re
liab
ility
wa
ter s
ha
re32
,361
.3
2.9
32.4
32.4
32.4
9.4
32.4
32.4
32.4
Low
relia
bili
ty w
ate
r sh
are
5,67
4.1
0.0
5.6
5.7
5.7
0.0
5.7
5.7
5.7
Ove
ns*
Hig
h re
liab
ility
wa
ter s
ha
re70
.0
0.0
0.0
0.0
0.0
0.0
0.0
0.0
0.0
Tota
l ab
ove
Ba
rma
h C
ho
ke
5.1
135.
218
7.2
193.
828
.719
3.8
193.
819
3.8
NSW
Mu
rra
y b
elo
w B
arm
ah
Ch
oke
Hig
h s
ec
urit
y38
6.0
0.4
0.4
0.4
0.4
0.4
0.4
0.4
0.4
Ge
ne
ral s
ec
urit
y32
,558
.0
0.5
20.3
31.2
32.6
4.0
32.6
32.6
32.6
Vic
toria
n M
urr
ay
be
low
Ba
rma
h
Ch
oke
Hig
h re
liab
ility
wa
ter s
ha
re78
,721
.9
7.1
78.7
78.7
78.7
22.8
78.7
78.7
78.7
Low
relia
bili
ty w
ate
r sh
are
5,45
1.3
0.0
5.4
5.5
5.5
0.0
5.5
5.5
5.5
Mu
rru
mb
idg
ee
*G
en
era
l se
cu
rity
64,9
59.0
6.
527
.335
.741
.66.
544
.265
.065
.0
Sup
ple
me
nta
ry20
,820
.0
0.0
0.0
0.0
0.0
0.0
0.0
0.0
0.0
Go
ulb
urn
Hig
h re
liab
ility
wa
ter s
ha
re64
,919
.6
13.0
64.9
64.9
64.9
18.2
64.9
64.9
64.9
Low
relia
bili
ty w
ate
r sh
are
10,4
80.0
0.
00.
45.
710
.00.
01.
88.
210
.5
Bro
ken*
Hig
h re
liab
ility
wa
ter s
ha
re20
.0
0.0
0.0
0.0
0.0
0.0
0.0
0.0
0.0
Low
relia
bili
ty w
ate
r sh
are
4.2
0.0
0.0
0.0
0.0
0.0
0.0
0.0
0.0

46 Environmental Water Delivery Koondrook-Perricoota Forest
riv
er S
yste
mSe
cu
rity
reg
iste
red
En
title
me
nts
(m
l)
(oc
t 201
0)
Wa
ter a
vaila
bili
ty
oc
tob
er a
lloc
atio
n (
Gl)
ap
ril a
lloc
atio
n (
Gl)
ve
ry D
ryD
rym
ed
ian
We
tv
ery
Dry
Dry
me
dia
nW
et
Ca
mp
asp
eH
igh
relia
bili
ty w
ate
r sh
are
5,12
4.1
1.7
5.1
5.1
5.1
2.2
5.1
5.1
5.1
Low
relia
bili
ty w
ate
r sh
are
395.
4 0.
00.
40.
40.
40.
00.
40.
40.
4
Lod
do
nH
igh
relia
bili
ty w
ate
r sh
are
1,17
9.0
0.0
1.2
1.2
1.2
0.0
1.2
1.2
1.2
Low
relia
bili
ty w
ate
r sh
are
527.
3 0.
00.
00.
30.
50.
00.
10.
40.
5
Sou
th A
ust
ralia
Hig
h re
liab
ility
43,2
97.4
19
.043
.343
.366
.926
.643
.343
.344
.3
Tota
l be
low
Ba
rma
h C
ho
ke4
8.1
247.
427
2.3
307
.78
0.8
278.
13
05.
63
09.
0
Tota
l53
.238
2.6
459
.55
01.5
109.
547
1.8
499.
45
02
.8
* C
om
mo
nw
ea
lth h
old
ing
s o
n t
he
Ove
ns
an
d B
roke
n s
yste
m a
nd
su
pp
lem
en
tary
ho
ldin
gs
on
th
e M
urr
um
bid
ge
e s
yste
m c
an
no
t b
e t
rad
ed
ou
tsid
e o
f th
e s
ou
rce
tra
din
g z
on
e. A
s su
ch,
ho
ldin
gs
in
the
se b
asi
ns
do
no
t c
on
trib
ute
to
to
tal w
ate
r ava
ilab
ility
.

47
8.3 Water availability forecasts
Under normal conditions for the New South Wales Murray NOW provides allocation announcements via media releases on the 1st and 15th of each month along with key information concerning water management and availability. See http://www.water.nsw.gov.au/Water-management/Water-availability/Water-allocations/Available-water-determinations/default.aspx for an example of these media releases.
A description of likely water availability for the Victorian Murray System is provided by Goulburn-Murray Water when allocation announcements are made. Allocation announcements are generally made on the 15th of each month (or the next business day), however when allocations to high reliability water shares are less than 100 per cent allocation announcements are made on the 1st and 15th of each month (or the next business day).
The current allocation announcement and a description of likely future water availability for the remainder of the season can be sourced from: http://g-mwater.com.au/news/allocation-announcements/current.asp. Historical announcements and forecasts can be sourced from http://g-mwater.com.au/news/allocation-announcements/archive.asp. Additionally, Goulburn-Murray Water publishes a seasonal allocation outlook prior to the start of each irrigation season providing a forecast for opening October and February allocations for the following season. The seasonal allocation outlooks are published on Goulburn-Murray Water’s website (see Media Releases http://www.g-mwater.com.au/news/media-releases). Note that in years with high water availability, only the seasonal allocation outlook may be prepared (i.e. water availability forecasts may not be provided with allocation announcements).

48 Environmental Water Delivery Koondrook-Perricoota Forest
1. Overview

Part 3: Monitoring evaluation
and improvement
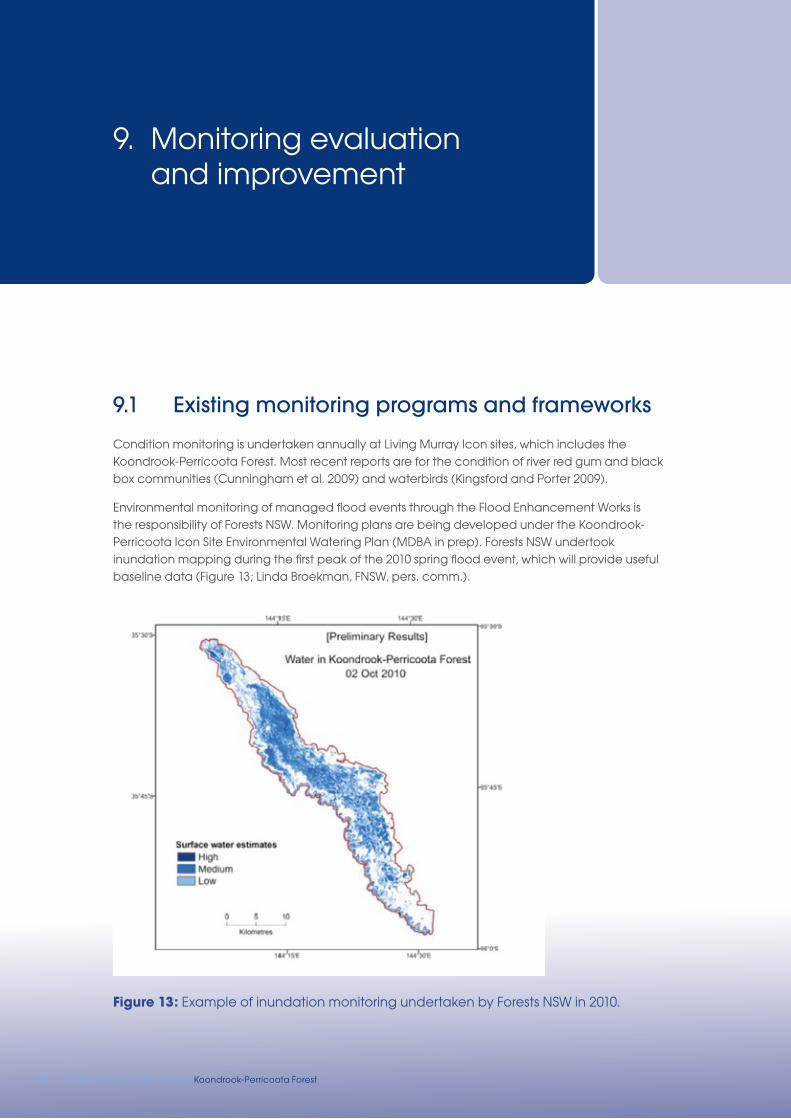
50 Environmental Water Delivery Koondrook-Perricoota Forest
9. Monitoring evaluation and improvement
9.1 Existing monitoring programs and frameworks
Condition monitoring is undertaken annually at Living Murray Icon sites, which includes the Koondrook-Perricoota Forest. Most recent reports are for the condition of river red gum and black box communities (Cunningham et al. 2009) and waterbirds (Kingsford and Porter 2009).
Environmental monitoring of managed flood events through the Flood Enhancement Works is the responsibility of Forests NSW. Monitoring plans are being developed under the Koondrook-Perricoota Icon Site Environmental Watering Plan (MDBA in prep). Forests NSW undertook inundation mapping during the first peak of the 2010 spring flood event, which will provide useful baseline data (Figure 13; Linda Broekman, FNSW, pers. comm.).
Figure 13: Example of inundation monitoring undertaken by Forests NSW in 2010.

51
9.1.1 Flow monitoring sitesThere are various measuring points for environmental water relevant to Koondrook-Perricoota Forest, as listed in Table 18. This includes a combination of streamflow monitoring along the Murray River and from the main tributaries downstream of Hume Dam, and flow and water level monitoring into and out of the forest. Real-time data is available at http://www.mdba.gov.au/water/live-river-data/yarrawonga-to-euston for main Murray River sites or in more detail at http://waterinfo.nsw.gov.au/. Historical data and maps of site locations are also available at http://www.dse.vic.gov.au/waterdata/.
Table 18: Flow monitoring in the Murray River near Koondrook-Perricoota Forest.
Site number
Site name relevance
409016 Murray River at Heywoods Flows from Hume Dam
402205 Kiewa River at Bandiana Flows from Kiewa River u/s Murray River
409017 Murray River at Doctors Point Flows in Murray River d/s Kiewa River
403241 Ovens River at Peechelba East Flows in Ovens River u/s Murray River
409025 Murray River d/s Yarrawonga Flows d/s Yarrawonga Weir
409006 Murray River at Picnic Point Flows through the Choke d/s Gulpa Ck
404210 Broken Creek at Rices Weir Flows from Broken Creek
409215 Murray River at Barmah Flows d/s of Barmah-Millewa Forest
405232 Goulburn River at McCoys Bridge Flows from Goulburn River
406202 Campaspe River at Rochester Flows from Campaspe River
409219 Murray River at Torrumbarry Weir Water level and volume in weir pool
409207 Murray River d/s Torrumbarry Weir Flows d/s Torrumbarry Weir
409209 Murray River at Cohuna Flows in Murray River mid-forest
409005 Murray River at Barham Murray River d/s of Gunbower Forest and upstream of Campbells Island
409044 Little Merran Creek at Franklings Bridge Flows in Merran Creek d/s of cutting that connects Merran Creek to the Murray River anabranch around Campbells Island
409214 Murray River at Pental Island Murray River d/s of Campbells Island
414200 A Murray River below Wakool Junction Flows out of the forest in the Wakool and Murray
409062 Wakool River and Gee Gee Bridge Flows out of the forest via Thule, Barbers, Cow and Calf Creeks

52 Environmental Water Delivery Koondrook-Perricoota Forest
Flow monitoring may also include sites in the forest after the construction of the Torrumbarry Cutting. Environmental water managers should update the above list of sites once the cutting has been constructed and new gauging stations have been established. State Water has indicated that during scheme operation they would expect to measure the following variables (FNSW 2010):
• Inflows through the inlet regulator.
• Outflows through Swan Lagoon, Thule Regulator, the Return Channel and the four downstream structures near Barbers Creek (either at the structures or downstream at Gonn Road).
• Pool level.
• Possibly inflow to the top of the pool.
The location of the proposed flow monitoring is shown in Figure 14.
Figure 14: Proposed Flow Monitoring (FNSW 2010).

53
9.2 operational water delivery monitoring
FNSW, State Water and OEH will provide a log of actions in any watering event to provide environmental flows. Environmental water managers should request that FNSW, State Water and OEH commence documentation of watering events as they occur and finalise documentation as soon as the watering event has been completed. The Commonwealth’s pro-forma for an operational monitoring report is contained in Appendix 2. This information can provide input into future environmental water delivery, as well as any applications for return flow credits to the NSW State Government.
9.3 Key parameters for monitoring and evaluating ecosystem response
Potential monitoring for the management of environmental water in the Koondrook-Perricoota Forest is summarised in Table 19.

54 Environmental Water Delivery Koondrook-Perricoota Forest 55
Tab
le 1
9: M
on
itorin
g p
lan
for e
nviro
nm
ent
al w
ate
r use
.
Eco
log
ica
l ob
jec
tive
sH
ypo
the
ses
Wa
ter
sce
na
rios
ind
ica
tor(
s)m
on
itorin
g s
ites
Fre
qu
en
cy
lin
kag
es
an
d re
spo
nsi
bili
ty
Ma
inta
in t
he
ext
en
t a
nd
en
ha
nc
e
co
nd
itio
n o
f aq
ua
tic v
eg
eta
tion
.P
rop
ose
d w
ate
ring
reg
ime
will
m
ain
tain
ext
en
t a
nd
imp
rove
c
on
diti
on
of a
qu
atic
ve
ge
tatio
n.
Extr
em
e d
ry,
Dry
, Me
dia
n,
We
t.
Ve
ge
tatio
n e
xte
nt
an
d c
om
mu
nit
y c
om
po
sitio
n.
Polla
cks
Sw
am
p, S
wa
n
Lag
oo
n, H
ors
esh
oe
La
go
on
.
Sea
son
ally
TLM
ico
n s
ite c
on
diti
on
mo
nito
ring
in
clu
de
s e
xte
nt
an
d c
om
po
sitio
n o
f u
nd
ers
tore
y ve
ge
tatio
n.
Ma
inta
in t
he
ext
en
t a
nd
en
ha
nc
e
co
nd
itio
n o
f riv
er r
ed
gu
m fo
rest
s a
nd
w
oo
dla
nd
s.
Reg
ula
r (tw
o to
five
ye
ar
fre
qu
en
cy)
inu
nd
atio
n o
f riv
er r
ed
g
um
fore
sts
will
ma
inta
in e
xte
nt
an
d m
ain
tain
/ im
pro
ve c
on
diti
on.
Extr
em
e d
ry,
Dry
, Me
dia
n,
We
t.
Exte
nt
an
d c
an
op
y c
on
diti
on
of fl
oo
dp
lain
fo
rest
s.
Koo
nd
roo
k-Pe
rric
oo
ta
Fore
st.
An
nu
ally
TLM
co
nd
itio
n m
on
itorin
g in
clu
de
s st
an
d c
on
diti
on
an
d v
eg
eta
tion
e
xte
nt
at
ico
n s
ites
inc
lud
ing
G
un
bo
we
r / K
oo
nd
roo
k-Pe
rric
oo
ta.
Ma
inta
in n
ativ
e fi
sh p
op
ula
tion
s b
y st
imu
latin
g b
ree
din
g a
nd
pro
vid
ing
c
on
ne
ctiv
ity
be
twe
en
flo
od
pla
in,
we
tlan
d a
nd
rive
r ha
bita
ts.
Sprin
g in
un
da
tion
of fl
oo
dp
lain
h
ab
itats
will
stim
ula
te fi
sh
spa
wn
ing
an
d re
cru
itme
nt.
Dry
, Me
dia
n,
We
t.Fi
sh s
pa
wn
ing
an
d
rec
ruitm
en
t.R
an
ge
of d
iffe
ren
t h
ab
itats
with
in t
he
fo
rest
s: s
tre
am
s (r
eg
ula
ted
an
d
un
reg
ula
ted
), w
etla
nd
s a
nd
flo
od
pla
in.
Eve
nt
driv
en
TLM
co
nd
itio
n m
on
itorin
g in
clu
de
s fis
h m
on
itorin
g a
t ic
on
site
s in
clu
din
g G
un
bo
we
r / K
oo
nd
roo
k-Pe
rric
oo
ta.
Sup
po
rt w
ate
rbird
bre
ed
ing
b
y p
rovi
sio
n o
f fe
ed
ing
an
d
ne
stin
g h
ab
itat.
Inu
nd
atio
n o
f we
tlan
ds
an
d
floo
dp
lain
s fo
r th
ree
to
fou
r m
on
ths
will
inst
iga
te s
uc
ce
ssfu
l w
ate
rbird
bre
ed
ing
.
Me
dia
n, W
et.
Ab
un
da
nc
e, n
est
c
ou
nts
, fle
dg
ling
su
cc
ess
.
Polla
cks
Sw
am
p,
bro
ad
er fl
oo
dp
lain
.Ev
en
t d
rive
nBo
th g
rou
nd
an
d a
eria
l su
rve
ys
are
inc
orp
ora
ted
into
TLM
ico
n s
ite
co
nd
itio
n m
on
itorin
g.
Pro
vid
e h
ab
itat
for a
qu
atic
fau
na
.P
rop
ose
d w
ate
r re
gim
e w
ill
pro
vid
e h
ab
itat
for a
qu
atic
fa
un
a.
Extr
em
e d
ry,
Dry
, Me
dia
n,
We
t.
Fro
g, t
urt
le a
nd
ya
bb
y su
rve
ys.
Ra
ng
e o
f diff
ere
nt
ha
bita
ts w
ithin
th
e
fore
sts:
str
ea
ms
(re
gu
late
d a
nd
u
nre
gu
late
d),
we
tlan
ds
an
d fl
oo
dp
lain
.
Eve
nt
driv
en
TLM
co
nd
itio
n m
on
itorin
g in
clu
de
s fr
og
an
d t
urt
le m
on
itorin
g a
t ic
on
site
s in
clu
din
g G
un
bo
we
r /
Koo
nd
roo
k-Pe
rric
oo
ta.
Pre
ven
t e
xce
ssiv
e b
uild
-up
of o
rga
nic
m
att
er o
n t
he
flo
od
pla
in s
urf
ac
e t
o
min
imis
e im
pa
cts
to
rec
eiv
ing
wa
ters
.
Re
sto
ring
an
ad
eq
ua
te
floo
dp
lain
inu
nd
atio
n re
gim
e
pre
ven
t e
xce
ss a
cc
um
ula
tion
o
f lit
ter a
nd
red
uc
e b
lac
kwa
ter
eve
nts
.
Me
dia
n, W
et.
Dis
solv
ed
oxy
ge
n
(DO
).Ef
flue
nt
stre
am
s a
nd
d
ow
nst
rea
m w
ate
rs:
Mu
rra
y a
nd
Wa
koo
l R
ive
rs.
DO
mo
nth
ly
du
ring
in
un
da
tion
DO
me
asu
red
by
NSW
Offi
ce
of
Wa
ter a
lga
l mo
nito
ring
pro
gra
m
an
d M
urr
ay
Riv
er S
yste
m S
ca
le
mo
nito
ring
.

54 Environmental Water Delivery Koondrook-Perricoota Forest 55
10. Opportunities
The watering actions proposed in this document use the Torrumbarry Cutting to deliver water to the forest, rather than relying on overbank flows. This reduces the volume of water required to be delivered, however large volumes of water are still needed. There may be potential for further works to be undertaken within the forest to re-distribute water within the forest, increasing the area watered and/or reducing the volume of water required. It may be suitable to investigate the potential for such works in the future.
Delivery to Campbells Island is not possible via existing flood enhancement works. There may be an opportunity to build infrastructure on the floodplain to deliver water to Campbells Island.
The risk of flooding downstream of the four outlet regulators flowing into Barbers Creek currently constrains the water releases to no more than 250 ML/d. This in turn places a constraint on the ability to deliver water through the Torrumbarry Cutting at the maximum flow rate for an extended duration. Forests NSW is currently looking into options to improve the conveyance along Barbers Creek so that higher flow rates can be released from the downstream regulators without flooding. These options include bypassing block banks (to achieve maximum releases up to around 500 ML/d) to providing alternative supplies to landholders so that the block banks can be removed (to achieve maximum releases of around 2,000–4,000 ML/d), as well as other potential measures. Improving the conveyance of outflows along Barbers Creek will help environmental water managers to achieve their ecological objectives, particularly for the designated wet year events.

56 Environmental Water Delivery Koondrook-Perricoota Forest
11. Bibliography
Baldwin D.S (2009). Knowledge Needs to Minimise Adverse Water Quality Events in the Edward-Wakool River System. A report to NSW Department of Energy and Water by The
Murray-Darling Freshwater Research Centre, Victoria.
CSIRO (2008). Water Availability in the Murray. A report to the Australian Government from the CSIRO Murray-Darling Basin Sustainable Yields Project. CSIRO, Canberra.
Cunningham S.C., Mac Nally R., Griffioen P. and White M (2009). Mapping the Condition of River Red Gum and Black Box Stands in The Living Murray Icon Sites. A Milestone Report to the Murray-Darling Basin Authority as part of Contract MD1114. Murray-Darling Basin Authority, Canberra.
DECCW (2010). Annual Environmental Water Plan – Interim Environmental Watering (AEW) Plan for the Murray Valley 2009/10. NSW Department of Environment, Climate Change and Water, Sydney.
FNSW (2008). Ecologically Sustainable Forest Management Plan Riverina NSW. Forests NSW, Department of Primary Industries, Beecroft.
FNSW (2009). Koondrook-Perricoota Flood Enhancement Work Preliminary Draft Operating Plan. Forests NSW, Department of Primary Industries, Beecroft.
FNSW, MDBC, DWE and DECC (2008). Koondrook-Perricoota Forest Flood Enhancement Works – Hydraulic Modelling. Department of Environment and Climate Change NSW, Sydney.
FNSW (2010). Koondrook-Perricoota Forest Flood Enhancement Works Monitoring Plan Framework Discussion Paper. Draft for development of specialist chapters, version at 25 November 2010. Forests NSW, Department of Primary Industries, Beecroft.
GHD (2010). Koondrook-Perricoota Forest Flood Enhancement Works Environmental Assessment. Prepared for NSW Office of Water and Forests NSW. Sydney.
Gilligan D, Vey M and Asmus M (2009). Identifying drought refuges in the Wakool system and assessing status of fish populations and water quality before, during and after the provision of environmental, stock and domestic flows. NSW Department of Primary Industries and the Murray-Darling Basin Authority.
Harrington B and Hale J (2011). Ecological Character Description of the NSW Central Murray State Forests Ramsar Site. A report to the Department of Sustainability, Environment, Water, Population and Communities, Canberra.

57
Kingsford R.T and Porter J.L (2009). Annual survey of waterbird communities of the Living Murray icon sites - November 2008. School of Biological, Earth and Environmental Sciences, University of NewSouth Wales. Report to Murray-Darling Basin Authority, Canberra.
Kumar Tuteja N (2007). Koondrook-Perricoota Forest Flood Enhancement Project – Hydraulic Modelling. The Living Murray, Department of Environment and Climate Change, Sydney.
Leslie D.J (2002). Ramsar Information Sheet for the NSW Central Murray State Forests. Forests NSW, Department of Primary Industries, Deniliquin.
MDBA (in prep). Koondrook-Perricoota Icon Site Environmental Water Management Plan.Murray-Darling Basin Authority, Canberra.
MDBA (in prep). Murray River System Operations Reference Manual: Torrumbarry Weir. Draft version at June 2010. Murray-Darling Basin Authority, Canberra.
MDBA (2010b). The Living Murray: Planned Works in the Koondrook-Perricoota Forest. Murray-Darling Basin Authority, Canberra.
NPA (2008). Ramsar Site in Danger: NSW Central Murray State Forests - Notification to the Australian Government and the Ramsar Convention Secretariat. National Parks Association of NSW, Sydney.
NRC (2009). Riverina Bioregion Regional Forest Assessment: River Red Gums and Woodland Forests. Natural Resources Commssion of NSW, Sydney.
Peter Cottingham & Associates and SKM (2011). Environmental Water Delivery: Lower Goulburn River. Prepared for Commonwealth Environmental Water, Department of Sustainability, Environment, Water, Population and Communities, Canberra.
Peter Cottingham & Associates and SKM (2011b). Environmental Water Delivery: Campaspe River. Prepared for Commonwealth Environmental Water, Department of Sustainability, Environment, Water, Population and Communities, Canberra.
Peter Cottingham & Associates and SKM (2011c). Environmental Water Delivery: Lower Broken Creek. Prepared for Commonwealth Environmental Water, Department of Sustainability, Environment, Water, Population and Communities, Canberra.
Stuart I.G. and Jones M (2002). Ecology and Management of Common Carp in the Barmah Millewa Forest. Arthur Rylah Institute for Environmental Research, Department of Sustainability and Environment, Melbourne, Australia.
Vennel D and Nias D (2005). Wetland Watering of Pollack Swamp Koondrook State Forest. A report prepared for the Murray Wetlands Working Group, NSW.
Webster R (2008). Quarterly Report: Summer bird monitoring within Gunbower-Perricoota-Koondrook Forest, a Living Murray Icon Site. Ecosurveys, Deniliquin.
Watkins S, Hladyz S, Whitworth K and Baldwin, D (2010). Understanding the relationship between low dissolved oxygen blackwater events and managed flows in the Edward-Wakool River system. MDFRC Publication 12/2010. Report prepared for the Murray Catchment Management Authority by The Murray-Darling Freshwater Research Centre, Victoria.

58 Environmental Water Delivery Koondrook-Perricoota Forest
Appendix 1: Significant flora and fauna
Significant species in the Koondrook-Perricoota Forest (GHD 2009).
Common name Scientific name EPBC Status tSa Status Presence
Australasian bittern Botaurus poiciloptilus Vulnerable Known to occur
Australian painted snipe Rostralula australis Endangered Endangered Likely
Barking owl Ninox connivens Vulnerable Known to occur
Black-chinned honeyeater
Melithreptus gularis gularis
Vulnerable Known to occur
Brown treecreeper Glossopsitta pusilla Vulnerable Known to occur
Bush stone-curlew Burhinus grallarius Endangered Known to occur
Caspian tern Sterna caspia Marine, Migratory Known to occur
Cattle egret Ardea ibis Marine, Migratory Known to occur
Common greenshank Tringa nebularia Marine, Migratory Known to occur
Diamond firetail Stagonopleura guttata Vulnerable Known to occur
Eastern great egret Ardea modesta Marine, Migratory Known to occur
Forked-tailed swift Apus pacificus Migratory Known to occur
Gilbert’s whistler Pachycephala inornata Vulnerable Known to occur
Glossy ibis Plegadis falcinellus Marine, Migratory Known to occur
Grey-crowned babbler Pomatostomus temporalis temporalis
Vulnerable Known to occur
Hooded robin Melanodryas cucullata Vulnerable Known to occur
Latham’s snipe Gallinago hardwickii Migratory Known to occur
Little lorikeet Glossopsitta pusilla Vulnerable Likely
Magpie goose Anseranas semipalmata Vulnerable Known to occur
Malleefowl Leipoa occelata Endangered Known to occur
Marsh sandpiper Tringa stagnatilis Marine, Migratory Known to occur
Plains-wanderer Pedionomus torquatus Vulnerable Endangered Known to occur
Red-necked stint Calidris ruficollis Marine, Migratory Known to occur
Regent honeyeater Xanthomyza phrygia Endangered Vulnerable Known to occur
Sharp-tailed sandpiper Calidris acuminata Marine, Migratory Known to occur

59
Common name Scientific name EPBC Status tSa Status Presence
Speckled warbler Pyrrholaemus saggitatus Vulnerable Known to occur
Superb parrot Polytelis swainsonii Vulnerable Vulnerable Likely
Swift parrot Lathamus discolor Endangered Vulnerable Likely
White-bellied sea eagle Haliaeetus leucogaster Marine, Migratory Known to occur
White-throated needletail Hirundapus caudacutus Migratory Known to occur
Murray cod Maccullochella peelii peelii
Vulnerable Vulnerable Known to occur
Macquarie perch Macquaria australasica Endangered Endangered Likely
Little pied bat Chalinolobus picatus Vulnerable Known to occur
Spotted-tailed quoll Dasyurus maculatus Endangered Vulnerable Likely
Large-footed Myotis Myotis adversus Vulnerable Known to occur
Eastern long-eared bat Nyctophilus timoriensis Vulnerable Vulnerable Likely
Squirrel glider Petaurus norfolcensis Vulnerable Known to occur
Brush-tailed phascogale Phascogale tapoatafa Vulnerable Known to occur
Koala Phascolarctos cinereus Vulnerable Known to occur
Yellow-bellied sheathtail bat
Saccolaimus flaviventris Vulnerable Known to occur
Floating swamp wallaby-grass
Amphibromus fluitans Vulnerable Vulnerable Known to occur
A spear-grass Austrostipa wakoolica Endangered Vulnerable Likely
Winged peppercress Lepidium monoplocoides Endangered Endangered Likely
Slender darling pea Swainson murrayana Vulnerable Likely
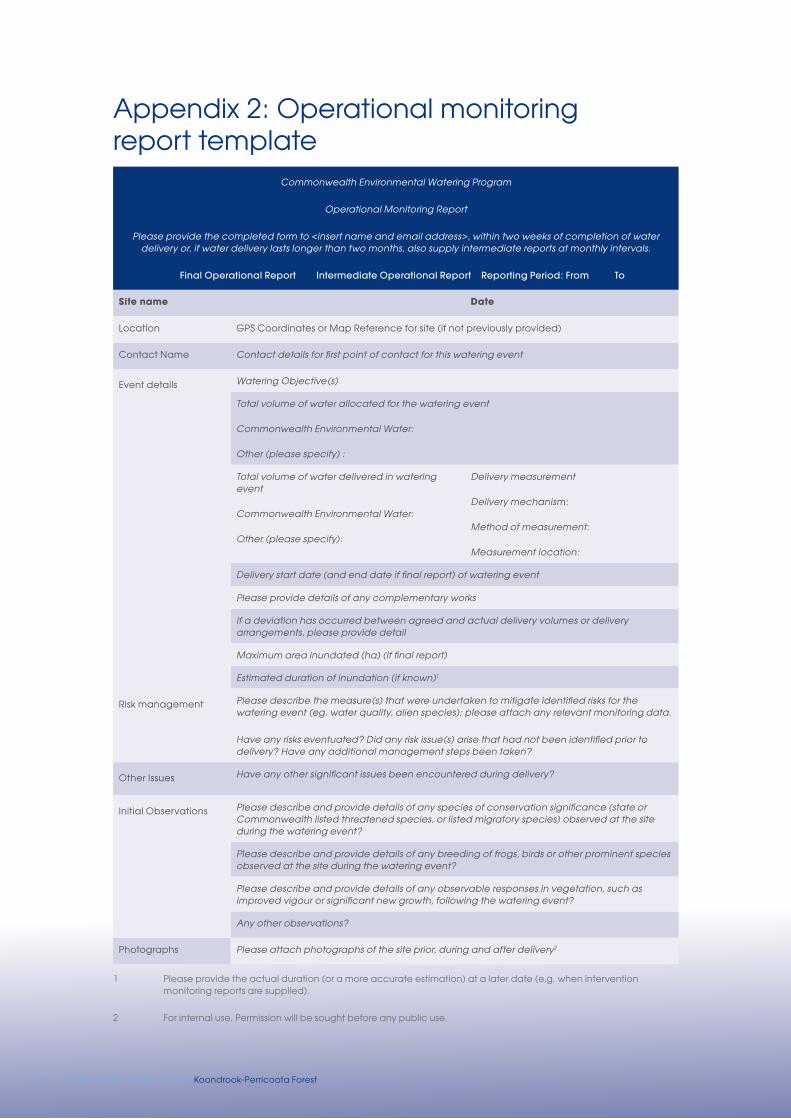
60 Environmental Water Delivery Koondrook-Perricoota Forest
Appendix 2: Operational monitoring report template
Commonwealth Environmental Watering Program
Operational Monitoring Report
Please provide the completed form to <insert name and email address>, within two weeks of completion of water delivery or, if water delivery lasts longer than two months, also supply intermediate reports at monthly intervals.
Final operational report intermediate operational report reporting Period: From to
Site name Date
Location GPS Coordinates or Map Reference for site (if not previously provided)
Contact Name Contact details for first point of contact for this watering event
Event details Watering Objective(s)
Total volume of water allocated for the watering event
Commonwealth Environmental Water:
Other (please specify) :
Total volume of water delivered in watering event
Commonwealth Environmental Water:
Other (please specify):
Delivery measurement
Delivery mechanism:
Method of measurement:
Measurement location:
Delivery start date (and end date if final report) of watering event
Please provide details of any complementary works
If a deviation has occurred between agreed and actual delivery volumes or delivery arrangements, please provide detail
Maximum area inundated (ha) (if final report)
Estimated duration of inundation (if known)1
Risk management Please describe the measure(s) that were undertaken to mitigate identified risks for the watering event (eg. water quality, alien species); please attach any relevant monitoring data.
Have any risks eventuated? Did any risk issue(s) arise that had not been identified prior to delivery? Have any additional management steps been taken?
Other Issues Have any other significant issues been encountered during delivery?
Initial Observations Please describe and provide details of any species of conservation significance (state or Commonwealth listed threatened species, or listed migratory species) observed at the site during the watering event?
Please describe and provide details of any breeding of frogs, birds or other prominent species observed at the site during the watering event?
Please describe and provide details of any observable responses in vegetation, such as improved vigour or significant new growth, following the watering event?
Any other observations?
Photographs Please attach photographs of the site prior, during and after delivery2
1 Please provide the actual duration (or a more accurate estimation) at a later date (e.g. when intervention monitoring reports are supplied).
2 For internal use. Permission will be sought before any public use.

61
Appendix 3: Baseline streamflows at key locations
Streamflows (ML/d) for the Murray River downstream of Hume Dam (1895–2009).
month very dry year
(minimum on record)
Dry Year
(30th percentile daily flow)
median year
(50th percentile daily flow)
Wet year
(70th percentile daily flow)
Jul 629 629 629 629
Aug 629 629 629 9,713
Sep 650 650 7,234 16,595
Oct 629 11,115 16,375 21,273
Nov 650 13,865 17,720 21,677
Dec 629 15,467 18,222 20,536
Jan 3,468 17,043 18,937 20,638
Feb 696 14,717 16,877 18,429
Mar 533 14,895 17,811 20,221
Apr 569 7,725 11,103 13,734
May 629 629 1,644 3,790
Jun 650 650 650 686

62 Environmental Water Delivery Koondrook-Perricoota Forest
Streamflows (ML/d) for the Kiewa River at Bandiana (1895–2009).
month very dry year
(minimum on record)
Dry Year
(30th percentile daily flow)
median year
(50th percentile daily flow)
Wet year
(70th percentile daily flow)
Jul 381 1,319 1,879 2,881
Aug 324 1,657 2,481 3,369
Sep 367 2,523 3,081 4,344
Oct 115 2,507 3,392 4,316
Nov 48 1,196 1,775 2,708
Dec 0 632 842 1,268
Jan 0 631 453 690
Feb 0 217 345 479
Mar 0 193 310 482
Apr 18 282 426 630
May 0 552 721 1,128
Jun 179 852 1,336 2,084
Streamflows (ML/d) for the Murray River at Doctors Point (1895–2009).
month very dry year
(minimum on record)
Dry Year
(30th percentile daily flow)
median year
(50th percentile daily flow)
Wet year
(70th percentile daily flow)
Jul 1,172 2,114 2,963 4,247
Aug 1,241 3,268 5,066 11,053
Sep 1,661 5,295 9,680 18,828
Oct 2,633 13,981 18,819 24,980
Nov 2,063 15,663 19,453 23,705
Dec 1,877 16,517 18,980 21,234
Jan 5,263 17,641 19,350 21,018
Feb 2,633 15,116 17,091 18,648
Mar 648 15,223 18,149 20,387
Apr 667 8,270 11,565 14,112
May 1,142 1,787 2,962 4,431
Jun 1,168 1,733 2,309 3,576

63
Streamflows (ML/d) for the Ovens River at Peechelba East (1895–2009).
month very dry year
(minimum on record)
Dry Year
(30th percentile daily flow)
median year
(50th percentile daily flow)
Wet year
(70th percentile daily flow)
Jul 137 3,278 5,543 9,738
Aug 222 5,105 8,160 12,803
Sep 162 5,112 7,889 11,224
Oct 10 3,363 5,755 8,842
Nov 9 1,918 3,094 4,794
Dec 0 947 1,487 2,424
Jan 0 214 563 1,172
Feb 0 140 222 662
Mar 0 136 171 551
Apr 0 144 254 830
May 0 573 1,218 2,191
Jun 2 1,357 2,769 5,080
Streamflows (ML/d) for the Murray River downstream of Yarrawonga Weir (1895–2009).
month very dry year
(minimum on record)
Dry Year
(30th percentile daily flow)
median year
(50th percentile daily flow)
Wet year
(70th percentile daily flow)
Jul 1,806 5,505 8,538 14,718
Aug 1,953 7,902 12,706 20,080
Sep 1,906 8,379 13,202 25,360
Oct 3,018 10,308 13,919 20,499
Nov 1,800 11,454 15,210 17,785
Dec 1,806 10,600 11,236 12,903
Jan 3,044 8,891 10,339 10,600
Feb 1,786 8,126 8,921 9,910
Mar 3,209 8,920 9,660 10,506
Apr 1,800 7,033 8,619 9,926
May 1,806 2,991 4,204 5,866
Jun 1,800 3,236 4,973 8,463

64 Environmental Water Delivery Koondrook-Perricoota Forest
Streamflows (ML/d) for the Murray River at Barmah (1895–2009).
month very dry year
(minimum on record)
Dry Year
(30th percentile daily flow)
median year
(50th percentile daily flow)
Wet year
(70th percentile daily flow)
Jul 1,541 4,699 6,841 10,267
Aug 1,876 6,550 9,378 13,552
Sep 2,183 7,690 10,965 16,416
Oct 2,181 8,070 10,438 16,653
Nov 3,051 9,148 10,885 13,242
Dec 3,364 8,198 9,025 10,143
Jan 3,767 7,221 7,898 8,251
Feb 4,119 6,352 7,001 7,804
Mar 3,331 6,811 7,370 7,962
Apr 2,290 6,496 7,554 8,371
May 1,747 3,440 4,609 6,226
Jun 1,548 2,796 3,916 6,582
Streamflows (ML/d) for Broken Creek at Rices Weir (1895–2009).
month very dry year
(minimum on record)
Dry Year
(30th percentile daily flow)
median year
(50th percentile daily flow)
Wet year
(70th percentile daily flow)
Jul 0 75 176 358
Aug 0 248 340 450
Sep 0 646 606 836
Oct 0 159 428 965
Nov 0 155 417 851
Dec 0 246 311 416
Jan 0 220 274 356
Feb 0 286 343 404
Mar 0 242 302 406
Apr 0 396 469 582
May 3 426 484 585
Jun 0 58 133 233

65
Streamflows (ML/d) for the Goulburn River at McCoys Bridge (1895–2009).
month very dry year
(minimum on record)
Dry Year
(30th percentile daily flow)
median year
(50th percentile daily flow)
Wet year
(70th percentile daily flow)
Jul 344 1,094 2,874 7,533
Aug 195 2,448 5,838 11,457
Sep 135 2,307 4,570 9,394
Oct 332 1,256 2,327 4,374
Nov 428 985 1,511 2,609
Dec 830 1,500 1,674 2,337
Jan 374 1,514 1,606 1,747
Feb 204 1,547 1,624 1,741
Mar 330 408 452 654
Apr 256 416 528 734
May 350 350 464 796
Jun 350 544 859 2,348
Streamflows (ML/d) for the Campaspe River at Rochester (1895–2009).
month very dry year
(minimum on record)
Dry Year
(30th percentile daily flow)
median year
(50th percentile daily flow)
Wet year
(70th percentile daily flow)
Jul 0 67 122 325
Aug 0 88 211 640
Sep 0 70 196 740
Oct 0 69 74 174
Nov 0 38 70 70
Dec 0 32 43 70
Jan 0 27 35 51
Feb 0 20 35 66
Mar 0 16 35 61
Apr 0 18 35 59
May 0 35 35 70
Jun 0 35 70 145

66 Environmental Water Delivery Koondrook-Perricoota Forest
Streamflows (ML/d) for the Murray River downstream of Torrumbarry Weir (1895–2009).
month very dry year
(minimum on record)
Dry Year
(30th percentile daily flow)
median year
(50th percentile daily flow)
Wet year
(70th percentile daily flow)
Jul 1,752 6,073 9,271 18,278
Aug 245 6,924 13,124 24,475
Sep 2,118 7,938 15,286 26,881
Oct 2,113 6,375 10,322 19,228
Nov 1,659 6,601 8,873 12,869
Dec 1,913 6,458 7,919 9,562
Jan 2,548 5,173 5,777 6,516
Feb 2,573 4,860 5,677 6,441
Mar 2,118 3,700 4,311 4,781
Apr 1,880 4,398 5,413 6,572
May 1,537 3,849 4,898 6,851
Jun 1,902 3,642 5,236 9,075
Streamflows (ML/d) for the Loddon River downstream of Kerang Weir (1895–2009).
month very dry year
(minimum on record)
Dry Year
(30th percentile daily flow)
median year
(50th percentile daily flow)
Wet year
(70th percentile daily flow)
Jul 0 154 232 468
Aug 0 236 484 870
Sep 0 420 628 987
Oct 0 255 464 814
Nov 0 224 332 476
Dec 0 23 95 135
Jan 0 143 172 226
Feb 22 154 186 234
Mar 0 114 130 146
Apr 0 150 210 325
May 24 502 529 751
Jun 0 168 198 316

67
Streamflows (ML/d) for the Murray River at Barham 1895–2009).
month very dry year
(minimum on record)
Dry Year
(30th percentile daily flow)
median year
(50th percentile daily flow)
Wet year
(70th percentile daily flow)
Jul 1,842 5,929 8,970 16,066
Aug 426 6,842 12,862 17,591
Sep 1,939 7,824 14,985 17,905
Oct 2,103 6,207 10,220 16,264
Nov 2,262 6,384 8,709 12,705
Dec 2,589 6,196 7,764 9,396
Jan 2,284 4,894 5,495 6,270
Feb 2,473 4,607 5,403 6,118
Mar 2,260 3,503 4,083 4,589
Apr 2,007 4,210 5,158 6,257
May 1,678 3,894 4,955 6,823
Jun 1,943 3,588 4,957 8,613
Streamflows (ML/d) for the Murray River at Pental Island 1895–2009).
month very dry year
(minimum on record)
Dry Year
(30th percentile daily flow)
median year
(50th percentile daily flow)
Wet year
(70th percentile daily flow)
Jul 1,735 5,975 9,368 13,185
Aug 1,148 7,143 11,512 14,779
Sep 1,862 8,680 12,369 15,235
Oct 1,674 6,606 10,598 14,036
Nov 1,961 6,668 9,167 11,496
Dec 2,190 5,812 7,448 9,255
Jan 2,196 4,688 5,322 6,089
Feb 2,236 4,294 5,066 5,810
Mar 1,891 3,207 3,671 4,250
Apr 2,006 4,211 5,154 6,433
May 1,982 4,711 5,773 7,680
Jun 1,793 3,718 4,970 8,813

68 Environmental Water Delivery Koondrook-Perricoota Forest
Appendix 4: Risk assessment frameworkAlmost certain Is expected to occur in most circumstances
Likely Will probably occur in most circumstances
Possible Could occur at some time
Unlikely Not expected to occur
Rare May occur in exceptional circumstances only
Environmental People Property operational
Critical Irreversible damage to the environmental values of an aquatic ecosystem and/or connected waters/other parts of the environment; localised species extinction; permanent loss of water supplies.
Death, life threatening injuries or severe trauma.
Serious injury or isolated instances of trauma causing hospitalisation or multiple medical treatment cases.
Sustained and significant public inconvenience.
Severe or major damage to private property.
Significant damage to a number of private properties.
Critical or major damage to public infrastructure.
Predicted water loss will prevent the achievement of planned outcomes of the watering event).
Major Long-term damage to environmental values and/or connected waters/other parts of the environment; significant impacts on listed species; significant impacts on water supplies.
Minor injury/ trauma or First Aid Treatment Case.
Injuries/instances of trauma or ailments not requiring treatment.
Sustained public inconvenience.
Isolated but significant economic and/or social impact.
Damage to private property.
Some damage to public infrastructure.
Predicted waterloss will significantly detract from the planned outcomes of the watering event).
Moderate Short-term damage to environmental values and/or connected waters/other parts of the environment; short-term impacts on species.
Short term public inconvenience.
No injuries.
Minor economic and/or social impact contained to small number of individuals.
Predicted transmission loss will moderately detract from the planned outcomes of the watering event.
Minor Localised short-term damage to environmental values and/or connected waters/other parts of the environment; temporary loss of water supplies.
Minor public inconvenience.
No injuries.
No economic impacts.
Minor public inconvenience.
A small amount of water will be lost and this will have a small impact on the environmental outcomes.
Insignificant Negligible impact on environmental values and/or connected waters/other parts of the environment; no detectable impacts on species.
No public inconvenience.
No injuries.
No impacts on private property.
No infrastructure damage.
Water loss will be minimal and will not affect the planned outcomes of the watering event.
.

69
liKEliHooD ConSEQUEnCE
insignificant minor moderate major Critical
Almost certain Low Medium High Severe Severe
Likely Low Medium Medium High Severe
Possible Low Low Medium High Severe
Unlikely Low Low Low Medium High
Rare Low Low Low Medium High

70 Environmental Water Delivery Koondrook-Perricoota ForestWat090.0211