ep187-2015-cr-md4- xpn core sampling report
TRANSCRIPT

IMPERIAL OIL & GAS PTY LTD Australian Office
Level 7, 151 Macquarie Street Sydney NSW 2000 Australia
T: +61 2 9251 1846 F: +61 2 9251 0244
EP187-2015-CR-MD4- XPN
Core Sampling Report
Well: MD4
McArthur Basin
Northern Territory, Australia
Document Number EP187-2015-CR-MD4- XPN
Signature of approved person:
______________________________________
Geoffrey Hokin MSc(Hons) Geology
Principal Advisor Exploration & Operations
Rev Status Prepared by issued By Date
0 Final Geoff Hokin Geoff Hokin 17-09-2015

EP187-2015-CR-MD4- XPN 2
Contents
INTRODUCTION ........................................................................................................................................... 3
SAMPLING SUMMARY AND GENERAL DATA ....................................................................................................... 4
GEOCHEMICAL ANALYSIS ............................................................................................................................... 5
SAMPLE PREPARATION .................................................................................................................................. 5
ANALYTICAL METHODOLOGY (TOC, SRA,GC-MS) ............................................................................................ 5
INORGANIC SEDIMENT ANALYSES .................................................................................................................... 6
RESULTS ..................................................................................................................................................... 6
REFERENCES: ............................................................................................................................................ 30
List of Tables
TABLE 1: OVERVIEW OF MD4 SAMPLE LITHOLOGY ............................................................................................ 7
TABLE 2: LITHOLOGY LOG OF MD4 ................................................................................................................ 8
TABLE 3: RESULTS OF TOC/SRA ANALYSIS .................................................................................................... 13
TABLE 4: CALCULATION OF PETROLEUM POTENTIAL ........................................................................................ 13
TABLE 5: XRF ANALYSIS RESULTS .................................................................................................................. 14
TABLE 6: XRD MINERALOGY RESULTS ............................................................................................................ 14
TABLE 7: CONCENTRATION OF MAJOR ELEMENTS (AS WT%) ............................................................................. 15
TABLE 8: ICP ELEMENT ANALYSES RESULTS .................................................................................................... 16
TABLE 9: RARE EARTH ELEMENTS ANALYSIS .................................................................................................... 17
List of Figures
FIGURE 1: GEOCHEMICAL LOG ..................................................................................................................... 18
FIGURE 2: KEROGEN QUALITY PLOT ............................................................................................................... 19
FIGURE 3: KEROGEN TYPE AND MATURITY ...................................................................................................... 20
FIGURE 4: KEROGEN CONVERSION AND MATURITY ........................................................................................... 21
QUANTITATIVE XRD................................................................................................................................... 22
PYROLYSIS DATA ........................................................................................................................................ 24
EP187-2015-CR-MD4- XPN 3
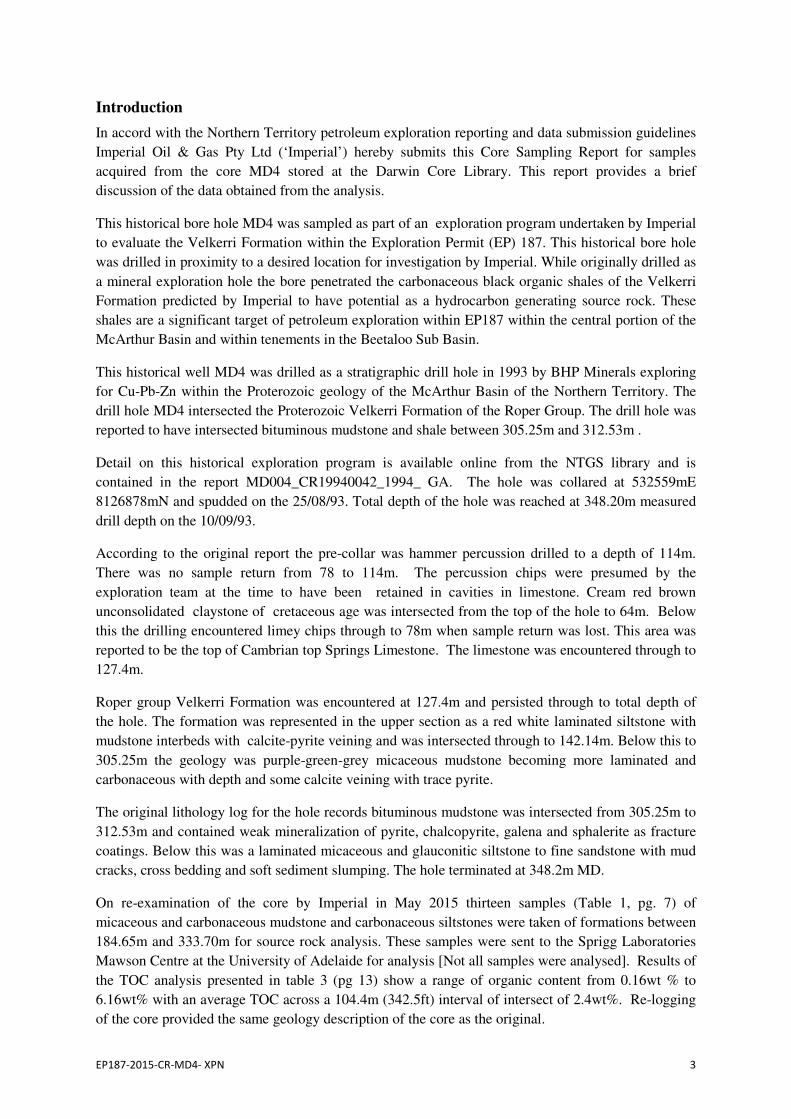
Introduction
In accord with the Northern Territory petroleum exploration reporting and data submission guidelines
Imperial Oil & Gas Pty Ltd (‘Imperial’) hereby submits this Core Sampling Report for samples
acquired from the core MD4 stored at the Darwin Core Library. This report provides a brief
discussion of the data obtained from the analysis.
This historical bore hole MD4 was sampled as part of an exploration program undertaken by Imperial
to evaluate the Velkerri Formation within the Exploration Permit (EP) 187. This historical bore hole
was drilled in proximity to a desired location for investigation by Imperial. While originally drilled as
a mineral exploration hole the bore penetrated the carbonaceous black organic shales of the Velkerri
Formation predicted by Imperial to have potential as a hydrocarbon generating source rock. These
shales are a significant target of petroleum exploration within EP187 within the central portion of the
McArthur Basin and within tenements in the Beetaloo Sub Basin.
This historical well MD4 was drilled as a stratigraphic drill hole in 1993 by BHP Minerals exploring
for Cu-Pb-Zn within the Proterozoic geology of the McArthur Basin of the Northern Territory. The
drill hole MD4 intersected the Proterozoic Velkerri Formation of the Roper Group. The drill hole was
reported to have intersected bituminous mudstone and shale between 305.25m and 312.53m .
Detail on this historical exploration program is available online from the NTGS library and is
contained in the report MD004_CR19940042_1994_ GA. The hole was collared at 532559mE
8126878mN and spudded on the 25/08/93. Total depth of the hole was reached at 348.20m measured
drill depth on the 10/09/93.
According to the original report the pre-collar was hammer percussion drilled to a depth of 114m.
There was no sample return from 78 to 114m. The percussion chips were presumed by the
exploration team at the time to have been retained in cavities in limestone. Cream red brown
unconsolidated claystone of cretaceous age was intersected from the top of the hole to 64m. Below
this the drilling encountered limey chips through to 78m when sample return was lost. This area was
reported to be the top of Cambrian top Springs Limestone. The limestone was encountered through to
127.4m.
Roper group Velkerri Formation was encountered at 127.4m and persisted through to total depth of
the hole. The formation was represented in the upper section as a red white laminated siltstone with
mudstone interbeds with calcite-pyrite veining and was intersected through to 142.14m. Below this to
305.25m the geology was purple-green-grey micaceous mudstone becoming more laminated and
carbonaceous with depth and some calcite veining with trace pyrite.
The original lithology log for the hole records bituminous mudstone was intersected from 305.25m to
312.53m and contained weak mineralization of pyrite, chalcopyrite, galena and sphalerite as fracture
coatings. Below this was a laminated micaceous and glauconitic siltstone to fine sandstone with mud
cracks, cross bedding and soft sediment slumping. The hole terminated at 348.2m MD.
On re-examination of the core by Imperial in May 2015 thirteen samples (Table 1, pg. 7) of
micaceous and carbonaceous mudstone and carbonaceous siltstones were taken of formations between
184.65m and 333.70m for source rock analysis. These samples were sent to the Sprigg Laboratories
Mawson Centre at the University of Adelaide for analysis [Not all samples were analysed]. Results of
the TOC analysis presented in table 3 (pg 13) show a range of organic content from 0.16wt % to
6.16wt% with an average TOC across a 104.4m (342.5ft) interval of intersect of 2.4wt%. Re-logging
of the core provided the same geology description of the core as the original.

EP187-2015-CR-MD4- XPN 4
Sampling Summary and General Data
Sampler: Geoff Hokin
On behalf of: Imperial Oil & Gas Pty Ltd
Address: Level 7, 151 Macquarie Street, Sydney, NSW 2000
Main office number: +61 2 9251 1846
Current permit: EP187
Field: Carpentaria Downs
Prospect/Location name: Mangala/OT Downs
1:250K Map Sheet Name: Bauhinia Downs
1:100K Map Sheet Name: Bloodwood Creek
Well name: MD4
Well location: 0532 559mE 812 6878mN. (GDA94 Zone 53K)
Ref. Report Number WCR: CR19940042_1994_GA
Coredat ID: 84
Tenement at the time: EL 7450
Drilled by: BHP Minerals Pty Ltd
Spud date: 25-08-1993
TD date: 10-09-1993
Duration: 17 days
TD: 348.20 m
Inclination: - 90
Azimuth: N/a
Core Location: Darwin
Sampling allowed Yes
Cutting available: No
Hylogged: No

EP187-2015-CR-MD4- XPN 5
Geochemical Analysis
Thirteen MD4 core samples were taken from the core and of these eleven samples were selected for
source rock analysis and geochemical characterisation. A range of analyses were conducted on these
samples. Sample preparation and analyses were conducted by the Sprigg Research Laboratories at the
University of Adelaide. The sample preparation and analytical methods utilized by the lab are outlined
below. This information is supplied by Dr Tony Hall of the Sprigg Research Laboratory at the
University of Adelaide.
Sample preparation
The study used cored cutting samples collected from the MD4 core held at the Darwin NTGS library.
This core was recovered from the well drilled in the Bauhinia/Carpentaria Downs region within the
central McArthur Basin in the Upper McArthur River catchment area of the Northern Territory.
Samples (Table 1) were taken of the prospective carbonaceous micaceous mudstones, siltstones and
shales recovered within the core and identified as samples 351323 to 351333. While all samples were
lithologically logged not all samples were sent for analysis. The samples sent for analysis were
chosen to investigate the Velkerri Formation. All samples were selected to be representative of the
differing zones of interest exhibited through the core sections. Prior to analysis all samples selected
for further investigation were cleaned, dried for ≥ 24 hrs at 400 C and ground using a tungsten carbide
ring mill to <120um. Samples were washed, dried and cut into appropriate sections for SEM stub
mounting preparation.
Analytical Methodology (TOC, SRA,GC-MS)
Total carbon (TC) content for each sample was measured in a Perkin Elmer 2400 Series II CHNS
analyzer. Inorganic carbon (IC) content was determined using the pressure-calcimeter acidification
method of Sherrod et al. (Sherrod et al., 2002). TOC content was calculated by difference (TOC=TC-
IC).
Total petroleum hydrocarbon analyses (TPH) were conducted using a Source Rock Analyser (SRA
TPH) Workstation, (Weatherford Laboratories Instruments Division), this is equivalent to the ‘Rock-
eval’ analytical instrumentation. The sample is purged in Helium prior to being raised into a
desorption furnace at 300oC for 3 minutes which releases the free hydrocarbon, or S1, fraction. The
sample is then pyrolysed by heating at a 25oC/minute ramp to 600
oC to generate the potential
hydrocarbon, or S2, fraction. Detection of released hydrocarbons is conducted by flame ionization
detection(FID) and quantification is conducted by calibration against a certified reference material of
known S1& S2 response.
Thermal maturity and hydrocarbon potential (S1 & S2) of each sample was determined by pyrolysis
using a Weatherford Instruments Source Rock Analyser. Thermal maturity was estimated using the
method of Jarvie et al. (2005), which relates measured Tmax to calculated vitrinite reflectance using
the following relationship: calculated %Ro =0.0180×Tmax −7.16. Based on the TPH data collected by
SRA a sub-suite of samples were identified for further characterization of the organic matter (OM)
fractions by mass spectrometry. Both the S1 & S2 fractions of each sample were evolved by thermal
and pyrolytic extraction respectively.
Thermal extraction gas chromatography mass spectrometry(GC-MS) screening was conducted using
micro scale sealed vessels (MSSV) to characterize OM present within the samples. Between 5 &
10mg of sample was transferred to the MSSV reaction vessel and extracted at 300oC for 1 hour. GC-
MS was run with a temperature program of 50oC held for 1 min ramped at 8
oC/Min to 300
oC and
held for 17 mins. Analysis was undertaken using a Quantum MSSV injector fitted to a Hewlett
Packard 6890/5973 GC-MS system and was analysed under standard extraction parameters,(see Hall
et al.(1999) and Hall et al.(2011).
Mineralogy was determined by XRD analysis conducted qualitatively using a Bruker D8 ADVANCE
Powder X-ray Diffractometer with a Cu-radiation source. Data was processed using Bruker

EP187-2015-CR-MD4- XPN 6
DIFFRAC.EVA software and Crystallography Open Database reference patterns for identifying
mineral phases. Major component quantification was conducted by XRF with quantification reported
following ignition. Trace & REE quantification was conducted by whole rock digestion and ICPMS
elemental detection using an Agilent 7500cs with ORS for Solution ICP Analysis.
Inorganic sediment analyses
Mineralogy was determined from randomly orientated bulk powder samples, using X-ray diffraction
(XRD; Bruker D8 Advance XRD with Cu source). Samples were scanned between 3.50 - 50
02Ɵ using
a 0.02 step size and 1s dwell time. Mineral phases were identified in the Diffrac.Eva software
package using reference patterns from the Open Crystallography Database. Clay mineralogy was
determined on orientated preparations of the <5µm fraction and prepared as per Moore and Reynolds
(1997).
Results
Bore hole MD4 Total organic carbon (TOC) analysis results (Table 3) and the (figure 1) geochemical
log organic richness indicate that samples 351326 through to 351332 all have good to very good
levels of organic matter. The TOC levels of these samples range from 1.76% through to a maximum
in the samples of 6.16% with an average of 3.65%. These optimum samples lie over an interval of 7.2
m (approx. 24 ft). Samples 351323, 351324, 351325 and 351333 all have TOC less than the minimum
cut off point of 0.5wt% predicted to be suitable for reasonable hydrocarbon generation. These samples
report TOC of 0.16% to 0.29% and contain hydrocarbon indices (HI) indicative of petroleum
generation. The eleven samples analysed represent an interval of 104.4m (342.5 ft) with an average
TOC of 2.40%.
The figure 2 Kerogen quality plot of TOC to remaining hydrocarbon production potential indicates
that the kerogen is type III gas prone. This is consistent with the results obtained from earlier research
of samples obtained from the Velkerri in other areas of the basin and consistent with the work of
Crick, I. H., Boreham, C. J., Cook, A.C., & Powell. T.G. 1988. The predicted age of the formation
suggests that the organic material source would be lamalginite (Adelaide Research & Innovation Pty
Ltd. 2013.; Holman A.I., Grice K., Jaraula C.M.B., Schimmelmann A. (2014); Korth j. 1987; Page,
R.W. and Sweet, I.P. 1998.).
The analysis of the major elements presented in Table 5 when compared to the average shale (AS)
values of Wedepohl (1971, 1991a, 1991b) and Condie (1993) and to the post Archean Australian
shale standard (PAAS) averages indicates a significant number of differences in the MD4 shale
composition. When the MD4 results are compared in conjunction with the results of analysis
obtained from the core hole 82/1 against the shale overages of Wedepohl and the PAAS (Table 7) it
can be observed that the calcium oxide levels of these samples is one tenth that of the standard
averages while the sodium oxide values are one tenth to one half that of the standards.
While silica contents of the MD4 shales are generally in line with the AS and the PAAS they are
somewhat higher overall. Significantly the XRF analysis also suggests a high clay content while the
titanium oxide contents are in line with the AS they are three quarters of the values expressed in the
PAAS.

EP187-2015-CR-MD4- XPN 7
Table 1: Overview of MD4 sample lithology
Sample
number
depth
[mMD] Lithology
351323 229.3 Mudstone, grey white, carbonaceous and micaceous, pyritic, white
carbonate fracture fill/vein.
351324 244.9 Mudstone, grey green, dolomitic with minor siltstone and sandstone
laminae and carbonaceous laminations. Minor carbonaceous veining.
351325 288.8
Mudstone micaceous, grey green, with minor glassy mudstone laminae
veins. Moderate carbonaceous laminations, crumbles on drying, minor
carbonate veining with minor interbedded dolomitic siltstone.
351326 304.7 Mudstone micaceous, with mudstone glassy laminae, light green, with
moderate carbonaceous laminations.
351327 305.4 Mudstone glossy, black, laminated, friable, pyritic with chalcopyrite, galena
and sphalerite. Bituminous paint style mineralisation, crumbles on drying.
351328 306.7 Mudstone glossy, black, laminated, friable, pyritic with chalcopyrite, galena
and sphalerite. Bituminous; paint style mineralisation, crumbles on drying.
351329 307.7 Mudstone glossy, black, laminated, friable, pyritic with chalcopyrite, galena
and sphalerite. Bituminous; paint style mineralisation, crumbles on drying.
351330 308.5 Mudstone glossy, black, laminated, friable, pyritic with chalcopyrite, galena
and sphalerite. Bituminous; paint style mineralisation, crumbles on drying.
351331 311.1 Mudstone glossy, black, laminated, friable, pyritic with chalcopyrite, galena
and sphalerite. Bituminous; paint style mineralisation, crumbles on drying.
351332 311.9 Mudstone glossy, black, laminated, friable, pyritic with chalcopyrite, galena
and sphalerite. Bituminous; paint style mineralisation, crumbles on drying.
351333 333.7 Mudstone carbonaceous with interbeds of mudstone, grey white, pyritic.
Laminated and wispy mudstone with veins (?) or carb dolomite bed.
Note: Sample depths reported have not been corrected for loggers depth.

EP187-2015-CR-MD4- XPN 8
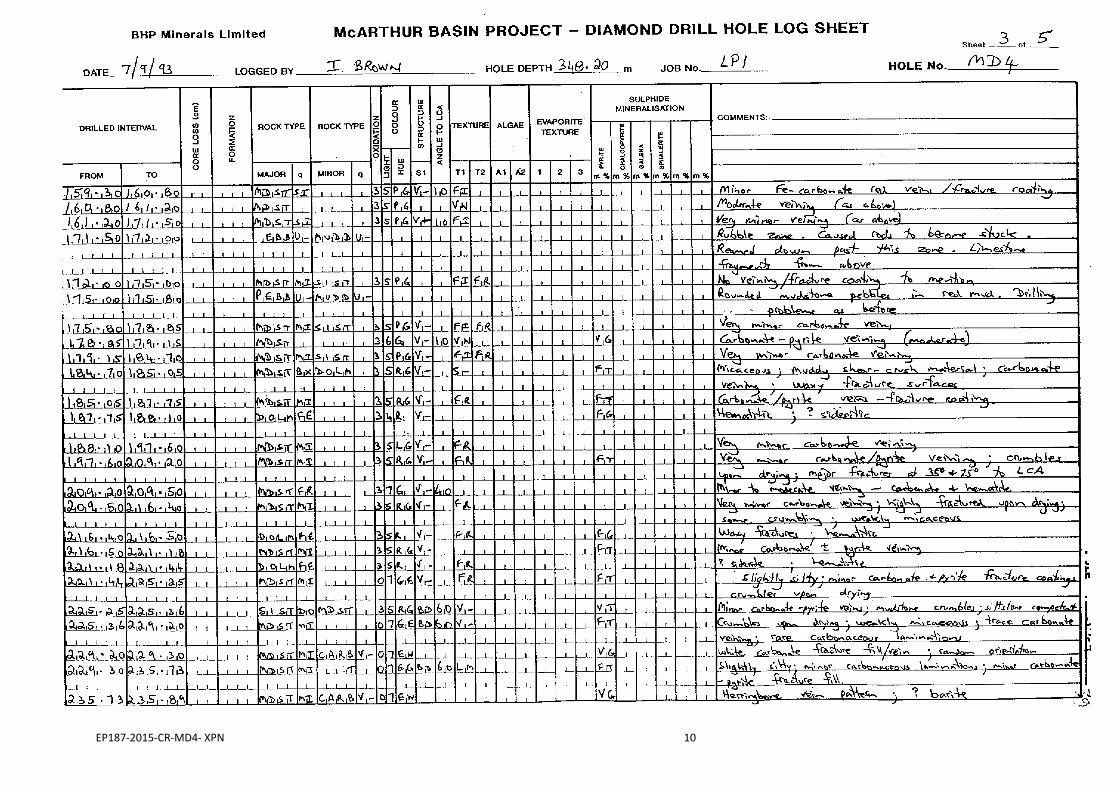
Table 2: Lithology Log of MD4

EP187-2015-CR-MD4- XPN 9
EP187-2015-CR-MD4- XPN 10

EP187-2015-CR-MD4- XPN 11

EP187-2015-CR-MD4- XPN 12

EP187-2015-CR-MD4- XPN 13
Table 3: Results of TOC/SRA analysis
Sample ID
Top
Depth
(mMD)
SRA
TOC S1 S2
Tmax
(°C)
Calc1.
% Ro
351323 229.30 0.25 0.16 0.11 313
351324 244.90 0.29 0.03 0.05 444 0.83
351325 288.80 0.16 0.09 0.08 304
351326 304.70 1.76 0.29 2.88 454 1.01
351327 305.40 1.85 0.24 2.86 451 0.96
351328 306.70 2.62 0.33 4.92 445 0.84
351329 307.70 4.45 0.52 8.83 450 0.95
351330 308.50 3.96 0.45 7.04 445 0.85
351331 311.10 4.72 0.35 9.08 445 0.85
351332 311.90 6.16 0.47 6.64 441 0.78
351333 333.70 0.18 0.05 0.08 449 0.93 1 % Ro is calculated using the formulae %Ro = 0.0180 x Tmax – 7.16 (Jarvie et al 2005).
Table 4: Calculation of petroleum potential using hydrocarbon index (HI) and production
index (PI) from source rock analysis results presented in Table 3 for core samples from well
MD4.
Sample ID HI S1/TOC*100 PI
351323 44 64 0.59
351324 17 10 0.38
351325 52 58 0.53
351326 163 16 0.09
351327 154 13 0.08
351328 188 13 0.06
351329 198 12 0.06
351330 178 11 0.06
351331 192 7 0.04
351332 108 8 0.07
351333 43 27 0.38

EP187-2015-CR-MD4- XPN 14
Table 5: XRF analysis results
(wt.%) MD4 82/1
Sample 351326 351331 351348
SiO2 70.15 68.40 66.38
TiO2 0.696 0.668 0.725
Al2O3 18.02 17.41 19.65
Fe2O3 4.488 5.541 4.747
MnO 0.0185 0.0189 0.0148
MgO 1.808 1.736 1.636
CaO 0.336 0.188 0.377
Na2O 0.640 0.719 0.151
K2O 3.380 3.812 4.337
P2O5 0.111 0.055 0.294
SO3 0.016 0.144 0.077
Cl <10 <10 <10
LOI (XRF wt%) 0.33 1.30 1.62
Total 99.67 98.70 98.38
Fe2O3/k20 1.33 1.45 1.09
SiO2/Al2O3 3.89 3.93 3.38
CaO/K2O 0.10 0.05 0.09
Table 6: XRD Mineralogy results
Sample 351 326 351 331
Wt. % Wt. %
Quartz 40.4 37.2
Plagioclase (Albite, Var. Cleavelandite) 5.7 6.4
Pyrite 0.5
Total Non-Clays 46.1 44.1
Kaolinite (Ordered) 3.8
Smectite (Na-Kinney Montmorillonite) 2.6 2.1
Illite (1md) 47.6 53.8
Total Clays 54.0 55.9
Total 100.0 100.0

EP187-2015-CR-MD4- XPN 15
Table 7: Concentration of major elements (as wt%) of the samples sourced from the MD4 core hole
showing comparison of the shale averages of the Velkerri Formation samples to the Average Shale
composition determined by Wedepohl (1971, 1991) (sourced from Ross et al 2009) and the PAAS*.
Velkerri Fm. averages drawn from correlation of samples obtained from MD4 historical core.
MD4 82/1 Velkerri Wedepohl (1971,
1991) PAAS*
Depth (m) 304.7 311.10
Sample 351326 351331 351348 n= 3 Avg Shale Avg
Shale
SiO2 70.15 68.4 66.38 68.31 58.9 62.8
TiO2 0.696 0.668 0.725 0.696 0.78 1
Al2O3 18.02 17.41 19.65 18.36 16.7 18.9
Fe2O3 4.488 5.541 4.747 4.925 2.8 7.22
FeO
MnO 0.0185 0.0189 0.0148 0.017 0.11
MgO 1.808 1.736 1.636 1.727 2.6 2.2
CaO 0.336 0.188 0.377 0.300 2.2 1.3
Na2O 0.64 0.719 0.151 0.503 1.6 1.2
K2O 3.38 3.812 4.337 3.843 3.6 3.7
P2O5 0.111 0.055 0.294 0.153 0.16 0.16
LOI 0.33 1.3 1.62 1.08 6
Total 99.67 98.7 98.38
89.34 104.59
TOC 1.76 4.72
0.2 0.2
Fe2O3T
3.64 3.64
Fe2O3T/k20
1.01 1.01
Fe2O3T/AL2O3
0.22 0.22
SiO2/Al2O3 3.89 3.93 3.38 3.73 3.53 3.53
CaO/K2O 0.1 0.05 0.09 0.08 0.61 0.61
K20/Al2O3 0.19 0.22 0.22 0.21 0.22 0.22
MgO/Al2O3 0.10 0.10 0.08 0.09 0.16 0.16
TiO2/Al2O3 0.04 0.04 0.04 0.04 0.05 0.05
SO3 0.016 0.144 0.077 0.08
Cl <10 <10 <10
* PAAS = Post Archean Australian Shale standard
EP187-2015-CR-MD4- XPN 16
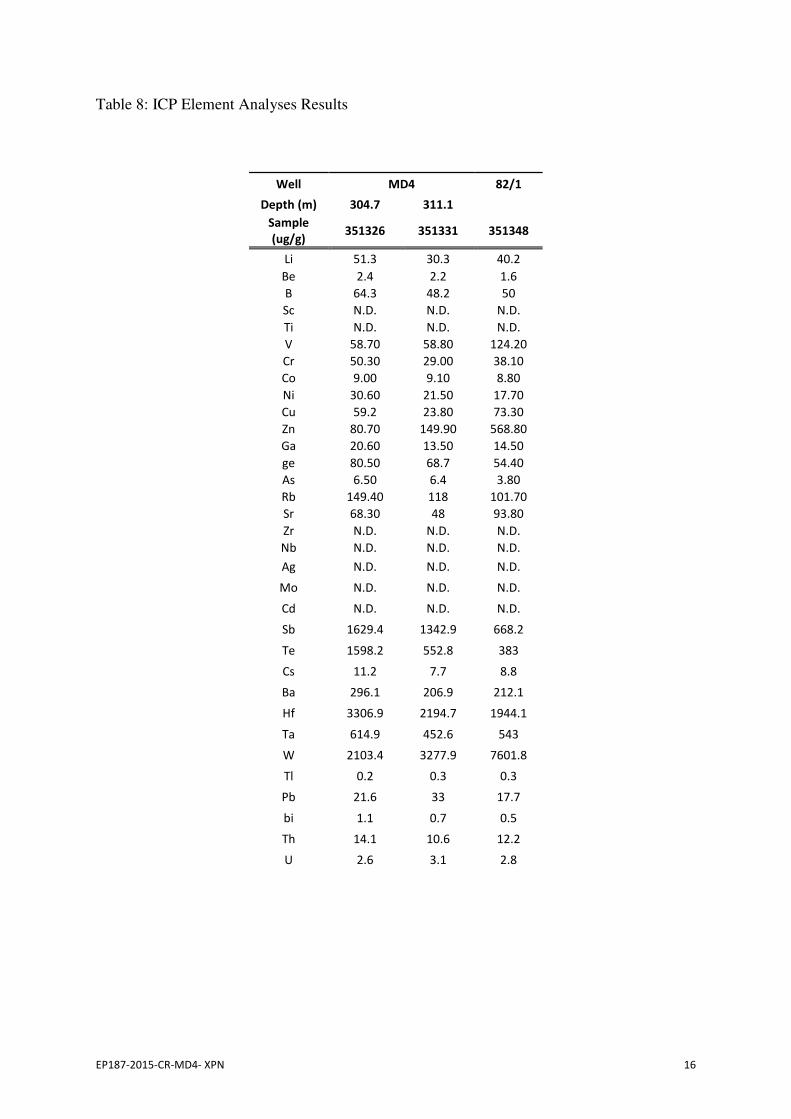
Table 8: ICP Element Analyses Results
Well MD4 82/1
Depth (m) 304.7 311.1
Sample
(ug/g) 351326 351331 351348
Li 51.3 30.3 40.2
Be 2.4 2.2 1.6
B 64.3 48.2 50
Sc N.D. N.D. N.D.
Ti N.D. N.D. N.D.
V 58.70 58.80 124.20
Cr 50.30 29.00 38.10
Co 9.00 9.10 8.80
Ni 30.60 21.50 17.70
Cu 59.2 23.80 73.30
Zn 80.70 149.90 568.80
Ga 20.60 13.50 14.50
ge 80.50 68.7 54.40
As 6.50 6.4 3.80
Rb 149.40 118 101.70
Sr 68.30 48 93.80
Zr N.D. N.D. N.D.
Nb N.D. N.D. N.D.
Ag N.D. N.D. N.D.
Mo N.D. N.D. N.D.
Cd N.D. N.D. N.D.
Sb 1629.4 1342.9 668.2
Te 1598.2 552.8 383
Cs 11.2 7.7 8.8
Ba 296.1 206.9 212.1
Hf 3306.9 2194.7 1944.1
Ta 614.9 452.6 543
W 2103.4 3277.9 7601.8
Tl 0.2 0.3 0.3
Pb 21.6 33 17.7
bi 1.1 0.7 0.5
Th 14.1 10.6 12.2
U 2.6 3.1 2.8

EP187-2015-CR-MD4- XPN 17
Table 9: Rare earth elements analysis
Well MD4 82/1
Depth (m) 304.7 311.1
Sample
(ug/g) 351326 351331 351348
La 33.94 24.76 30.65
Ce 71.16 56.06 68.62
Pr 8.56 6.83 7.78
Nd 31.34 25.64 27.63
Sm 6.44 5.76 5.83
Eu 1.10 1.07 1.09
Gd 5.66 5.27 5.76
Tb 0.90 0.82 0.87
Dy 5.19 5.05 4.79
Ho 1.07 1.08 0.94
Y 27.11 25.94 23.14
Er 3.17 3.31 2.75
Tm 0.48 0.50 0.40
Yb 3.41 3.27 2.64
Lu 0.53 0.51 0.40

EP187-2015-CR-MD4- XPN 18
Figure 1: Geochemical log

EP187-2015-CR-MD4- XPN 19
Figure 2: Kerogen quality plot

EP187-2015-CR-MD4- XPN 20
Figure 3: Kerogen type and maturity

EP187-2015-CR-MD4- XPN 21
Figure 4: kerogen conversion and maturity

EP187-2015-CR-MD4- XPN 22
Quantitative XRD
Sample 351326
Degree of fit: 0.0455
NON-CLAYS Weight %
Quartz 40.4
Plagioclase (albite, var. cleavelandite) 5.7
Total non-clays 46.0
CLAYS
Kaolinite (ordered) 3.8
Smectite (Na-Kinney montmorillonite) 2.6
Illite (1Md) 47.6
Total clays 54.0
TOTAL 100.0
EP187-2015-CR-MD4- XPN 23
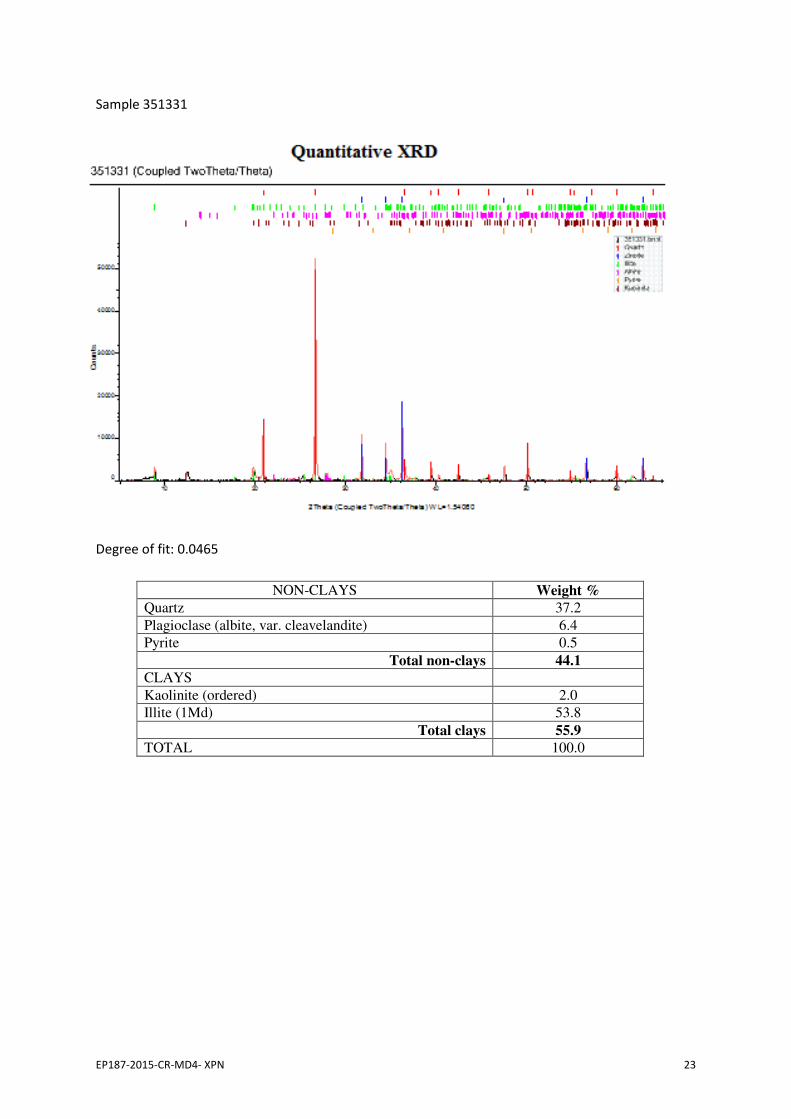
Sample 351331
Degree of fit: 0.0465
NON-CLAYS Weight %
Quartz 37.2
Plagioclase (albite, var. cleavelandite) 6.4
Pyrite 0.5
Total non-clays 44.1
CLAYS
Kaolinite (ordered) 2.0
Illite (1Md) 53.8
Total clays 55.9
TOTAL 100.0

EP187-2015-CR-MD4- XPN 24
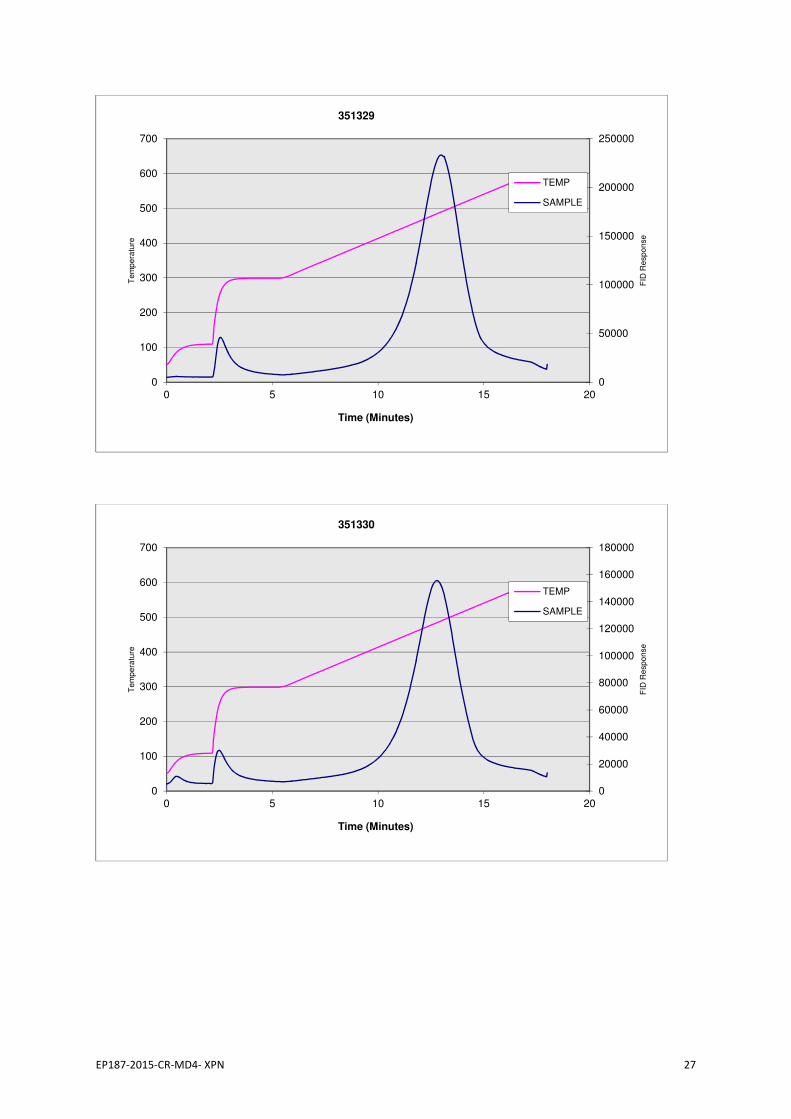
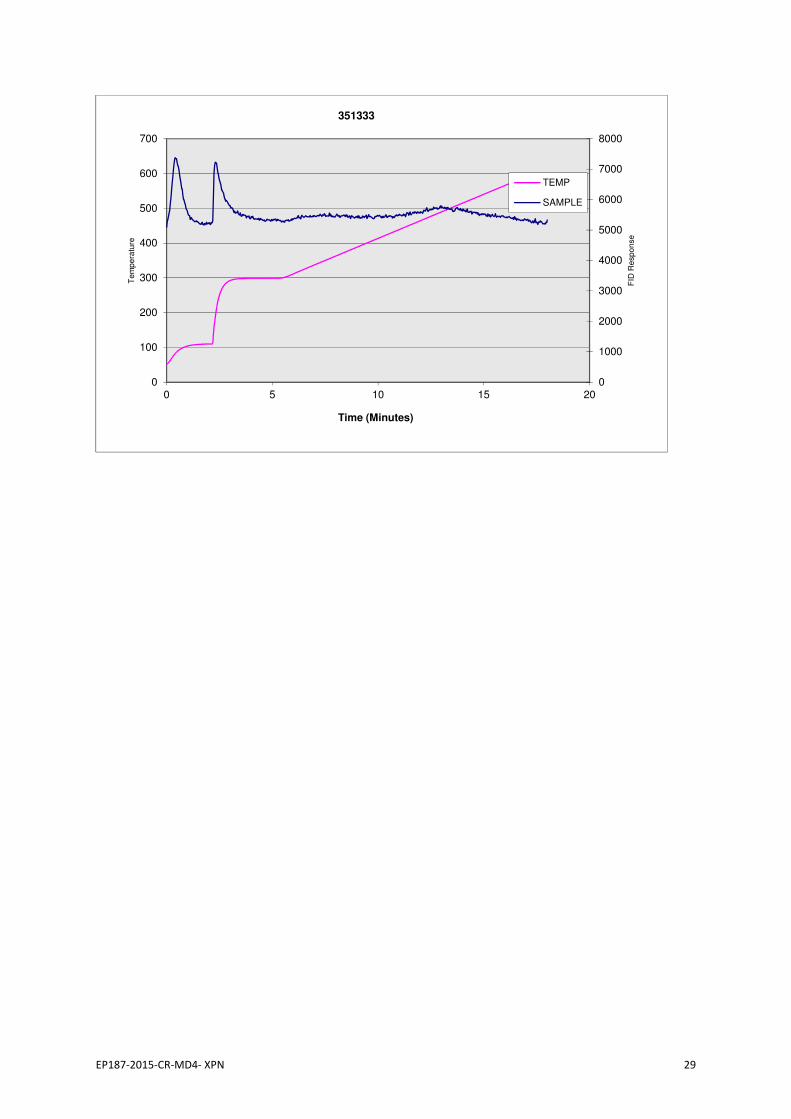
Pyrolysis data
0
2000
4000
6000
8000
10000
12000
14000
16000
0
100
200
300
400
500
600
700
0 5 10 15 20
FID
Re
sp
on
se
Te
mp
era
ture
Time (Minutes)
351323
TEMP
SAMPLE
0
1000
2000
3000
4000
5000
6000
7000
0
100
200
300
400
500
600
700
0 5 10 15 20
FID
Re
sp
on
se
Te
mp
era
ture
Time (Minutes)
351324
TEMP
SAMPLE

EP187-2015-CR-MD4- XPN 25
0
2000
4000
6000
8000
10000
12000
0
100
200
300
400
500
600
700
0 5 10 15 20
FID
Re
sp
on
se
Te
mp
era
ture
Time (Minutes)
351325
TEMP
SAMPLE
0
10000
20000
30000
40000
50000
60000
70000
80000
0
100
200
300
400
500
600
700
0 5 10 15 20
FID
Re
sp
on
se
Te
mp
era
ture
Time (Minutes)
351326
TEMP
SAMPLE

EP187-2015-CR-MD4- XPN 26
0
10000
20000
30000
40000
50000
60000
70000
80000
90000
0
100
200
300
400
500
600
700
0 5 10 15 20
FID
Re
sp
on
se
Te
mp
era
ture
Time (Minutes)
351327
TEMP
SAMPLE
0
10000
20000
30000
40000
50000
60000
70000
80000
90000
100000
0
100
200
300
400
500
600
700
0 5 10 15 20
FID
Re
sp
on
se
Te
mp
era
ture
Time (Minutes)
351328
TEMP
SAMPLE
EP187-2015-CR-MD4- XPN 27
0
50000
100000
150000
200000
250000
0
100
200
300
400
500
600
700
0 5 10 15 20
FID
Re
sp
on
se
Te
mp
era
ture
Time (Minutes)
351329
TEMP
SAMPLE
0
20000
40000
60000
80000
100000
120000
140000
160000
180000
0
100
200
300
400
500
600
700
0 5 10 15 20
FID
Re
sp
on
se
Te
mp
era
ture
Time (Minutes)
351330
TEMP
SAMPLE

EP187-2015-CR-MD4- XPN 28
0
50000
100000
150000
200000
250000
0
100
200
300
400
500
600
700
0 5 10 15 20
FID
Re
sp
on
se
Te
mp
era
ture
Time (Minutes)
351331
TEMP
SAMPLE
0
20000
40000
60000
80000
100000
120000
140000
160000
180000
200000
0
100
200
300
400
500
600
700
0 5 10 15 20
FID
Re
sp
on
se
Te
mp
era
ture
Time (Minutes)
351332
TEMP
SAMPLE
EP187-2015-CR-MD4- XPN 29
0
1000
2000
3000
4000
5000
6000
7000
8000
0
100
200
300
400
500
600
700
0 5 10 15 20
FID
Re
sp
on
se
Te
mp
era
ture
Time (Minutes)
351333
TEMP
SAMPLE

EP187-2015-CR-MD4- XPN 30
References:
Adelaide Research & Innovation Pty Ltd. 2013. Geologic controls of black shale deposition in the
Palaeo-Proterozoic of the McArthur Basin. A research project for Imperial Oil and Gas.
Australian Shale Carbon Sequestration Group Sprigg Geobiology Centre. University of
Adelaide.
Condie, K.C. (1993). Chemical composition and evolution of the upper continental crust: contrasting
results from surface samples and shales. Chemical Geology 104: 1-37. doi: 10.1016/0009-
2541(93)90140-E.
Crick, I. H., Boreham, C. J., Cook, A.C., & Powell. T.G. 1988 Petroleum Geology and geochemistry
of Middle Proterozoic McArthur Basin, Northern Australia II: assessment of source rock
potential. AAPG Bulletin, 72. 1495-1514
Deer, W. A.; Howie, R. A.; Zussman (1992). An introduction to the rock forming minerals.
Prentice Hall.
Espitalie, J., G. Deroo, and F. Marquis, 1985, La pyrolyse Rock-Eval et ses applications (deuxieme
partie): Revue Institut Francais du Petrole, v. 40, p. 755-784.
Guppy D. J. 1966 Classification of the Sedimentary Rocks. Department of National Development
Bureau Of Mineral Resources Geology and Geophysics. Records:1964/112
Hall P.A., Watson A.F.R., Garner G.V., Hall K., Smith S., Waterman.D, and Horfield B. (1999)An
Investigation of Micro-scaled Sealed Vessel Thermal Extraction-Gas Chromatography-Mass
Spectrometry (MSSV-GC-MS) and Micro-scaled Sealed Vessel Pyrolysis-Gas
Chromatography-Mass Spectrometry Applied to a Standard Reference Material of an Urban
Dust/Organics, The Science of the Total Environment, pp.269-276
Hall, P.A., McKirdy, D.M., Halverson, G.P., Jago, J.B., Gehling, J.G. (2011) Biomarker and isotopic
signatures of an early Cambrian Lagerstätte in the Stansbury Basin, South Australia. Organic
Geochemistry, accepted manuscript OG-1373, 2011
Hokin G. (2014) 2014 Field Season to End-August EP184 Saint Vidgeon Shallow Core Wells Imperial
Oil & Gas. Company report submitted NT Dep’t Mines & Energy 2014.
Holman A.I., Grice K., Jaraula C.M.B., Schimmelmann A. (2014). Bitumen II from the
Paleoproterozoic Here’s Your Chance Pb/Zn/Ag deposit: Implications for the analysis of
depositional environment and thermal maturity of hydrothermally-altered sediments. Science
Direct. Geochimica et Cosmochimica Acta 139 (2014) 98–109
Jarvie D.M.; Hill R.J.; and Pollastro R.M. 2005 Assessment of the Gas Potential and Yields from
Shales: the Barnett Shale Model.
Korth j. 1987 Analytical studies on Australian oil shales. University of Wollongong thesis collection.
Moore, D.M. & Reynolds, R.C., 1997. X-ray Diffraction and the Identification and Analysis of Clay
Minerals Second, Oxford University Press.
Page, R.W. and Sweet, I.P. 1998. Geochronology of basin phases in the western Mt Isa Inlier, and
correlation with the McArthur Basin. Australian Journal of Earth Sciences: An International
Geoscience Journal of the Geological Society of Australia. Volume 45, Issue 2, 1998. Special
Issue: Application of radiogenic isotopes to the study of Australian ore deposits.

EP187-2015-CR-MD4- XPN 31
Plank, T., Langmuir, C.H., 1998. The chemical composition of subducting sediment and its
consequences for the crust mantle. Chemical Geology 145, 325–394.
Raiswell, R. and Berner, R.A., 1987, Organic carbon losses during burial and thermal maturation of
normal marine shales. Geology, v 15, 853-856
Rawlings D. J. 1999: Stratigraphic resolution of a multiphase intracratonic basin system: The
McArthur Basin, northern Australia, Australian Journal of Earth Sciences: An International
Geoscience Journal of the Geological Society of Australia, 46:5, 703-723
Ross J.K., Bustin R.M.; 2009. Investigating the use of sedimentary geochemical proxies for
paleoenvironment interpretation of thermally mature organic-rich strata: Examples
from the Devonian-Mississippian shales, Western Canadian Sedimentary Basin.
Journal Chemical Geology 260 1-19.
Wedepohl, K.H., (1971). Environmental influences on the chemical composition of shales and clays.
In: Ahrens, L.H., Press, F., Runcorn, S.K., Urey, H.C. (Eds.), Physics and Chemistry of the
Earth. Pergamon, Oxford, UK, pp. 307–331.
Wedepohl, K.H. (1991a). Chemical-Composition and Fractionation of the Continental-Crust.
Geologische Rundschau 80(2): 207-223.
Wedepohl, K.H., (1991b). The composition of the upper Earth's crust and the natural cycles of
selected elements. Metals in natural raw materials. Natural resources. In: Merian, E.
(Ed.),Metals and their Compounds in the Natural Environment. VCH, Weinheim, Germany,
pp. 3–17.
Yanan Shen, Canfield D. E., and Knoll A. H.2002 Middle Proterozoic Ocean Chemistry:
Evidence From The McArthur Basin, Northern Australia. American Journal Of Science Vol. 302, February, 2002, P. 81–109