epa field data forms and in appendix m of 40 cfr … veof was designed to record information...
TRANSCRIPT

United States Office of Air Quality Environmental Prutection Planning and Standards Agency Research Triangle Park, NC
EPA 455/R-93-005 June 1993 Final Draft
3, EPA FIELD DATA FORMS AND INSTRUCTIONS FOR EPA METHODS 203A, 2038 AND 203C
Proposed Methods in Appendix M of 40 CFR Part 50

EPA 455/R-93-005 June 1993
Field Data and Instructions For EPA Methods 203A, 2038 and 203C
Proposed Methods In Appendix M of 40 CFR Part 50
Prepared by:
Eastern Technical Associates PO Box 58495
Raleigh, NC 27658
and
TRC Environmental Corporation Boott Mills South
Foot of John Street Lowell, MA 01852
Contract 68-02-0059 Work Assignment No. lA2-32
EPA Work Assignment Manager: Chris Oh EPA Project Officer: Aaron Martin
US. ENVIRONMENTAL PROTECTION AGENCY Stationary Source Compliance Division
Office of Air Quality Planning and Standards Washington, DC 20460
June 1993

TABLE OF CONTENTS
1.0
2.0
3.0
4.0
5.0
INTRODUCTION . . . . . . 1
DESCRIPTIONS OFTHEMJXHODS . . . 1
VISIBLE EMISSION OBSERVATION FORM 1 (VEOFl) COMPLETION . . . . . . 2
VISIBLE EMISSION OBSERVATION FORM 2 (VEOF2) COMPLETION . . . . . . 14
DATA REDUCTION FORM COMPLETION . . 15
APPENDIX
VISIBLE EMISSION OBSERVATION FORM 1 (VEOFl)
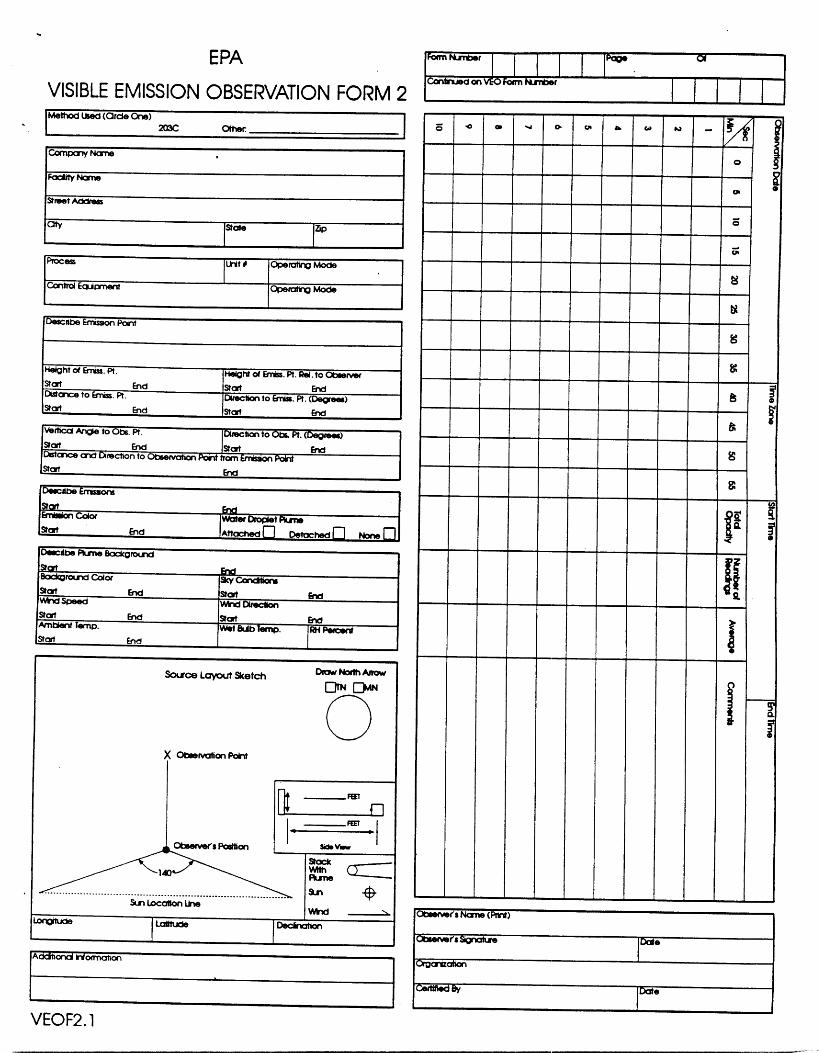
VISIBLE EMISSION OBSERVATION FORM 2 (VEOF2) e
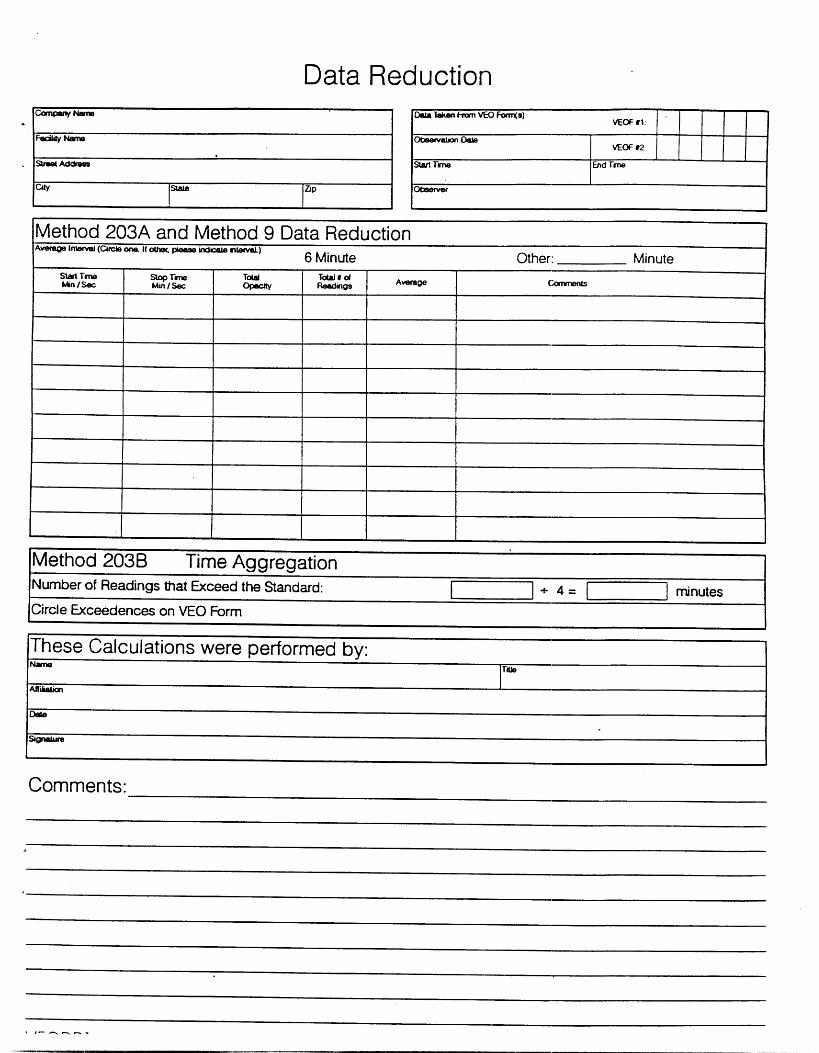
‘DATA REDUCTION FORM

.
INSTRUCTIONS FOR USE OF THE VISIBLE EMISSIONS OBSERVATION FORMS
1 .O INTRODUCTION The Visible Emissions Observation Forms (VEOF) are described in this document and located in the Appendix. Visible Emission Form 1 (VEOFl) and the data reduction form can be used as a data record when performing visible emissions observations using EPA Reference Method 9, Methods 2034 or 203B. Visible Emission Form 2 (VEOF2) can be used for Method 203C. The method used may be designated by State Implementation Plans (SIPS), Federal Implementation Plans (FIPs) or new source performance standards (NSPS). Each shall be used in its current form, or modified by the States to suit the state’s particular needs.
1.1 NATURE AND PURPOSE OF THE VEOF The VEOF was designed to record information required in the field documentation of visible emissions. When properly filled out, the form provides all of the required data. This data includes: observer certification information, source name and location, type and operating mode of equipment (both control and process), data describing the relative locations of the observer, emissions outlet, observation point, data describing the type of emissions and background, wind direction and speed, ambient temperature, relative humidity, relative positions of the sun, observer, observation point, wind, and north arrow on the sketch, as well as the opacity data itself and the data reduction. Because the data reduction methods will vary from method to method, separate data reduction sections are provided for all four methods.
As field experience was gained with the existing Method 9 VEOF from, it was determined that more detailed documentation was necessary in order to demonstrate compliance with the regulations. A VEOF evolved as new pieces of information needed to ensure compliance with Method 9 came to light. With the promulgation of Methods 2034 B, and C the development of a new VEOF was necessary. Previously used VEOF’s were collected and analyzed to determine the documentation needs of Methods 9,203A B, and C. The results of the evaluation are the VEOFl, VEOF2, and data reduction forms presented in this document. All of the information needed to accurately document Methods 9, 2034 B, and C are included on these forms. Since the forms encompass all of the re- quirements for all four Methods, not all of the data blanks on each of the VEOF’s will be used for each Method. Additionally, the forms contain some data blanks that are not required by any of the Methods. These data blanks provide information that gives a clearer view of under what circum- stances the VEO was conducted to facilitate use of the resulting data in determining compliance with applicable regulation.
2.0 DESCRIPTIONS OF THE METHODS
2.1 METHOD 9 (please refer to section 3.12 of volume III of the EPA Quality Assurance Hand- book EPA 60014-77) Method 9 was promulgated November 12, 1974 (39 FR 39872) and revised in 1987 (52 FR 34639 on Sept. 14; 52 FR 42061 on Nov. 2). It is a method of determining the average opacity from a source. For this Method, the readings are taken at 15 second intervals, and +are then averaged over a six minute interval.
1
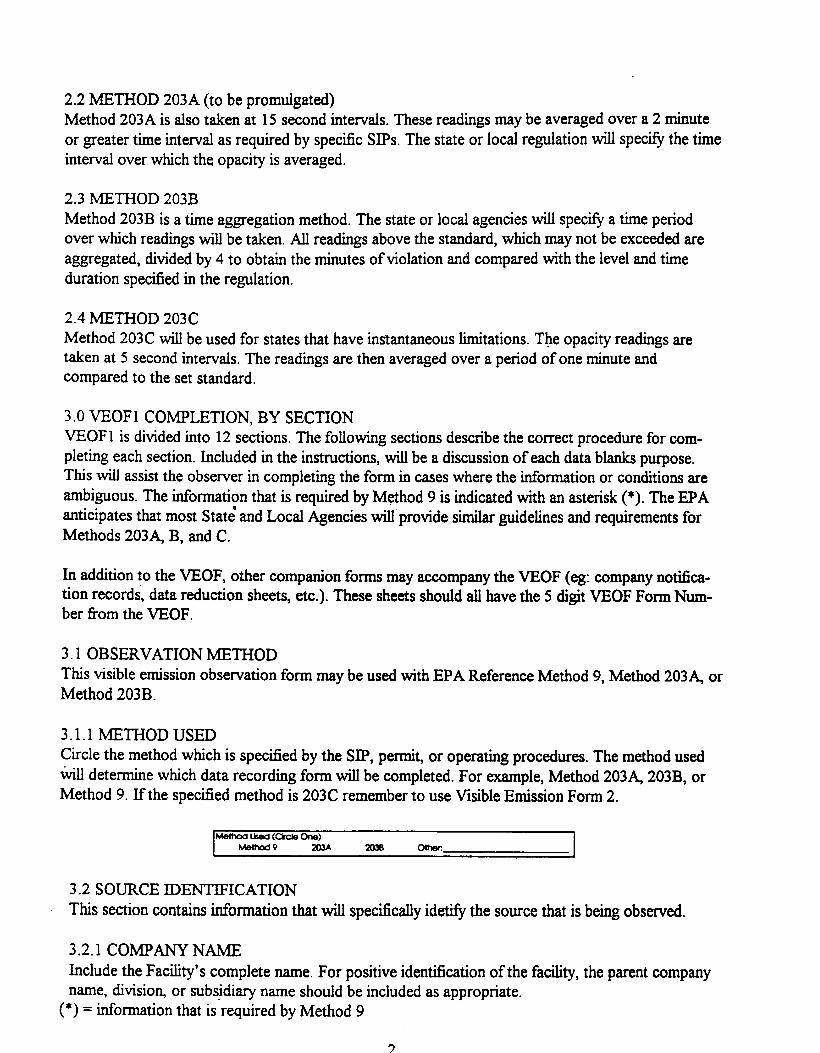
2.2 METHOD 203A (to be promulgated) Method 203A is also taken at 15 second intervals. These readings may be averaged over a 2 minute or greater time interval as required by specific SIPS. The state or local regulation will specify the time interval over which the opacity is averaged.
2.3 METHOD 203B Method 203B is a time aggregation method. The state or local agencies will specify a time period over which readings will be taken. All readings above the standard, which may not be exceeded are aggregated, divided by 4 to obtain the minutes of violation and compared with the level and time duration specified in the regulation.
2.4 METHOD 203C Method 203C will be used for states that have instantaneous limitations. The opacity readings are taken at 5 second intervals. The readings are then averaged over a period of one minute and compared to the set standard.
3.0 VEOFl COMPLETION, BY SECTION VEOFl is divided into 12 sections. The following sections describe the correct procedure for com- pleting each section. Included in the instructions, will be a discussion of each data blanks purpose. This will assist the observer in completing the form in cases where the information or conditions are ambiguous. The information that is required by Method 9 is indicated with an asterisk (*). The EPA anticipates that most State and Local Agencies will provide similar guidelines and requirements for Methods 2034 B, and C.
In addition to the VEOF, other companion forms may accompany the VEOF (eg: company notifica- tion records; data reduction sheets, etc.). These sheets should all have the 5 digit VEOF Form Num- ber from the VEOF.
3.1 OBSERVATION METHOD This visible emission observation form may be used with EPA Reference Method 9, Method 203A, or Method 203B.
3.1.1 METHOD USED Circle the method which is specified by the SIP, permit, or operating procedures. The method used &ill determine which data recording form will be completed. For example, Method 203A, 203B, or Method 9. If the specified method is 203C remember to use Visible Emission Form 2.
3.2 SOURCE IDENTIFICATION This section contains information that will spectically idetify the source that is being observed.
3.2.1 COMPANY NAME Include the Facility’s complete name. For positive identification of the facility, the parent company name, division, or subsidiary name should be included as appropriate.
(*) = information that is-required by Method 9
2

3.2.2 FACILITY NAME (*) This section provides information that uniquely identifies the facility and permits the observer to locate or make contact with the facility.
3.2.3 STREET ADDRESS (*) Indicate the street address of the facility (not mailing or home office address) so that the exact physical location of the source is known. If necessary, the mailing address or home office address may be listed elsewhere.
3.3 PROCESS INFORMATION The information contained in this section details exactly what the source is doing and what controls are in place.
3.3.1 PROCESS AND CONTROL DEVICE TYPE Include a several-word description of the process and control device, indication of current process operating capacity or mode, and operational status of the control equipment. Note: This section, in particular, includes information that will probably have to be obtained from a plant official. Since a facility may consider their production rate or other process information as proprietary, the inspector shall specifically inform them that they have the right to request that this information be submitted subject to the confidential business information provisions of 40 CFR 2 Subpart B.
3.3.2 PROCESS EQUIPMENT (*) Enter a description which clearly and unambiguously identifies the process equipment and type of facility that emits the plume or emissions to be read. The description should be briec but should include as much information as possible. The following examples are concise examples of what is needed in this blank: Coal-Fired Blr. - Unit 4/power Plt. #2 Oil-Fired BWChemical Plant Wood Waste Conical Incinerator Paint Spray Booth/Auto Plant Primary Crusher at Rock Quarry Fiberglass Curing Oven

Reverb Furnace/Copper Smelter Basic Oxygen Furnace/Steel Mill Cement Plant Kiln Storage Pile/Spray Dust Suppression Road/Parking Lot ’ Intermittent Source (Specify)
3.3.3 OPERATING MODE Depending on the source or type of process equipment, this information may vary from a quantification of the current operating rate or a description of the portion of batch-type process for which the emission opacity is being read to an explanation of how the equipment is currently operating such as “upset conditions,” “start-up,” or “shutdown.” Other examples include “90 percent capacity” for a boiler or “85 percent production rate” for the shakeout area of a grey iron foundry. For a steel making furnace, entries should include the exact part of the process cycle for which readings are being made, such as “charging” or “tapping.” In most cases, this information will have to be obtained from a plant official. In the case of fugitive sources, an explanation of those factors effecting emissions is appropriate. For example, for an industrial; road, “two-way traflic, oiled surface” might be appropriate.
3.3.4 CONTROL EQUIPMENT (*) Specifjl the type(s) of control equipment being used in the system after the process equipment in question (e.g., “hot-side electrostatic precipitator”). In the case of fugitive emissions, specify any permit limitations which may be binding upon the source, such as “spray dust suppression”.
3.3.5 OPERATING MODE Indicate the manner in which the control equipment is being utilized at the time of the opacity observations (e.g., 1 field of 8 tripped on ESP, scrubber operating without water, shut down, off line) and the operating mode (e.g., automatic, manual, bypass). This information should be obtained ffom a plant official.
3.4 EMISSION POINT IDENTIFICATION Contains information uniquely ident@ing the emission point and its spatial relationship with the observer’s position. It is recommended that distances and heights in this section be noted in consistent units.
HeQhtofGnkPt. t-k&htdEmk%Pt.R8Ltoot36cnva
stat End End DhtcncetoEfk!LPt. DtOCtlOntOEmhrPt.(Deqeer)
stat End End
3.4.1 DESCRIBE EMISSION POINT (*) Describe the type and physical characteristics of the emission point. The description must be specific enough so that the emission outlet under observation can be distinguished from all others at the source. The description of the type of emission point should address whether it is 1) a specifically designed outlet such as stacks, vents,, and roof monitors (having confined emissions) or 2) an

emission source having unconfined emissions such as storage piles, chemical tanks, and non-ducted material handling operations. Description of the physical characteristics of the emission point should include the appearance (such as color, texture, etc.) and geometry (size, shape, etc.) of the stack or other outlet, and its location in relation to other recognizable facility landmarks. Any special identifi- cation codes that the agency or source uses to identify a particular stack or outlet should be noted along with the description; the source of the code should also be recorded. A special identification code should not be used alone to describe the emission point, since they are sometimes incorrect and also require a secondary reference. The observer must be certain of the origin of the emissions that were being read. A description of the emission point coupled with the identification of the process equipment and control equipment should accomplish that purpose.
34.2 HEIGHT OF EMISSION POINT (*) Indicate the height of the stack or other emission outlet from its base. This information is usually available from agency files, engineering drawings, or computer printouts (such as NEDS printouts), The information also may be obtained by using a combination of a range finder or topographical map and Abney level (or clinometer). The height may also be estimated.
3.4.3 HEIGHT OF EMISSION POINT RELATIVE TO THE OBSERVER (*) Indicate an estimate of the height of the stack outlet (or any other type of emission outlet) above the position of the observer. This measurement indicates the observer’s position in relation to the stack base (i.e. higher or lower than the base) and is necessary if slant angle calculations are performed.
3.4.4 DISTANCE TO EMISSION POINT (*) Record the distance from the point of observation to the emission outlet. This measurement may be made by using a rangefinder. A map may also be used to estimate the distance.
This measurement must be reasonably accurate when the observer is close to the stack or emission point (within 3 times the distance of the “height of the emission point relative to the observer” .) This is because it may be used in conjunction with the height of the emission point relative to the observer and the distance and direction of observation point from emission point to determine or check the slant angle at which the observations were made. A precise calculation of the slant angle becomes important in calculating the positive bias inherent in opacity readings when the observer is within three stack heights of a stack (a slant angle greater than 18 degrees).
. 3.4.5 DIRECTION TO EMISSION POINT (DEGREES) (*) SpeciQ the direction from the observer to the emission point. It is strongly suggested that a compass be used to make this determination. The procedure to determine the direction will vary with the quality of the compass. With a simple card type, face the emission outlet with the compass held horizontal. Rotate the compass until the north (N) needle of the compass coincides with N on the face. Read the angle pointing in the direction to the emission outlet. This is the direction to the Emission Point. A map may also be used to make this determination.
3.5 OBSERVATION POINT IDENTIFICATION (in the plume) Contains information uniquely identifying the observation point and its spatial relationship with the observer’s position and the emission point. It is recommended that distances and heights in this section be noted in consistent units.
5
u3McdAngletoobs.Pt. ohcnon to obs. Pt. aeQree6)
start End stat End Distonceond~ecnontoObscwvotbn Point from Emlskm Poht
1 Ene-4
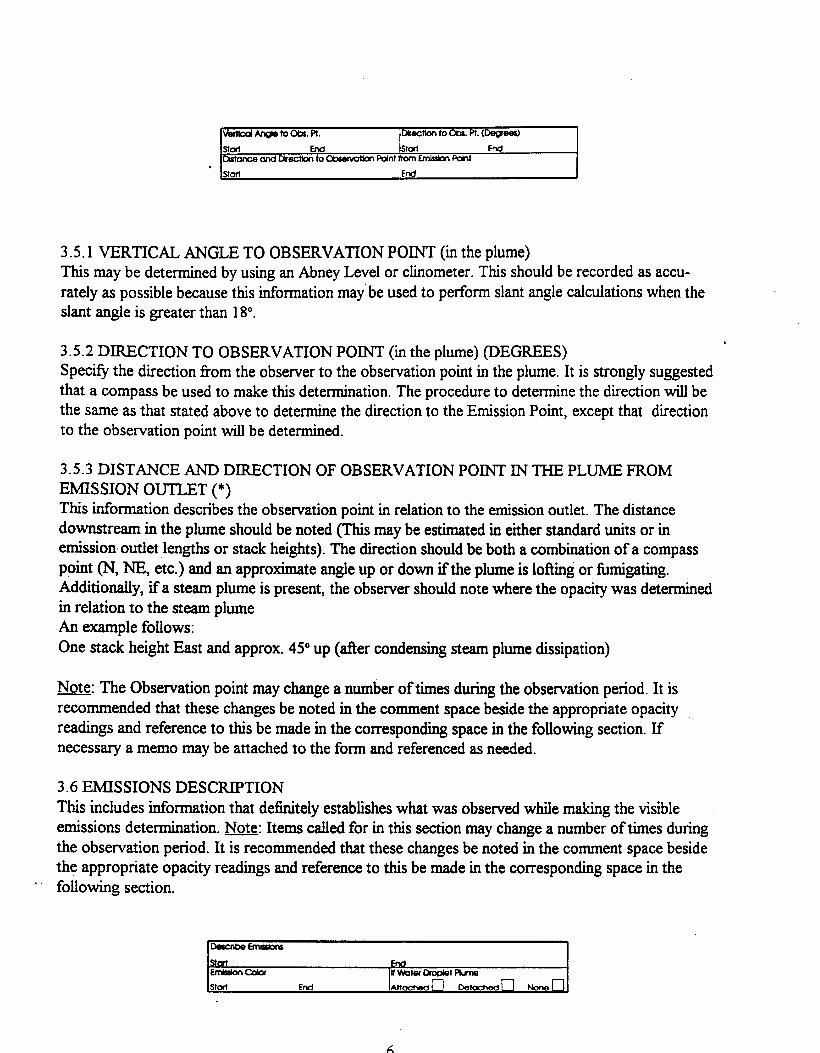
3 S. 1 VERTICAL ANGLE TO OBSERVATION POINT (in the plume) This may be determined by using an Abney Level or clinometer. This should be recorded as accu- rately as possible because this information may’be used to perform slant angle calculations when the slant angle is greater than 18”.
. 3.5.2 DIRECTION TO OBSERVATION POINT (in the plume) (DEGREES) Specify the direction from the observer to the observation point in the plume. It is strongly suggested that a compass be used to make this determination. The procedure to determine the direction will be the same as that stated above to determine the direction to the Emission Point, except that direction to the observation point will be determined.
3.5.3 DISTANCE AND DIRECTION OF OBSERVATION POINT IN THE PLUME FROM EMISSION OUTLET (*) This information describes the observation point in relation to the emission outlet. The distance downstream in the plume should be noted (This may be estimated in either standard units or in emission. outlet lengths or stack heights). The direction should be both a combination of a compass point (N, NE, etc.) and an approximate angle up or down ifthe plume is lofting or fumigating. Additionally, if a steam plume is present, the observer should note where the opacity was determined in relation to the steam plume An example follows: One stack height East and approx. 45” up (after condensing steam plume dissipation)
Note: The Observation point may change a number of times during the observation period. It is recommended that these changes be noted in the comment space beside the appropriate opacity readings and reference to this be made in the corresponding space in the following section. If necessary a memo may be attached to the form and referenced as needed.
3.6 EMISSIONS DESCRIE’TION This includes information that definitely establishes what was observed while making the visible emissions determination. Note: Items called for in this section may change a number of times during the observation period. It is recommended that these changes be noted in the comment space beside the appropriate opacity readings and reference to this be made in the corresponding space in the
- following section.
6

3.6.1 DESCRIBE EMISSIONS (*) Include physical characteristics and behavior of the plume (not addressed elsewhere on the form) and the distance for which it remains visible. Physical descriptions may include such things as texture, gradation, and contents (e.g. “lacy,” “flu&,” “copious,” “mushrooming,” “spreading over horizon,” and “detached non-water vapor condensables”). The standard plume terminology illustrated in figure 4 of section 3.12 of vol. III of EPA QA handbook, may be used to describe plume behavior. The behavior is generally used to determine the atmospheric stability at the time of the VE Observations.
3.6.2 EMISSION COLOR (*) Note the color of the emissions. The plume color can sometimes be useful in determining the compo- sition of the emissions and also serves to document the total contrast between the plume and its background as seen by the observer. For emissions that change color a number of times during the observation period (such as those from a basic oxygen furnace), changes should be noted in the comments space next to the opacity observations.
3.6.3 WATER DROPLET PLUME (*) If no visible water droplets are present, the “None” box should be checked. If visible water is present, check “Attached” if the condensation of the water in the plume occurs prior to exiting the emissions outlet, or check “Detached” if the condensation occurs some distance after the plume exits the emission outlet (in this case, the water droplet plume and the stack will not seem to be con- nected).
Plumes containing condensed water vapor (“water droplet plumes” or “condensing steam plumes”) are usually very white and billowy, and then wispy at the point of dissipation, where the opacity decreases rapidly from a high value (usually 100%) to 0 if there is no residual opacity contributed by contaminant in the plume.
To document the presence or absence of condensed water vapor in the plume, two points must be addressed. First, is sufficient moisture present (condensed or uncondensed) in the effluent to produce water droplets at in-stack or ambient conditions? Second, if enough moisture is present are the in- stack and ambient conditions such that it will condense either before exiting the stack or after exiting (when it meets the ambient air)? The first question can be answered by examining the process type and/or the treatment of the efjnuent gas tier the process. Some common sources of moisture in the plume are: -Water produced by combustion of fuels, -Water from dryers, -Water introduced by wet scrubbers, -Water introduced for gas cooling prior to an electrostatic precipitator or other control device, -Water used to control the temperature of chemical reactions, and -Water from dust suppression systems.
If water is present in the plume, data from a sling psychrometer, which measures ambient temperature and relative humidity, in combination with the moisture content and temperature of the effluent gas can be used to predict whether the formation of a steam plume is probable.

3.7 OBSERVATION CONDITIONS This section covers the background and ambient weather conditions that occur during the observation period and could effect observed opacity.
Dt3samPlulle0ockQrouna I
stw End Bnck~rolndcdor scycaditm
+rt End stcrt End W-jspeed whd Dhctbn
stai End stat End Aneent Temp. wet BLllb lemp. RI-t percent
3.7.1 DESCRIBE PLUME BACKGROUND (*) Describe the background that the plume is obscuring and against which the opacity is being read. When describing the background, include characteristics such as texture. Examples of background descriptions are “structure behind roof monitor,” “stand of pine trees,” “edge ofjagged stony hill side,” “ clear blue sky,” “stack scaffolding,” and building obscured by haze.”
3.72 BACKGROUND COLOR (*) Describe the background color including the shade of the color (e.g., new leaf green, conifer green, dark brick red, sky blue, and light grey stone). In general, the background chosen to read against should contrast with the color of the plume.
3.7.3 SKY CONDITIONS (*) Indicate the percent cloud cover of the sky. This information can be indicated by using straight percentages (e.g., 10% overcast, 100% overcast, etc.) or by description, as shown below
TERM AMOUNT OF CLOUD COVER
Clear < 10%
Scattered 10% - 50%
Broken 50% - 90%
Overcast > 90%
3.7.4 WIND SPEED (*) Record the wind speed. It is recommended that it be either measured, or estimated to the nearest 5 mph. The wind speed can be measured using a hand held anemometer, or it can be estimated using the Beaufort Scale of Wind Speed Equivalents shown below.
8

GENERAL DESCRIPTION SPECIFICATIONS LIMITS OF VELOCITY, MPH
Calm Smoke rises vertically. < 1 mph Direction of wind shown by l-3mph smoke drift but not by wind vanes.
Light Wmd felt on face, leaves 4-7mph rustle, ordinary vane moved by wind.
Gentle
Moderate
Leaves and small twigs in 8- 12mph constant motion, wind extends light flag.
Raises dust and loose paper, 12 - 18 mph small branches are moved.
Fresh . Small trees in leaf begin to 19-24 sway; crested wavelets form on inland waters.
3.7.5 WIND DIRECTION (*) Indicate the direction from which the wind is blowing. It is suggested that the direction should be estimated to one of the 8 points of the compass. This can be accomplished by observing the direction that the plume is blowing. If this is not possible, the wind direction may be determined by observing a blowing flag or by noting the direction that a few blades of grass or handful of dust are blown when tossed into the air. Keep in mind that the wind direction at the observation point may be different from that at the emission point or at the observer’s position. The wind direction at the emission and observation point are the ones of interest.
3.7.6 AMBIENT TEMPEIWIVRE (*) The outdoor temperature at the plant site is measured by a thermometer (in degrees Fahrenheit or Centigrade). Be certain to note which temperature scale is used. The ambient temperature is used in conjunction with the wet bulb temperature when there are indications of a condensing water droplet
. ’ plume.
3.7.7 WET BULB TEMPERATURE AND RELATIVE HUMIDITY Enter the relative humidity and wet bulb temperature measured by using a sling psychrometer. This information is used to determine if water vapor in the plume will condense to form a steam plume.
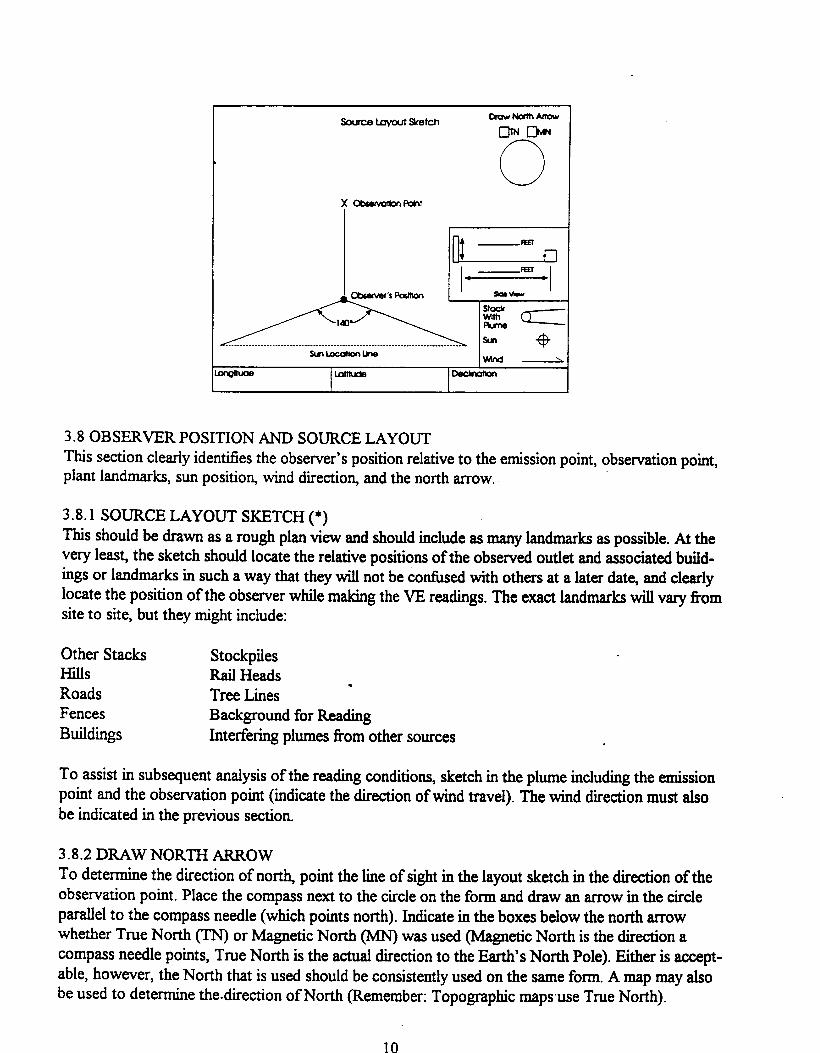
3.8 OBSERVER POSITION AND SOURCE LAYOUT This section clearly identifies the observer’s position relative to the emission point, observation point, plant landmarks, sun position, wind direction, and the north arrow.
3 3.1 SOURCE LAYOUT SKETCH (*) This should be drawn as a rough plan view and should include as many landmarks as possible. At the very least, the sketch should locate the relative positions of the observed outlet and associated build- ings or landmarks in such a way that they will not be confused with others at a later date, and clearly locate the position of the observer while making the VE readings. The exact landmarks will vary from site to site, but they might include:
Other Stacks Stockpiles Hills Rail Heads Roads Tree Lines * Fences Background for Reading Buildings Interfering plumes from other sources .
To assist in subsequent analysis of the reading conditions, sketch in the plume including the emission point and the observation point (indicate the direction of wind travel). The wind direction must also be indicated in the previous section.
3.82 DRAW NORTH ARROW To determine the direction of north, point the line of sight in the layout sketch in the direction of the observation point. Place the compass next to the circle on the form and draw an arrow in the circle parallel to the compass needle (which points north). Indicate in the boxes below the north anow whether True North (TN) or Magnetic North (MN) was used (Magnetic North is the direction a compass needle points, True North is the actual direction to the Earth’s North Pole). Either is accept- able, however, the North that is used should be consistently used on the same form. A map may aho be used to determine the-direction of North (Remember: Topographic mapsuse True North).
10

3.8.3 SUN’S LOCATION In order to perform VE Observations, the observer must have the sun in the 140” sector to his back. (This sector exists in both the horizontal and vertical planes.) The sun location line on the form ensures that the observer is within the 140” horizontal sector to the observer’s back. To draw the sun’s location, point the line of sight in the source layout sketch in the direction of the observation point. Move an upright pen along the “sun location line” until the shadow of the pen falls across the obsewer’s position. Then draw the sun at this point along the “sun location line”.
3.8.4 SIDE VIEW In the top blank, fill in the approximate stack height in feet above the ground level of the observer. The lower blank will contain the approximate number of feet from the observer to the stack base.
3.8.5 LONGITUDE AND LATITUDE The longitude and latitude of the facility being measured are recorded in these blanks. This information can be obtained corn topographic maps or nearby airports. This information is necessary to confirm that the sun was within a 140” sector to the observer’s back.
3.8.6 DECLINATION The declination is the number of degrees and direction that True North varies from Magnetic North. The declination in North America can be more than 20”. This information is needed for verifying calculations.
3.9 ADDITIONAL INFORMATION Note conditions or deviations of a factual nature that can not be addressed elsewhere on the form such as in the comments section of the data set. These must be purely factual in nature and specific to the particular source. It is suggested that these comments be included in a separate dated memo, and be referenced in this section. Examples of information that may be included in this section are: -Description of unusual stack configuration (to show multiple stacks, or stack in relation to a roof line); a drawing may be attached if necessary. -Observed or reported changes to the emissions or process during observation that are not noted in the comments area of the form. -Additional source identification information. -Descriptions of unusual emission events, such as unusual additions of a waste fuel having markedly different combustion characteristics to a boiler immediately prior to or during the observation period. The last example would likely only be known as the result of a voluntary disclosure of such information by the source’s representative.
AddthaI htomdim
Photographs to document stack configuration or unusual vents are often quite helpful in clarifj6ng an emission situation.
3.10 FORMNUMBERING This information is used to ensure that documents are identified correctly and multiple page documents are kept together.
11

3.10.1 FORMNUMBER Fill in the 5 digit number identifying the VEO Form. Continuing observations on subsequent forms should have sequential numbers.
3.10.2 PAGE X OF X Fill in the total number of VEOF pages that make up one observation as well as the specific page number of the current VEOF (e.g., the second page in a 3 page Observation would be page 2 of 3).
3.10.3 co NTINUED ON VEO FORM NUMBER If the observation consists of more than one page,Indicate the number of the form that the observa- tions in this set were continued on. This should be the next number in sequence after the current VEO Form number.
3.11 DATA SET FOR USE WITH METHOD 9, METHOD 203A, OR METHOD 203B The data recording section on VEO Form 1 is for use with the 15 second interval methods, Methods 9,203A and 203B. The table for Method 203C is provided on VEO Form 2. This section also contains comment sections for the observations as well as dates and start and end times.
3.11.1 OBSERVATION DATE (*) Enter the date on which the opacity readings were taken.
3.11.2 TIME ZONE Enter the time zone in which the observations were taken. Make sure that daylight savings time/ standard time is noted (e.g., MST, EDT, PST, etc.).
3.11.3 STARTTIME/ENDTIME(*) Indicate the times at the beginning and end of the actual observation period. It is suggested that the observer use military, or 24 hour time to avoid confusion about am or pm.
3.11.4 DATA SET (*) Spaces are provided on VEOFl for entering an opacity reading every 15 seconds for up to a 30 minute observation. If observations continue beyond 30 minutes, additional form(s) may be used. The readings should be in percent opacity and recorded to the nearest 5 percent. The readings are entered from left to right for each numbered minute, beginning at the upper left hand comer of the left col-
12

umn, labeled row ‘WIN-l” and column “SEC 0” (0 seconds). The next readings are entered con- secutively in the space labeled h4IN 1, SEC 15; h4IN 1, SEC 30; MIN 1 SEC 45; MIN 2, SEC 0; MIN 2, SEC 15; etc..
If for any reason, a’ reading is not made for a particular 15.second period, a dash (0) should be placed in the space showing that the space is not just an oversight. The comment section beside the reading should be used for an explanation of why the reading was missed.
3.11.5 COMMENTS Spaces for comments are provided next to the data for each minute of opacity readings. These are intended to provide space to note changing observation conditions and/or reasons for missed readings in direct conjugation with the readings themselves. Items to be noted might include: -Changes in ambient conditions from the time of the start of the readings. -Changes in plume color, behavior, or other characteristics. -Presence of interfering plumes from other sources. -Changes in observer position and indication that a new form is initiated. -Conditions that might interfere with readings or cause them to be biased high or low. -Unusual process conditions. -Reasons for missed readings.
3.12 OBSERVER INFORMATION This is the information needed to validate the opacity data.
3.12.1 OBSERVER’S NAME (*) Print the observer’s entire name.
3.12.2 OBSERVER’S SIGNATURE Enter the observer’s legal signature.
3.12.3 DATE Enter the date on which the form was signed.
3.12.4 ORGANIZATION (*) Provide the name of the agency or company that employs the observer.
3.12.5 CERTIFIED BY Identify the agency, company, or other organization that conducted the “smoke school” or VE training and certification course where the observer obtained his/her current certification.
3.12.6 DATE (*) Provide the most recent date of certification.
13

4.0 VISIBLE EMISSION OBSERVATION FORM 2 (VEOF2) This form is for use with method 203C.
4.1 FORM COMPARISON The first 10 sections are identical to VEOFl. The final section containing observer identification and certification is also the same. The only section that differs is the data collection itself The area for data collection has been rotated so that when placed on a clipboard, recording the data set is as unencumbered as possible.
4.2 DATA SET FOR USE WITH METHOD 203C This section contains space for opacity readings for the observation period, organized by minute and second. The readings are taken every 5 seconds. This section also includes the actual date, start, and end times as well as space for relevant comments.
4.2.1 OBSERVATION DATE (*) Enter the date on which opacity observations were made.
4.2.2 TIME ZONE Enter the time zone in which the observations were taken. Make sure that daylight savings time/ standard time is noted (e.g., MST, EDT, PST, etc.).
42.3 START TIME /END TIME (*) Indicate the times at the beginning and end of the actual observation period. It is suggested that the observer use military time, or 24 hour time to avoid confusion about am or pm.
14

4.2.4 DATA SET (*) Spaces are provided on the VEOF for entering an opacity reading every 5 seconds for up to a 10 minute observation. If observations continue beyond 10 minutes, additional form(s) may be used. The readings should be,i.n percent opacity and recorded to the nearest 5 percent. The readings are entered from left to right for each numbered minute, beginning at the upper left hand comer of the left column, labeled row “MI%1 ” and column “SEC 0” <O seconds). The next readings are entered consecutively in the space labeled MIN 1, SEC 5; MlN 1, SEC 10; MIN 1 SEC 15; MIN 1, SEC 20; MIN 1, SEC 25; etc..
If for any reason, a reading is not made for a particular 5-second period, a dash (0) should be placed in the space showing that the space is not just an oversight. The comment section beside the reading should be used for an explanation of why the reading was missed.
4.2.5 TOTAL OPACITY Here, all the readings for the minute should be added together, and the total put into the box.
42.6 NUMBER OF READINGS This block will usually contain the number 12, unless there were readings missed for any reason.
4.2.7 AVERAGE The total opacity will be divided by the number of readings to arrive at the average opacity for that minute.
4.2.8 COMMENTS Spaces for comments are provided next to the data for each minute of opacity readings. These are intended to provide space to note changing observation conditions and/or reasons for missed readings in direct conjugation with the readings themselves. Items to be noted might include: -Changes in ambient conditions from the time of the start of the readings. -Changes in plume color, behavior, or other characteristics. -Presence of interfering plumes from other sources. -Changes in observer position and indication that a new form is initiated. -Conditions that might interfere with readings or cause them to be biased high or low. Unusual process conditions. -Reasons for missed readings.
5.0 DATA REDUCTION FORM
5.1 SOURCE IDENTIFICATION This information should be filled in exactly as it is on the VEOF that is being analyzed.
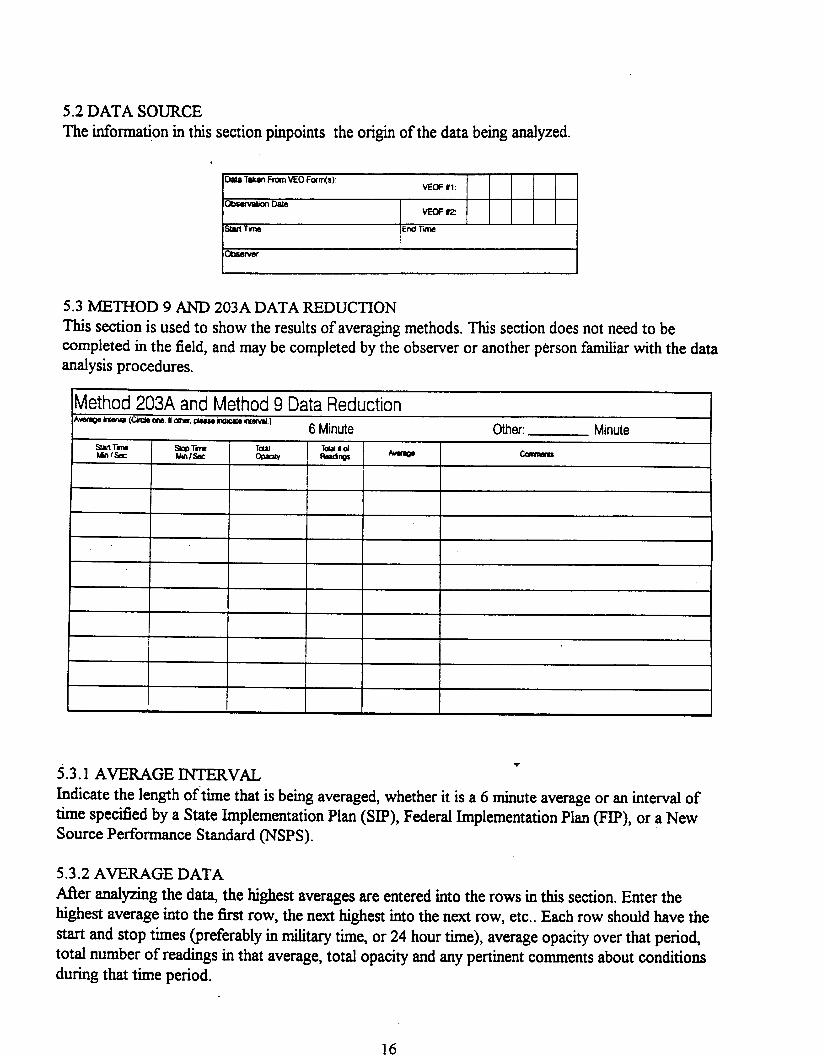
5.2 DATA SOURCE The informauon in this section pinpoints the origin of the data being analyzed.
I
oah Taken Fmn VEO Forms VEcF~l:
otsuvallonme vEOFt2
StMTltlW End Tii
5.3 METHOD 9 AND 203A DATA REDUCTION This section is used to show the results of averaging methods. This section does not need to be completed in the field, and may be completed by the observer or another person familiar with the data analysis procedures.
Method 203A and Method 9 Data Reduction AwaQe hefw usrcls am Ii omcr. pbsse ndulr lmwba.)
6 Minute Minute
5.3.1 AVERAGE INTERVAL 7
Indicate the length oftime that is being averaged, whether it is a 6 minute average or an interval of time specified by a State Implementation Plan (SIP), Federal Implementation Plan (FIP), or a New Source Performance Standard (NSPS).
5.3.2 AVERAGE DATA Aver analyzing the data, the highest averages are entered into the rows in this section. Enter the highest average into the fist row, the next highest into the next row, etc.. Each row should have the start and stop times (preferably in military time, or 24 hour time), average opacity over that period, total number of readings in that average, total opacity and any pertinent comments about conditions during that time period.
16
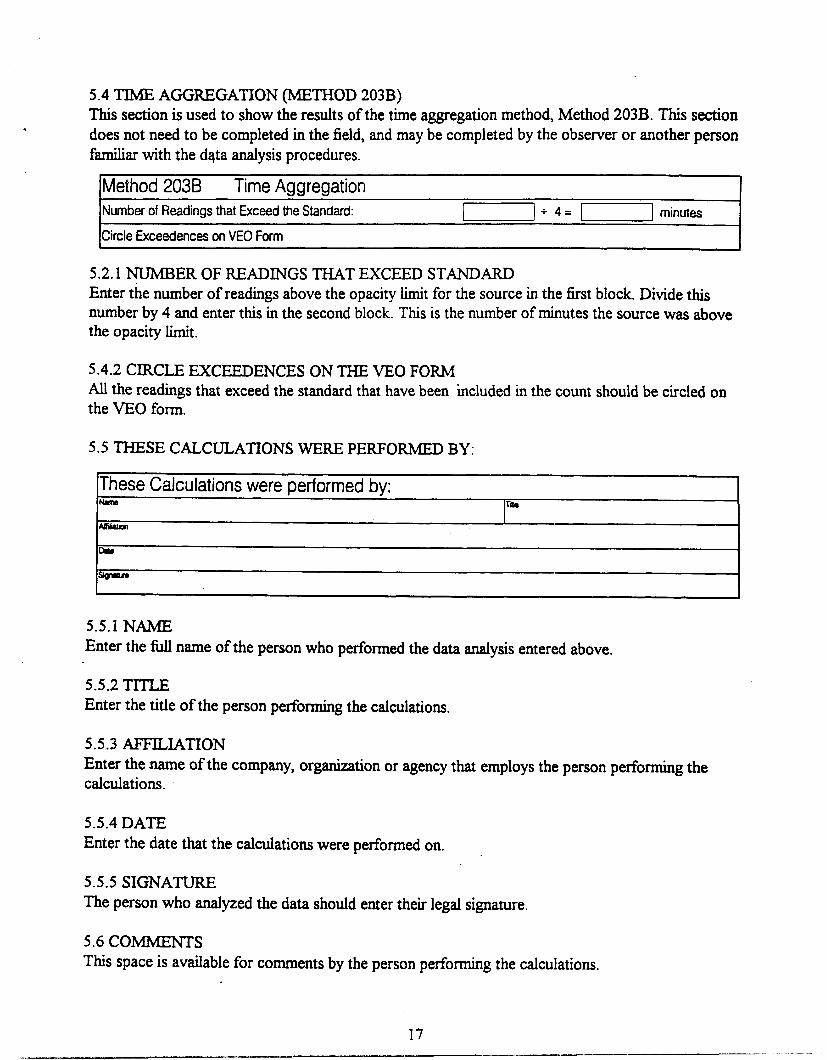
5.4 TIME AGGREGATION (METHOD 203B) This section is used to show the results of the time aggregation method, Method 203B. This section does not need to be completed in the field, and may be completed by the observer or another person familiar with the data analysis procedures.
t Method 203B Time Aggregation Number of Readings that Exceed the Standard: [-I+ 4 = 71 minutes
Circle Exceedences on VEO Form
5.2.1 NUMBER OF READINGS THAT EXCEED STANDARD Enter the number of readings above the opacity limit for the source in the first block. Divide this number by 4 and enter this in the second block. This is the number of minutes the source was above the opacity limit.
5.42 CIRCLE EXCEEDENCES ON THE VEO FORM All the readings that exceed the standard that have been ‘included in the count should be circled on the VEO form.
5.5 THESE CALCULATIONS WERE PERFORMED BY:
These Calculations were performed by:
5.5.1 NAME Enter the full name of the person who performed the data analysis entered above.
5.5.2 TITLE Enter the title of the person performing the calculations.
5.5.3 AFFILIATION Enter the name of the company, organization or agency that employs the person performing the calculations.
5.5.4 DATE Enter the date that the calculations were performed on.
5.5.5 SIGNATURE The person who analyzed the data should enter their legal signature.
5.6 COMMENTS This space is available for comments by the person performing the calculations.