epidemiology of gastroesophageal reflux disease in iran: a
TRANSCRIPT

RESEARCH ARTICLE Open Access
Epidemiology of gastroesophageal refluxdisease in Iran: a systematic review andmeta-analysisMohammad Karimian1, Hassan Nourmohammadi2, Majid Salamati1, Mohammad Reza Hafezi Ahmadi3,Fatemeh Kazemi4 and Milad Azami5*
Abstract
Background: Gastroesophageal reflux disease (GERD), which leads to acid reflux into the esophagus, is a commongastrointestinal disorder. Several studies have shown the prevalence of GERD in Iranian population, but theirevidence is contradictory. Therefore, the present study was conducted to investigate the epidemiology of GERD inIran.
Methods: The entire steps of this systematic review and meta-analysis were based on the MOOSE protocol, andthe results were reported accordance with the PRISMA guideline. This review is registered on PROSPERO(registration number: CRD42020142861). To find potentially relevant published articles, comprehensive search wasdone on international online databases Scopus, Science Direct, EMBASE, PubMed/Medline, CINAHL, EBSCO,Cochrane Library, Web of Science, Iranian online databases and the Google Scholar search engine in June 2019.Cochran test and I2 index were used to assess the heterogeneity of the studies. Data were analyzed usingComprehensive Meta-Analysis software ver. 2. The significance level of the test was considered to be P < 0.05.
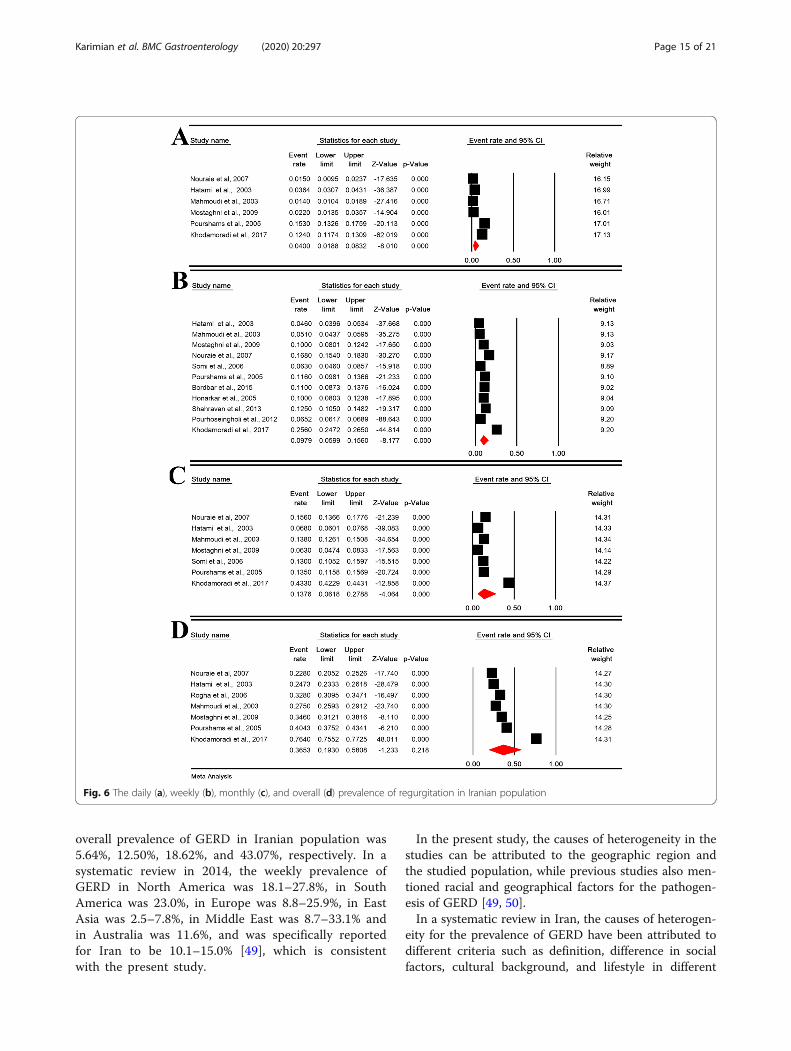
Results: The daily, weekly, monthly, and overall prevalence of GERD symptoms in Iranian population was 5.64%(95%CI [confidence interval]: 3.77–8.35%; N = 66,398), 12.50% (95%CI: 9.63–16.08%; N = 110,388), 18.62% (95%CI:12.90–26.12%; N = 70,749) and 43.07% (95%CI: 35.00–51.53%; N = 73,189), respectively. The daily, weekly, monthly,and overall prevalence of heartburn in Iranian population was 2.46% (95%CI: 0.93–6.39%; N = 18,774), 9.52% (95%CI:6.16–14.41%; N = 54,125), 8.19% (95%CI: 2.42–24.30%; N = 19,363) and 23.20% (95%CI: 13.56–36.79%; N = 26,543),respectively. The daily, weekly, monthly, and overall prevalence of regurgitation in Iranian population was 4.00%(95%CI: 1.88–8.32%; N = 18,774), 9.79% (95%CI: 5.99–15.60%; N = 41,140), 13.76% (95%CI: 6.18–44.31%; N = 19,363)and 36.53% (95%CI: 19.30–58.08%; N = 21,174), respectively. The sensitivity analysis for prevalence of all types GERD,heartburn and regurgitation symptoms by removing a study showed that the overall estimate is still robust.
Conclusion: The present meta-analysis provides comprehensive and useful information on the epidemiology ofGERD in Iran for policy-makers and health care providers. This study showed a high prevalence of GERD in Iran.Therefore, effective measures on GERD-related factors such as lifestyle can be among the health policies of Iran.
Keywords: Epidemiology, Gastroesophageal reflux disease, Iran, Meta-analysis
© The Author(s). 2020 Open Access This article is licensed under a Creative Commons Attribution 4.0 International License,which permits use, sharing, adaptation, distribution and reproduction in any medium or format, as long as you giveappropriate credit to the original author(s) and the source, provide a link to the Creative Commons licence, and indicate ifchanges were made. The images or other third party material in this article are included in the article's Creative Commonslicence, unless indicated otherwise in a credit line to the material. If material is not included in the article's Creative Commonslicence and your intended use is not permitted by statutory regulation or exceeds the permitted use, you will need to obtainpermission directly from the copyright holder. To view a copy of this licence, visit http://creativecommons.org/licenses/by/4.0/.The Creative Commons Public Domain Dedication waiver (http://creativecommons.org/publicdomain/zero/1.0/) applies to thedata made available in this article, unless otherwise stated in a credit line to the data.
* Correspondence: [email protected] of Medicine, Ilam University of Medical Sciences, Ilam, IranFull list of author information is available at the end of the article
Karimian et al. BMC Gastroenterology (2020) 20:297 https://doi.org/10.1186/s12876-020-01417-6

BackgroundGastroesophageal reflux disease (GERD), which leadsto acid reflux into the esophagus, is a commongastrointestinal disorder and results in typical pain-ful symptoms such as heartburn and/or regurgita-tion [1]. However, it may also appear with atypicalsymptoms including cough, asthma, chest pain, andfatigue [2].Permanent acid reflux may cause more severe compli-
cations, including erosive esophagitis, esophageal stric-tures, Barrett’s esophagus, esophageal adenocarcinoma,hiatus hernia, delayed gastric emptying, and visceralhypersensitivity [1, 3–5].Several risk factors are associated with GERD, includ-
ing Nonsteroidal Anti-inflammatory Drugs (NSAIDs),type of food, beverages, smoking, family history, highbody mass index (BMI), physical activity, salt, or con-suming pickles with meals and fast food, which are moreassociated with the lifestyle of the patient [5–7]. It hasalso been shown that age, gender, pregnancy, and geo-graphical variation are also related to GERD [7]. Inaddition, it has been suggested that vertebral fracturesand/or spinal malalignment may affect the incidence ofGERD [8, 9]. In Iranian studies, consumption of NASIDsand pickle consumption, and smoking is more harmfulfactors [10, 11].A systematic review of longitudinal studies suggests that
the incidence of GERD has increased in recent decades. Ifthis trend continues, it may rapidly increase the seriouscomplications of GERD, affect the patient’s quality of life,and increase the cost of health care systems [12, 13].Increasing the GERD awareness to improve Iranian
people’s health may be necessary. There is much in-formation in Western cultures that can be general-ized to an Iranian person but cannot matchcompletely. Therefore, understanding the epidemio-logical effects of GERD in Iranian society can helphealthcare professionals and policymakers take thenext steps in creating the list of priorities for diseasemanagement.Several studies have shown the prevalence of GERD
in Iranian population, but their evidence is contra-dictory [10, 11, 14–39]. Therefore, a structured reviewof all the documentation and their combination canprovide a more complete picture of the dimensions ofthis disease in Iranian society. One of the main goalsof meta-analysis, which is a combination of differentstudies, is to reduce the difference between parame-ters due to the increased number of studies involvedin the analysis process. Another important goal ofmeta-analysis is to address inconsistencies in the re-sults and their causes [40–42]. Therefore, the presentstudy was conducted to investigate the epidemiologyof GERD in Iran.
MethodsStudy protocolThe entire steps of this systematic review and meta-analysis were based on the Meta-analyses Of Observa-tional Studies in Epidemiology (MOOSE) protocol [42],and the results were reported accordance with the Pre-ferred Reporting Items for Systematic Reviews and Meta-analysis (PRISMA) guideline [43]. Two authors independ-ently preformed all study steps. In the case of dispute, athird author was involved. We registered this review atPROSPERO (registration number: CRD42020142861),Available from: https://www.crd.york.ac.uk/prospero/dis-play_record.php?ID=CRD42020142861.
Search strategyTo find potentially relevant published articles, compre-hensive search was done on international online databasesScopus, Science Direct, EMBASE, PubMed/Medline,CINAHL, EBSCO, Cochrane Library (Cochrane Databaseof Systematic Reviews - CDSR), Web of Science and na-tional online databases Iranian Research Institute for In-formation Science and Technology (IranDoc) (https://irandoc.ac.ir), Scientific Information Database (SID)(http://www.sid.ir/), Magiran (http://www.magiran.com/),Regional Information Center for Science and Technology(RICST) (http://en.ricest.ac.ir/), Iranian National Library(http://www.nlai.ir/), and Barakat Knowledge NetworkSystem (http://health.barakatkns.com) and the GoogleScholar search engine in June 2019. Our search was doneto retrieve all literature related to GERD in Iran. The ref-erence list of articles was reviewed to find the gray litera-ture. The studies identified by our search strategies wereentered into Endnote X7 (Thomson Reuters, Philadelphia,PA, USA) software.The related articles were searched in PubMed using a
combination of expressions and terms Medical SubjectHeading (MeSH): “gastroesophageal reflux”[MeSHTerms] OR “gastroesophageal reflux disease” [Text Word]OR “heartburn”[MeSH Terms] AND “Iran”[MeSH Terms].Search terms were combined using Boolean operators of“OR” or “AND”.
Study selectionThe two researchers independently reviewed the articleson the abovementioned databases. The third researcherexamined the consistency between the data extracted bythe two researchers, and the contradictory results werediscussed and resolved. After collecting literature fromthe databases, the next step was to assess whether thearticles corresponded to the content of the title and ab-stract. The second and third stages were the review ofthe remaining articles with full text.
Karimian et al. BMC Gastroenterology (2020) 20:297 Page 2 of 21

Inclusion and exclusion criteriaWe included the studies that were: (1) written in Englishor Persian; (2) cross-sectional studies; (3) with the pri-mary aim of reporting the prevalence of GERD, heart-burn and regurgitation; and (4) preformed among adults.We excluded studies that: (1) had non-random sample
size; (2) were non-relevant; (3) GERD diagnosis was notdefined by heartburn and regurgitation; (4) were non-Iranian; (5) were case reports, review articles, congresses,letters to the editor without quantitative data, andtheses.
Data extraction and managementIn case of duplicate publication, we contacted the re-searchers to clarify the original publication, and if wedid not get an answer, we chose the study with the lar-gest number of participants for cases with overlappingdata, if necessary, additional details were extracted fromthe secondary articles.We extracted the following data from each study: First
author, year of publication, year of study, place of study,study design, method of diagnosis, data collection, char-acteristics of participants and estimation of prevalence.
Qualitative assessmentThe modified Newcastle Ottawa Scale (NOS) was usedto assess the quality of studies [44]. The studies were di-vided into three categories based on the scores: high riskstudies (scores ranging from 1 to 4), moderate risk(scores ranging from 5 to 7), and low risk (scores ran-ging from 8 to 10). Low and medium risk studies wereincluded in the meta-analysis.
Statistical analysisThe prevalence of the GERD is shown using the eventrate. The 95% confidence intervals (CI) were calculatedusing Comprehensive Meta-Analysis (CMA) softwarever 2 using sample size (N) and standard error (SE). Todetermine women to men ratio, we calculated the oddsratio (OR). Cochran Q test and I2 index were used to as-sess the heterogeneity of the studies. There are threecategories for I2 index: I2 index below 25% is low hetero-geneity, 25–75% is medium, and above 75% is high het-erogeneity [45, 46]. For cases with low heterogeneity, thefixed effects model was used and for cases with mediumand high heterogeneity, the random effects model wasused. Subgroup analysis was used to find the cause ofheterogeneity in the studies. Sensitivity analysis was per-formed by removing a study at a time to assess the pre-dictive power. Mixed-effects meta-regression was usedto investigate the relationship between continuous vari-ables such as the time of study and the prevalence [47].Finally, distribution bias was evaluated using funnel plot,and Egger and Begg’s tests. Statistical analysis and graph
diagrams were performed using CMA version 2. The sig-nificance level of the test was considered to be P < 0.05.
ResultsSearch results and characteristicsOur initial search found 4260 records. After removing2130 duplicates, 2130 unique documents were reviewedfor relating the titles and abstract. Then, we reviewedthe full text of 101 articles. Finally, 30 articles (23 studiesfor GERD, 20 studies for heartburn, and 13 studies forregurgitation) were included in the study (Fig. 1). Themean age of the participants (in 14 reported studies) was39.35 years (95% CI: 34.98–43.71). Table 1 shows thecharacteristics of each study.
GERD prevalence and sensitivity analysisThe daily, weekly, monthly, and overall prevalence ofGERD symptoms in Iranian population was 5.64% (95%CI: 3.77–8.35%; heterogeneity: I2 = 98.76%, P < 0.001;N = 66,398), 12.50% (95% CI: 9.63–16.08%; heterogen-eity: I2 = 99.50%, P < 0.001; N = 110,388), 18.62% (95%CI: 12.90–26.12%; heterogeneity: I2 = 99.66%, P < 0.001;N = 70,749) and 43.07% (95% CI: 35.00–51.53%; hetero-geneity: I2 = 99.66%, P < 0.001; N = 73,189), respectively(Fig. 2).The sensitivity analysis for prevalence of all types
GERD symptoms by removing a study showed that theoverall estimate is still robust (Figure 1- supplementary).
Subgroup analysis of GERDThe subgroup analysis for the daily, weekly, monthly,and overall prevalence of GERD symptoms is shown inTable 2. For the daily prevalence of GERD, the subgroupanalysis of the study population (P < 0.001) and the datacollection method (P = 0.019) were significant. For theweekly prevalence of GERD, subgroup analysis of thearea (P = 0.001) and study population (P < 0.001) weresignificant. For the monthly prevalence of GERD, thesubgroup analysis of the study population was significant(P = 0.001). For the overall prevalence of GERD, the sub-group analysis of the area (P < 0.001), the study popula-tion (P < 0.001) and the quality of studies (P = 0.005)were significant. Other variables were not significant.
The prevalence of GERD by genderThe daily, weekly, monthly, and overall prevalence ofGERD symptoms in Iranian males was 5.72% (95% CI:3.41–9.46%; heterogeneity: I2 = 97.44%, P < 0.001; N =26,004), 11.38% (95% CI: 8.10–15.75%; heterogeneity:I2 = 97.80%, P < 0.001; N = 19,453), 15.68% (95% CI:10.67–22.45%; heterogeneity: I2 = 98.15%, P < 0.001;N = 8865) and 39.26% (95% CI: 32.35–46.62%; hetero-geneity: I2 = 99.04%, P < 0.001; N = 31,704) (Figure 2-supplementary).
Karimian et al. BMC Gastroenterology (2020) 20:297 Page 3 of 21

The daily, weekly, monthly, and overall prevalence ofGERD symptoms in Iranian females was 7.88% (95% CI:3.67–16.11%; heterogeneity: I2 = 98.56%, P < 0.001; N =31,588), 12.81% (95% CI: 9.47–17.10%; heterogeneity:I2 = 98.04%, P < 0.001; N = 19,380), 16.96% (95% CI:13.17–21.56%; heterogeneity: I2 = 98.17%, P < 0.001;N = 21,567), and 45.51% (95% CI: 38.22–52.99%; hetero-geneity: I2 = 98.99%, P < 0.001; N = 38,252) (Figure 3-supplementary).Odds ratio (OR) for the prevalence of daily, weekly,
monthly, and overall prevalence of GERD in womencompared to men in Table 2 shows that there is a sig-nificant difference only in the daily prevalence of GERD(P = 0.003).
Meta-regression and publication bias for prevalence ofGERDThe meta-regression model based on years of study forGERD prevalence revealed that the meta-regression co-efficient for daily, weekly, monthly, and overall preva-lence of GERD was (− 0.022, 95% CI: − 0.132 to 0.087,P= 0.688), (0.025, 95% CI: − 0.410 to 0.092, P= 0.450),(0.0140, 95% CI: − 0.057 to 0.085, P = 0.700) and (0.038,95% CI: − 0.081 to 0.085, P= 0.104), respectively (Fig. 3).Regarding publication bias, the significance level of
Egger and Begg’s tests was (Egger = 0.024 andBegg’s = 0.152), (Egger = 0.628 and Begg’s = 0.624),(Egger< 0.001 and Begg’s = 0.533) and (Egger = 0.002and Begg’s = 0.754) for the daily, weekly, monthly,
Fig. 1 PRISMA process
Karimian et al. BMC Gastroenterology (2020) 20:297 Page 4 of 21

Table 1 Summary of characteristics in studies into a meta-analysis
Ref. First author,Published Year
Year Place Population Mean Age(±SD)
Method Duration Sample size Quality
All Male Female
[15] Nouraie et al.,2007
2005 Tehran General population 36.1 ± 12.4 Questionnaire+ Interview
NR 1202 505 697 Mediumrisk
[16] Hatami et al.,2003
2001 Tehran Blood Donors 37.22 ± 0.19 Questionnaire+ Interview
12 M 3517 3115 402 Mediumrisk
[17] Rogha et al.,2006
2004 Isfahan General population 38.8 ± 12.9 Interview 12 M 2400 1074 1326 Mediumrisk
[18] Mahmoudi et al.,2012
2001 Tehran Medical students Questionnaire+ Interview
12 M 3008 1223 1785 Mediumrisk
[48] Ehsani et al.,2007
1991 Tehran General population Questionnaire+ Interview
NR 700 350 350 Low risk
[10] Mostaghni et al.,2009
2006 Fars Qashqai migratingnomad
43.1 ± 14.2 Questionnaire+ Interview
12 M 717 284 433 Low risk
[32] Aletaha et al.,2010
2005–6 GonbadKavoos,Kalale
General population 27.35 ± 6.1 Interview 12 M 1000 Mediumrisk
[33] Nasseri-Moghaddamet al., 2008
2006 Tehran General population 34.8 ± 13.0 Questionnaire+ Interview
12 M 2057 1132 Low risk
[34] Solhpour et al.,2008
2006 Damavand,Firoozkouh
General population 37.9 ± 14.3 Questionnaire+ Interview
3 M 5733 2935 2798 Mediumrisk
[15] Nouraie et al.,2007
2005 Tehran General population Questionnaire+ Interview
6 M 2561 1083 1478 Mediumrisk
[35] Saberi et al.,2010
2008–9 Kashan Shift working nurses Questionnaire 4 W 160 Low risk
[31] Saberi-Firoozi Met al., 2007
2004 Shiraz General population 49.9 ± 11.14 Questionnaire+ Interview
12 M 1978 582 1396 Low risk
[19] Somi et al., 2006 2005 Tabriz Medical sciences studen 22.48 ± 1.98 Questionnaire+ Interview
12 M 589 Mediumrisk
[36] Hoseini-assalet al., 2004
2002 Shahrekord General population 37.9 ± 14.3 Interview 12 M 4762 2045 2717 Mediumrisk
[20] Pourshams et al.,2005
2002 Gonabad General population Interview 12 M 1066 450 616 Low risk
[21] Bordbar et al.,2015
2013 BandarAbbas
medical sciencesstudents
Questionnaire 12 M 600 220 380 Mediumrisk
[37] Vakhshoori et al.,2018
2010–12
Isfahan Staff of IsfahanUniversity of MedicalSciences
36.53 Questionnaire 3 M 4669 Low risk
[11] Vossoughiniaet al., 2014
2010 Mashhad General population Questionnaire NR 1685 Low risk
[27] Shahravan et al.,2013
2003 Sari General population 38.4 Questionnaire 12 M 901 433 468 Mediumrisk
[22] Pourhoseingholiet al., 2012
2006–7 Tehran General population 38.7 ± 17.1 Questionnaire+ Interview
3 M 18,180 9108 9072 Low risk
[38] Mansour-Ghanaei et al.,2013
2010 Rasht General population 38.31 ± 13.09 Questionnaire+ Interview
NR 1473 453 1020 Low risk
[30] Khodamoradiet al., 2017
2010 Fars General population 52.6 ± 9.7 Questionnaire+ Interview
12 M 9264 4276 4988 Low risk
[39] Islami et al., 2014 2004–8 Golestan General population 36.1 ± 12.4 Questionnaire+ Interview
12 M 49,975 21,216 28,785 Low risk
SD standard deviation, NR not reported
Karimian et al. BMC Gastroenterology (2020) 20:297 Page 5 of 21

Fig. 2 The daily (a), weekly (b), monthly (c), and overall (d) prevalence of GERD symptoms in Iranian population
Karimian et al. BMC Gastroenterology (2020) 20:297 Page 6 of 21

Table 2 Subgroup analysis of prevalence of GERD
Variable Studies(N)
Sample (N) Heterogeneity 95% CI Pooledprevalence(%)
Total subjects Event I2 P-Value
Daily Areas Center 6 12,884 680 98.44 < 0.001 2.37–8.47 4.52
East 2 2066 254 98.54 < 0.001 3.21–29.70 10.58
North 2 51,448 5947 98.98 < 0.001 1.09–23.40 5.48
Test for subgroup differences: Q = 1.559, df(Q) = 2, P = 0.459
Population Blood donors 1 3517 165 – – 4.05–5.45 4.70
General population 8 59,873 6653 98.18 < 0.001 4.51–9.45 6.56
Health care worker 1 3008 63 – – 1.64–2.68 2.10
Test for subgroup differences: Q = 38.389, df(Q) = 2, P < 0.001
Year of studies 1991–2004 6 11,691 849 98.65 < 0.001 4.03–13.07 7.37
2005–2013 4 54,707 6032 99.01 < 0.001 1.20–10.51 3.64
Test for subgroup differences: Q = 1.256, df(Q) = 1, P = 0.263
Quality of studies Low risk 5 55,271 6282 98.52 < 0.001 4.21–12.39 7.31
Moderate risk 5 11,127 600 98.46 < 0.001 2.08–8.54 4.26
Test for subgroup differences: Q = 1.380, df(Q) = 1, P = 0.240
Method of data collection Questionnaire + Interview 7 61,932 6337 99.06 < 0.001 2.14–7.81 4.12
Interview 3 4466 545 98.91 < 0.001 6.53–18.38 11.14
Test for subgroup differences: Q = 5.488, df(Q) = 1, P = 0.019
Sex The odds ratio of females to males: 1.503 (95% CI: 1.153–1.59, P = 0.003); Heterogeneity: I2: 68.49%, P = 0.013
Weekly Areas Center 9 42,825 4880 99.34 < 0.001 7.92–15.92 11.31
East 2 2066 258 0 0.784 11.15–14.01 12.51
North 4 52,938 4317 91.08 < 0.001 7.04–11.38 8.98
South 4 12,559 2955 97.89 < 0.001 15.22–28.89 21.26
Test for subgroup differences: Q = 17.025, df(Q) = 3, P = 0.001
Population Blood donors 1 3517 197 – – 4.89–6.41 5.60
General population 14 98,005 10,770 99.69 < 0.001 10.07–17.91 13.52
Health care worker 4 8866 1443 99.20 < 0.001 5.17–7.39 11.44
Test for subgroup differences: Q = 29.288, df(Q) = 2, P < 0.001
Year of studies 1991–2004 8 14,570 1453 97.25 < 0.001 7.86–13.56 10.37
2005–2013 11 95,818 10,957 99.70 < 0.001 9.95–20.04 14.27
Test for subgroup differences: Q = 1.947, df(Q) = 1, P = 0.163
Quality of studies Low risk 10 90,079 10,262 99.71 < 0.001 9.85–20.74 14.47
Moderate risk 9 20,309 2149 98.26 < 0.001 7.65–14.46 10.58
Test for subgroup differences: Q = 1.544, df(Q) = 1, P = 0.214
Method of data collection Interview 3 4466 568 0 0.892 11.77–13.73 12.72
Questionnaire 3 6170 1313 96.95 < 0.001 10.71–25.45 16.83
Questionnaire + Interview 13 99,752 10,529 99.61 < 0.001 8.38–15.92 11.63
Test for subgroup differences: Q = 1.815, df(Q) = 2, P = 0.404
Sex The odds ratio of females to males: 1.174 (95% CI: 0.974–1.414, P = 0.092); Heterogeneity: I2: 91.63%,P < 0.001
Monthly Areas Center 7 17,646 3591 97.55 < 0.001 15.36–22.91 18.84
East 1 1066 161 – – 13.86–16.42 15.10
North 3 52,037 20,720 99.64 < 0.001 6.22–46.66 19.42
Test for subgroup differences: Q = 3.177, df(Q) = 2, P = 0.204
Karimian et al. BMC Gastroenterology (2020) 20:297 Page 7 of 21

and overall prevalence of GERD, respectively (Figure4-supplementary).
Heartburn prevalence and sensitivity analysisThe daily, weekly, monthly, and overall prevalence ofheartburn in Iranian population was 2.46% (95% CI: 0.93–
6.39%; heterogeneity: I2 = 99.15%, P < 0.001; N = 18,774),9.52% (95% CI: 6.16–14.41%; heterogeneity: I2 = 99.58%,P < 0.001; N = 54,125), 8.19% (95% CI: 2.42–24.30%; het-erogeneity: I2 = 99.76%, P < 0.001; N = 19,363) and23.20% (95% CI: 13.56–36.79%; heterogeneity: I2 =99.77%, P < 0.001; N = 26,543), respectively (Fig. 4).
Table 2 Subgroup analysis of prevalence of GERD (Continued)
Variable Studies(N)
Sample (N) Heterogeneity 95% CI Pooledprevalence(%)
Total subjects Event I2 P-Value
Population Blood donors 1 3517 795 98.91 < 0.001 21.25–24.01 22.60
General population 8 63,635 23,110 99.71 < 0.001 12.44–28.62 19.27
Health care worker 2 3597 567 98.23 < 0.001 11.92–18.40 14.87
Test for subgroup differences: Q = 14.531, df(Q) = 2, P = 0.001
Year of studies 1991–2004 6 15,453 3323 95.89 < 0.001 17.14–23.54 20.15
2005–2013 5 55,296 21,149 99.70 < 0.001 7.27–34.71 16.95
Test for subgroup differences: Q = 0.181, df(Q) = 1, P = 0.671
Quality of studies Low risk 5 55,271 21,159 99.70 < 0.001 7.82–35.92 17.90
Moderate risk 6 15,478 3313 96.03 < 0.001 16.42–22.85 19.43
Test for subgroup differences: Q = 0.042, df(Q) = 1, P = 0.838
Method of data collection Interview 3 8228 1891 97.45 < 0.001 15.89–26.03 20.50
Questionnaire + Interview 8 62,521 22,581 99.70 < 0.001 10.79–28.45 17.99
Test for subgroup differences: Q = 0.233, df(Q) = 1, P = 0.637
Sex The odds ratio of females to males: 1.126 (95% CI: 0.849–1.494, P = 0.411); Heterogeneity: I2: 96.68%,P < 0.001
Overall Areas Center 6 12,884 4823 97.38 < 0.001 32.01–42.62 37.16
East 1 1066 493 – – 43.26–49.24 46.24
North 1 49,975 30,415 – – 60.43–61.26 60.86
South 1 9264 5419 – – 57.49–59.50 58.50
Test for subgroup differences: Q = 169.751, df(Q) = 3, P < 0.001
Population Blood donors 1 3517 1157 – – 31.37–34.47 32.90
General population 7 66,664 38,913 99.43 < 0.001 38.49–53.12 45.71
Health care worker 1 3008 1080 99.09 < 0.001 34.20–37.63 35.90
Test for subgroup differences: Q = 16.155, df(Q) = 2, P < 0.001
Year of studies 1991–2004 5 10,691 4124 97.26 < 0.001 34.36–46.09 40.09
2005–2013 4 62,498 37,026 99.59 < 0.001 37.71–56.28 46.89
Test for subgroup differences: Q = 1.458, df(Q) = 1, P = 0.227
Quality of studies Low risk 5 63,062 37,471 99.15 < 0.001 43.12–56.23 49.67
Moderate risk 4 10,127 3679 98.20 < 0.001 28.59–42.77 35.36
Test for subgroup differences: Q = 8.008, df(Q) = 1, P = 0.005
Method of data collection Questionnaire + Interview 7 69,723 39,541 99.73 < 0.001 32.71–52.17 42.14
Interview 2 3466 1609 0 < 0.001 44.76–48.08 46.42
Test for subgroup differences: Q = 0.692, df(Q) = 1, P = 0.406
Sex The odds ratio of females to males: 1.111 (95% CI: 0.888–1.391, P = 0.358); Heterogeneity: I2: 97.96%,P < 0.001
CI Confidence intervals, N number
Karimian et al. BMC Gastroenterology (2020) 20:297 Page 8 of 21

Fig. 3 The meta-regression model based on years of study for daily (a), weekly (b), monthly (c), and overall (d) prevalence of GERD
Karimian et al. BMC Gastroenterology (2020) 20:297 Page 9 of 21

The sensitivity analysis for prevalence of all typesheartburn symptoms by removing a study showedthat the overall estimate is still robust (Figure 5-Supplement).
Subgroup analysis of heartburnFor the daily prevalence of heartburn, the subgroup ana-lysis of the area (P < 0.001), study population(P < 0.001), the quality of studies (P < 0.001) andmethod of data collection (P = 0.007) were significant(Table 3). For the weekly prevalence of heartburn,
Fig. 4 The daily (a), weekly (b), monthly (c), and overall (d) prevalence of heartburn in Iranian population
Karimian et al. BMC Gastroenterology (2020) 20:297 Page 10 of 21

Table 3 Subgroup analysis of prevalence of heartburn
Variable Studies(N)
Sample (N) Heterogeneity 95% CI Pooledprevalence(%)
Total subjects Event I2 P-Value
Daily Areas Center 3 7727 98 89.58 < 0.001 0.48–2.13 1.02
East 1 1066 136 – – 10.92–14.94 12.80
South 2 9981 1294 98.10 < 0.001 0.23–39.75 3.78
Test for subgroup differences: Q = 46.616, df(Q) = 2, P < 0.001
Population Blood donors 1 3517 67 – – 1.50–2.41 1.90
General population 4 12,249 1438 97.67 < 0.001 1.86–7.92 3.88
Health care worker 1 3008 24 – – 0.54–1.19 0.80
Test for subgroup differences: Q = 19.304, df(Q) = 2, P < 0.001
Year of studies 1998–2005 4 8793 235 98.02 < 0.001 0.42–8.35 1.93
2006–2015 2 9981 1294 98.10 < 0.001 0.23–39.75 3.78
Test for subgroup differences: Q = 0.672, df(Q) = 1, P = 0.672
Quality of studies Low risk 3 11,047 1431 98.84 < 0.001 4.27–12.53 7.40
Moderate risk 3 7727 98 89.58 < 0.001 0.48–2.13 1.02
Test for subgroup differences: Q = 17.950, df(Q) = 1, P < 0.001
Method of data collection Questionnaire + Interview 5 17,708 1392 99.31 < 0.001 0.37–7.43 1.69
Interview 1 1066 136 – – 10.92–14.94 12.80
Test for subgroup differences: Q = 7.342, df(Q) = 1, P = 0.007
Sex The odds ratio of females to males: 1.211 (95% CI: 0.915–1.602, P = 0.180); Heterogeneity: I2: 0%, P = 0.829
Weekly Areas Center 7 35,634 3014 99.66 < 0.001 4.38–16.29 8.62
East 1 1066 96 – – 7.42–10.87 9.00
North 3 5697 181 90.56 < 0.001 2.04–5.97 3.50
South 4 11,318 2668 97.75 < 0.001 10.64–25.31 16.37
West 1 410 123 – – 25.85–34.72 30.10
Test for subgroup differences: Q = 131.724, df(Q) = 4, P < 0.001
Population Blood donors 1 3517 81 – – 1.85–2.85 2.30
General population 11 45,674 5633 99.65 < 0.001 7.14–18.48 11.66
Health care worker 3 4197 180 97.84 < 0.001 1.60–13.25 4.74
injured people of B 1 737 188 – – 22.48–28.77 25.50
Test for subgroup differences: Q = 364.779, df(Q) = 3, P < 0.001
Year of studies 1991–2004 8 16,586 948 99.03 < 0.001 2.86–10.91 5.66
2005–2013 8 37,539 5133 99.70 < 0.001 8.94–25.47 15.48
Test for subgroup differences: Q = 5.330, df(Q) = 1, P = 0.021
Quality of studies Low risk 6 32,832 3913 99.76 < 0.001 5.58–24.24 12.08
Moderate risk 10 21,296 2169 99.39 < 0.001 4.36–14.88 8.19
Test for subgroup differences: Q = 0.614, df(Q) = 1, P = 0.433
Method of data collection Interview 2 4100 357 0 0.690 7.88–9.61 8.71
Questionnaire 4 7001 1432 98.09 < 0.001 8.76–24.18 14.90
Questionnaire + Interview 10 43,024 4292 99.70 < 0.001 4.11–15.09 8.03
Test for subgroup differences: Q = 3.897, df(Q) = 2, P = 0.142
Sex The odds ratio of females to males: 1.678 (95% CI: 1.105–2.548, P = 0.015); Heterogeneity: I2: 80.16%,P < 0.001
Monthly Areas Center 3 7727 423 94.26 < 0.001 3.46–7.91 5.26
East 1 1066 119 – – 9.44–13.24 11.20
Karimian et al. BMC Gastroenterology (2020) 20:297 Page 11 of 21

subgroup analysis of the area (P = 0.001), study population(P < 0.001) and year of study (P = 0.021) were significant(Table 3). For the monthly prevalence of heartburn, thesubgroup analysis of the area (P < 0.001) and population(P = 0.044) was significant (Table 3). For the overall preva-lence of heartburn, the subgroup analysis of the area (P =
0.019), and the study population (P < 0.001) were signifi-cant (Table 3). Other variables were not significant.
The prevalence of heartburn by genderThe daily, weekly, monthly, and overall prevalence ofheartburn in Iranian males was 2.61% (95% CI: 0.59–
Table 3 Subgroup analysis of prevalence of heartburn (Continued)
Variable Studies(N)
Sample (N) Heterogeneity 95% CI Pooledprevalence(%)
Total subjects Event I2 P-Value
North 1 589 30 – – 3.59–7.20 5.10
South 2 9981 4256 99.60 < 0.001 1.14–77.24 16.49
Test for subgroup differences: Q = 27.0761, df(Q) = 3, P < 0.001
Population Blood donors 1 3517 144 – – 3.49–4.81 4.10
General population 4 12,249 4432 99.69 < 0.001 2.40–38.88 11.11
Health care worker 2 3597 253 74.63 < 0.001 4.44–9.07 6.37
Test for subgroup differences: Q = 6.229, df(Q) = 2, P = 0.044
Year of studies 1991–2004 5 9382 573 95.15 < 0.001 4.16–8.93 6.12
2005–2013 2 9981 4256 99.60 < 0.001 1.14–77.24 16.49
Test for subgroup differences: Q = 0.571, df(Q) = 1, P = 0.450
Quality of studies Low risk 3 11,047 4375 99.66 < 0.001 2.96–48.85 14.57
Moderate risk 4 8316 453 91.48 < 0.001 3.71–7.31 5.23
Test for subgroup differences: Q = 1.582, df(Q) = 1, P = 0.208
Method of data collection Interview 1 1066 119 – – 9.44–13.24 11.20
Questionnaire + Interview 6 18,297 4709 99.81 < 0.001 1.90–26.74 7.76
Test for subgroup differences: Q = 0.288, df(Q) = 1, P = 0.592
Sex The odds ratio of females to males: 1.282 (95% CI: 1.282–1.729, P < 0.001); Heterogeneity: I2: 16.13%, P =0.311
Overall Areas Center 6 15,496 3022 99.35 < 0.001 11.70–27.69 18.38
East 1 1066 352 – – 30.26–35.90 33.02
South 2 9981 5370 99.65 < 0.001 10.39–73.94 36.45
Test for subgroup differences: Q = 7.973, df(Q) = 2, P = 0.019
Population Blood donors 1 3517 369 – – 7.54–9.38 8.42
General population 6 15,349 6827 99.62 < 0.001 16.36–44.01 28.17
Health care worker 2 7677 1621 98.17 < 0.001 14.06–27.99 20.14
Test for subgroup differences: Q = 34.143, df(Q) = 2, P < 0.001
Year of studies 1991–2004 6 11,893 2258 99.39 < 0.001 11.40–31.36 19.52
2005–2013 3 14,650 6486 99.85 < 0.001 13.15–59.27 31.94
Test for subgroup differences: Q = 0.996, df(Q) = 1, P = 0.318
Quality of studies Low risk 4 15,716 6838 99.83 < 0.001 16.21–53.86 32.22
Moderate risk 5 10,827 1906 99.45 < 0.001 9.22–30.35 17.38
Test for subgroup differences: Q = 1.908, df(Q) = 1, P = 0.167
Method of data collection Interview 2 3466 1096 99.44 < 0.001 29.86–33.66 31.73
Questionnaire 2 5369 1394 98.69 < 0.001 18.00–48.35 31.19
Questionnaire + Interview 5 17,708 6254 99.87 < 0.001 5.54–49.93 17.66
Test for subgroup differences: Q = 1.148, df(Q) = 2, P = 0.505
Sex The odds ratio of females to males: 1.414 (95% CI: 1.093–1.829, P = 0.008); Heterogeneity: I2: 79.84%, P = 0.002
CI Confidence intervals, N number
Karimian et al. BMC Gastroenterology (2020) 20:297 Page 12 of 21

10.75%; heterogeneity: I2 = 98.19%, P < 0.001; N = 4778),5.68% (95% CI: 1.81–16.44%; heterogeneity: I2 = 98.69%,P < 0.001; N = 7257), 5.93% (95% CI: 3.93–8.84%; het-erogeneity: I2 = 89.65%, P < 0.001; N = 4788) and 16.54%(95% CI: 10.9–24.28%; heterogeneity: I2 = 96.43%,P < 0.001; N = 1788) (Figure 6-supplementary).The daily, weekly, monthly, and overall prevalence of
heartburn in Iranian females was 2.90% (95% CI: 0.36–19.95%; heterogeneity: I2 = 98.45%, P < 0.001; N = 2803),6.89% (95% CI: 2.96–15.21%; heterogeneity: I2 = 98.02%,P < 0.001; N = 5171), 9.90% (95% CI: 6.45–14.90%; het-erogeneity: I2 = 92.19%, P < 0.001; N = 3183), 19.71%(95% CI: 11.89–30.89%; heterogeneity: I2 = 98.02%,P < 0.001; N = 2803) (Figure 7-supplementary).OR for the prevalence of daily, weekly, monthly, and
overall prevalence of heartburn in women compared tomen in Table 3 shows that there is a significant differ-ence in the weekly (P = 0.015), monthly (P < 0.001) andoverall (P = 0.008) prevalence of heartburn.
Meta-regression and publication bias for prevalence ofheartburnThe meta-regression model based on years of study forheartburn prevalence revealed that the meta-regressioncoefficient for daily, weekly, monthly, and overall preva-lence of heartburn was (0.136, 95% CI: − 0.241 to 0.514,P= 0.478), (0.109, 95% CI: 0.013 to 0.205, P= 0.025),(0.205, 95% CI: 0.004 to 0.405, P = 0.044) and (0.047,95% CI: − 0.103 to 0.198, P= 0.539), respectively (Fig. 5).Regarding publication bias, the significance level of
Egger and Begg’s tests was (Egger = 0.028 and Begg’s =0.707), (Egger = 0.118 and Begg’s = 0.392), (Egger = 0.005and Begg’s = 0.548) and (Egger = 0.025 and Begg’s =0.754) for the daily, weekly, monthly, and overall preva-lence of heartburn, respectively (Figure 8-supplementary).
Regurgitation prevalence and sensitivity analysisThe daily, weekly, monthly, and overall prevalence of re-gurgitation in Iranian population was 4.00% (95% CI:1.88–8.32%; heterogeneity: I2 = 99.03%, P < 0.001; N =18,774), 9.79% (95% CI: 5.99–15.60%; heterogeneity: I2 =99.55%, P < 0.001; N = 41,140), 13.76% (95% CI: 6.18–27.88%; heterogeneity: I2 = 99.73%, P < 0.001; N = 19,363) and 36.53% (95% CI: 19.30–58.08%; heterogeneity:I2 = 99.86%, P < 0.001; N = 21,174), respectively (Fig. 6).The sensitivity analysis for prevalence of all types re-
gurgitation symptoms by removing a study showed thatthe overall estimate is still robust (Figure 9-Supplement).
Subgroup analysis of regurgitationFor the daily prevalence of regurgitation, the subgroupanalysis of the area (P < 0.001), study population(P < 0.001), the quality of studies (P < 0.001) and the
data collection method (P = 0.001) were significant(Table 4). For the weekly prevalence of regurgitation,subgroup analysis of the study population (P = 0.001)was significant (Table 4). For the monthly regurgitationof heartburn, the subgroup analysis of the populationwas significant (P < 0.001) (Table 4). For the overallprevalence of regurgitation, the subgroup analysis of thearea (P < 0.001) was significant (Table 4). Other variableswere not significant.
The prevalence of regurgitation by genderThe daily, weekly, monthly, and overall prevalence of re-gurgitation in Iranian males was 3.59% (95% CI: 1.17–10.47%; heterogeneity: I2 = 97.58%, P < 0.001; N = 4788),7.93% (95% CI: 4.55–13.46%; heterogeneity: I2 = 95.25%,P < 0.001; N = 5008), 10.15% (95% CI: 5.61–17.70%; het-erogeneity: I2 = 97.28%, P < 0.001; N = 4788) and 28.00%(95% CI: 24.66–31.60%; heterogeneity: I2 = 81.76%,P < 0.001; N = 4788) (Figure 10-supplementary).The daily, weekly, monthly, and overall prevalence of
regurgitation in Iranian females was 4.63% (95% CI:0.78–23.11%; heterogeneity: I2 = 98.76%, P < 0.001; N =2803), 6.81% (95% CI: 3.64–12.41%; heterogeneity: I2 =94.86%, P < 0.001; N = 3183), 5.23% (95% CI: 1.11–21.34%; heterogeneity: I2 = 98.49%, P < 0.001; N = 2803)and 30.59% (95% CI: 17.89–47.14%; heterogeneity: I2 =98.29%, P < 0.001; N = 2803) (Figure 11-supplementary).OR for the prevalence of daily, weekly, monthly, and
overall prevalence of regurgitation in women comparedto men in Table 4 shows that there is no significant dif-ference in the prevalence of regurgitation.
Meta-regression and publication bias for prevalence ofregurgitationThe meta-regression model based on years of study forregurgitation prevalence revealed that the meta-regression coefficient for daily, weekly, monthly, andoverall prevalence of regurgitation was (0.091, 95% CI: −0.206 to 0.390, P= 0.546), (0.081, 95% CI: − 0.029 to0.192, P= 0.149), (0.162, 95% CI: 0.027 to 0.297, P =0.018) and (0.002, 95% CI: − 0.001 to 0.002, P < 0.001),respectively (Fig. 7).Regarding publication bias, the significance level of
Egger and Begg’s tests was (Egger = 0.060 and Begg’s =0.452), (Egger = 0.221 and Begg’s = 0.999), (Egger = 0.011and Begg’s = 0.999) and (Egger = 0.074 and Begg’s =0.763) for the daily, weekly, monthly, and overall preva-lence of heartburn, respectively (Figure 12-supplementary).
DiscussionThe present study is the first systematic review andmeta-analysis on the prevalence of GERD in Iran. In thisstudy, the prevalence of daily, weekly, monthly, and
Karimian et al. BMC Gastroenterology (2020) 20:297 Page 13 of 21

Fig. 5 The meta-regression model based on years of study for daily (a), weekly (b), monthly (c), and overall (d) prevalence of heartburn
Karimian et al. BMC Gastroenterology (2020) 20:297 Page 14 of 21
overall prevalence of GERD in Iranian population was5.64%, 12.50%, 18.62%, and 43.07%, respectively. In asystematic review in 2014, the weekly prevalence ofGERD in North America was 18.1–27.8%, in SouthAmerica was 23.0%, in Europe was 8.8–25.9%, in EastAsia was 2.5–7.8%, in Middle East was 8.7–33.1% andin Australia was 11.6%, and was specifically reportedfor Iran to be 10.1–15.0% [49], which is consistentwith the present study.
In the present study, the causes of heterogeneity in thestudies can be attributed to the geographic region andthe studied population, while previous studies also men-tioned racial and geographical factors for the pathogen-esis of GERD [49, 50].In a systematic review in Iran, the causes of heterogen-
eity for the prevalence of GERD have been attributed todifferent criteria such as definition, difference in socialfactors, cultural background, and lifestyle in different
Fig. 6 The daily (a), weekly (b), monthly (c), and overall (d) prevalence of regurgitation in Iranian population
Karimian et al. BMC Gastroenterology (2020) 20:297 Page 15 of 21

Table 4 Subgroup analysis of prevalence of regurgitation
Variable Studies(N)
Sample (N) Heterogeneity 95% CI Pooledprevalence(%)
Total subjects Event I2 P-Value
Daily Areas Center 3 7727 188 94.21 < 0.001 0.97–4.09 2.00
East 1 1066 163 – – 13.26–17.59 15.30
South 2 9981 1165 98.05 < 0.001 00.94–25.82 5.43
Test for subgroup differences: Q = 33.289, df(Q) = 2, P < 0.001
Population Blood donors 1 3517 128 – – 3.07–4.31 3.64
General population 4 12,249 1346 97.96 < 0.001 2.78–10.41 5.45
Health care worker 1 3008 42 – – 1.04–1.89 1.40
Test for subgroup differences: Q = 33.09, df(Q) = 2, P < 0.001
Year of studies 1998–2005 4 8793 351 99.04 < 0.001 1.04–10.53 3.40
2006–2015 2 9981 1162 98.05 < 0.001 0.94–25.82 5.43
Test for subgroup differences: Q = 0.196, df(Q) = 1, P = 0.658
Quality of studies Low risk 3 11,047 1328 98.90 < 0.001 5.03–13.76 8.42
Moderate risk 3 7727 188 94.56 < 0.001 0.97–4.09 2.00
Test for subgroup differences: Q = 10.268, df(Q) = 1, P < 0.001
Method of data collectionSex
Questionnaire + Interview 5 17,708 1353 99.17 < 0.001 1.07–8.02 2.98
Interview 1 1066 163 99.51 < 0.001 13.26–17.59 15.30
Test for subgroup differences: Q = 10.819, df(Q) = 1, P = 0.001
The odds ratio of females to males: 1.315 (95% CI: 0.786–2.201, P = 0.297); Heterogeneity: I2: 64.23%, P = 0.061
Weekly Areas Center 4 27,266 1931 99.22 < 0.001 4.02–12.65 7.23
East 1 1066 124 – – 9.81–13.66 11.60
North 2 1490 150 93.15 < 0.001 4.53–17.19 9.03
South 4 11,318 2583 98.55 < 0.001 6.71–24.37 13.21
Test for subgroup differences: Q = 3.130, df(Q) = 3, P = 0.372
Population Blood donors 1 3517 162 – – 3.96–5.34 4.60
General population 6 32,689 4296 99.71 < 0.001 6.71–23.16 12.83
Health care worker 3 4197 257 93.11 < 0.001 4.27–11.51 7.08
injured people of B 1 737 74 – – 8.03–12.38 1.00
Test for subgroup differences: Q = 38.144, df(Q) = 3, P < 0.001
Year of studies 1991–2004 7 12,379 1093 98.18 < 0.001 5.55–13.53 8.75
2005–2013 4 28,761 3695 99.82 < 0.001 4.51–27.80 11.89
Test for subgroup differences: Q = 6.547, df(Q) = 1, P = 0.563
Quality of studies Low risk 4 29,227 3753 99.83 < 0.001 4.68–27.62 12.04
Moderate risk 7 11,913 1035 98.16 < 0.001 5.41–13.62 8.67
Test for subgroup differences: Q = 0.393, df(Q) = 1, P = 0.531
Method of data collection Interview 1 1066 124 – – 9.81–13.66 11.60
Questionnaire 3 2238 252 22.68 < 0.001 9.85–12.86 11.27
Questionnaire + Interview 7 37,836 4412 99.73 < 0.001 4.61–16.96 9.04
Test for subgroup differences: Q = 0.552, df(Q) = 2, P = 0.759
Sex The odds ratio of females to males: 0.856 (95% CI: 0.509–1.4339, P = 0.558); Heterogeneity: I2: 84.17%,P < 0.001
Monthly Areas Center 3 7727 842 98.17 < 0.001 6.94–18.29 11.44
East 1 1066 144 – – 11.58–15.69 13.50
North 1 589 77 – – 10.52–15.97 13.00
Karimian et al. BMC Gastroenterology (2020) 20:297 Page 16 of 21

cities or different populations [51]. On the other hand,due to the limitations of population-based studies, whereprecise diagnostic methods such as PH metric testingcannot be used, some of these differences can be due tothe lack of a comprehensive standard for classifyingsymptoms and complications of GERD, which makescomparison between studies difficult [52]. Some differ-ences in reported reflux rates may be due to cultural andethnic differences in perceiving, expressing, and
understanding symptoms of reflux. For example, thereare differences in describing symptoms and diseases insome areas and among some ethnic groups, while othergroups do not pay attention to the symptoms of the dis-ease. It has been pointed out that different groups andcultures have different perceptions of the word “heart-burn”. In a study in Boston among different ethnicgroups, only 13% of Chinese and Korean people had aproper understanding of the word “heartburn” [53].
Table 4 Subgroup analysis of prevalence of regurgitation (Continued)
Variable Studies(N)
Sample (N) Heterogeneity 95% CI Pooledprevalence(%)
Total subjects Event I2 P-Value
South 2 9981 4056 99.59 < 0.001 2.06–71.12 18.55
Test for subgroup differences: Q = 0.552, df(Q) = 3, P = 0.907
Population Blood donors 1 3517 239 – – 6.01–7.68 6.80
General population 4 12,249 4388 99.61 < 0.001 6.03–37.74 16.47
Health care worker 2 3597 492 0 0.605 12.59–14.83 13.67
Test for subgroup differences: Q = 88.495, df(Q) = 2, P < 0.001
Year of studies 1991–2004 5 9382 1062 96.48 < 0.001 8.80–16.47 12.12
2005–2013 2 9981 4056 99.59 < 0.001 2.06–71.12 18.55
Test for subgroup differences: Q = 0.167, df(Q) = 1, P = 0.683
Quality of studies Low risk 3 11,047 4200 99.62 < 0.001 4.44–46.54 16.75
Moderate risk 4 8316 918 97.28 < 0.001 7.92–17.23 11.80
Test for subgroup differences: Q = 0.273, df(Q) = 1, P = 0.601
Method of data collection Interview 1 1066 144 – – 11.58–15.69 13.50
Questionnaire + Interview 6 18,297 4975 99.76 < 0.001 5.64–29.99 13.80
Test for subgroup differences: Q = 0.002, df(Q) = 1, P = 0.960
Sex The odds ratio of females to males: 0.500 (95% CI: 0.085–2.952, P = 0.859); Heterogeneity: I2: 98.30%, P < 0.001
Overall Areas Center 4 10,127 2758 95.05 < 0.001 23.09–31.00 26.86
East 1 1066 431 – – 37.53–43.41 40.43
South 2 9981 7326 99.79 < 0.001 18.17–88.55 56.72
Test for subgroup differences: Q = 26.883, df(Q) = 2, P < 0.001
Population Blood donors 1 3517 870 – – 23.33–26.18 24.73
General population 5 14,649 8818 99.84 < 0.001 19.28–67.23 41.18
Health care worker 1 3008 827 – – 25.93–29.12 27.50
Test for subgroup differences: Q = 8.028, df(Q) = 2, P = 0.018
Year of studies 1991–2004 5 11,193 3198 97.12 < 0.001 24.40–34.70 29.28
2005–2013 2 9981 7326 99.79 < 0.001 17.17–88.55 56.72
Test for subgroup differences: Q = 1.587, df(Q) = 1, P = 0.208
Quality of studies Low risk 3 11,047 7757 99.78 < 0.001 22.40–79.34 51.29
Moderate risk 4 10,127 2758 95.02 < 0.001 23.09–31.00 26.86
Test for subgroup differences: Q = 2.483, df(Q) = 1, P = 0.115
Method of data collection Interview 2 3466 1218 94.67 < 0.001 29.35–44.21 36.46
Questionnaire + Interview 5 17,708 9297 99.90 < 0.001 14.91–65.41 36.53
Test for subgroup differences: Q = 0.000, df(Q) = 1, P = 0.996
Sex The odds ratio of females to males: 1.046 (95% CI: 0.712–1.539, P = 0.818); Heterogeneity: I2: 99.19%, P < 0.001
CI Confidence intervals, N number
Karimian et al. BMC Gastroenterology (2020) 20:297 Page 17 of 21

Fig. 7 The meta-regression model based on years of study for daily (a), weekly (b), monthly (c), and overall (d) prevalence of regurgitation
Karimian et al. BMC Gastroenterology (2020) 20:297 Page 18 of 21

Iranian people are gaining weight such that the preva-lence of obesity in Iranian adults is 21.5% [54]. Mean-while, the economic and social status of people haschanged rapidly. Therefore, some studies have reportedthat the above factors are important risk factors [55].Smoking has always been associated with GERD. The
relationship between smoking and GERD (any symp-toms) continues even after smoking is stopped [39].Smoking increases the frequency of GERD by reducingthe pressure of the sphincter [56] and decreases the se-cretion of the bicarbonate of the saliva [57]. However,some other mechanisms may also be involved in the re-lationship between smoking and symptoms of GERD.Therefore, smoking may result in exaggerated negativeintrathoracic pressure and inspiratory thoraco-abdominal pressure gradient, which may cause gastro-intestinal reflux [58, 59]. In a meta-analysis, the preva-lence of smoking among Iranian men and women wasreported to be 21.7% and 3.6%, respectively [59].There is varied evidence regarding the relationship be-
tween gender and GERD symptoms, but most studiesshow no relationship [60]. However, in many studiesbased on endoscopy, non-erosive and erosive GERD aremore common in men and women, respectively [61, 62].In the present study, only the daily symptoms of GERDwere significantly higher in women compared to men.The prevalence of GERD-related symptoms and tissue
damage is different in ethnic/racial groups [63, 64]. Wefound a significant difference between the weekly andoverall prevalence of GERD in different areas; the weeklyand overall prevalence of GERD in the south was 21.26%and in the north was 60.86%. Iran has different ethnici-ties (Kurds, Persians, Turks, Arabs, Turkmen, etc.) withdifferent customs and lifestyles, each of which predom-inantly lives in certain geographic area (e.g., Kurds areconcentrated in western Iran) [65]. Nevertheless, the en-vironmental or genetic factors that affect these differ-ences are not clear yet [39].The study with highest quality in this meta-analysis
was the study of Islami et al. [39] on 49,975 people ofthe general population, with a daily, weekly, monthly,and overall GERD prevalence of 11.83%, 8.06%, 40.96%,and 60.86%, respectively, who reported a high incidence.In the present study, the prevalence of daily, weekly,
monthly, and overall prevalence of GERD did notchange significantly over time. In 2005, a systematic re-view on population-based studies reported the weeklyprevalence of GERD to be 10–20% in Europe and theUnited States and less than 5% in East Asia [66]. How-ever, in a more recent systematic review in 2011, theweekly prevalence of GERD was reported to be 8.8–25.9% in Europe and 18.1–27.8% in North America and2.5–7.8% in East Asia 49). Therefore, the global preva-lence of GERD is increasing over time [49].
The results of the Egger’s test show that bias has beensuggested for the overall prevalence of GERD. Publica-tion bias is usually suggested for studies that are basedon relationship assessment scale because studies with apositive result are more likely [48, 67].There were several limitations for this early study, so
interpreting the results should be done with cautious. Thequestionnaire consisted of only the major and commonsymptoms of GERD such as heartburn and acid reflux,but not other symptoms. Non-gastric manifestations ofGERD are not included. Indeed, in the absence of a goldenstandard for the diagnosis of GERD, we only have thequestionnaires, which are common in clinical or epi-demiological studies.
ConclusionThe present meta-analysis provides comprehensive anduseful information on the epidemiology of GERD in Iranfor policy-makers and health care providers. This studyshowed a high prevalence of GERD in Iran. Therefore,effective measures on GERD-related factors such as life-style can be among the health policies of Iran.
Supplementary informationSupplementary information accompanies this paper at https://doi.org/10.1186/s12876-020-01417-6.
Additional file 1: Figure 1- supplementary: The sensitivity analysis fordaily (A), weekly (B), monthly (C), and overall (D) prevalence of GERDsymptoms in Iranian population.
Additional file 2: Figure 2-supplementary: The daily (A), weekly (B),monthly (C), and overall (D) prevalence of GERD symptoms in Iranianmales.
Additional file 3: Figure 3-supplementary: The daily (A), weekly (B),monthly (C), and overall (D) prevalence of GERD symptoms in Iranianfemales.
Additional file 4: Figure 4-supplementary: Publication bias for daily(A), weekly (B), monthly (C), and overall (D) prevalence of GERDsymptoms.
Additional file 5: Figure 5- supplementary: The sensitivity analysis fordaily (A), weekly (B), monthly (C), and overall (D) prevalence of heartburnin Iranian population.
Additional file 6: Figure 6-supplementary: The daily (A), weekly (B),monthly (C), and overall (D) prevalence of heartburn in Iranian males.
Additional file 7: Figure 7-supplementary: The daily (A), weekly (B),monthly (C), and overall (D) prevalence of heartburn in Iranian females.
Additional file 8: Figure 8-supplementary: Publication bias for daily(A), weekly (B), monthly (C), and overall (D) prevalence of heartburn.
Additional file 9: Figure 9- supplementary: The sensitivity analysis fordaily (A), weekly (B), monthly (C), and overall (D) prevalence ofregurgitation in Iranian population.
Additional file 10: Figure 10-supplementary: The daily (A), weekly(B), monthly (C), and overall (D) prevalence of regurgitation in Iranianmales.
Additional file 11: Figure 11-supplementary: The daily (A), weekly(B), monthly (C), and overall (D) prevalence of regurgitation in Iranianfemales.
Karimian et al. BMC Gastroenterology (2020) 20:297 Page 19 of 21

Additional file 12: Figure 12-supplementary: Publication bias fordaily (A), weekly (B), monthly (C), and overall (D) prevalence ofregurgitation.
Additional file 13. PRISMA 2009 Checklist.
AbbreviationsGERD: Gastroesophageal reflux disease; NSAIDs: Nonsteroidal Anti-inflammatory Drugs; BMI: Body mass index; IranDoc: Iranian ResearchInstitute for Information Science and Technology; SID: Scientific InformationDatabase; RICST: Regional Information Center for Science andTechnologyMOOSE Meta-analyses Of Observational Studies in Epidemiology;PRISMA: Systematic Reviews and Meta-analysis; NOS: Newcastle Ottawa Scale;OR: Odds ratio; CI: Confidence interval; CMA: Comprehensive Meta-Analysis
AcknowledgementsHereby, we would like to thank the Ilam University of Medical Sciences fortheir support.
Authors’ contributionsM.A, MR.HA, F. K, M. K, and H. N acquired the data. M. A analyzed andinterpreted the data. M. A, MR.HA, F. K, M. K, and H. N and M. S drafted themanuscript; MA, MS, and MK critically revised the manuscript for importantintellectual content. MK supervised the study. All authors have read andapproved the manuscript.
FundingThis study was funded by the Ilam University of Medical sciences. The funderhad no role in the process of study design, data analysis, decision to publish,or preparation of the manuscript.
Availability of data and materialsThe datasets supporting the conclusions of this research are contained inthe article.
Ethics approval and consent to participateNot applicable.
Consent for publicationNot applicable.
Competing interestsThere is not conflict of interest between the authors of this study.
Author details1Department of General Surgery, Faculty of Medicine, Ilam University ofMedical Sciences, Ilam, Iran. 2Department of Internal Medicine, ShahidMostafa Khomeini Hospital, Ilam, Iran. 3Department of Pathology, Faculty ofMedicine, Ilam University of Medical Sciences, Ilam, Iran. 4School of Medicine,Qazvin University of Medical Sciences, Qazvin, Iran. 5Faculty of Medicine, IlamUniversity of Medical Sciences, Ilam, Iran.
Received: 4 March 2020 Accepted: 7 August 2020
References1. Vakil N, Van Zanten SV, Kahrilas P, Dent J, Jones R. The Montreal definition
and classification of gastroesophageal reflux disease: a global evidence-based consensus. Am J Gastroenterology. 2006;101(8):1900.
2. Manterola C, Muñoz S, Grande L, Bustos L. Initial validation of aquestionnaire for detecting gastroesophageal reflux disease inepidemiological settings. J Clin Epidemiol. 2002;55(10):1041–5.
3. El-Serag HB, Petersen NJ, Carter J, Graham DY, Richardson P, Genta RM,et al. Gastroesophageal reflux among different racial groups in the UnitedStates. Gastroenterology. 2004;126(7):1692–9.
4. Mikami DJ, Murayama KM. Physiology and pathogenesis ofgastroesophageal reflux disease. Surg Clin. 2015;95(3):515–25.
5. Buckles DC, Sarosiek I, McCallum RW, McMillin C. Delayed gastric emptyingin gastroesophageal reflux disease: reassessment with new methods andsymptomatic correlations. Am J Med Sci. 2004;327(1):1–4.
6. Wong W, Lam K, Lai K, Hui W, Hu W, Lam C, et al. A validated symptomsquestionnaire (Chinese GERDQ) for the diagnosis of gastro-oesophagealreflux disease in the Chinese population. Aliment Pharmacol Ther. 2003;17(11):1407–13.
7. Kim O, Jang HJ, Kim S, Lee HY, Cho E, et al. Gastroesophageal reflux diseaseand its related factors among women of reproductive age: Korea Nurses'Health Study. BMC Public Health. 2018;18(1):1133.
8. Ohba T, Ebata S, Koyama K, Haro H. Prevalence and key radiographic spinalmalalignment parameters that influence the risk for gastroesophageal refluxdisease in patients treated surgically for adult spinal deformity. BMCGastroenterol. 2018;18(1):8.
9. Kusano M, Hashizume K, Ehara Y, Shimoyama Y, Kawamura O, Mori M. Sizeof hiatus hernia correlates with severity of kyphosis, not with obesity, inelderly Japanese women. J Clin Gastroenterol. 2008;42(4):345–50.
10. Mostaghni A, Mehrabani D, Khademolhosseini F, Masoumi SJ, Moradi F, ZareN, et al. Prevalence and risk factors of gastroesophageal reflux disease inQashqai migrating nomads, southern Iran. World J Gastroenterol: WJG. 2009;15(8):961.
11. Vossoughinia H, Salari M, Amirmajdi EM, Saadatnia H, Abedini S, Shariati A,et al. An epidemiological study of gastroesophageal reflux disease andrelated risk factors in urban population of mashhad, iran. Iran Red CrescentMed J. 2014;16(12);e15832.
12. El–Serag HB. Time trends of gastroesophageal reflux disease: a systematicreview. Clin Gastroenterol Hepatol. 2007;5(1):17–26.
13. Lee S-W, Lee T-Y, Lien H-C, Peng Y-C, Yeh H-J, Chang C-S. Correlationbetween symptom severity and health-related life quality of a populationwith gastroesophageal reflux disease. Gastroenterol Res. 2017;10(2):78.
14. Nouraie M, Razjouyan H, Assady M, Malekzadeh R, Nasseri-Moghaddam S.Epidemiology of gastroesophageal reflux symptoms in Tehran, Iran: apopulation-based telephone survey. Arch Iran Med. 2007;10(3):289–94.
15. Nouraie M, Radmard AR, Zaer-Rezaii H, Razjouyan H, Nasseri-Moghaddam S,Malekzadeh R. Hygiene could affect GERD prevalence independently: apopulation-based study in Tehran. Am J Gastroenterol. 2007;102(7):1353.
16. Hatami K, Pourshams A, Azimi K, Sarrafi M, Mehrabani M, Mostajabi P, et al.Dyspepsia, gastroesophageal reflux disease and irritable bowel syndromeamong blood donors. Govaresh. 2003;8(4):138–46.
17. Rogha M, Mohabatian B, Daemi P, Bashardoost N, Pourshams A.Gastroesophageal reflux disease in Esfahan. Govaresh. 2006;11(3):145–9.
18. Mahmoudi S, Pourshams A, Akbari M, Malekzadeh R. The prevalence ofirritable bowel syndrome and gastroesophageal reflux disease amongTehran University students. Govaresh. 2012;8(4):159–62.
19. Somi MH, Farhang S, Mirinezhad K, Jazayeri E, Nasseri-Moghaddam S,Moayeri S, et al. Prevalence and precipitating factors of gastroesophagealreflux disease in a young population of Tabriz, northwest of Iran. Saudimedical journal. 2006;27(12):1878.
20. Pourshams A, Rahmani A, Hatami K. Gastroesophageal reflux disease in Iran.Govaresh. 2005;10(1):48–53.
21. Bordbar G, Bolandnazar N-S. Gastroesophageal reflux disease (GERD):prevalence and association with psychological disorders among medicalsciences students. Int J PharmTech Res. 2015;8(7):120–30.
22. Pourhoseingholi A, Safaee A, Pourhoseingholi MA, Boghimi-Dehkordi B,Habibi M, Vahedi M, et al. Prevalence and demographic risk factors ofgastrointestinal symptoms in Tehran province. Ital J Public Health. 2010;7(1).
23. Khoshbaten M. Gastro-esophageal reflux disease in northwestern Tabriz,Iran. Ind J Gastroenterol. 2003;22(4):138–9.
24. Safaee A, Moghimi-Dehkordi B, Pourhoseingholi M. Heartburn and relatedfactors in general population in Tehran, capital of Iran. East Afr J PublicHealth. 2010;7(2).
25. Honarkar Z, Baladast M, Khorram Z, Akhondi Sh AM, Masoodi M. An analysisof gastrointestinal symptoms in causalities of catastrophic earthquake ofbam, Iran. Shiraz E-Med J. 2005;6(1):2.
26. Keshteli AH, Daneshpajouhnejad P, Adibi P. Risk factors of bloating and itsassociation with common gastrointestinal disorders in a sample of Iranianadults. Turk J Gastroenterol. 2017;28(3):179–90.
27. Shahravan S, Maleki I. Prevalence and clinical conditions of gastroesophagealreflux: a population based study in sari city, Iran. Govaresh. 2013;18(2):112–3.
28. Reshadat R, Fattahi N, Iri R, Saeedi B, Shahabbaspoor Z, Emami L, et al.Prevalence of gastroesophageal reflux and its related factors in Sanandaj.Sci J Kurdistan Univ Med Sci. 2017;22(4).
29. Pourhoseingholi A, Pourhoseingholi MA, Moghimi-Dehkordi B, Barzegar F,Safaee A, Vahedi M, et al. Epidemiological features of gastro-esophageal
Karimian et al. BMC Gastroenterology (2020) 20:297 Page 20 of 21

reflux disease in Iran based on general population. Gastroenterol HepatolBed Bench. 2012;5(1):54.
30. Khodamoradi Z, Gandomkar A, Poustchi H, Salehi A, Imanieh MH, EtemadiA, et al. Prevalence and correlates of Gastroesophageal reflux disease insouthern Iran: pars cohort study. Middle East J Dig Dis. 2017;9(3):129.
31. Saberi-Firoozi M, Khademolhosseini F, Yousefi M, Mehrabani D, Zare N,Heydari ST. Risk factors of gastroesophageal reflux disease in shiraz,southern Iran. World J Gastroenterol: WJG. 2007;13(41):5486.
32. Aletaha N, Pourshams A, Nouraie M, Malekshah AF, Malekzadeh R.Gastroesophageal reflux disease in Gonbad city: the prevalence and riskfactors. J Med Council Islamic Republic Iran. 2010;28(2):176–234.
33. Nasseri-Moghaddam S, Mofid A, GHOTBI MH, Razjouyan H, Nouraie M,RAMARD AR, et al. Epidemiological study of gastro-oesophageal refluxdisease: reflux in spouse as a risk factor. Aliment Pharmacol Ther. 2008;28(1):144–53.
34. Solhpour A, Pourhoseingholi MA, Soltani F, Zarghi A, Habibi M, GhafarnejadF, et al. Gastro-esophageal reflux symptoms and body mass index: norelation among the Iranian population. Indian J Gastroenterol. 2008;27(4):153–5.
35. Saberi HR, Moravveji AR. Gastrointestinal complaints in shift-working andday-working nurses in Iran. J Circadian Rhythms. 2010;8(1):9.
36. Hoseini-assal SK, Amra B. Respiratory symptoms and gastroesophageal refluxin adult population of more than 20 years old in Shahrekord. J ShahrekordUniv Med Sci. 2004;6(1):58–62.
37. Vakhshoori M, Keshteli AH, Saneei P, Esmaillzadeh A, Adibi P. Relationshipbetween meal frequency and Gastroesophageal reflux disease (GERD) inIranian adults. Dig Dis Sci. 2018;63(11):2998–3008.
38. Mansour-Ghanaei F, Joukar F, Atshani SM, Chagharvand S, Souti F. Theepidemiology of gastroesophageal reflux disease: a survey on theprevalence and the associated factors in a random sample of the generalpopulation in the northern part of Iran. Int J Mol Epidemiol Genet. 2013;4(3):175.
39. Islami F, Nasseri-Moghaddam S, Pourshams A, Poustchi H, Semnani S,Kamangar F, et al. Determinants of gastroesophageal reflux disease,including hookah smoking and opium use–a cross-sectional analysis of50,000 individuals. PLoS One. 2014;9(2):e89256.
40. Karimian M, Salamati M, Azami M. The relationship between metabolicsyndrome and increased risk of Barrett's esophagus: an updated systematicreview and meta-analysis. BMC Gastroenterol. 2020;20(1):138.
41. Sayehmiri K, Tavan H. Systematic review and meta-analysis methodsprevalence of peptic ulcer in IRAN. J Govaresh. 2015;20(4):250–8.
42. Stroup DF, Berlin JA, Morton SC, Olkin I, Williamson GD, Rennie D, et al.Meta-analysis of observational studies in epidemiology: a proposal forreporting. JAMA. 2000;283(15):2008–12.
43. Moher D, Shamseer L, Clarke M, Ghersi D, Liberati A, Petticrew M, et al.Preferred reporting items for systematic review and meta-analysis protocols(PRISMA-P) 2015 statement. Syst Rev. 2015;4(1):1.
44. Peterson J, Welch V, Losos M, Tugwell P. The Newcastle-Ottawa scale (NOS)for assessing the quality of nonrandomised studies in meta-analyses.Ottawa: Ottawa Hospital Research Institute; 2011.
45. Green S, Higgins J, Alderson P, Clarke M, Mulrow C, Oxman A. Cochranehandbook for systematic reviews of interventions. West Sussex: Wiley; 2008.
46. Ades A, Lu G, Higgins J. The interpretation of random-effects meta-analysisin decision models. Med Decis Mak. 2005;25(6):646–54.
47. Higgins JP, Thompson SG, Deeks JJ, Altman DG. Measuring inconsistency inmeta-analyses. BMJ. 2003;327(7414):557–60.
48. Ehsani MJ, Maleki I, Mohammadzadeh F, Mashayekh A. Epidemiology ofgastroesophageal reflux disease in Tehran, Iran. J Gastroenterol Hepatol.2007;22(9):1419–22.
49. El-Serag HB, Sweet S, Winchester CC, Dent J. Update on the epidemiologyof gastro-oesophageal reflux disease: a systematic review. Gut. 2014;63(6):871–80.
50. Sharma P, Wani S, Romero Y, Johnson D, Hamilton F. Racial and geographicissues in gastroesophageal reflux disease. Am J Gastroenterol. 2008;103(11):2669.
51. Fazel M, Keshteli AH, Jahangiri P, Daneshpajouhnejad P, Adibi P.Gastroesophageal reflux disease in Iran: SEPAHAN systematic review No. 2.Int J Prev Med. 2012;3(Suppl 1):S10.
52. Delavari A, Moradi G, Birjandi F, Elahi E, Saberifiroozi M. The prevalence ofgastroesophageal reflux disease (GERD) in the Islamic Republic of Iran: asystematic review. Middle East J Dig Dis. 2012;4(1):5.
53. Spechler S, Jain S, Tendler D, Parker R. Racial differences in the frequency ofsymptoms and complications of gastro-oesophageal reflux disease. AlimentPharmacol Ther. 2002;16(10):1795–800.
54. Mirzazadeh A, Sadeghirad B, Haghdoost A, Bahreini F, Kermani MR. Theprevalence of obesity in Iran in recent decade; a systematic review andmeta-analysis study. Iran J Public Health. 2009;38(3):1–11.
55. Rosaida MS, Goh K-L. Gastro-oesophageal reflux disease, reflux oesophagitisand non-erosive reflux disease in a multiracial Asian population: aprospective, endoscopy based study. Eur J Gastroenterol Hepatol. 2004;16(5):495–501.
56. Thomas GA, Rhodes J, Ingram JR. Mechanisms of disease: nicotine—areview of its actions in the context of gastrointestinal disease. Nat RevGastroenterol Hepatol. 2005;2(11):536.
57. Trudgill N, Smith L, Kershaw J, Riley S. Impact of smoking cessation onsalivary function in healthy volunteers. Scand J Gastroenterol. 1998;33(6):568–71.
58. Ayazi S, DeMeester SR, Hsieh C-C, Zehetner J, Sharma G, Grant KS, et al.Thoraco-abdominal pressure gradients during the phases of respirationcontribute to gastroesophageal reflux disease. Dig Dis Sci. 2011;56(6):1718–22.
59. Moosazadeh M, Ziaaddini H, Mirzazadeh A, Ashrafi-Asgarabad A, HaghdoostAA. Meta-analysis of smoking prevalence in Iran. Addict Health. 2013;5(3–4):140.
60. Nusrat S, Nusrat S, Bielefeldt K. Reflux and sex: what drives testing, whatdrives treatment? Eur J Gastroenterol Hepatol. 2012;24(3):233–47.
61. Cook M, Wild C, Forman D. A systematic review and meta-analysis of thesex ratio for Barrett's esophagus, erosive reflux disease, and nonerosivereflux disease. Am J Epidemiol. 2005;162(11):1050–61.
62. Cho JH, Kim HM, Ko GJ, Woo ML, Moon CM, Kim YJ, et al. Old age and malesex are associated with increased risk of asymptomatic erosive esophagitis:analysis of data from local health examinations by the Korean NationalHealth Insurance Corporation. J Gastroenterol Hepatol. 2011;26(6):1034–8.
63. Corley DA, Kubo A, Zhao W. Abdominal obesity, ethnicity and gastro-oesophageal reflux symptoms. Gut. 2007;56(6):756–62.
64. Wang A, Mattek NC, Holub JL, Lieberman DA, Eisen GM. Prevalence ofcomplicated gastroesophageal reflux disease and Barrett’s esophagusamong racial groups in a multi-center consortium. Dig Dis Sci. 2009;54(5):964–71.
65. Azami M, Moslemirad M, YektaKooshali MH, Rahmati S, Soleymani A,Shamloo MBB, et al. Workplace violence against Iranian nurses: a systematicreview and meta-analysis. Violence Vict. 2018;33(6):1148–75.
66. Dent J, El-Serag H, Wallander MA, Johansson S. Epidemiology of gastro-oesophageal reflux disease: a systematic review. Gut. 2005;54(5):710–7.
67. Sayehmiri K, Azami M, Nikpey S, Borji M, Sayehmiri F. Hepatitis B VaccinationCoverage in Health Personnel of Iran: A Systematic Review and Meta-Analysis Study. Irje. 2015;11(3):1–10.
Publisher’s NoteSpringer Nature remains neutral with regard to jurisdictional claims inpublished maps and institutional affiliations.
Karimian et al. BMC Gastroenterology (2020) 20:297 Page 21 of 21