epigenomics exploring transcription factor binding and the epigenomic landscape saurabh sinha...
TRANSCRIPT
Epigenomics
Exploring transcription factor binding and the epigenomic landscape
Saurabh Sinha(several slides here are courtesy of
Lisa Stubbs)

Eukaryotic genomes are complex structures comprised of modified and unmodified DNA, RNA and many types of interacting proteins
• Most DNA is wrapped around a “histone core”, to form nucleosomes• The classical histone protein complexes bind very tightly to DNA and prevent
association with other proteins• Modifications of the classical histones, or their replacement with unusual histone
types under certain conditions, can “loosen” the interaction with DNA, allowing access to transcription factors, RNA polymerase, and other proteins

All eight histones have “tails” that can be modified in various ways, but the most consequential modifications, with respect to transcriptional activity, appear to involve methylation or acetylation of Lysines (K) in histone H3
Eight histone proteins (2 copies of each of H2A, H2B, H3, H4) at the core of a nucleosome
Histone H3 modifications, especially methylation and Acetylation, mark “open” or “closed” DNA
• CLOSED: Histones bound more tightly to DNA– H3K27Me3, H3K9Me3
• OPEN: Histones can be displaced by TFs, RNA Polymerase, and other proteins– H2K27Ac, HeK4me1, H3K4me3
• Histone marks, together with other assays of open chromatin, are presently the only reliable indicators of the locations and activities of regulatory elements

Many types of regulatory elements• “Docking sites” for site-specific regulatory proteins
– Transcription factors, TATA binding factors, and other site-specific binders– Recruit additional proteins: co-factors, RNA polymerase and others
• Enhancers– Tissue-specific activators of transcription– Binding sites for proteins that interact with the promoter to enhance transcription
• Silencers– Also prevalent, but more difficult to detect and assay– Many transcription factors repress, rather than enhance, gene expression– “Enhancers” and “Silencers” are not mutually exclusive! Most regulatory elements
can serve either function, depending on the proteins bound at a particular time
• Insulators– “boundary elements” that shield genes from the enhancers or heterochromatin
proteins in neighboring gene “territories”– Involved in establishing loop structures that isolate genes

ChIP Seq
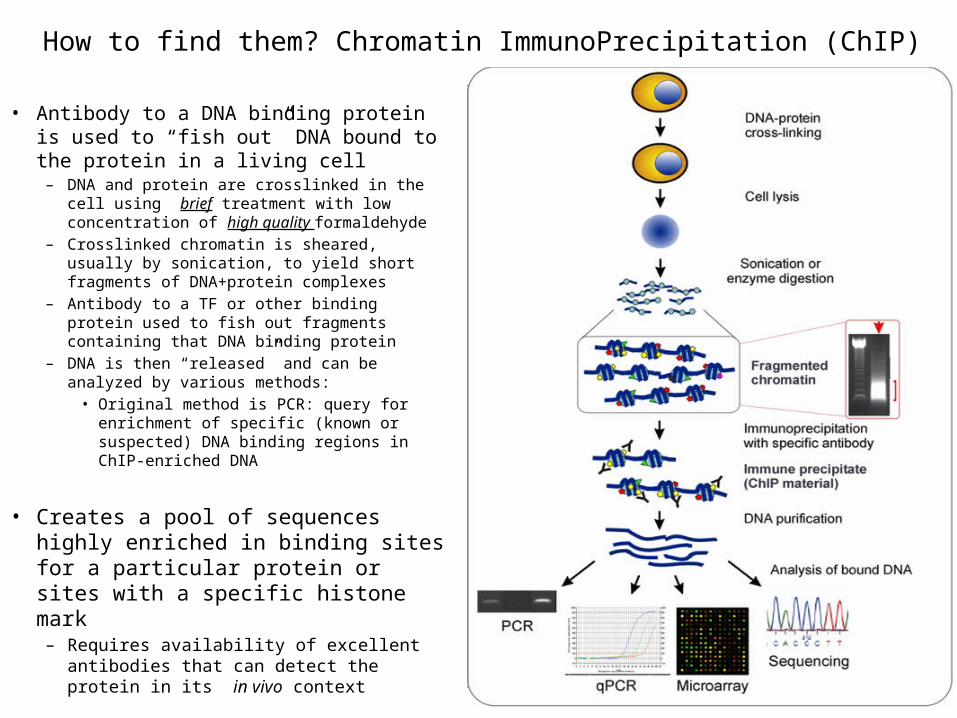
How to find them? Chromatin ImmunoPrecipitation (ChIP)
• Antibody to a DNA binding protein is used to “fish out” DNA bound to the protein in a living cell
– DNA and protein are crosslinked in the cell using brief treatment with low concentration of high quality formaldehyde
– Crosslinked chromatin is sheared, usually by sonication, to yield short fragments of DNA+protein complexes
– Antibody to a TF or other binding protein used to fish out fragments containing that DNA binding protein
– DNA is then “released” and can be analyzed by various methods:
• Original method is PCR: query for enrichment of specific (known or suspected) DNA binding regions in ChIP-enriched DNA
• Creates a pool of sequences highly enriched in binding sites for a particular protein or sites with a specific histone mark– Requires availability of excellent antibodies
that can detect the protein in its in vivo context
ChIP can be used to map DNA:protein interactions of virtually any type
• Histone modifications.• DNA binding proteins (transcription factors)• Secondary interactions (no direct linkage to DNA)
– Histone modifying proteins, such as SWI/SNF, histone deacetylases, histone methylases
– Cofactors that bind to TFs at particular sites, and that stablize chromatin loops
– Proteins that link chromatin to nuclear matrix
• RNA polymerase and elongation factors, to find promoters and active sites of transcription
• Proteins involved in DNA recombination, repair, and replication
• All of these methods require highly specific and efficient antibodies (which are rare!)
ChIP Analytical challenges
• Genomic neighborhoods– Shear efficiency is not really “random”
• Some genomic regions are fragile and sensitive• Some regions are protected from shear or degradation
– “Sticky” chromatin• Some DNA regions bind to any antibody you use• Chromatin-matched, co-sheared controls are essential, but mock ChIP (with
IgG treatment) is helpful too– Other artifacts
• Centromeres: repeat sequences that are not all represented in the genome assembly• Polymorphic regions• Repeats: most programs cannot manage sequence reads that are not mapped
uniquely
• Peak width– Transcription factors are typically sharp peaks; chromatin marks are more diffuse
• The best tools permit the user to modify these parameters– MACS ( Xiaole Liu Lab; Zhang et al, 2008; Feng et al. Nature Methods 2102)
is a user-friendly and widely used tool

ChIP computational issues• First step is to map reads:
BOWTIE, Novalign, BWA or other• ChIP seq reads surround but may
not contain the DNA binding site• Sequence is generated from the ends
of randomly sheared fragments, which overlap at the protein binding site
• Gives rise to two adjacent sets of read peaks
• Defines a “shift” distance between read peaks at which you will find the true ChIP peak summit
• Programs like MACS automatically subtracts your control (genomic input) from sample reads to define a final set of peaks
Binding site
ChIP fragments
Seq reads
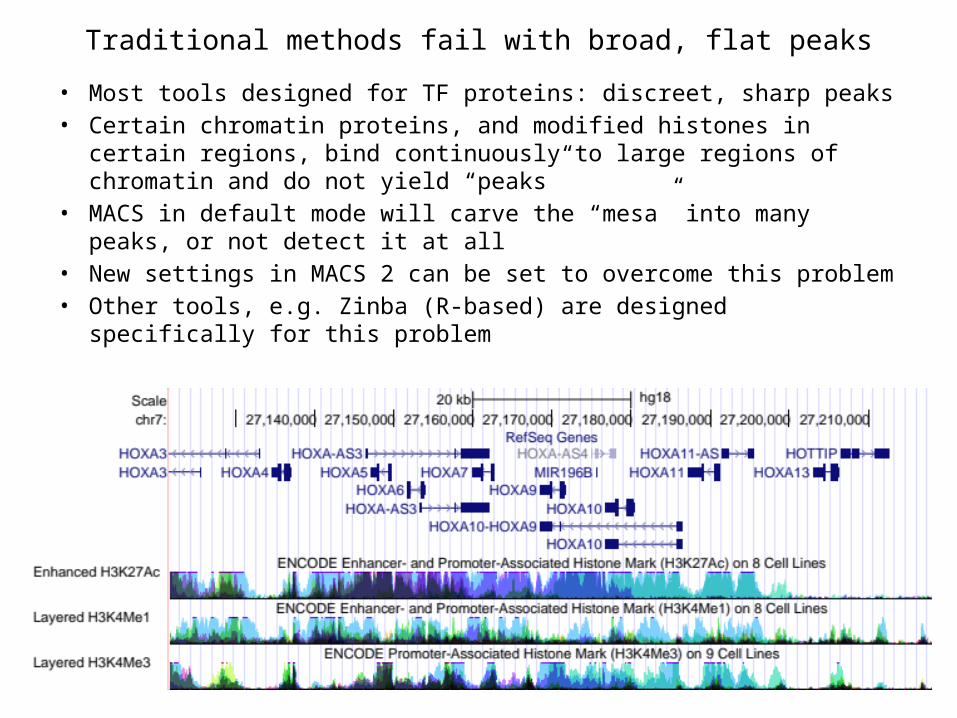
Traditional methods fail with broad, flat peaks• Most tools designed for TF proteins: discreet, sharp peaks• Certain chromatin proteins, and modified histones in certain regions, bind
continuously to large regions of chromatin and do not yield “peaks”• MACS in default mode will carve the “mesa” into many peaks, or not
detect it at all• New settings in MACS 2 can be set to overcome this problem• Other tools, e.g. Zinba (R-based) are designed specifically for this problem

Lessons from ENCODE chromatin assays: human data• Massive deep-sequencing of multiple chromatin features in cell lines (ENCODE),
primary cell types and tissues (Epigenetics Roadmap)– Histone H3 modifications: highlight on H3K4me1, H3K4me3, H3K27Ac, H3K27me3. – Other chromatin proteins: e.g. P300 (acetyltransferase)
• H3K4me3 marks are enriched at active promoters– H3K4me3 marks are largely the same in all cell lines, with a small fraction of
marks being cell-specific• P300, and H3K4me1 without H3K4me3 is enriched at enhancers
– Most P300 peaks also contain H3K4me1– P300, H3K4me1 marks are highly cell-type specific– Most P300 marks are enhancers, but not all enhancers have P300– Most enhancers have an H3K4me1 mark but, not all H3K4me1 marks are in
enhancers• Other marks: H3K27Ac or H3K27me3
– Mutually exclusive marks for open (Ac) versus closed (Me3) chromatin regions
– H3K27Ac is perhaps the most general mark of open chromatin: promoters and enhancers
– Can be found in combination with H3K4 me1/me3

Combinatorial marks define subclasses of enhancers
• H3K4me1+ , H3K27Ac + mark enhancers with highest levels of activity– Represent cell-type specific active enhancers in differentiated cells– Mouse enhancers: gain K27Ac upon differentiation in mouse ES cells, leading to
higher expression
• H3K4me1+, H3K27Ac- marks– Called “intermediate” enhancers, linked to a variety of non-specific cellular functions
• In humans especially, H3K4me1+, H3K27me3+ are called “poised” enhancers, – H3K27me3 is a mark of polycomb repression; polycomb proteins are also associated
with these sites– H3K9me3+ marks also found at poised enhancers– These enhancers are associated specifically with development-related functions;
H3K27me3 may be replaced by H3K27Ac as differentiation progresses– Poised enhancers are more likely to be conserved between species, and therefore most
of the enhancers that have been tested so far are probably of this subclass

Other properties of human enhancers
• A subset of human enhancers have been shown to give rise to non-coding RNA– ChIP with the RNA pol2 antibody identifies binding to enhancers that are far
from any known gene promoters– Do not have marks that are shared by other types of promoters (e.g.
H3K4me3)– Some are verified enhancer loci, e.g. the beta-globin control region gives rise
to a regulatory RNA
• Histone marks other than H3K4 and H3K27 are also found– For example, H2 variant H2AZ and H3 variant, H3.3– Double variant (H2AZ/H3.3) marks are common at enhancers
• More sites of open chromatin (e.g. DNAse sensitive) exist that have not been associated with any specific protein, implying that the story is still more complicated
Overview: ENCODE and modENCODE
• Data paint an extremely similar picture for human, mouse and Drosophila cis-regulatory landscapes
• Promoters marked by H3K4Me3• Active enhancers marked by H3K4me1 + H3K27Ac and p300/CBP
– Major difference is that fewer fly enhancers are found far from a TSS• “Poised” enhancers marked by H3K4me1+ H3K27me3 : a mix of activating
and repressing marks, waiting to be transferred to one or the other states– Enriched in developmentally-active transcription factor and signaling
genes• Repressed regions marked by H3K9me3 (stable), H3K27me3 (dynamic)• Insulators marked by CTCF and centrosomal/cytoskeletal proteins
(CP190, cohesins)• TFBS, chromatin marks and expression data can be used to predict
regulatory relationships, but the precise linkage between regulatory elements and “target genes” is very hard to decipher, especially in mammalian genomes
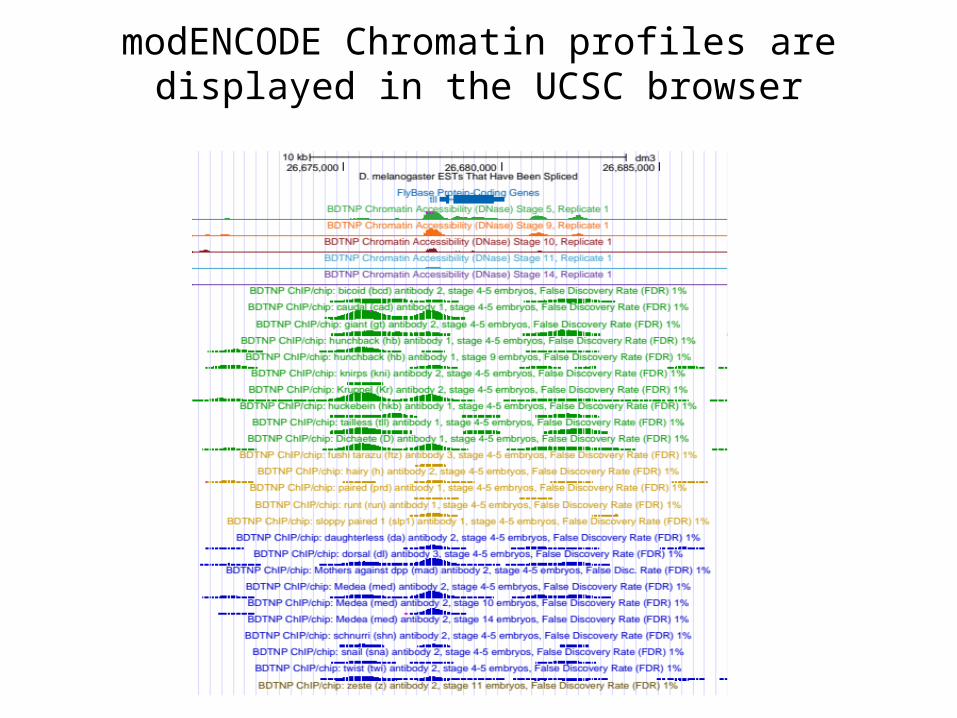
modENCODE Chromatin profiles are displayed in the UCSC browser
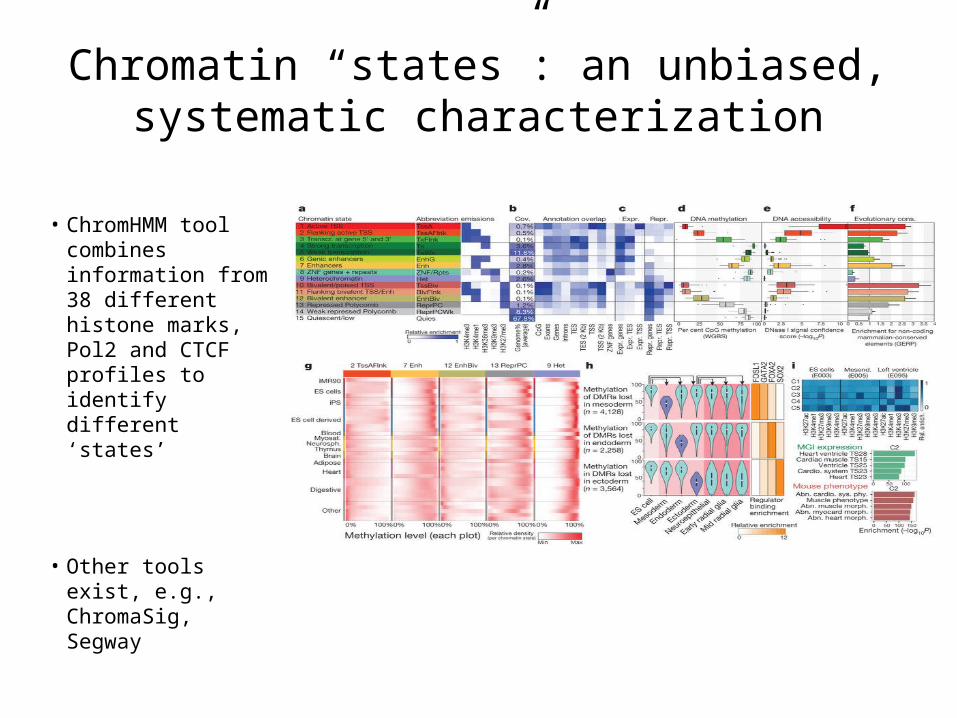
Chromatin “states”: an unbiased, systematic characterization
• ChromHMM tool combines information from 38 different histone marks, Pol2 and CTCF profiles to identify different ‘states’
• Other tools exist, e.g., ChromaSig, Segway
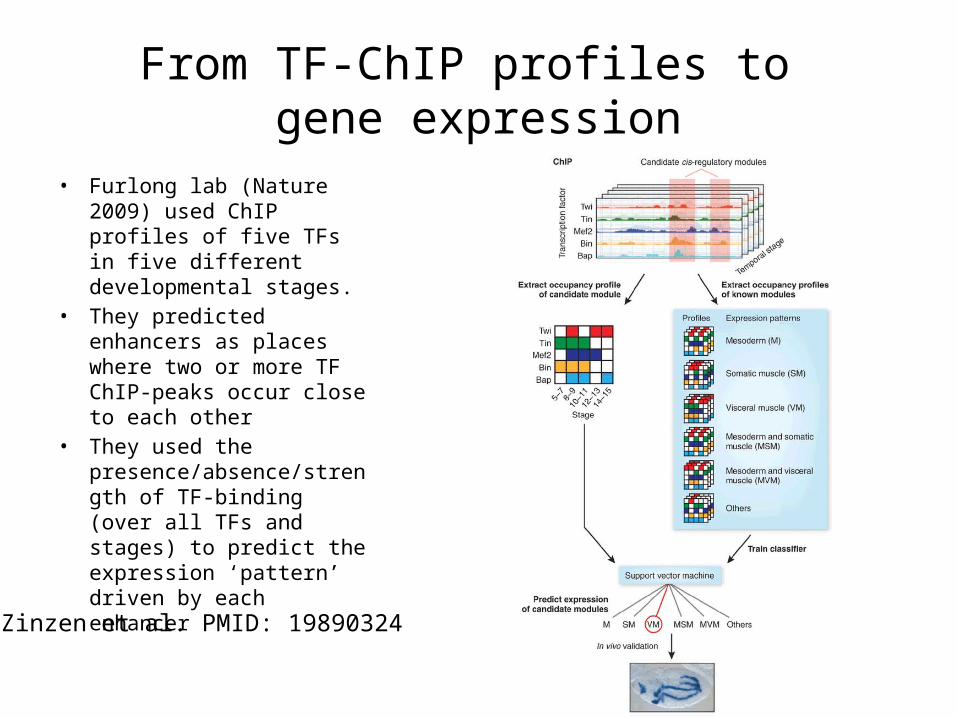
From TF-ChIP profiles to gene expression
• Furlong lab (Nature 2009) used ChIP profiles of five TFs in five different developmental stages.
• They predicted enhancers as places where two or more TF ChIP-peaks occur close to each other
• They used the presence/absence/strength of TF-binding (over all TFs and stages) to predict the expression ‘pattern’ driven by each enhancer
Zinzen et al. PMID: 19890324

From TF-ChIP profiles to TF functions
Chen et al. doi:10.1371/journal.pcbi.1003198.
Summarize TF’s ChIP profile around a gene into one score
Use TF’s ‘binding score’ at a gene to predict probability of the gene being regulated by the TF
Combine TF’s score and gene’s differential expression, repeat for every gene, and derive a ‘signature’ for the TF in the condition of study

DNA accessibility assays
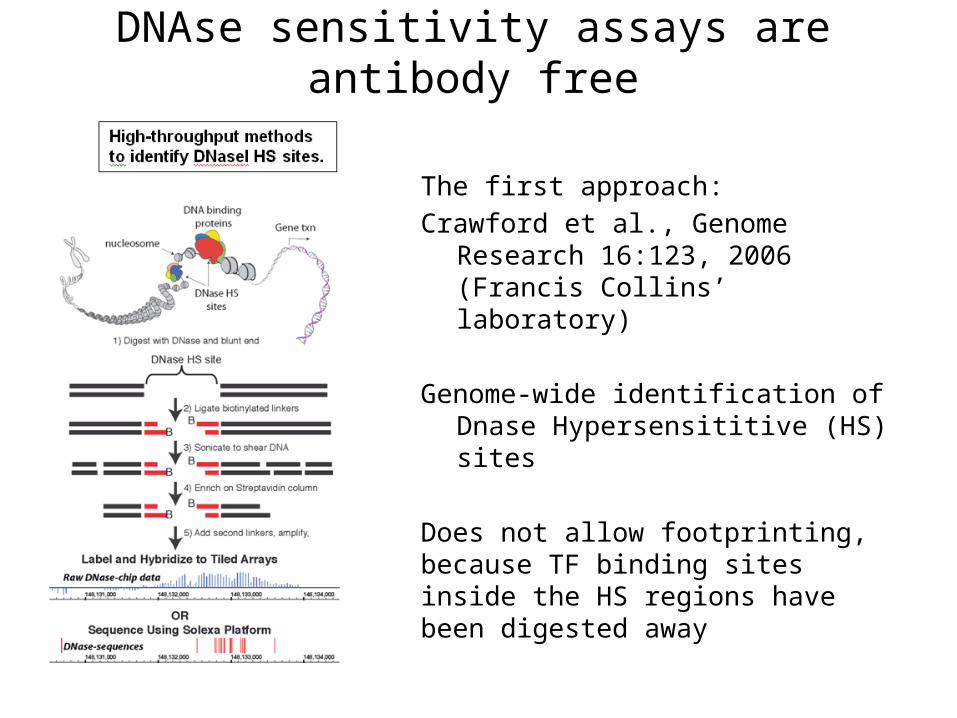
DNAse sensitivity assays are antibody free
The first approach: Crawford et al., Genome Research 16:123,
2006 (Francis Collins’ laboratory)
Genome-wide identification of Dnase Hypersensititive (HS) sites
Does not allow footprinting, because TF binding sites inside the HS regions have been digested away
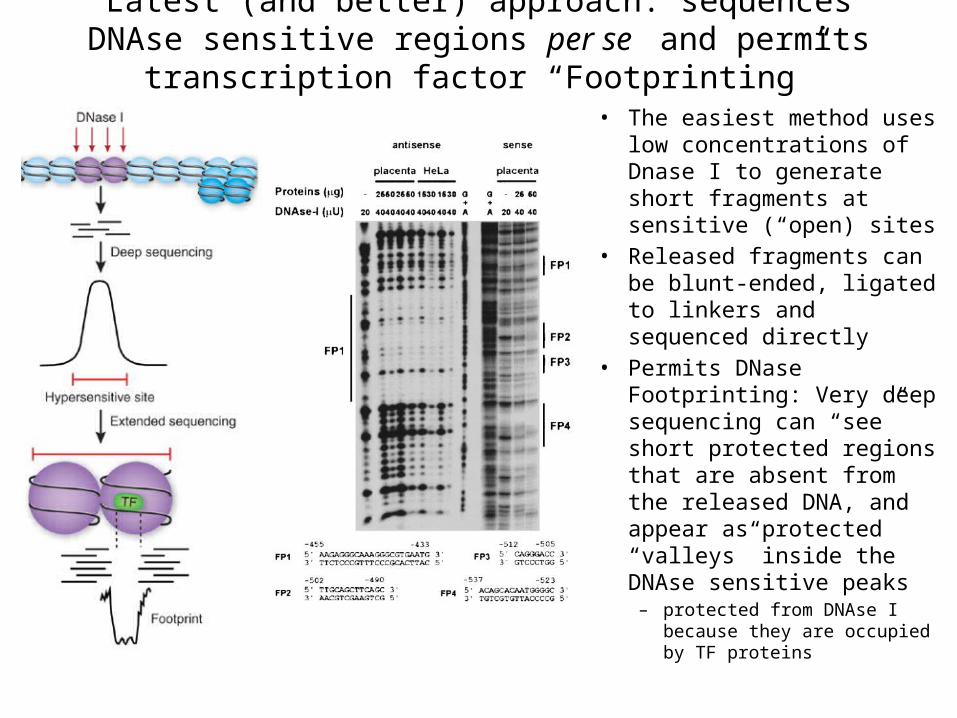
Latest (and better) approach: sequences DNAse sensitive regions per se and permits transcription factor “Footprinting”
• The easiest method uses low concentrations of Dnase I to generate short fragments at sensitive (“open) sites
• Released fragments can be blunt-ended, ligated to linkers and sequenced directly
• Permits DNase Footprinting: Very deep sequencing can “see” short protected regions that are absent from the released DNA, and appear as protected “valleys” inside the DNAse sensitive peaks
– protected from DNAse I because they are occupied by TF proteins
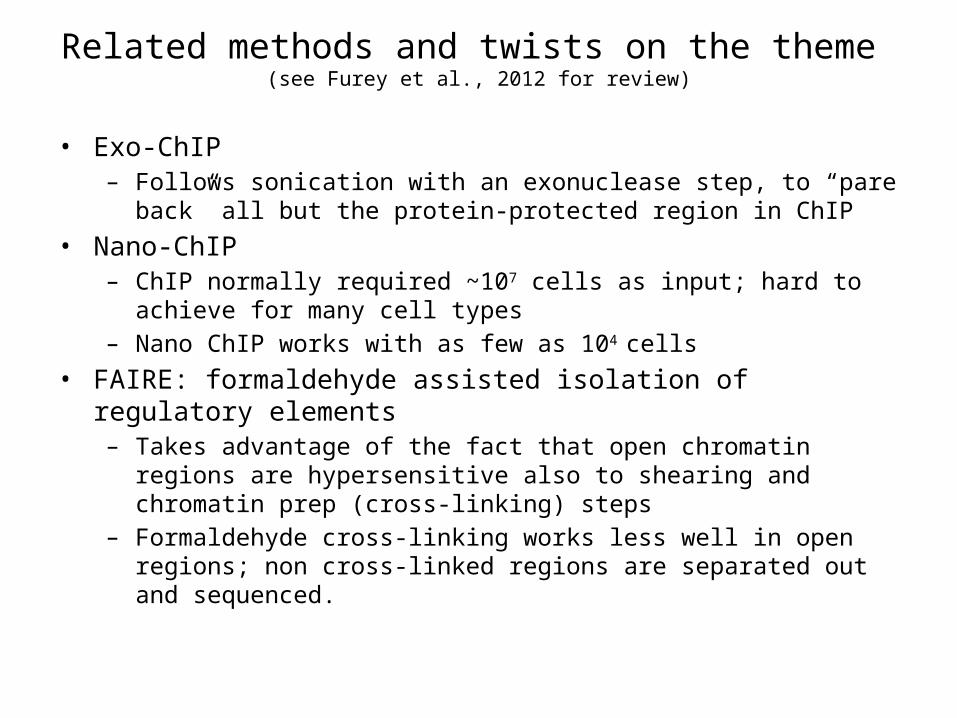
Related methods and twists on the theme (see Furey et al., 2012 for review)
• Exo-ChIP– Follows sonication with an exonuclease step, to “pare back” all but the
protein-protected region in ChIP• Nano-ChIP
– ChIP normally required ~107 cells as input; hard to achieve for many cell types– Nano ChIP works with as few as 104 cells
• FAIRE: formaldehyde assisted isolation of regulatory elements – Takes advantage of the fact that open chromatin regions are hypersensitive
also to shearing and chromatin prep (cross-linking) steps– Formaldehyde cross-linking works less well in open regions; non cross-linked
regions are separated out and sequenced.

From DNA accessibility to regulatory programs
• Obtain accessibility profile in cellular conditions of interest. • Then look for motif matches in ‘open regions’• ‘Poor man’s ChIP’• Use this computationally predicted TF-binding profile to
reconstruct regulatory networks
Blatti et al. doi: 10.1093/nar/gkv195

Accessibility profiles alone can lead to valuable insights
Evidence of lineage patterning in primary DHS data. DNase I cleavage-density profiles for 24 exemplary primary human cell types and ESCs across an 350 ∼kb region along chromosome 9. Cell types are colored according to their embryological derivation
Source: Stergachis et al http://dx.doi.org/10.1016/j.cell.2013.07.020

Accessibility profiles alone can lead to valuable insights
Clustering DHS profiles recovers precise embryological relationships. Unbiased clustering of the linear patterning of DHSs from 48 diverse, definitive cell types plus ESCs. Branches and cell types are colored according to their embryological origin, with embryological ancestors common to multiple cell types indicated on the right. Note the rooting of the tree by ESCs and the partitioning of major branches corresponding to the trilaminar embryo. Note also the demarcation of early fate decisions such as partitioning of hemangioblast derivatives into endothelia and blood.
Source: Stergachis et al http://dx.doi.org/10.1016/j.cell.2013.07.020
DNA Methylation

DNA Methylation
• Methyl (-CH3) group added to Cytosine (‘C’)• CpG (CG dinucleotide) is often methylated• CpG island: > 200 bp long stretches of DNA
enriched in CpG • CpG islands are often not methylated
(“unmethylated CpG”).• CpG islands often fall in or near promoter
regions
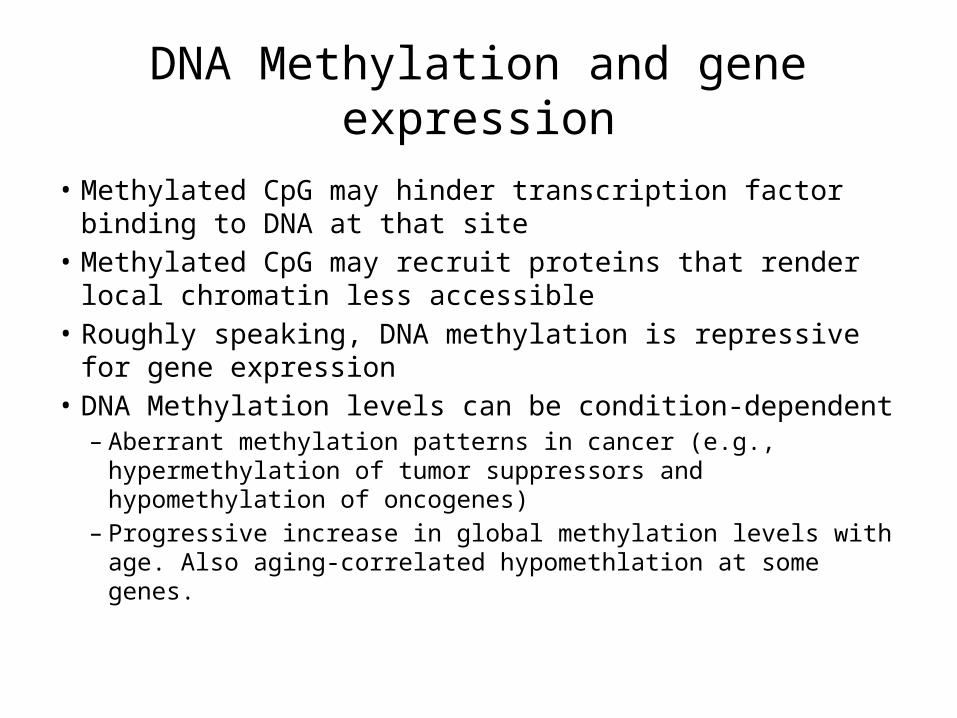
DNA Methylation and gene expression
• Methylated CpG may hinder transcription factor binding to DNA at that site
• Methylated CpG may recruit proteins that render local chromatin less accessible
• Roughly speaking, DNA methylation is repressive for gene expression
• DNA Methylation levels can be condition-dependent– Aberrant methylation patterns in cancer (e.g., hypermethylation
of tumor suppressors and hypomethylation of oncogenes)– Progressive increase in global methylation levels with age. Also
aging-correlated hypomethlation at some genes.

DNA Methylation and gene expression
• DNA methylation in gene body positively correlates with expression
• Alternative splicing: included exons tend to be more methylated than excluded exons
• Retrotransposons are usually methylated, protecting the genome against these parasitic mobile elements

CpG Methylation profiling
• Bisulfite sequencingOther methods:
• DNA cleavage by methylation-sensitive restriction enzymes
• Immunoprecipitation with methyl-binding protein
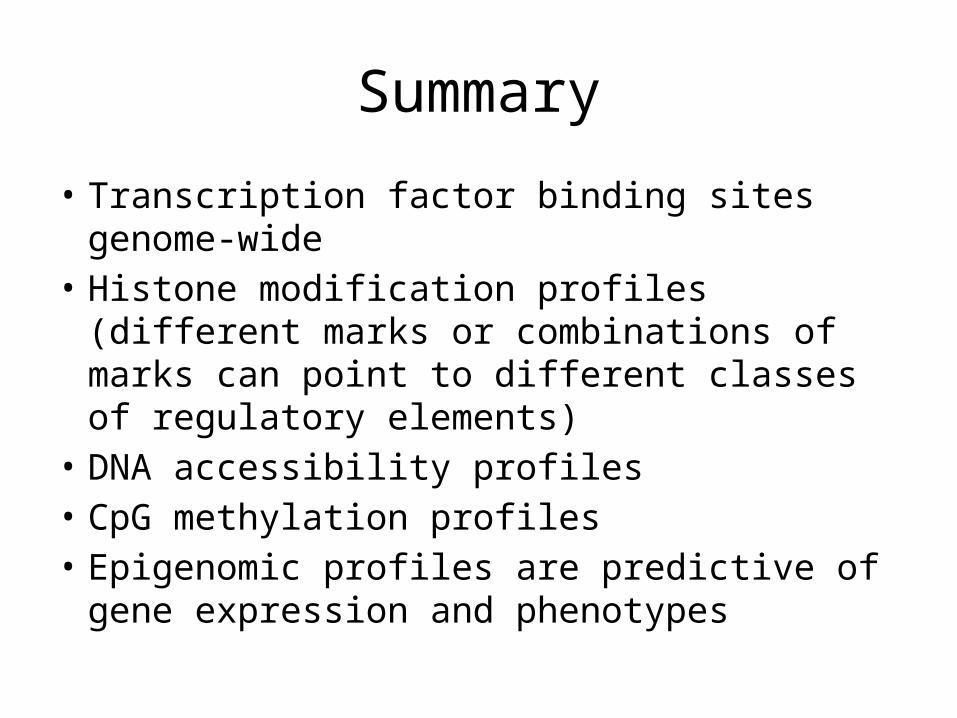
Summary
• Transcription factor binding sites genome-wide • Histone modification profiles (different marks or
combinations of marks can point to different classes of regulatory elements)
• DNA accessibility profiles• CpG methylation profiles• Epigenomic profiles are predictive of gene
expression and phenotypes