equities for the long term 2014
TRANSCRIPT

Growth of $1.00 1971-2014
$0.00
$10.00
$20.00
$30.00
$40.00
$50.00
$60.00
$70.00
$80.00
$90.00
$100.00
19
71
19
75
19
79
19
83
19
87
19
91
19
95
19
99
20
03
20
07
20
11
Stocks 10.7%
Bonds 7.7%
T-Bills 5.2%
CPI 4.2%
Long-Term Investors are Rewarded for
Taking Risk
Source: Russell, Bloomberg, Morningstar

Growth of $1.00 1941-1970
$0.00
$5.00
$10.00
$15.00
$20.00
$25.00
$30.00
$35.00
$40.00
19
41
19
44
19
47
19
50
19
53
19
56
19
59
19
62
19
65
19
68
Stocks 12.2%
Bonds 1.9%
T-Bills 2.3%
CPI 3.5%
Long-Term Favorable Stock Returns is
not a Recent Phenomenon
Source: Bloomberg, Morningstar

Earnings Growth Drives Stock Prices
S&P 500 vs. Earnings
-100
50
200
350
500
650
800
950
1100
1250
1400
1550
1700
1850
2000
2150
2300
1972
1975
1978
1981
1984
1987
1990
1993
1996
1999
2002
2005
2008
2011
2014
$0.00
$20.00
$40.00
$60.00
$80.00
$100.00
$120.00
S&P 500
E.P.S.
Source: Standard & Poors

Over Shorter Periods, Stocks and Bonds
Can and Have Declined
Time Period Stocks Nasdaq Bonds
1973 /74 -48% -58% -
1978/81 - - -6%
1987 -35% -40% -
1990 -21% -27% -
1994 - - -8%
1998 -22% - -
1999 - - -9%
2000/02 -50% -78% -
2007/09 -57% -55% -
2011 -19% -19% -
Source: Russell, Bloomberg, Standard & Poors

Bear Markets are Followed By Bull
Rallies
Bear Market Decline 3 Years Following
1929/32 -63% 68%
1937 -34% 16%
1940/41 -22% 79%
1973 /74 -48% 58%
1987 -35% 48%
1990 -21% 55%
2000/02 -50% 54%
2007/09 -57% 86%
2011 -19% 79%
Source: Bloomberg, Yahoo Finance

The “Herd” Tends to Sell at the Bottom
Performance Fund Flows
1994/95 - Bonds - 8% -$50B
1999/00 - Bonds - 9% -$60B
1999/00 - Value -15% -$80B
2001/02 - Growth -60% -$26B
2007/09 – Stocks -57% -$412B
Maintaining an Investment Program is
Essential to Achieving Investment
Objectives
Source: Bloomberg, Smith Barney

A Longer Investment Time Horizon Equals a Greater Likelihood of Outperformance
0%
20%
40%
60%
80%
100%
1 Year 5 Years 10 Years 20 Years 30 Years
Relative Performance 1931-2014
Stocks Beat Bonds Stocks Beat T-Bills Bonds Beat T-Bills
Source: Russell, Bloomberg, Standard & Poors, Morningstar
Even Better from 1950

Volatility Decreases Over Time
-50%
-40%
-30%
-20%
-10%
0%
10%
20%
30%
40%
50%
60%
1 Y
r Sto
cks
5 Y
r Sto
cks
10 Y
r Sto
cks
20 Y
r Sto
cks
30 Y
r Sto
cks
1 Y
r Bon
ds
5 Y
r Bon
ds
10 Y
r Bon
ds
20 Y
r Bon
ds
30 Y
r Bon
ds
1 Y
r T-B
ills
5 Y
r T-B
ills
10 Y
r T-B
ills
20 Y
r T-B
ills
30 Y
r T-B
ills
Average High Low
Investment Return Ranges 1930-2014
Source: Russell, Bloomberg. Standard & Poors, Morningstar

Risk Also Decreases Over TimeStandard Deviation of Investment
Returns Over Time
0.00%
5.00%
10.00%
15.00%
20.00%
1 Year 5 Year 10
Year
20
Year
30
Year
Stocks
Bonds
T-Bills
Source: Russell, Bloomberg, Standard & Poors, Morningstar

Stock Return Cycles Over Time
Returns Tend to Experience Waves
-15%
-10%
-5%
0%
5%
10%
15%
20%
25%
30%
19
04
19
10
19
16
19
22
19
28
19
34
19
40
19
46
19
52
19
58
19
64
19
70
19
76
19
82
19
88
19
94
20
00
20
06
20
12
5-Year 10-Year 20-Year
Source: Bloomberg, Standard & Poors, Morningstar

Performance Cycles are Hard to Predict
3.40%
15.20%
-12.60%
0.40%
-12.30%-11.00%
1.30%
-4.60%
4.80%
-11.90%
10.70%7.80%
16.60%
-8.80%
-15.20%
4.60%
-1.20%
1.50%
-4.70%
23.10%25.80%
-29.40%
-14.77%-12.37%
-0.20%
-10.00%
-1.70%
-12.90%
12.00%
-1.50%
17.52%
1.20%2.25%
-2.25%
0.95%
-0.40%
-40.00%
-30.00%
-20.00%
-10.00%
0.00%
10.00%
20.00%
30.00%
1979
1982
1985
1988
1991
1994
1997
2000
2003
2006
2009
2012
Value Vs. Growth
Annual Returns 1979-2009
Returns on Russell 1000 Growth Minus Russell 1000 Value
Source: Russell
Value Beats Growth
Growth Beats Value

Dow Jones vs. Earning
50
75
100
125
150
175
200
225
250
275
300
325
1921 1922 1923 1924 1925 1926 1927 1928 1929
2
4
6
8
10
12
14
16
18
20
Dow Jones E.P.S.
Secular Bull – The Roaring 20’s

Dow Jones vs. Earnings
50
75
100
125
150
175
200
225
250
275
300
325
350
1929
1931
1933
1935
1937
1939
1941
1943
1945
1947
1949
1951
1953
-1
2
5
8
11
14
17
20
23
26
29
32
35
Dow Jones E.P.S.
Consolidation - The Great Depression &
WWII
S&P 500 vs. Earnings
30
40
50
60
70
80
90
100
110
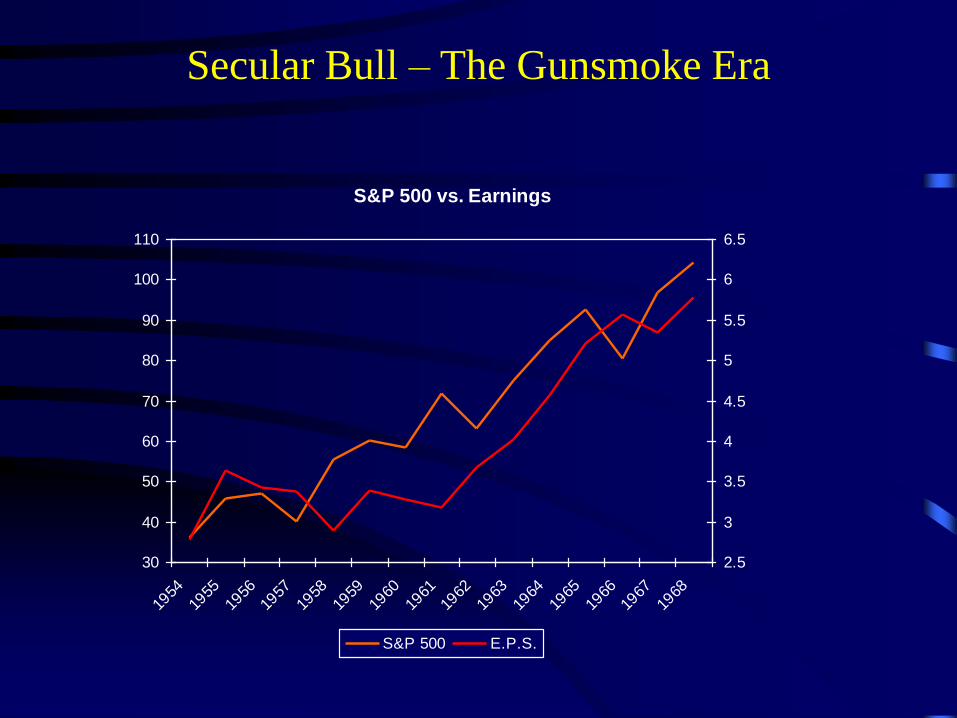
1954
1955
1956
1957
1958
1959
1960
1961
1962
1963
1964
1965
1966
1967
1968
2.5
3
3.5
4
4.5
5
5.5
6
6.5
S&P 500 E.P.S.
Secular Bull – The Gunsmoke Era

S&P 500 vs. Earnings
60
70
80
90
100
110
120
1968 1969 1970 1971 1972 1973 1974 1975 1976 1977 1978 1979
4
5
6
7
8
9
10
11
12
13
14
15
S&P 500 E.P.S.
Consolidation – Stagflation & Oil
Embargo
S&P 500 vs. Earnings
100
200
300
400
500
600
700
800
900
1000
1100
1200
1300
1400
1500
1979
1981
1983
1985
1987
1989
1991
1993
1995
1997
1999
10
15
20
25
30
35
40
45
50
55
60
65
70
75
S&P 500 E.P.S.
Secular Bull – Consumerism & Tech
Bubble

S&P 500 vs. Earnings
800.00
850.00
900.00
950.00
1,000.00
1,050.00
1,100.00
1,150.00
1,200.00
1,250.00
1,300.00
1,350.00
1,400.00
1,450.00
1,500.00
1999 2000 2001 2002 2003 2004 2005 2006 2007 2008 2009
40
45
50
55
60
65
70
75
80
85
90
95
100
S&P 500 E.P.S.
Secular Bear – Bursting Bubbles &
Financial Crisis

S&P 500 vs. Earnings
1000
1100
1200
1300
1400
1500
1600
1700
1800
1900
2000
2100
2200
2009 2010 2011 2012 2013 2014
50
60
70
80
90
100
110
120
S&P 500 E.P.S.
Secular Bull – Monetary Easing and
Stimulus

Small and Mid-Cap Stocks Have Beaten Large-Caps Over the Long-Term
Growth of $1.00
$0.00
$20.00
$40.00
$60.00
$80.00
$100.00
$120.00
$140.00
$160.00
$180.00
19
71
19
74
19
77
19
80
19
83
19
86
19
89
19
92
19
95
19
98
20
01
20
04
20
07
20
10
20
13
Large Cap 10.5% Mid-Cap 12.5% Small-Cap 11.8%
Source: RussellSmall-Caps Have Not Compensate For Higher Risk!

The Power of Compounding
1984-2014
$2,551,000
$3,709,000
$2,228,000
$0
$500,000
$1,000,000
$1,500,000
$2,000,000
$2,500,000
$3,000,000
$3,500,000
$4,000,000
Future Value of $100,000
Large 11.4%
Mid 12.8%
Small 10.9%
Small % Increases = Big Dollars Over Time!Source: Russell

Smaller Companies Can Grow Faster
Smaller Base of Earnings
Greater Opportunity
for Market Share Gains
Emerging Industries
Industry Consolidators
Entrepreneurial Managements

The Main Difference Between Mid-Caps
and Small-Caps … RISK!
Standard Deviation (30 Year)
Mid-Cap 18.4%
Small-Cap 18.8%
Stock Liquidity (Avg. Daily Volume)
Mid-Cap 3,000K
Small-Cap 500K
Profitable Business Models
Russell Mid-Cap 11.5%
Russell Small-Cap 26.0%
Source: Russell, Thomson Financial, as of 2009

Large Industries Become Dominated by a Few
Quality Companies
• Automobiles
– Ford, General Motors, Volkswagon, Toyota
• Retail
– WalMart, Home Depot, Costco
• Computing
– Apple, Microsoft, Oracle, Cisco, Intel
Preference for standards and economies of scale lead to industry consolidation.

Active vs. Passive Management
• Active Management = Not an Index Fund•Active management can potentially beat the indexes.•Fees, style and taxes must also be considered.•Most Active Managers do not beat their indexes after fees and taxes.•Active management satisfies the desire to gamble.
• Passive Management = Index Funds•Index funds own all of a specific market segment.•Index funds deliver market rates of returns at low cost.•Index funds are generally highly tax efficient.•Index funds allow for diversification by size, style, country, etc.•Index funds beat most active mutual funds over the long-term.

Evaluating Active Managers
Performance should be measured net of fees and taxes relative to the proper style index.
• Style
– Large-cap vs. Large-cap. Mid-Cap vs. Mid-
Cap. Value vs. Value. Int’l vs. Int’l. etc.
• Net of fees and taxes
– You pay fees and taxes. What is left is your
real return.
• Data Sources for Index/Benchmark Results
– Russell.com, Morningstar, Yahoo Finance
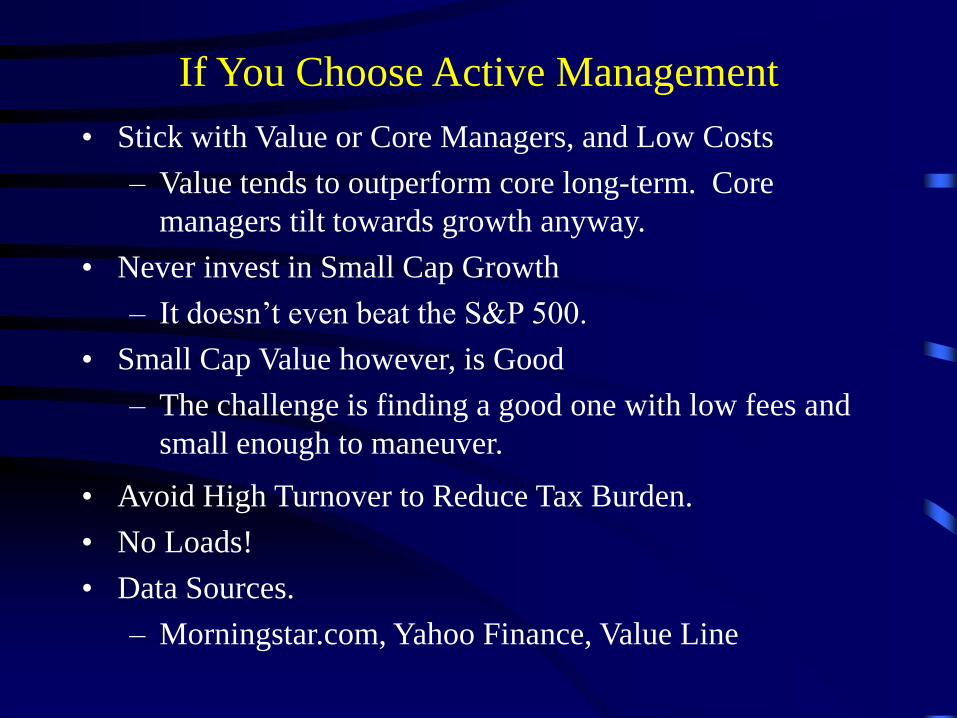
If You Choose Active Management
• Stick with Value or Core Managers, and Low Costs
– Value tends to outperform core long-term. Core
managers tilt towards growth anyway.
• Never invest in Small Cap Growth
– It doesn’t even beat the S&P 500.
• Small Cap Value however, is Good
– The challenge is finding a good one with low fees and
small enough to maneuver.
• Avoid High Turnover to Reduce Tax Burden.
• No Loads!
• Data Sources.
– Morningstar.com, Yahoo Finance, Value Line

Don’t Overdiversify!
• Benefits can be obtained with a handful of asset categories.
• Cash and Money Markets
– Most Conservative, lowest long-term return.
• Bonds/Fixed Income
– Provides interest income, preserves capital.
– Stick with intermediate investment grade (high quality).
– Use stocks for risk vs. high yield “junk bonds”.
• Equities/Stocks/Mutual Funds/Index Funds/ETF’s
– Higher risk, higher return. Returns through capital appreciation.
– Requires a long-term strategy.
• Int’l Stocks - It only takes a little.
– Important for the future as global economy develops.
– Stick with Index Funds or ETF’s.

29 Years Summary Results
Returns vs. Risk
100
Mix of Stocks/Bonds/Cash 100/0/0 0/100/0 0/0/100 90/0/10 80/15/5 70/25/5 60/35/5 50/45/5 40/55/5 30/65/5 20/75/5 10/85/5
Average Return 12.46% 7.55% 3.77% 11.58% 11.44% 11.05% 10.63% 10.16% 9.68% 9.14% 8.58% 7.99%
Std. Deviation 19.2 8.5 2.5 16.3 14.8 13.3 11.9 10.6 9.6 8.7 8.1 7.9
Return/risk 0.65 0.89 1.48 0.71 0.77 0.83 0.89 0.95 1.01 1.05 1.06 1.01
Worst 1 Year Return -42.6% -8.6% 0.1% -36.7% -31.9% -27.3% -22.7% -18.0% -13.4% -8.8% -5.9% -6.4%
Worst Absolute 3 Yr Return -23.1% 8.2% 0.4% -18.6% -13.7% -9.2% -5.0% -0.7% 3.3% 7.1% 10.8% 12.1%
$100,000 compounded over
29 years, in '000s 3,014$ 825$ 292$ 2,401$ 2,311$ 2,087$ 1,870$ 1,654$ 1,459$ 1,264$ 1,087$ 930$
Note: The stocks component of the allocation consists of 40% Largecap Blend (think S&P 500), 40% Midcap Value index and
20% Emerging Markets index. Stocks within the mixture are rebalanced annually, as are the total portfolios. Bonds are
represented by the Barclay’s Capital U.S. Aggregate bond index. Cash is represented using 90 day Treasury Bill returns. For
example the 30/65/5 column is 30% stocks (of the above indicated constituents), 65% bonds and 5% cash/T-bills.
Even Conservative Investor Should Own Some Equities
30% in Equities Had Higher Returns With Similar Risk Profile to Bonds Only

Key Variables to Retirement Planning
• Required annual income at retirement.
– Consider basic needs, healthcare, vacations, hobbies, taxes, etc.
• Income sources at retirement (Soc. Sec., consulting, etc.).
– Required savings at retirement = 20 to 25 times required pre-tax
income from savings.
• Years remaining to retirement.
• Current savings and continued annual savings.
• Required rate of return - determines required risk.
• Tools to help calculate:
– Quicken, Microsoft Money, Yahoo Finance

A Little Savings Goes a Long Way
• Assumptions:
– Starting Value = $10,000
– Annual Contribution = $5,000 (IRA Limit)
• Just over $400 per month.
– Annual Rate of Return = 8%
• Stock market returned 9.6% last century.
– Time Horizon = 25 years
• Future Value = $434,000
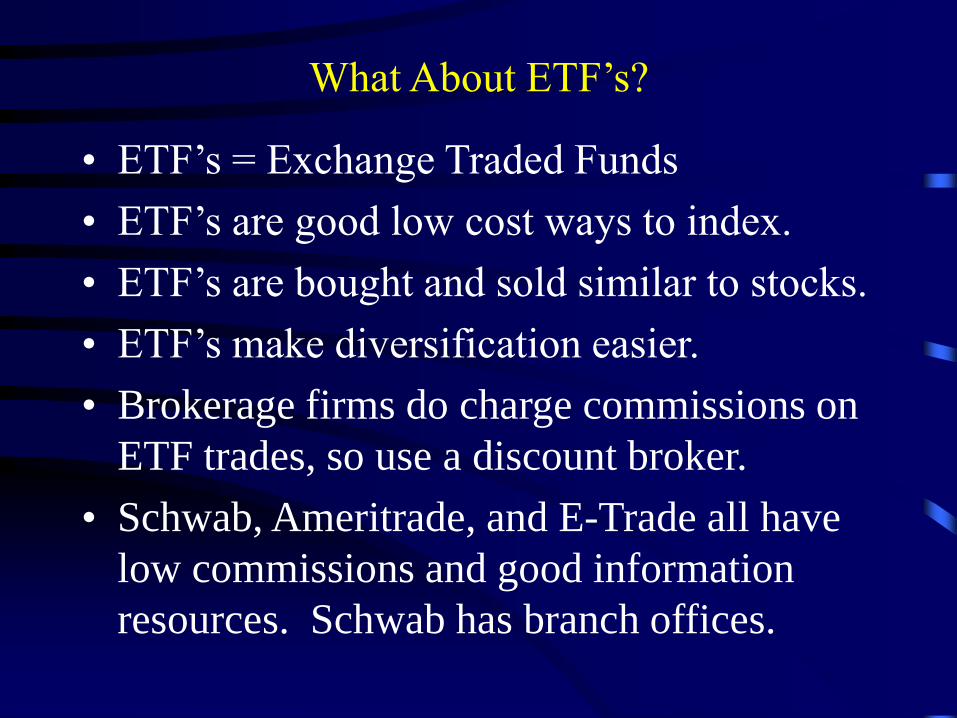
What About ETF’s?
• ETF’s = Exchange Traded Funds
• ETF’s are good low cost ways to index.
• ETF’s are bought and sold similar to stocks.
• ETF’s make diversification easier.
• Brokerage firms do charge commissions on
ETF trades, so use a discount broker.
• Schwab, Ameritrade, and E-Trade all have
low commissions and good information
resources. Schwab has branch offices.