esgデータブック esg data book 環境 environment...electricity used グループ group...
TRANSCRIPT
Scope of data collection: MARUI GROUP CO., LTD., and its consolidated subsidiaries
Review of Fiscal 2020
Environment
MARUI GROUP CO., LTD.Last Updated: July 3, 2020
ESG DATA BOOK
(Boundary is defined when non-consolidated data is used.)

Scope of data collection: MARUI GROUP CO., LTD., and its consolidated subsidiaries
Review of Fiscal 2020
Environment
Society
MARUI GROUP CO., LTD. ESG DATA BOOK
(Boundary is defined when non-consolidated data is used.)
Last Updated: July 3, 2020

Scope of data collection: MARUI GROUP CO., LTD., and its consolidated subsidiaries
Review of Fiscal 2020
Governance
(Boundary is defined when non-consolidated data is used.)
ESG DATA BOOK MARUI GROUP CO., LTD.Last Updated: July 3, 2020
最終更新日:2020年6月30日
気候変動 Climate Change
有
Yes
バウンダリ
Boundary
単位
Unit
2016年3月期
Fiscal 2016
2017年3月期
Fiscal 2017
2018年3月期
Fiscal 2018
2019年3月期
Fiscal 2019
2020年3月期
Fiscal 2020
14,434 14,920 13,818 15,109 13,799
89,179 103,264 99,286 96,232 67,916
509,070 489,439 412,256 399,926 351,962
612,683 607,623 525,360 511,267 433,677
12,382 12,418 12,445 12,123 11,710
89,179 103,264 99,286 96,232 67,916
101,561 115,682 111,731 108,355 79,626
グループ
Group- 20.7 19.4 14.9 12.4 10.3
- 1,087 962 2,247 1,650
- 1,415 411 739 439
- 2,502 1,373 2,986 2,089
グループ
Group
型数
Items1 9 29 81 61
GJ 1,964,100 1,995,137 1,989,179 1,933,139 1,820,271
(千kWh
Thousands
of kWh)
(197,001) (200,114) (199,521) (193,896) (182,575)
GJ 0 0 91 21,837 418,042
(千kWh
Thousands
of kWh)
0 0 (9) (2,190) (41,930)
232,092 234,880 228,687 221,441 215,152
8,073 10,291 15,196 15,768 14,319
100,833 101,144 94,650 107,134 105,791
2,305,099 2,341,454 2,327,713 2,277,481 2,155,533
グループ
Group- 77.8 74.9 66.0 55.3 51.4
株式会社丸井グループ
MARUI GROUP CO., LTD.
ESGデータブック ESG DATA BOOK
Last Updated: June 30, 2020
環境 Environment
環境方針
Environmental Policy
有
Yes
「丸井グループ環境方針」
http://www.0101maruigroup.co.jp/sustainability/theme03/environment_01.html#environment1
MARUI GROUP Environmental Policy
http://www.0101maruigroup.co.jp/en/sustainability/theme03/environment_01.html#environment1
気候変動方針
Policy on Climate Change
「丸井グループ環境方針」に含む
http://www.0101maruigroup.co.jp/sustainability/theme03/environment_01.html#environment1
Included in the MARUI GROUP Environmental Policy
http://www.0101maruigroup.co.jp/en/sustainability/theme03/environment_01.html#environment1
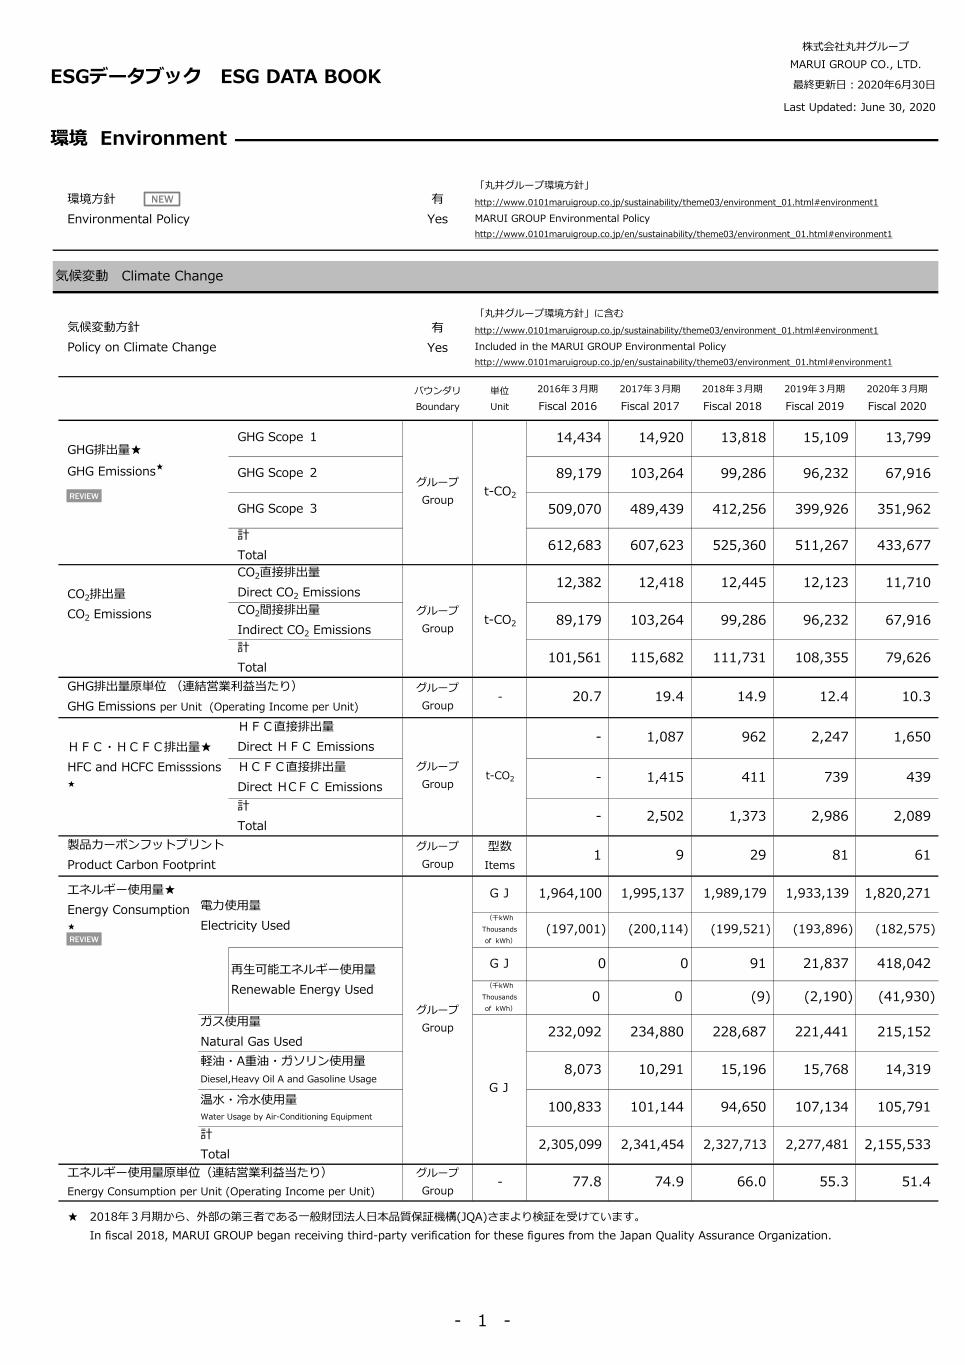
GHG排出量★
GHG Emissions★
GHG Scope 1
グループ
Groupt-CO2
GHG Scope 2
GHG Scope 3
計
Total
GHG排出量原単位 (連結営業利益当たり)
GHG Emissions per Unit (Operating Income per Unit)
HFC・HCFC排出量★
HFC and HCFC Emisssions
★
HFC直接排出量
Direct HFC Emissions
グループ
Groupt-CO2
HCFC直接排出量
Direct HCFC Emissions
計
Total
CO2排出量
CO2 Emissions
CO2直接排出量
Direct CO2 Emissions
グループ
Groupt-CO2
CO2間接排出量
Indirect CO2 Emissions
計
Total
GJ
軽油・A重油・ガソリン使用量
Diesel,Heavy Oil A and Gasoline Usage
温水・冷水使用量
Water Usage by Air-Conditioning Equipment
計
Total
エネルギー使用量原単位(連結営業利益当たり)
Energy Consumption per Unit (Operating Income per Unit)
★ 2018年3月期から、外部の第三者である一般財団法人日本品質保証機構(JQA)さまより検証を受けています。
In fiscal 2018, MARUI GROUP began receiving third-party verification for these figures from the Japan Quality Assurance Organization.
製品カーボンフットプリント
Product Carbon Footprint
エネルギー使用量★
Energy Consumption
★
電力使用量
Electricity Used
グループ
Group
再生可能エネルギー使用量
Renewable Energy Used
ガス使用量
Natural Gas Used
REVIEW
REVIEW
NEW
- 1 -
最終更新日:2020年6月30日
環境 Environment Last Updated: June 30, 2020
気候変動 Climate Change
バウンダリ
Boundary
単位
Unit
2016年3月期
Fiscal 2016
2017年3月期
Fiscal 2017
2018年3月期
Fiscal 2018
2019年3月期
Fiscal 2019
2020年3月期
Fiscal 2020
グループ
Group
千kWh
Thousands
of kWh
387 395 386 2,574 42,289
グループ
Group
百万円
Millions of
Yen
- 3,685 3,844 4,112 3,967
グループ
Group- - A- A- A A
グループ
Group
件
Sites0 0 0 0 0
資源と廃棄物 Resources and Waste
有
Yes
有
Yes
有
Yes
生物多様性方針
Biodiversity Policy
有
Yes
バウンダリ
Boundary
単位
Unit
2016年3月期
Fiscal 2016
2017年3月期
Fiscal 2017
2018年3月期
Fiscal 2018
2019年3月期
Fiscal 2019
2020年3月期
Fiscal 2020
単体:丸井
Non-consolidated:
MARUI
t 1,682 1,704 1,522 1,407 1,116
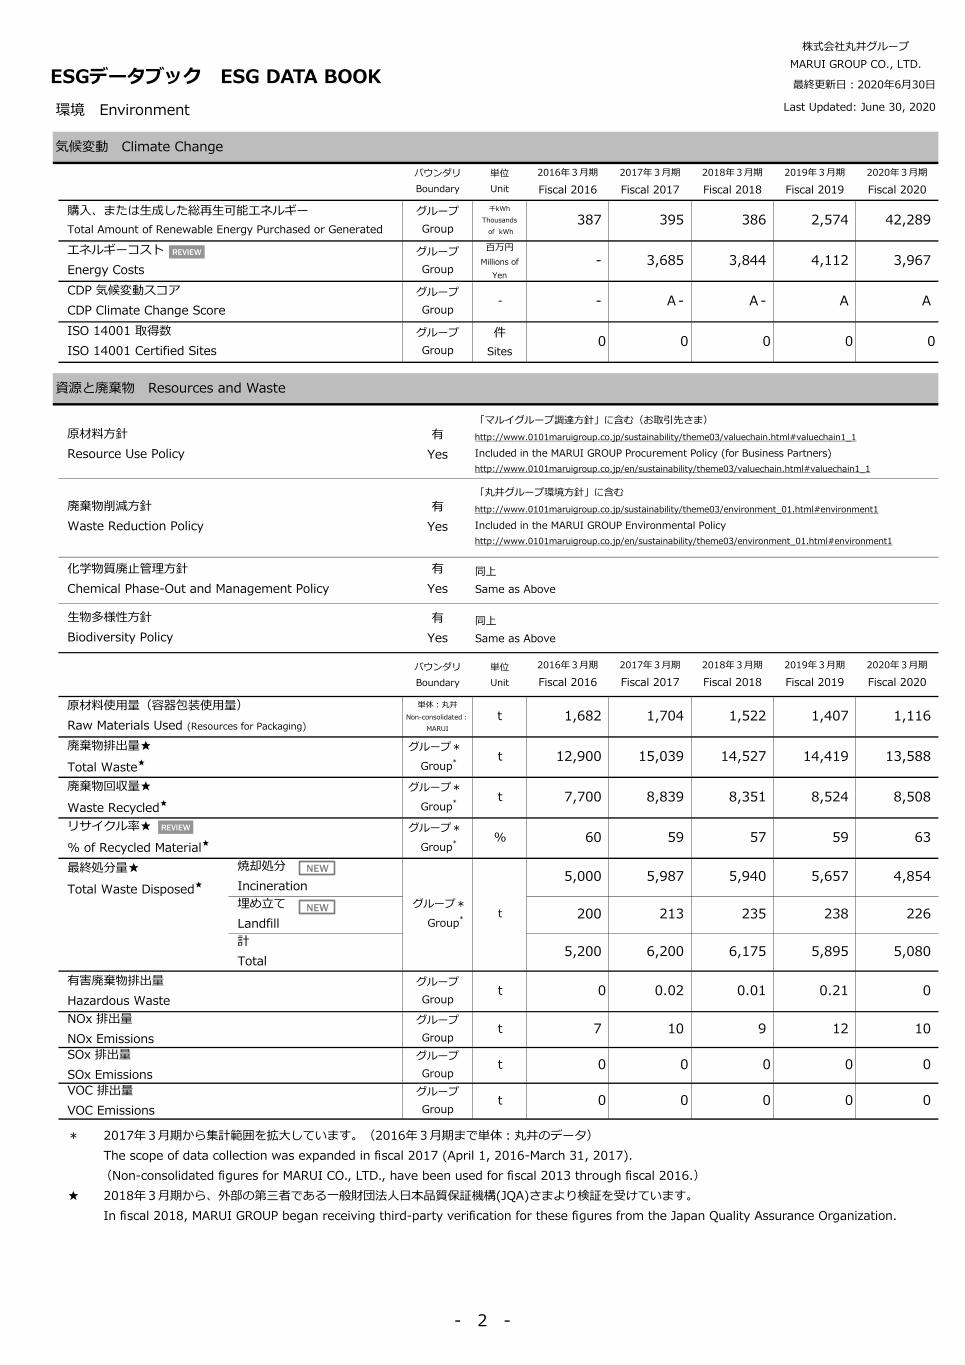
廃棄物排出量★
Total Waste★
グループ*
Group*t 12,900 15,039 14,527 14,419 13,588
廃棄物回収量★
Waste Recycled★
グループ*
Group*t 7,700 8,839 8,351 8,524 8,508
グループ*
Group*% 60 59 57 59 63
5,000 5,987 5,940 5,657 4,854
200 213 235 238 226
5,200 6,200 6,175 5,895 5,080
有害廃棄物排出量
Hazardous Waste
グループ
Groupt 0 0.02 0.01 0.21 0
NOx 排出量
NOx Emissions
グループ
Groupt 7 10 9 12 10
SOx 排出量
SOx Emissions
グループ
Groupt 0 0 0 0 0
VOC 排出量
VOC Emissions
グループ
Groupt 0 0 0 0 0
CDP 気候変動スコア
CDP Climate Change Score
ISO 14001 取得数
ISO 14001 Certified Sites
原材料方針
Resource Use Policy
「マルイグループ調達方針」に含む(お取引先さま)
http://www.0101maruigroup.co.jp/sustainability/theme03/valuechain.html#valuechain1_1
Included in the MARUI GROUP Procurement Policy (for Business Partners)
http://www.0101maruigroup.co.jp/en/sustainability/theme03/valuechain.html#valuechain1_1
廃棄物削減方針
Waste Reduction Policy
「丸井グループ環境方針」に含む
http://www.0101maruigroup.co.jp/sustainability/theme03/environment_01.html#environment1
Included in the MARUI GROUP Environmental Policy
http://www.0101maruigroup.co.jp/en/sustainability/theme03/environment_01.html#environment1
株式会社丸井グループ
MARUI GROUP CO., LTD.
ESGデータブック ESG DATA BOOK
購入、または生成した総再生可能エネルギー
Total Amount of Renewable Energy Purchased or Generated
エネルギーコスト
Energy Costs
リサイクル率★
% of Recycled Material★
最終処分量★
Total Waste Disposed★
焼却処分
Incineration
グループ*
Group*t
埋め立て
Landfill
計
Total
化学物質廃止管理方針
Chemical Phase-Out and Management Policy
原材料使用量(容器包装使用量)
Raw Materials Used (Resources for Packaging)
同上
Same as Above
同上
Same as Above
* 2017年3月期から集計範囲を拡大しています。(2016年3月期まで単体:丸井のデータ)
The scope of data collection was expanded in fiscal 2017 (April 1, 2016-March 31, 2017).
(Non-consolidated figures for MARUI CO., LTD., have been used for fiscal 2013 through fiscal 2016.)
★ 2018年3月期から、外部の第三者である一般財団法人日本品質保証機構(JQA)さまより検証を受けています。
In fiscal 2018, MARUI GROUP began receiving third-party verification for these figures from the Japan Quality Assurance Organization.
REVIEW
REVIEW
NEW
NEW
- 2 -
最終更新日:2020年6月30日
環境 Environment Last Updated: June 30, 2020
水 Water
有
Yes
バウンダリ
Boundary
単位
Unit
2016年3月期
Fiscal 2016
2017年3月期
Fiscal 2017
2018年3月期
Fiscal 2018
2019年3月期
Fiscal 2019
2020年3月期
Fiscal 2020
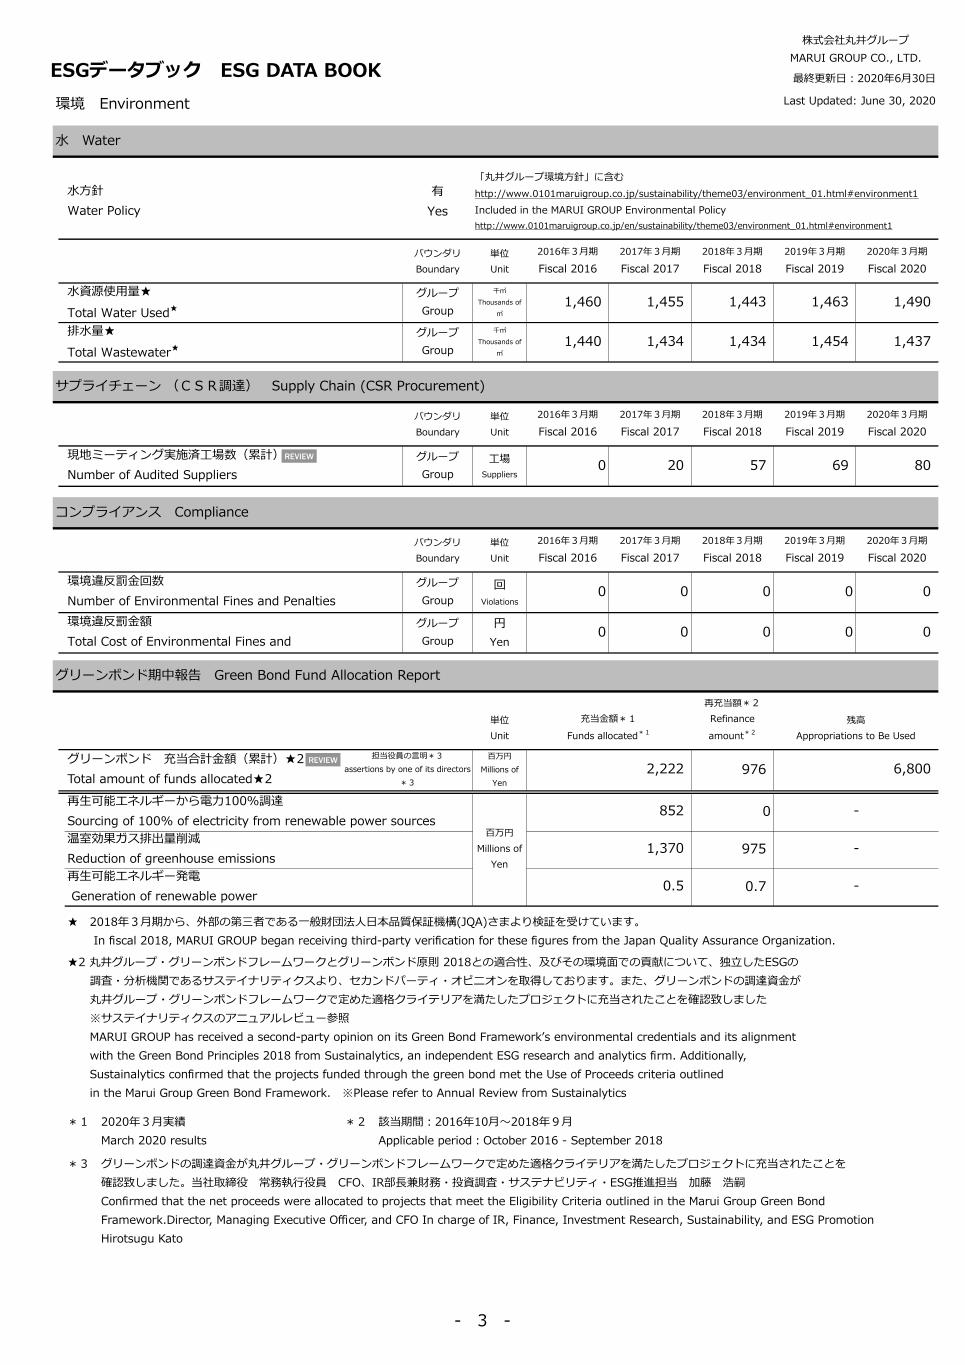
水資源使用量★
Total Water Used★
グループ
Group
千㎥
Thousands of
㎥
1,460 1,455 1,443 1,463 1,490
排水量★
Total Wastewater★
グループ
Group
千㎥
Thousands of
㎥
1,440 1,434 1,434 1,454 1,437
サプライチェーン (CSR調達) Supply Chain (CSR Procurement)
バウンダリ
Boundary
単位
Unit
2016年3月期
Fiscal 2016
2017年3月期
Fiscal 2017
2018年3月期
Fiscal 2018
2019年3月期
Fiscal 2019
2020年3月期
Fiscal 2020
グループ
Group
工場
Suppliers0 20 57 69 80
コンプライアンス Compliance
バウンダリ
Boundary
単位
Unit
2016年3月期
Fiscal 2016
2017年3月期
Fiscal 2017
2018年3月期
Fiscal 2018
2019年3月期
Fiscal 2019
2020年3月期
Fiscal 2020
グループ
Group
回
Violations0 0 0 0 0
グループ
Group
円
Yen0 0 0 0 0
グリーンボンド期中報告 Green Bond Fund Allocation Report
単位
Unit
再充当額*2
Refinance
amount*2
百万円
Millions of
Yen
976
0
975
0.7
水方針
Water Policy
「丸井グループ環境方針」に含む
http://www.0101maruigroup.co.jp/sustainability/theme03/environment_01.html#environment1
Included in the MARUI GROUP Environmental Policy
http://www.0101maruigroup.co.jp/en/sustainability/theme03/environment_01.html#environment1
現地ミーティング実施済工場数(累計)
Number of Audited Suppliers
環境違反罰金回数
Number of Environmental Fines and Penalties
環境違反罰金額
Total Cost of Environmental Fines and
充当金額*1
Funds allocated*1
残高
Appropriations to Be Used
株式会社丸井グループ
MARUI GROUP CO., LTD.
ESGデータブック ESG DATA BOOK
グリーンボンド 充当合計金額(累計)★2
Total amount of funds allocated★2
担当役員の言明*3
assertions by one of its directors
*3
2,222 6,800
再生可能エネルギーから電力100%調達
Sourcing of 100% of electricity from renewable power sources百万円
Millions of
Yen
852 -
温室効果ガス排出量削減
Reduction of greenhouse emissions1,370
*1 2020年3月実績
March 2020 results
*2 該当期間:2016年10月~2018年9月
Applicable period:October 2016 - September 2018
*3 グリーンボンドの調達資金が丸井グループ・グリーンボンドフレームワークで定めた適格クライテリアを満たしたプロジェクトに充当されたことを
確認致しました。当社取締役 常務執行役員 CFO、IR部長兼財務・投資調査・サステナビリティ・ESG推進担当 加藤 浩嗣
Confirmed that the net proceeds were allocated to projects that meet the Eligibility Criteria outlined in the Marui Group Green Bond
Framework.Director, Managing Executive Officer, and CFO In charge of IR, Finance, Investment Research, Sustainability, and ESG Promotion
Hirotsugu Kato
-
再生可能エネルギー発電
Generation of renewable power0.5 -
★ 2018年3月期から、外部の第三者である一般財団法人日本品質保証機構(JQA)さまより検証を受けています。
In fiscal 2018, MARUI GROUP began receiving third-party verification for these figures from the Japan Quality Assurance Organization.
★2 丸井グループ・グリーンボンドフレームワークとグリーンボンド原則 2018との適合性、及びその環境面での貢献について、独立したESGの
調査・分析機関であるサステイナリティクスより、セカンドパーティ・オピニオンを取得しております。また、グリーンボンドの調達資金が
丸井グループ・グリーンボンドフレームワークで定めた適格クライテリアを満たしたプロジェクトに充当されたことを確認致しました
※サステイナリティクスのアニュアルレビュー参照
MARUI GROUP has received a second-party opinion on its Green Bond Framework’s environmental credentials and its alignment
with the Green Bond Principles 2018 from Sustainalytics, an independent ESG research and analytics firm. Additionally,
Sustainalytics confirmed that the projects funded through the green bond met the Use of Proceeds criteria outlined
in the Marui Group Green Bond Framework. ※Please refer to Annual Review from Sustainalytics
REVIEW
REVIEW
- 3 -
最終更新日:2020年6月30日
Last Updated: June 30, 2020
方針 Policies
有
Yes
有
Yes
有
Yes
有
Yes
有
Yes
有
Yes
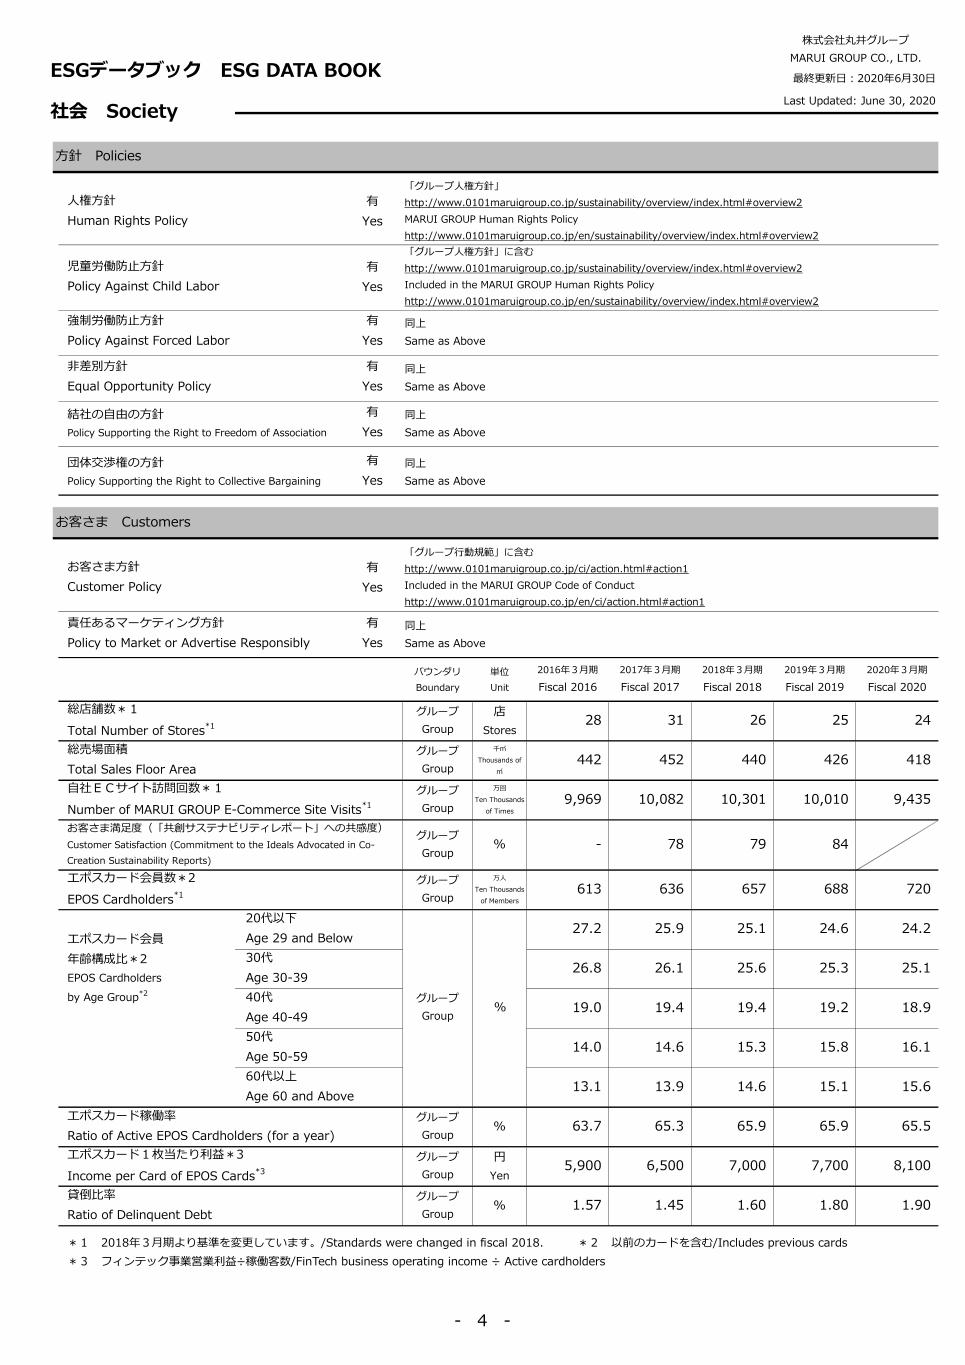
お客さま Customers
有
Yes
有
Yes
バウンダリ
Boundary
単位
Unit
2016年3月期
Fiscal 2016
2017年3月期
Fiscal 2017
2018年3月期
Fiscal 2018
2019年3月期
Fiscal 2019
2020年3月期
Fiscal 2020
グループ
Group
店
Stores28 31 26 25 24
グループ
Group
千㎡
Thousands of
㎡
442 452 440 426 418
グループ
Group
万回
Ten Thousands
of Times
9,969 10,082 10,301 10,010 9,435
グループ
Group% - 78 79 84
グループ
Group
万人
Ten Thousands
of Members
613 636 657 688 720
27.2 25.9 25.1 24.6 24.2
26.8 26.1 25.6 25.3 25.1
19.0 19.4 19.4 19.2 18.9
14.0 14.6 15.3 15.8 16.1
13.1 13.9 14.6 15.1 15.6
グループ
Group% 63.7 65.3 65.9 65.9 65.5
グループ
Group
円
Yen5,900 6,500 7,000 7,700 8,100
グループ
Group% 1.57 1.45 1.60 1.80 1.90
株式会社丸井グループ
MARUI GROUP CO., LTD.
ESGデータブック ESG DATA BOOK
非差別方針
Equal Opportunity Policy
同上
Same as Above
結社の自由の方針
Policy Supporting the Right to Freedom of Association
同上
Same as Above
団体交渉権の方針
Policy Supporting the Right to Collective Bargaining
同上
Same as Above
社会 Society
人権方針
Human Rights Policy
「グループ人権方針」
http://www.0101maruigroup.co.jp/sustainability/overview/index.html#overview2
MARUI GROUP Human Rights Policy
http://www.0101maruigroup.co.jp/en/sustainability/overview/index.html#overview2
児童労働防止方針
Policy Against Child Labor
「グループ人権方針」に含む
http://www.0101maruigroup.co.jp/sustainability/overview/index.html#overview2
Included in the MARUI GROUP Human Rights Policy
http://www.0101maruigroup.co.jp/en/sustainability/overview/index.html#overview2
強制労働防止方針
Policy Against Forced Labor
同上
Same as Above
総売場面積
Total Sales Floor Area
自社ECサイト訪問回数*1
Number of MARUI GROUP E-Commerce Site Visits*1
お客さま満足度(「共創サステナビリティレポート」への共感度)
Customer Satisfaction (Commitment to the Ideals Advocated in Co-
Creation Sustainability Reports)
エポスカード会員数*2
EPOS Cardholders*1
エポスカード会員
年齢構成比*2
EPOS Cardholders
by Age Group*2
20代以下
Age 29 and Below
お客さま方針
Customer Policy
「グループ行動規範」に含む
http://www.0101maruigroup.co.jp/ci/action.html#action1
Included in the MARUI GROUP Code of Conduct
http://www.0101maruigroup.co.jp/en/ci/action.html#action1
責任あるマーケティング方針
Policy to Market or Advertise Responsibly
総店舗数*1
Total Number of Stores*1
同上
Same as Above
エポスカード稼働率
Ratio of Active EPOS Cardholders (for a year)
エポスカード1枚当たり利益*3
Income per Card of EPOS Cards*3
貸倒比率
Ratio of Delinquent Debt
*1 2018年3月期より基準を変更しています。/Standards were changed in fiscal 2018. *2 以前のカードを含む/Includes previous cards
*3 フィンテック事業営業利益÷稼働客数/FinTech business operating income ÷ Active cardholders
グループ
Group%
30代
Age 30-39
40代
Age 40-49
50代
Age 50-59
60代以上
Age 60 and Above
- 4 -

最終更新日:2020年6月30日
社会 Society Last Updated: June 30, 2020
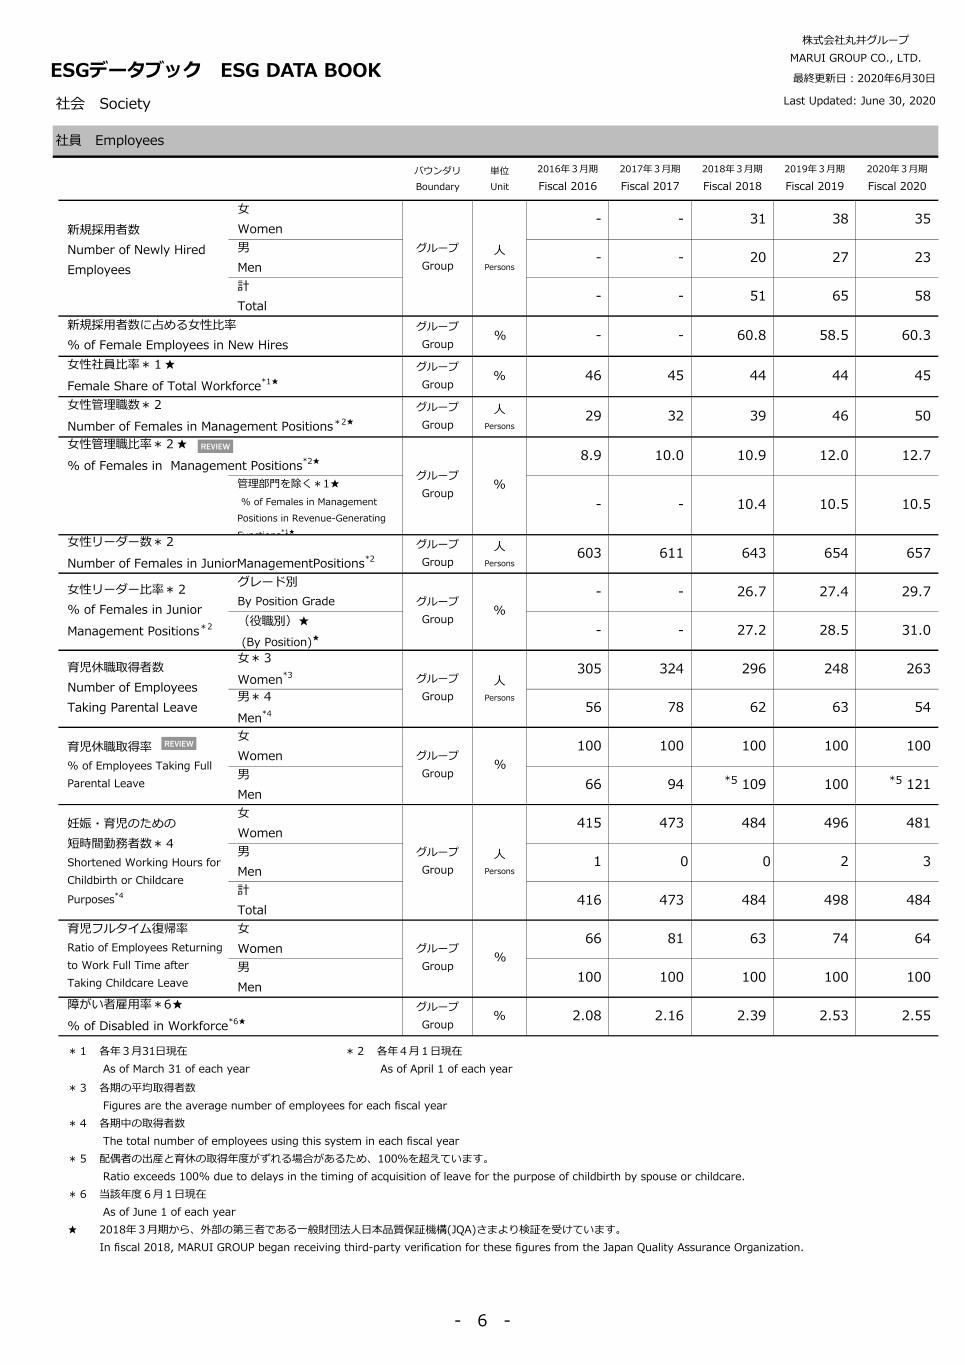
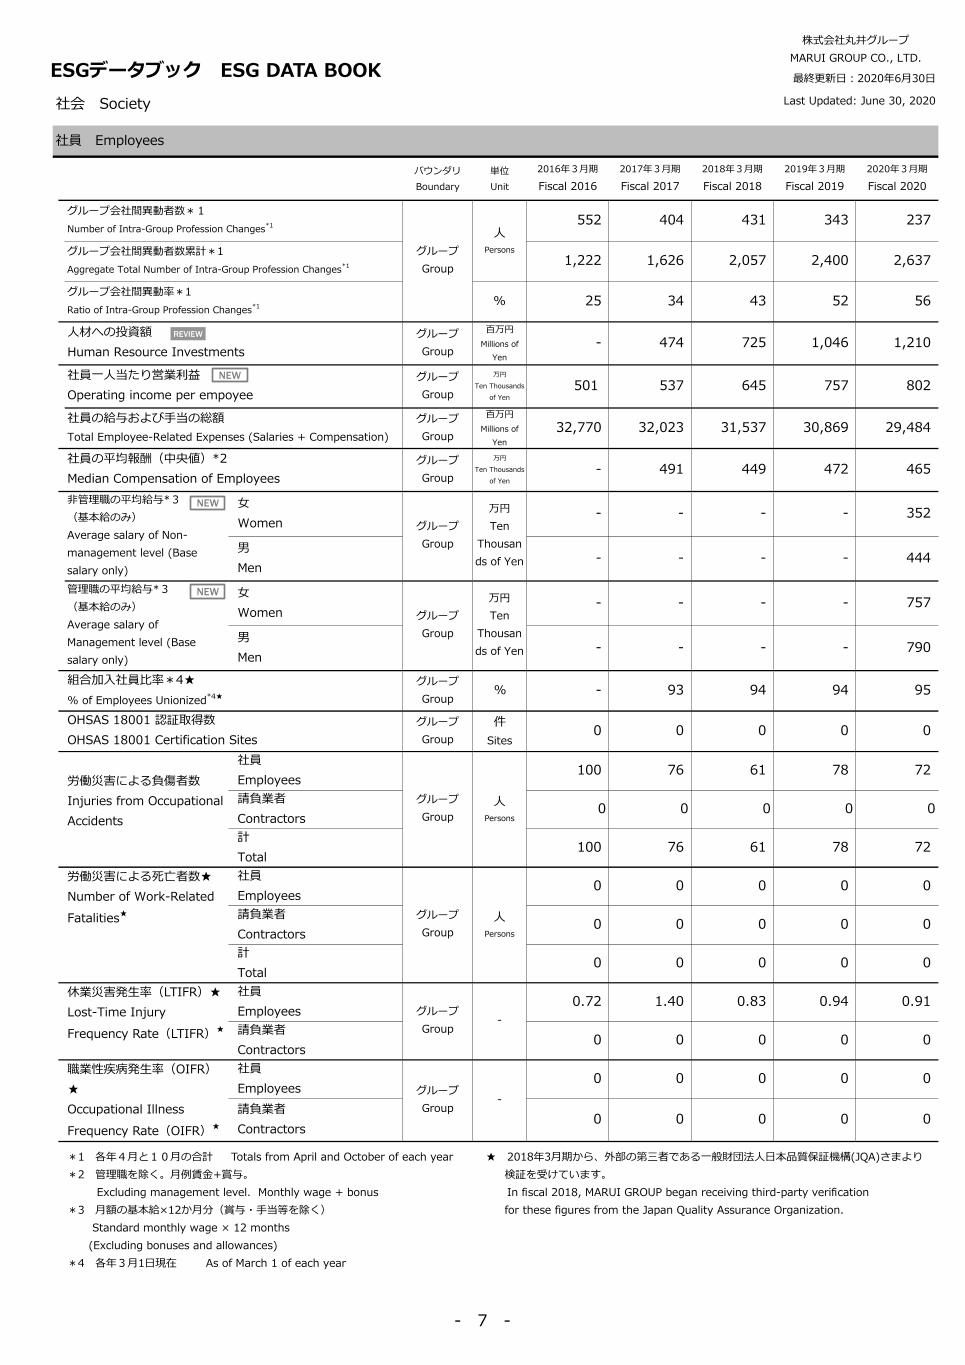
社員 Employees
有
Yes
有
Yes2020年3月期
バウンダリ
Boundary
単位
Unit
2016年3月期
Fiscal 2016
2017年3月期
Fiscal 2017
2018年3月期
Fiscal 2018
2019年3月期
Fiscal 2019
2020年3月期
Fiscal 2020
女
Women2,685 2,584 2,466 2,340 2,297
男
Men3,214 3,148 3,082 2,986 2,833
計
Total5,899 5,732 5,548 5,326 5,130
女
Women1,585 1,422 1,325 1,207 1,095
男
Men362 333 317 313 358
計
Total1,947 1,755 1,642 1,520 1,453
女
Women0 0 0 0 0
男
Men0 0 0 0 0
計
Total0 0 0 0 0
女
Women13.7 14.6 15.6 16.5 17.4
男
Men22.2 22.7 23.3 23.7 24.0
計
Total18.1 18.8 19.6 20.3 20.8
女
Women38.7 39.3 40.4 41.3 41.9
男
Men46.1 46.4 46.7 47.3 47.7
計
Total41.7 42.3 43.0 43.9 44.4
2.0 2.7 2.9 3.0 2.6
3.2 4.2 4.2 5.5 7.7
(2.1) (3.2) (3.1) (3.6) (5.7)
バウンダリ
Boundary
バウンダリ
Boundary
男
men
女
Women
26 32
25 26
株式会社丸井グループ
MARUI GROUP CO., LTD.
ESGデータブック ESG DATA BOOK
平均臨時雇用者数*1
(パートタイム雇用者数)
Number of Temporary
Employees*1
(Number of Part-Time
Employees)
グループ
Group
人
Persons
請負業者数
Number of
Contractors
グループ
Group
人
Persons
人材開発方針
Training Policy
「グループ行動規範」に含む
http://www.0101maruigroup.co.jp/ci/action.html#action1
Included in the MARUI GROUP Code of Conduct
http://www.0101maruigroup.co.jp/en/ci/action.html#action1
労働安全衛生方針
Occupational Health and Safety Policy
「グループ安全衛生方針」
http://www.0101maruigroup.co.jp/sustainability/theme02/health.html#health3_0
MARUI GROUP Occupational Health and Safety Policy
http://www.0101maruigroup.co.jp/en/sustainability/theme02/health.html#health3_0
社員数*1
Number of
Employees*1
グループ
Group
人
Persons
社員離職率*5
Employee Turnover Rate
自己都合★*6
Full-Time Staff Voluntary Turnover Rate★
グループ
Group%計★ Total
★
(定年退職者除く)
(Excluding Retirements)
平均勤続年数*1*3
Average Number of
Consecutive
Years Served*1
グループ
Group
年
Years
平均年齢*1*4
Average Age of
Employees*1
グループ
Group
歳
Age
新卒入社者の定着人数*2
Number of new graduates hire retention*2
男女計
Total
2017年4月新卒入社者
New graduate hires in April 2017 グループ
Group
人
persons
58
うち2020年4月在籍者
Of which, those remaining in April 202051
*1 各年3月31日現在 As of March 31 of each year *2 新卒入社者58人に対し、退職者7名、退職率12% 7 retired, 12% turnover rate for 58 new graduates.
*3 2020年公開分より社員の対象範囲を拡大(契約社員のうち、無期雇用契約への変更者を含む)。過年度分も修正しています。
The scope of employees has been expanded from fiscal 2020 release. (Including contract employees who have changed their employment contract
to non-fixed-term contracts). Figures for previous years have also been revised.
*4 2020年公開分より社員の対象範囲を拡大(契約社員・時給労働者も含む)。過年度分も修正しています。
The scope of employees has been expanded from fiscal 2020 release.(Including contract employees and hourly workers). Figures for previous years have also been revised.
*5 2020年公開分より社員の対象範囲を拡大(休職者を含む)。過年度分も修正しています。
The scope of employees has been expanded from fiscal 2020 release. (Including employees on leave). Figures for previous years have also been revised.
*6 自己都合での離職とは、全離職者から定年退職者、死亡退職者、懲戒解雇者、諭旨解雇者、その他会社都合退職者以外の理由での離職者と定義する。
The full-time staff voluntary turnover rate is calculated using the total number of employees leaving their positions excluding those leaving due to mandatory retirement,
those that passed away, those that were removed from positions for disciplinary reasons, those that resigned at the suggestion of the Company, and those that left for other
reasons at the convenience of the Company.
★ 2018年3月期から、外部の第三者である一般財団法人日本品質保証機構(JQA)さまより検証を受けています。
In fiscal 2018, MARUI GROUP began receiving third-party verification for these figures from the Japan Quality Assurance Organization.
REVIEW
- 5 -
最終更新日:2020年6月30日
社会 Society Last Updated: June 30, 2020
社員 Employees
バウンダリ
Boundary
単位
Unit
2016年3月期
Fiscal 2016
2017年3月期
Fiscal 2017
2018年3月期
Fiscal 2018
2019年3月期
Fiscal 2019
2020年3月期
Fiscal 2020
女
Women- - 31 38 35
男
Men- - 20 27 23
計
Total- - 51 65 58
グループ
Group% - - 60.8 58.5 60.3
グループ
Group% 46 45 44 44 45
グループ
Group
人
Persons29 32 39 46 50
8.9 10.0 10.9 12.0 12.7
- - 10.4 10.5 10.5
グループ
Group
人
Persons603 611 643 654 657
- - 26.7 27.4 29.7
- - 27.2 28.5 31.0
女*3
Women*3
305 324 296 248 263
男*4
Men*4
56 78 62 63 54
女
Women100 100 100 100 100
男
Men66 94 109 100 121
女
Women415 473 484 496 481
男
Men1 0 0 2 3
計
Total416 473 484 498 484
女
Women66 81 63 74 64
男
Men100 100 100 100 100
グループ
Group% 2.08 2.16 2.39 2.53 2.55
新規採用者数
Number of Newly Hired
Employees
グループ
Group
人
Persons
新規採用者数に占める女性比率
% of Female Employees in New Hires
女性社員比率*1★
Female Share of Total Workforce*1★
女性管理職数*2
Number of Females in Management Positions*2★
株式会社丸井グループ
MARUI GROUP CO., LTD.
ESGデータブック ESG DATA BOOK
育児休職取得者数
Number of Employees
Taking Parental Leave
グループ
Group
人
Persons
育児休職取得率
% of Employees Taking Full
Parental Leave
グループ
Group%
女性管理職比率*2★
% of Females in Management Positions*2★
グループ
Group%管理部門を除く*1★
% of Females in Management
Positions in Revenue-Generating
Functions*1★
女性リーダー数*2
Number of Females in JuniorManagementPositions*2
女性リーダー比率*2
% of Females in Junior
Management Positions*2
グレード別
By Position Grade グループ
Group%
(役職別)★
(By Position)★
障がい者雇用率*6★
% of Disabled in Workforce*6★
*1 各年3月31日現在
As of March 31 of each year
*2 各年4月1日現在
As of April 1 of each year
*3 各期の平均取得者数
Figures are the average number of employees for each fiscal year
*4 各期中の取得者数
The total number of employees using this system in each fiscal year
*5 配偶者の出産と育休の取得年度がずれる場合があるため、100%を超えています。
Ratio exceeds 100% due to delays in the timing of acquisition of leave for the purpose of childbirth by spouse or childcare.
*6 当該年度6月1日現在
As of June 1 of each year
★ 2018年3月期から、外部の第三者である一般財団法人日本品質保証機構(JQA)さまより検証を受けています。
In fiscal 2018, MARUI GROUP began receiving third-party verification for these figures from the Japan Quality Assurance Organization.
妊娠・育児のための
短時間勤務者数*4
Shortened Working Hours for
Childbirth or Childcare
Purposes*4
グループ
Group
人
Persons
育児フルタイム復帰率
Ratio of Employees Returning
to Work Full Time after
Taking Childcare Leave
グループ
Group%
*5 *5
REVIEW
REVIEW
- 6 -
最終更新日:2020年6月30日
社会 Society Last Updated: June 30, 2020
社員 Employees
バウンダリ
Boundary
単位
Unit
2016年3月期
Fiscal 2016
2017年3月期
Fiscal 2017
2018年3月期
Fiscal 2018
2019年3月期
Fiscal 2019
2020年3月期
Fiscal 2020
552 404 431 343 237
1,222 1,626 2,057 2,400 2,637
% 25 34 43 52 56
グループ
Group
百万円
Millions of
Yen
- 474 725 1,046 1,210
グループ
Group
万円
Ten Thousands
of Yen
501 537 645 757 802
グループ
Group
百万円
Millions of
Yen
32,770 32,023 31,537 30,869 29,484
グループ
Group
万円
Ten Thousands
of Yen
- 491 449 472 465
女
Women- - - - 352
男
Men- - - - 444
女
Women- - - - 757
男
Men- - - - 790
グループ
Group% - 93 94 94 95
グループ
Group
件
Sites0 0 0 0 0
社員
Employees100 76 61 78 72
請負業者
Contractors0 0 0 0 0
計
Total100 76 61 78 72
社員
Employees0 0 0 0 0
請負業者
Contractors0 0 0 0 0
計
Total0 0 0 0 0
社員
Employees0.72 1.40 0.83 0.94 0.91
請負業者
Contractors0 0 0 0 0
社員
Employees0 0 0 0 0
請負業者
Contractors0 0 0 0 0
株式会社丸井グループ
MARUI GROUP CO., LTD.
ESGデータブック ESG DATA BOOK
社員一人当たり営業利益
Operating income per empoyee
社員の給与および手当の総額
Total Employee-Related Expenses (Salaries + Compensation)
社員の平均報酬(中央値)*2
Median Compensation of Employees
グループ会社間異動者数*1
Number of Intra-Group Profession Changes*1
グループ
Group
人
Personsグループ会社間異動者数累計*1
Aggregate Total Number of Intra-Group Profession Changes*1
グループ会社間異動率*1
Ratio of Intra-Group Profession Changes*1
人材への投資額
Human Resource Investments
★ 2018年3月期から、外部の第三者である一般財団法人日本品質保証機構(JQA)さまより
検証を受けています。
In fiscal 2018, MARUI GROUP began receiving third-party verification
for these figures from the Japan Quality Assurance Organization.
*1 各年4月と10月の合計 Totals from April and October of each year
*2 管理職を除く。月例賃金+賞与。
Excluding management level. Monthly wage + bonus
*3 月額の基本給×12か月分(賞与・手当等を除く)
Standard monthly wage × 12 months
(Excluding bonuses and allowances)
*4 各年3月1日現在 As of March 1 of each year
休業災害発生率(LTIFR)★
Lost-Time Injury
Frequency Rate(LTIFR)★
グループ
Group-
職業性疾病発生率(OIFR)
★
Occupational Illness
Frequency Rate(OIFR)★
グループ
Group-
非管理職の平均給与*3
(基本給のみ)
Average salary of Non-
management level (Base
salary only)
グループ
Group
万円
Ten
Thousan
ds of Yen
管理職の平均給与*3
(基本給のみ)
Average salary of
Management level (Base
salary only)
グループ
Group
万円
Ten
Thousan
ds of Yen
労働災害による負傷者数
Injuries from Occupational
Accidents
グループ
Group
人
Persons
労働災害による死亡者数★
Number of Work-Related
Fatalities★ グループ
Group
人
Persons
組合加入社員比率*4★
% of Employees Unionized*4★
OHSAS 18001 認証取得数
OHSAS 18001 Certification Sites
REVIEW
NEW
NEW
NEW
- 7 -

最終更新日:2020年6月30日
社会 Society Last Updated: June 30, 2020
社員 Employees
バウンダリ
Boundary
単位
Unit
2016年3月期
Fiscal 2016
2017年3月期
Fiscal 2017
2018年3月期
Fiscal 2018
2019年3月期
Fiscal 2019
2020年3月期
Fiscal 2020
グループ
Group
人
Persons540 568 571 543 524
社員
Employees75 500 1,767 3,674 4,442
テナントさま
Tenants- 28 251 647 911
社員
Employees309 1,249 2,787 3,952 4,596
テナントさま
Tenants- 4 131 299 489
お取引先さま Business Partners
バウンダリ
Boundary
単位
Unit
2016年3月期
Fiscal 2016
2017年3月期
Fiscal 2017
2018年3月期
Fiscal 2018
2019年3月期
Fiscal 2019
2020年3月期
Fiscal 2020
グループ
Group
回
Times1 2 2 1 1
バウンダリ
Boundary
単位
Unit
2016年3月期
Fiscal 2016
2017年3月期
Fiscal 2017
2018年3月期
Fiscal 2018
2019年3月期
Fiscal 2019
2020年3月期
Fiscal 2020
グループ
Group
百万円
Millions of
Yen
- 141 135 187 194
情報セキュリティ Information Security
有
Yes
有
Yes
有
Yes
バウンダリ
Boundary
単位
Unit
2016年3月期
Fiscal 2016
2017年3月期
Fiscal 2017
2018年3月期
Fiscal 2018
2019年3月期
Fiscal 2019
2020年3月期
Fiscal 2020
グループ
Group
件
Sites1 1 1 1 1
グループ
Group
件
Sites1 1 1 1 1
グループ
Group
社
Companies4 6 6 6 6
グループ
Group
件
Violations0 0 0 0 0
グループ
Group
円
Yen0 0 0 0 0
サービス介助士資格取得者数
Number of Employees with Service Care-Fitter Qualifications
LGBT研修累計受講者数
Aggregate Number of
Employees and Tenants That
Have Undergone LGBT Manner
グループ
Group
株式会社丸井グループ
MARUI GROUP CO., LTD.
ESGデータブック ESG DATA BOOK
お取引先さま説明会開催回数
Number of Explanatory Forums for Business Partners
地域・社会 Communities and Society
人
Persons
ユニバーサルマナー検定3級
累計受講者数
Number of Employees and
Tenants That Have Taken the
Rank 3 Universal Manner
グループ
Group
人
Persons
ISO 27001 取得数
ISO 27001 Certification Sites
ISO 20000 取得数
ISO 20000 Certification Sites
プライバシーマーク取得社数
Number of PrivacyMark-Certified Group Companies
情報セキュリティ違反件数
Number of Data Security Violations
情報セキュリティ違反罰金額
Total Cost of Fines for Information Security Violations
寄付金額(寄付金+賦課金)
Total Amount of Corporate or Group Donations
情報セキュリティ保護方針
Policy on Data Security Protection
「グループ情報セキュリティ方針」
http://www.0101maruigroup.co.jp/sustainability/theme04/risk.html
MARUI GROUP Information Security Policy
http://www.0101maruigroup.co.jp/en/sustainability/theme04/risk.html
個人情報保護方針
Policy on Privacy Security Protection
「グループ プライバシーポリシー」
http://www.0101maruigroup.co.jp/sustainability/theme04/risk.html
MARUI GROUP Privacy Policy
http://www.0101maruigroup.co.jp/en/sustainability/theme04/risk.html
ソーシャルメディア方針
Policy on Social Media Privacy Security
Protection
「グループ ソーシャルメディアポリシー」
http://www.0101maruigroup.co.jp/sustainability/theme04/risk.html
MARUI GROUP Social Media Policy
http://www.0101maruigroup.co.jp/en/sustainability/theme04/risk.html
- 8 -
最終更新日:2020年6月30日
Last Updated: June30, 2020
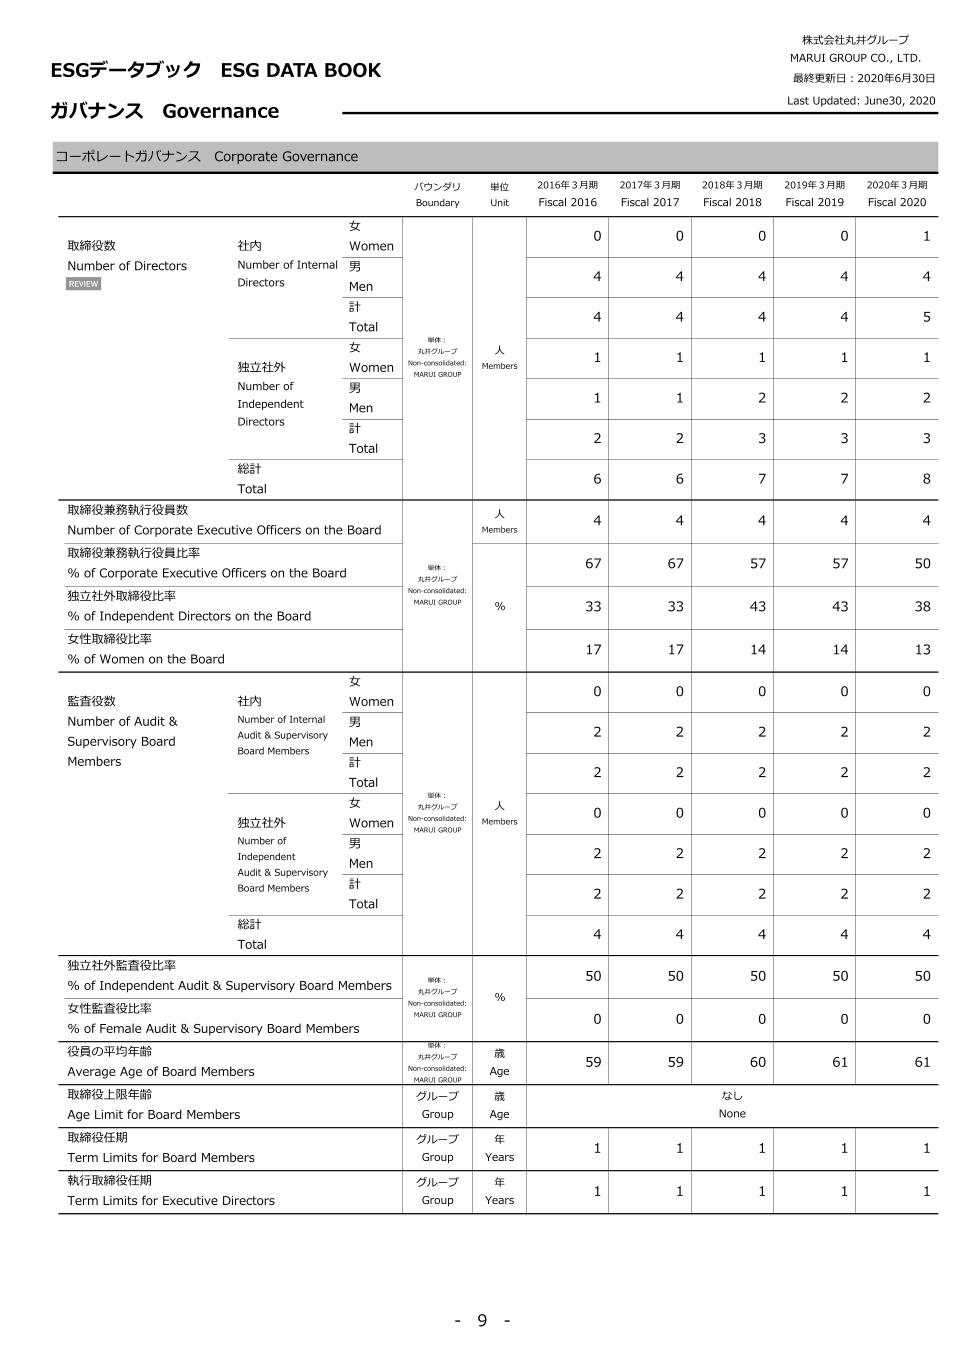
コーポレートガバナンス Corporate Governance
バウンダリ
Boundary
単位
Unit
2016年3月期
Fiscal 2016
2017年3月期
Fiscal 2017
2018年3月期
Fiscal 2018
2019年3月期
Fiscal 2019
2020年3月期
Fiscal 2020
女
Women0 0 0 0 1
男
Men4 4 4 4 4
計
Total4 4 4 4 5
女
Women1 1 1 1 1
男
Men1 1 2 2 2
計
Total2 2 3 3 3
総計
Total6 6 7 7 8
人
Members4 4 4 4 4
67 67 57 57 50
33 33 43 43 38
17 17 14 14 13
女
Women0 0 0 0 0
男
Men2 2 2 2 2
計
Total2 2 2 2 2
女
Women0 0 0 0 0
男
Men2 2 2 2 2
計
Total2 2 2 2 2
総計
Total4 4 4 4 4
50 50 50 50 50
0 0 0 0 0
単体:
丸井グループ
Non-consolidated:
MARUI GROUP
歳
Age59 59 60 61 61
グループ
Group
歳
Age
グループ
Group
年
Years1 1 1 1 1
グループ
Group
年
Years1 1 1 1 1
取締役兼務執行役員数
Number of Corporate Executive Officers on the Board
単体:
丸井グループ
Non-consolidated:
MARUI GROUP
取締役兼務執行役員比率
% of Corporate Executive Officers on the Board
%独立社外取締役比率
% of Independent Directors on the Board
女性取締役比率
% of Women on the Board
株式会社丸井グループ
MARUI GROUP CO., LTD.
ESGデータブック ESG DATA BOOK
ガバナンス Governance
取締役数
Number of Directors
社内
Number of Internal
Directors
単体:
丸井グループ
Non-consolidated:
MARUI GROUP
人
Members独立社外
Number of
Independent
Directors
役員の平均年齢
Average Age of Board Members
取締役上限年齢
Age Limit for Board Members
なし
None
取締役任期
Term Limits for Board Members
執行取締役任期
Term Limits for Executive Directors
監査役数
Number of Audit &
Supervisory Board
Members
社内
Number of Internal
Audit & Supervisory
Board Members
単体:
丸井グループ
Non-consolidated:
MARUI GROUP
人
Members独立社外
Number of
Independent
Audit & Supervisory
Board Members
独立社外監査役比率
% of Independent Audit & Supervisory Board Members単体:
丸井グループ
Non-consolidated:
MARUI GROUP
%女性監査役比率
% of Female Audit & Supervisory Board Members
REVIEW
- 9 -
最終更新日:2020年6月30日
ガバナンス Governance Last Updated: June 30, 2020
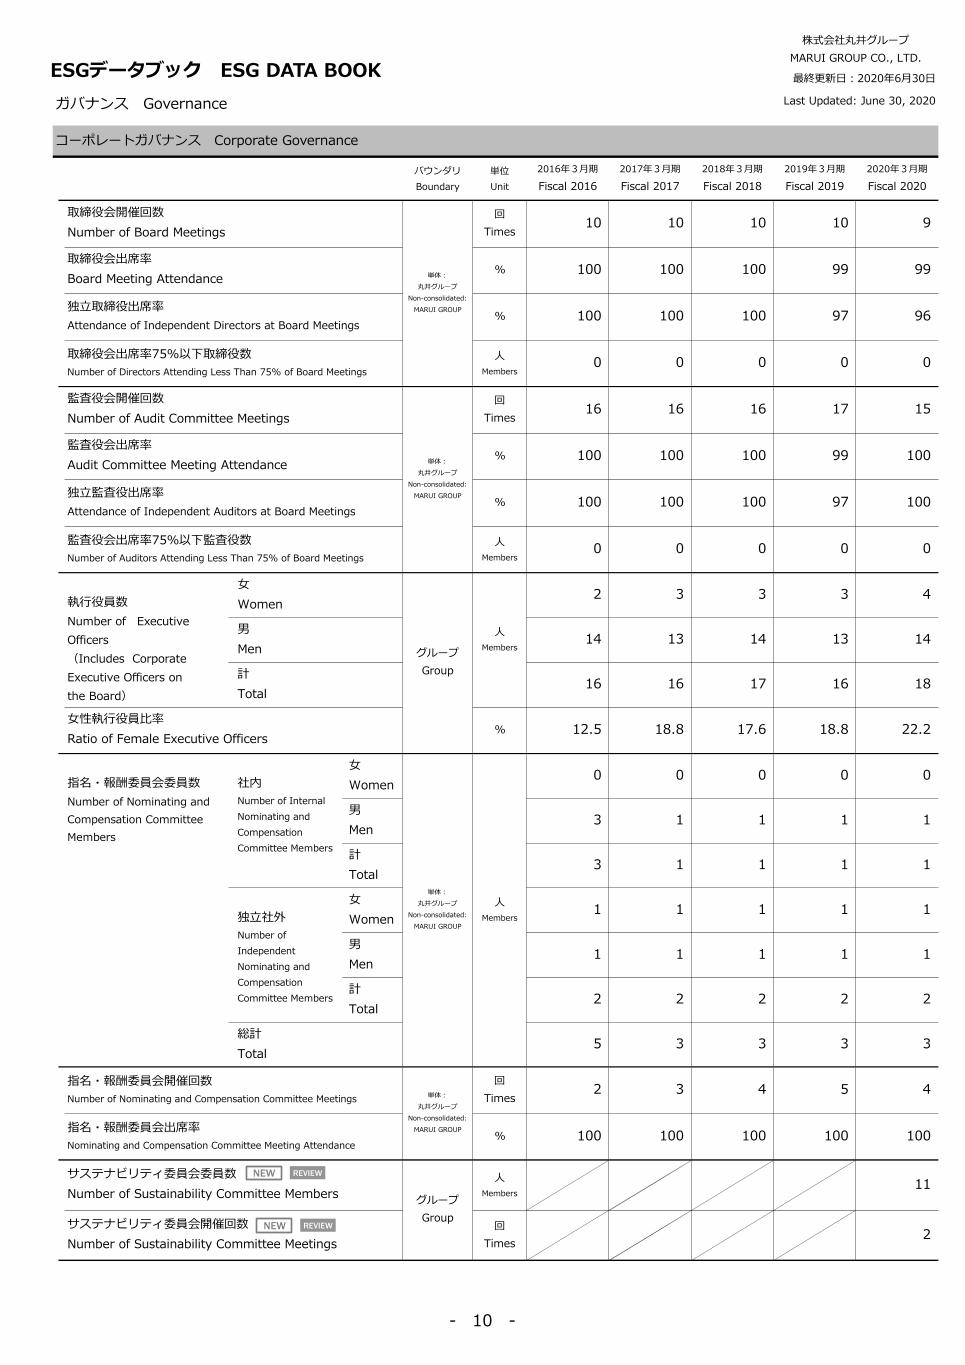
コーポレートガバナンス Corporate Governance
バウンダリ
Boundary
単位
Unit
2016年3月期
Fiscal 2016
2017年3月期
Fiscal 2017
2018年3月期
Fiscal 2018
2019年3月期
Fiscal 2019
2020年3月期
Fiscal 2020
回
Times10 10 10 10 9
% 100 100 100 99 99
% 100 100 100 97 96
人
Members0 0 0 0 0
回
Times16 16 16 17 15
% 100 100 100 99 100
% 100 100 100 97 100
人
Members0 0 0 0 0
女
Women2 3 3 3 4
男
Men14 13 14 13 14
計
Total16 16 17 16 18
% 12.5 18.8 17.6 18.8 22.2
女
Women0 0 0 0 0
男
Men3 1 1 1 1
計
Total3 1 1 1 1
女
Women1 1 1 1 1
男
Men1 1 1 1 1
計
Total2 2 2 2 2
総計
Total5 3 3 3 3
回
Times2 3 4 5 4
% 100 100 100 100 100
人
Members11
回
Times2
株式会社丸井グループ
MARUI GROUP CO., LTD.
ESGデータブック ESG DATA BOOK
取締役会開催回数
Number of Board Meetings
単体:
丸井グループ
Non-consolidated:
MARUI GROUP
取締役会出席率
Board Meeting Attendance
独立取締役出席率
Attendance of Independent Directors at Board Meetings
取締役会出席率75%以下取締役数
Number of Directors Attending Less Than 75% of Board Meetings
監査役会開催回数
Number of Audit Committee Meetings
単体:
丸井グループ
Non-consolidated:
MARUI GROUP
監査役会出席率
Audit Committee Meeting Attendance
独立監査役出席率
Attendance of Independent Auditors at Board Meetings
監査役会出席率75%以下監査役数
Number of Auditors Attending Less Than 75% of Board Meetings
執行役員数
Number of Executive
Officers
(Includes Corporate
Executive Officers on
the Board)
グループ
Group
人
Members
女性執行役員比率
Ratio of Female Executive Officers
指名・報酬委員会委員数
Number of Nominating and
Compensation Committee
Members
社内
Number of Internal
Nominating and
Compensation
Committee Members
単体:
丸井グループ
Non-consolidated:
MARUI GROUP
人
Members独立社外
Number of
Independent
Nominating and
Compensation
Committee Members
指名・報酬委員会開催回数
Number of Nominating and Compensation Committee Meetings単体:
丸井グループ
Non-consolidated:
MARUI GROUP指名・報酬委員会出席率
Nominating and Compensation Committee Meeting Attendance
サステナビリティ委員会委員数
Number of Sustainability Committee Membersグループ
Groupサステナビリティ委員会開催回数
Number of Sustainability Committee Meetings
REVIEWNEW
REVIEWNEW
- 10 -
最終更新日:2020年6月30日
ガバナンス Governance Last Updated: June 30, 2020
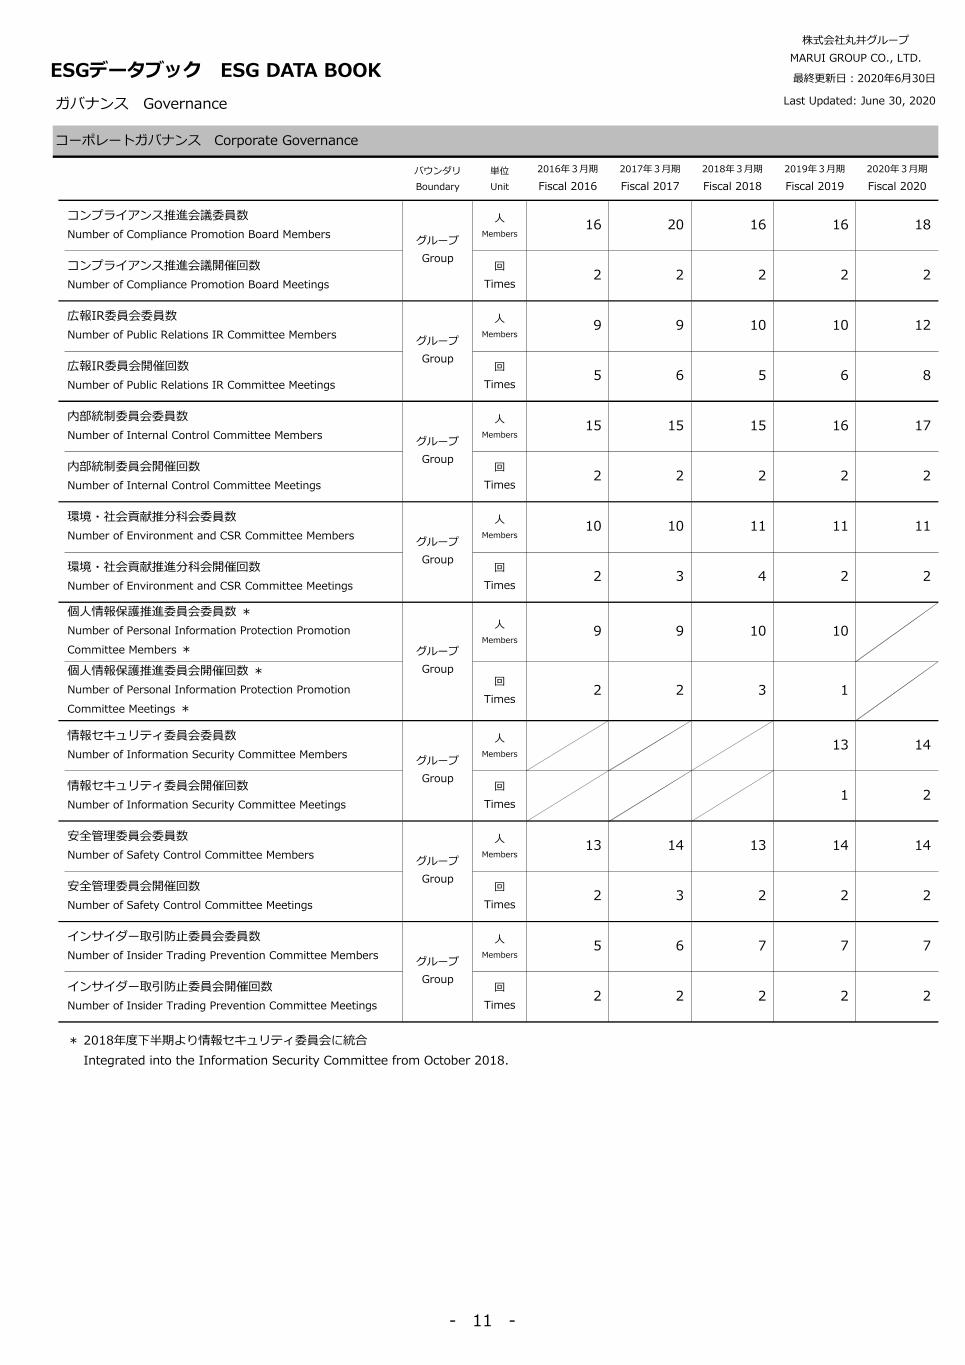
コーポレートガバナンス Corporate Governance
バウンダリ
Boundary
単位
Unit
2016年3月期
Fiscal 2016
2017年3月期
Fiscal 2017
2018年3月期
Fiscal 2018
2019年3月期
Fiscal 2019
2020年3月期
Fiscal 2020
人
Members16 20 16 16 18
回
Times2 2 2 2 2
人
Members9 9 10 10 12
回
Times5 6 5 6 8
人
Members15 15 15 16 17
回
Times2 2 2 2 2
人
Members10 10 11 11 11
回
Times2 3 4 2 2
人
Members9 9 10 10
回
Times2 2 3 1
人
Members13 14
回
Times1 2
人
Members13 14 13 14 14
回
Times2 3 2 2 2
人
Members5 6 7 7 7
回
Times2 2 2 2 2
株式会社丸井グループ
MARUI GROUP CO., LTD.
ESGデータブック ESG DATA BOOK
コンプライアンス推進会議委員数
Number of Compliance Promotion Board Membersグループ
Groupコンプライアンス推進会議開催回数
Number of Compliance Promotion Board Meetings
環境・社会貢献推分科会委員数
Number of Environment and CSR Committee Membersグループ
Group環境・社会貢献推進分科会開催回数
Number of Environment and CSR Committee Meetings
個人情報保護推進委員会委員数 *
Number of Personal Information Protection Promotion
Committee Members * グループ
Group個人情報保護推進委員会開催回数 *
Number of Personal Information Protection Promotion
Committee Meetings *
広報IR委員会委員数
Number of Public Relations IR Committee Membersグループ
Group広報IR委員会開催回数
Number of Public Relations IR Committee Meetings
内部統制委員会委員数
Number of Internal Control Committee Membersグループ
Group内部統制委員会開催回数
Number of Internal Control Committee Meetings
インサイダー取引防止委員会委員数
Number of Insider Trading Prevention Committee Membersグループ
Groupインサイダー取引防止委員会開催回数
Number of Insider Trading Prevention Committee Meetings
* 2018年度下半期より情報セキュリティ委員会に統合
Integrated into the Information Security Committee from October 2018.
情報セキュリティ委員会委員数
Number of Information Security Committee Membersグループ
Group情報セキュリティ委員会開催回数
Number of Information Security Committee Meetings
安全管理委員会委員数
Number of Safety Control Committee Membersグループ
Group安全管理委員会開催回数
Number of Safety Control Committee Meetings
- 11 -
最終更新日:2020年6月30日
ガバナンス Governance Last Updated: June 30, 2020
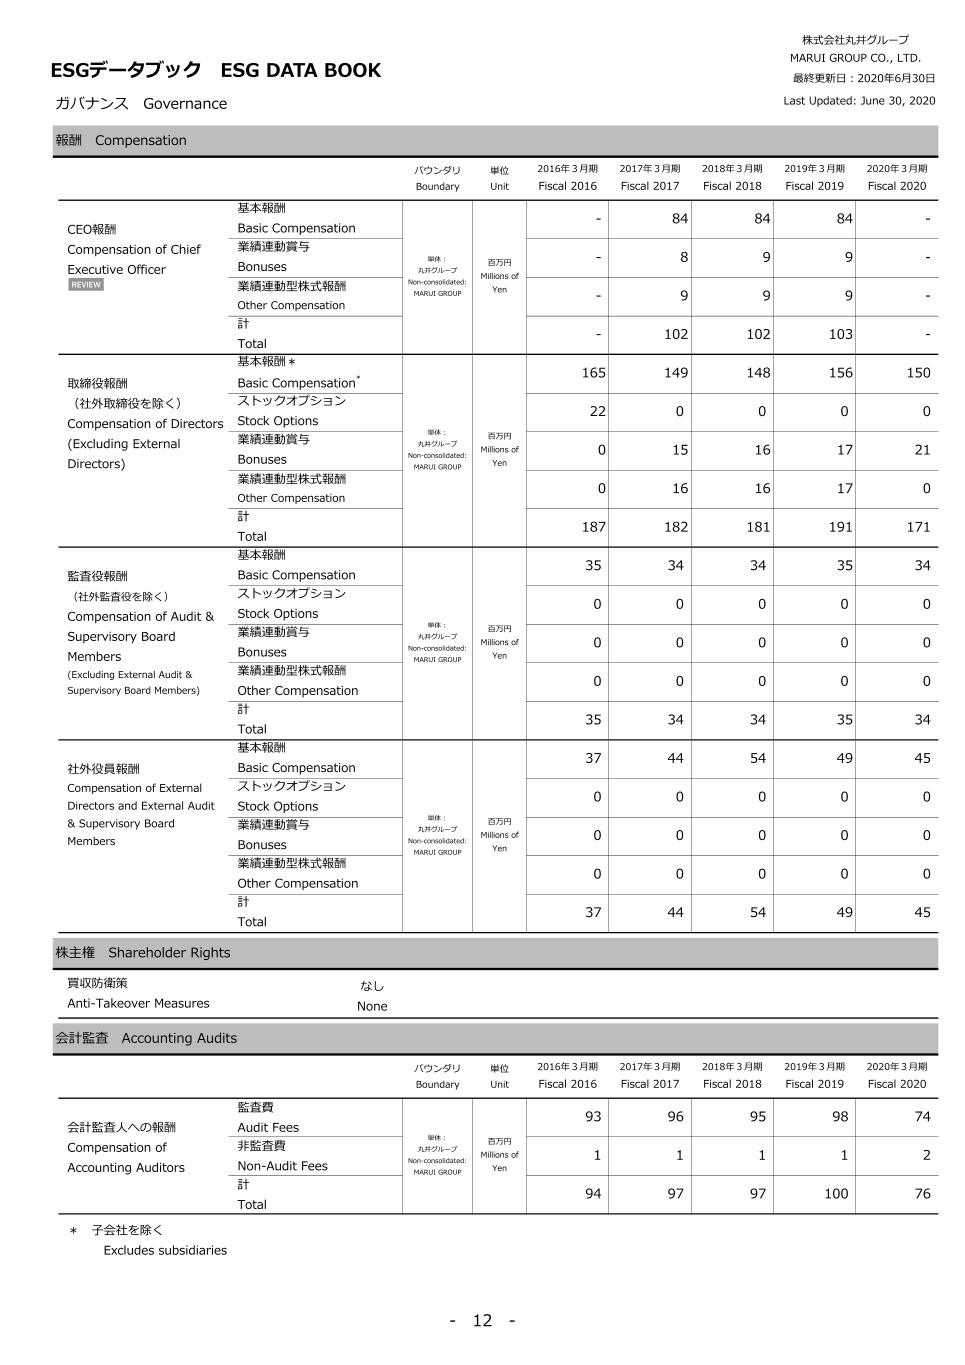
報酬 Compensation
バウンダリ
Boundary
単位
Unit
2016年3月期
Fiscal 2016
2017年3月期
Fiscal 2017
2018年3月期
Fiscal 2018
2019年3月期
Fiscal 2019
2020年3月期
Fiscal 2020
- 84 84 84 -
- 8 9 9 -
- 9 9 9 -
- 102 102 103 -
165 149 148 156 150
22 0 0 0 0
0 15 16 17 21
0 16 16 17 0
187 182 181 191 171
35 34 34 35 34
0 0 0 0 0
0 0 0 0 0
0 0 0 0 0
35 34 34 35 34
37 44 54 49 45
0 0 0 0 0
0 0 0 0 0
0 0 0 0 0
37 44 54 49 45
株主権 Shareholder Rights
なし
None
会計監査 Accounting Audits
バウンダリ
Boundary
単位
Unit
2016年3月期
Fiscal 2016
2017年3月期
Fiscal 2017
2018年3月期
Fiscal 2018
2019年3月期
Fiscal 2019
2020年3月期
Fiscal 2020
監査費
Audit Fees93 96 95 98 74
1 1 1 1 2
94 97 97 100 76
株式会社丸井グループ
MARUI GROUP CO., LTD.
ESGデータブック ESG DATA BOOK
取締役報酬
(社外取締役を除く)
Compensation of Directors
(Excluding External
Directors)
基本報酬*
Basic Compensation*
単体:
丸井グループ
Non-consolidated:
MARUI GROUP
百万円
Millions of
Yen
ストックオプション
Stock Options
業績連動賞与
Bonuses
業績連動型株式報酬
Other Compensation
計
Total
CEO報酬
Compensation of Chief
Executive Officer
基本報酬
Basic Compensation
単体:
丸井グループ
Non-consolidated:
MARUI GROUP
百万円
Millions of
Yen
業績連動賞与
Bonuses
業績連動型株式報酬
Other Compensation
計
Total
社外役員報酬
Compensation of External
Directors and External Audit
& Supervisory Board
Members
基本報酬
Basic Compensation
単体:
丸井グループ
Non-consolidated:
MARUI GROUP
百万円
Millions of
Yen
ストックオプション
Stock Options
業績連動賞与
Bonuses
業績連動型株式報酬
Other Compensation
計
Total
監査役報酬
(社外監査役を除く)
Compensation of Audit &
Supervisory Board
Members
(Excluding External Audit &
Supervisory Board Members)
基本報酬
Basic Compensation
単体:
丸井グループ
Non-consolidated:
MARUI GROUP
百万円
Millions of
Yen
ストックオプション
Stock Options
業績連動賞与
Bonuses
業績連動型株式報酬
Other Compensation
計
Total
* 子会社を除く
Excludes subsidiaries
買収防衛策
Anti-Takeover Measures
会計監査人への報酬
Compensation of
Accounting Auditors
単体:
丸井グループ
Non-consolidated:
MARUI GROUP
百万円
Millions of
Yen
非監査費
Non-Audit Fees
計
Total
REVIEW
- 12 -
最終更新日:2020年6月30日
ガバナンス Governance Last Updated: June 30, 2020
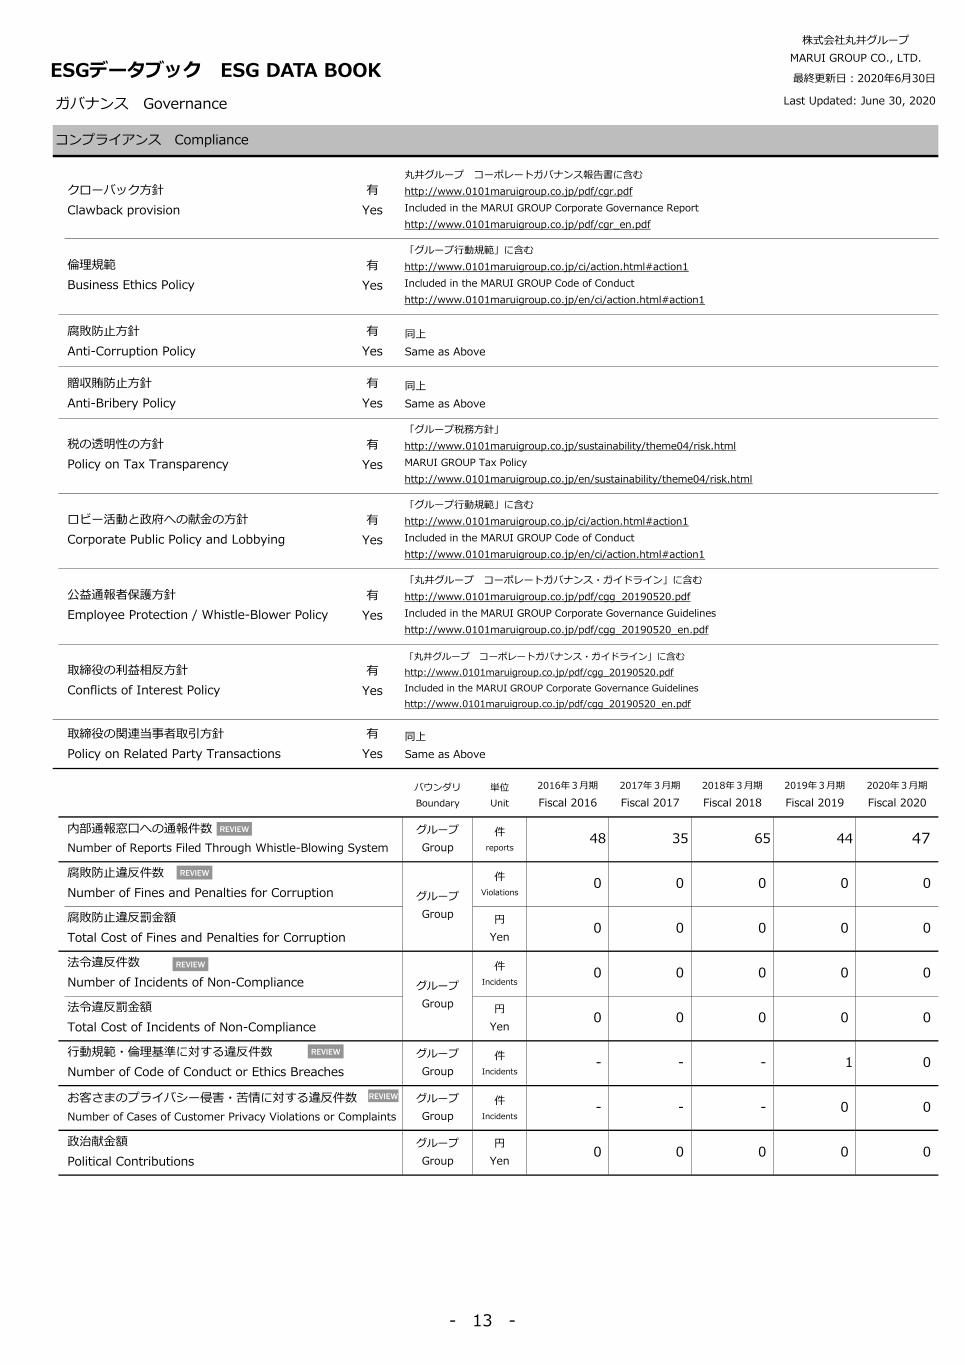
クローバック方針
Clawback provision
有
Yes
有
Yes
有
Yes
有
Yes
有
Yes
有
Yes
有
Yes
有
Yes
有
Yes
バウンダリ
Boundary
単位
Unit
2016年3月期
Fiscal 2016
2017年3月期
Fiscal 2017
2018年3月期
Fiscal 2018
2019年3月期
Fiscal 2019
2020年3月期
Fiscal 2020
グループ
Group
件
reports48 35 65 44 47
件
Violations0 0 0 0 0
円
Yen0 0 0 0 0
件
Incidents0 0 0 0 0
円
Yen0 0 0 0 0
グループ
Group
件
Incidents- - - 1 0
グループ
Group
件
Incidents- - - 0 0
グループ
Group
円
Yen0 0 0 0 0
株式会社丸井グループ
MARUI GROUP CO., LTD.
ESGデータブック ESG DATA BOOK
コンプライアンス Compliance
丸井グループ コーポレートガバナンス報告書に含む
http://www.0101maruigroup.co.jp/pdf/cgr.pdf
Included in the MARUI GROUP Corporate Governance Report
http://www.0101maruigroup.co.jp/pdf/cgr_en.pdf
税の透明性の方針
Policy on Tax Transparency
「グループ税務方針」
http://www.0101maruigroup.co.jp/sustainability/theme04/risk.html
MARUI GROUP Tax Policy
http://www.0101maruigroup.co.jp/en/sustainability/theme04/risk.html
ロビー活動と政府への献金の方針
Corporate Public Policy and Lobbying
「グループ行動規範」に含む
http://www.0101maruigroup.co.jp/ci/action.html#action1
Included in the MARUI GROUP Code of Conduct
http://www.0101maruigroup.co.jp/en/ci/action.html#action1
公益通報者保護方針
Employee Protection / Whistle-Blower Policy
「丸井グループ コーポレートガバナンス・ガイドライン」に含む
http://www.0101maruigroup.co.jp/pdf/cgg_20190520.pdf
Included in the MARUI GROUP Corporate Governance Guidelines
http://www.0101maruigroup.co.jp/pdf/cgg_20190520_en.pdf
倫理規範
Business Ethics Policy
「グループ行動規範」に含む
http://www.0101maruigroup.co.jp/ci/action.html#action1
Included in the MARUI GROUP Code of Conduct
http://www.0101maruigroup.co.jp/en/ci/action.html#action1
腐敗防止方針
Anti-Corruption Policy
同上
Same as Above
贈収賄防止方針
Anti-Bribery Policy
同上
Same as Above
法令違反件数
Number of Incidents of Non-Compliance グループ
Group法令違反罰金額
Total Cost of Incidents of Non-Compliance
行動規範・倫理基準に対する違反件数
Number of Code of Conduct or Ethics Breaches
お客さまのプライバシー侵害・苦情に対する違反件数
Number of Cases of Customer Privacy Violations or Complaints
政治献金額
Political Contributions
取締役の利益相反方針
Conflicts of Interest Policy
「丸井グループ コーポレートガバナンス・ガイドライン」に含む
http://www.0101maruigroup.co.jp/pdf/cgg_20190520.pdf
Included in the MARUI GROUP Corporate Governance Guidelines
http://www.0101maruigroup.co.jp/pdf/cgg_20190520_en.pdf
取締役の関連当事者取引方針
Policy on Related Party Transactions
同上
Same as Above
内部通報窓口への通報件数
Number of Reports Filed Through Whistle-Blowing System
腐敗防止違反件数
Number of Fines and Penalties for Corruption グループ
Group腐敗防止違反罰金額
Total Cost of Fines and Penalties for Corruption
REVIEW
REVIEW
REVIEW
REVIEW
REVIEW
- 13 -

© Sustainalytics 2020
Marui Group Co., Ltd.
Type of Engagement: Annual Review Date: June 18, 2020 Engagement Team: Wakako Mizuta, [email protected], (+81) 3 4571 2343 Marie Toyama, [email protected], (+81) 3 4571 2343
Introduction
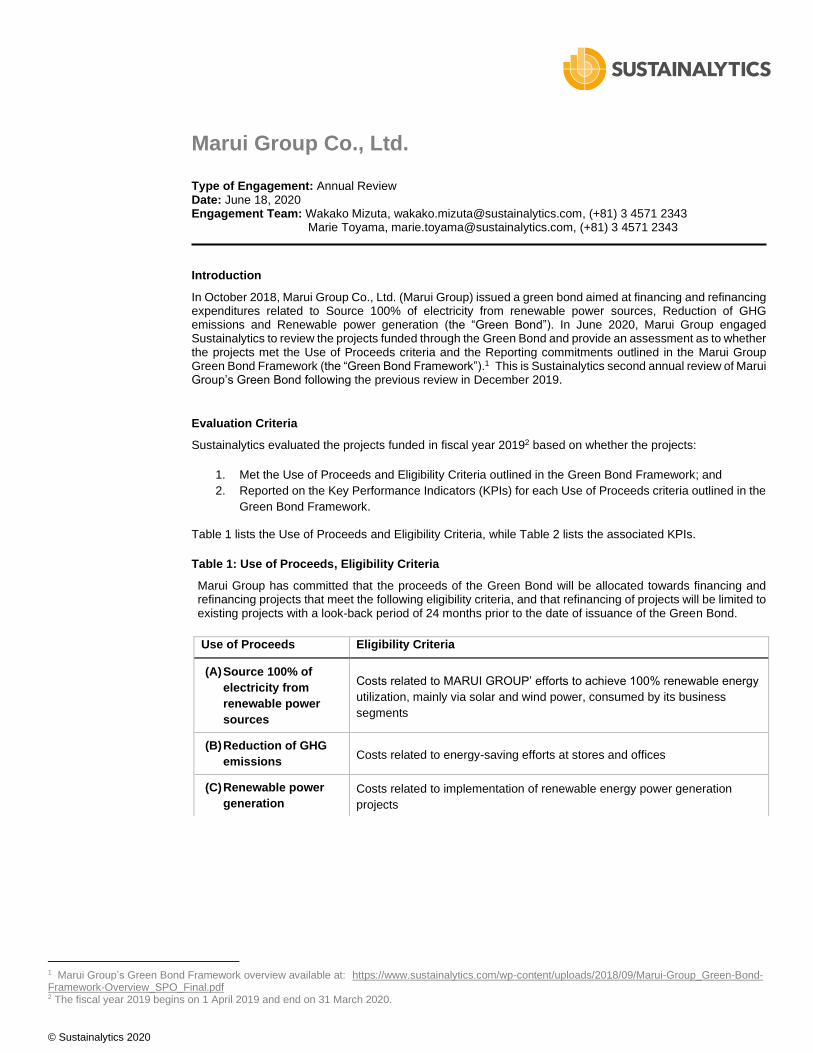
In October 2018, Marui Group Co., Ltd. (Marui Group) issued a green bond aimed at financing and refinancing expenditures related to Source 100% of electricity from renewable power sources, Reduction of GHG emissions and Renewable power generation (the “Green Bond”). In June 2020, Marui Group engaged Sustainalytics to review the projects funded through the Green Bond and provide an assessment as to whether the projects met the Use of Proceeds criteria and the Reporting commitments outlined in the Marui Group Green Bond Framework (the “Green Bond Framework”).1 This is Sustainalytics second annual review of Marui Group’s Green Bond following the previous review in December 2019.
Evaluation Criteria
Sustainalytics evaluated the projects funded in fiscal year 20192 based on whether the projects:
1. Met the Use of Proceeds and Eligibility Criteria outlined in the Green Bond Framework; and
2. Reported on the Key Performance Indicators (KPIs) for each Use of Proceeds criteria outlined in the
Green Bond Framework. Table 1 lists the Use of Proceeds and Eligibility Criteria, while Table 2 lists the associated KPIs.
Table 1: Use of Proceeds, Eligibility Criteria
Marui Group has committed that the proceeds of the Green Bond will be allocated towards financing and refinancing projects that meet the following eligibility criteria, and that refinancing of projects will be limited to existing projects with a look-back period of 24 months prior to the date of issuance of the Green Bond.
1 Marui Group’s Green Bond Framework overview available at: https://www.sustainalytics.com/wp-content/uploads/2018/09/Marui-Group_Green-Bond-Framework-Overview_SPO_Final.pdf 2 The fiscal year 2019 begins on 1 April 2019 and end on 31 March 2020.
Use of Proceeds Eligibility Criteria
(A) Source 100% of
electricity from
renewable power
sources
Costs related to MARUI GROUP’ efforts to achieve 100% renewable energy
utilization, mainly via solar and wind power, consumed by its business
segments
(B) Reduction of GHG
emissions Costs related to energy-saving efforts at stores and offices
(C) Renewable power
generation
Costs related to implementation of renewable energy power generation
projects
Annual Review Marui Group Co., Ltd.
2
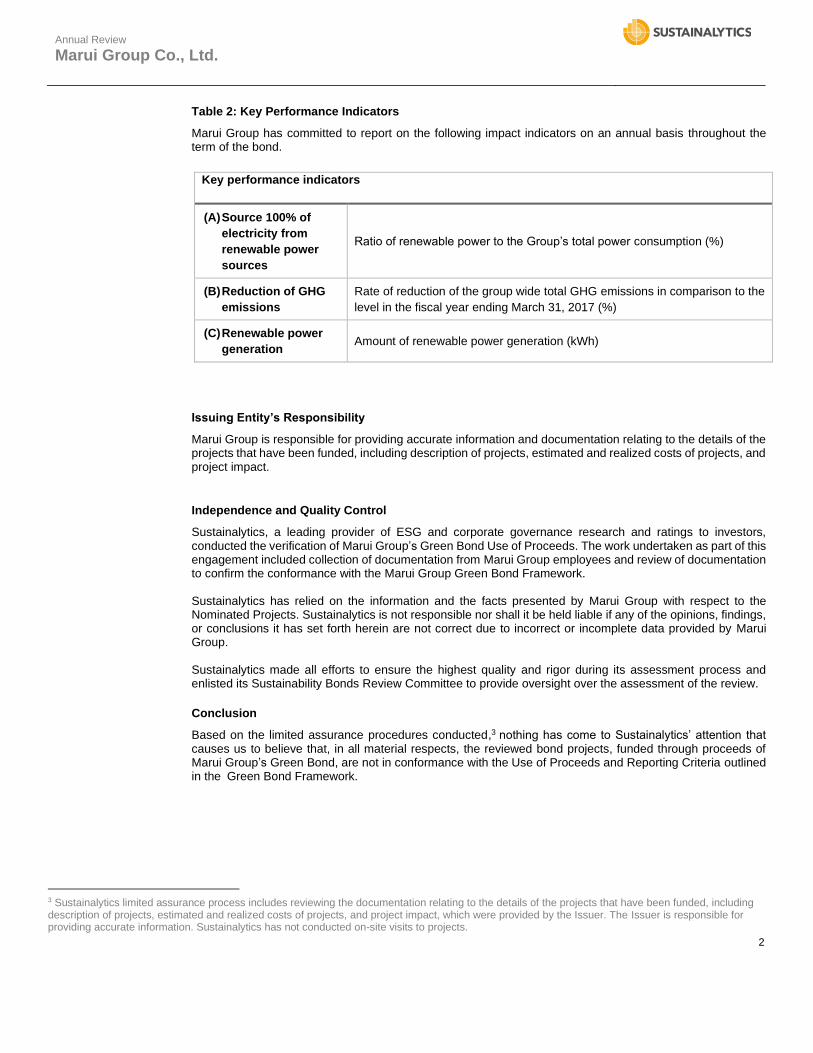
Table 2: Key Performance Indicators
Marui Group has committed to report on the following impact indicators on an annual basis throughout the term of the bond.
Key performance indicators
(A) Source 100% of
electricity from
renewable power
sources
Ratio of renewable power to the Group’s total power consumption (%)
(B) Reduction of GHG
emissions
Rate of reduction of the group wide total GHG emissions in comparison to the
level in the fiscal year ending March 31, 2017 (%)
(C) Renewable power
generation Amount of renewable power generation (kWh)
Issuing Entity’s Responsibility
Marui Group is responsible for providing accurate information and documentation relating to the details of the projects that have been funded, including description of projects, estimated and realized costs of projects, and project impact.
Independence and Quality Control
Sustainalytics, a leading provider of ESG and corporate governance research and ratings to investors, conducted the verification of Marui Group’s Green Bond Use of Proceeds. The work undertaken as part of this engagement included collection of documentation from Marui Group employees and review of documentation to confirm the conformance with the Marui Group Green Bond Framework. Sustainalytics has relied on the information and the facts presented by Marui Group with respect to the Nominated Projects. Sustainalytics is not responsible nor shall it be held liable if any of the opinions, findings, or conclusions it has set forth herein are not correct due to incorrect or incomplete data provided by Marui Group. Sustainalytics made all efforts to ensure the highest quality and rigor during its assessment process and enlisted its Sustainability Bonds Review Committee to provide oversight over the assessment of the review.
Conclusion
Based on the limited assurance procedures conducted,3 nothing has come to Sustainalytics’ attention that causes us to believe that, in all material respects, the reviewed bond projects, funded through proceeds of Marui Group’s Green Bond, are not in conformance with the Use of Proceeds and Reporting Criteria outlined in the Green Bond Framework.
3 Sustainalytics limited assurance process includes reviewing the documentation relating to the details of the projects that have been funded, including description of projects, estimated and realized costs of projects, and project impact, which were provided by the Issuer. The Issuer is responsible for providing accurate information. Sustainalytics has not conducted on-site visits to projects.

Annual Review Marui Group Co., Ltd.
3
Detailed Findings
Table 3: Detailed Findings
Eligibility Criteria
Procedure Performed Factual Findings Error or Exceptions Identified
Use of Proceeds Criteria
Verification of the projects funded by the Green Bond in fiscal year 2019 to determine if projects aligned with the Use of Proceeds Criteria outlined in the Green Bond Framework and above in Table 1.
All projects reviewed complied with the Use of Proceeds criteria.
None
Reporting Criteria
Verification of the projects funded by the Green Bond in fiscal year 2019 to determine if impact of projects was reported in line with the KPIs outlined in the Green Bond Framework and above in Table 2. For a list of KPIs reported please refer to Appendix 2.
All projects reviewed reported on KPI per Use of Proceeds criteria.
None
Annual Review Marui Group Co., Ltd.
4
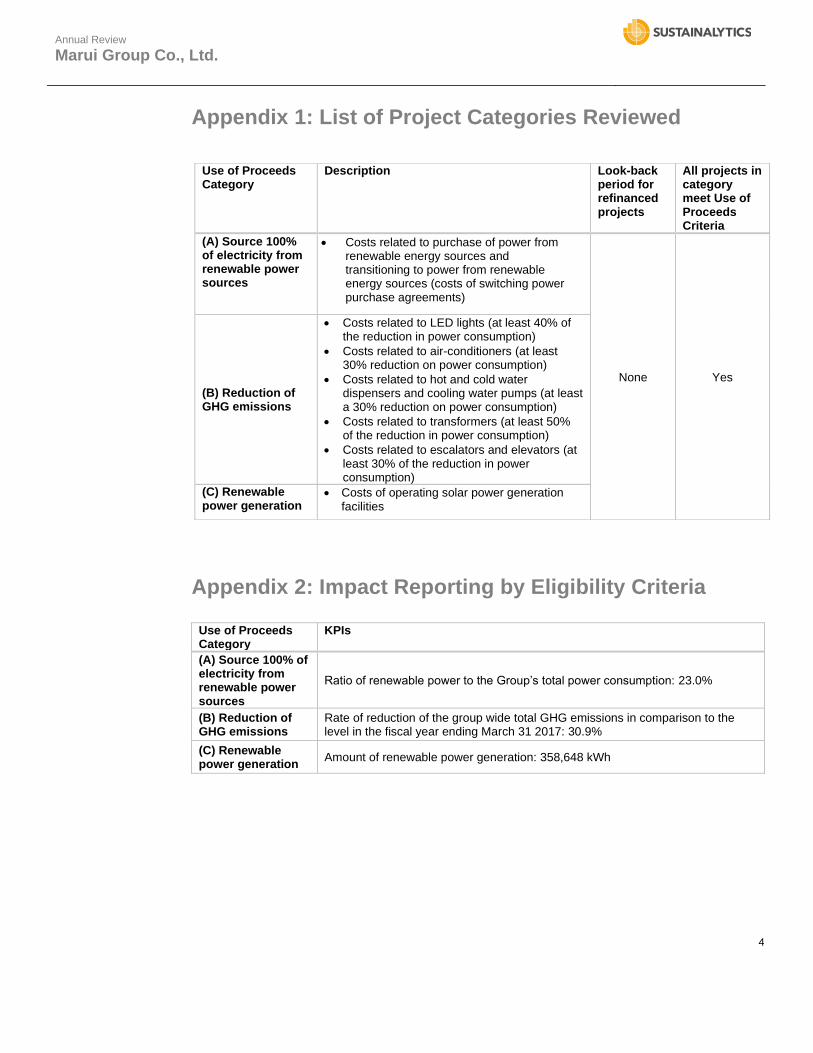
Appendix 1: List of Project Categories Reviewed
Appendix 2: Impact Reporting by Eligibility Criteria
Use of Proceeds Category
KPIs
(A) Source 100% of electricity from renewable power sources
Ratio of renewable power to the Group’s total power consumption: 23.0%
(B) Reduction of GHG emissions
Rate of reduction of the group wide total GHG emissions in comparison to the level in the fiscal year ending March 31 2017: 30.9%
(C) Renewable power generation
Amount of renewable power generation: 358,648 kWh
Use of Proceeds Category
Description Look-back period for refinanced projects
All projects in category meet Use of Proceeds Criteria
(A) Source 100% of electricity from renewable power sources
• Costs related to purchase of power from renewable energy sources and transitioning to power from renewable energy sources (costs of switching power purchase agreements)
None Yes
(B) Reduction of GHG emissions
• Costs related to LED lights (at least 40% of the reduction in power consumption)
• Costs related to air-conditioners (at least 30% reduction on power consumption)
• Costs related to hot and cold water dispensers and cooling water pumps (at least a 30% reduction on power consumption)
• Costs related to transformers (at least 50% of the reduction in power consumption)
• Costs related to escalators and elevators (at least 30% of the reduction in power consumption)
(C) Renewable power generation
• Costs of operating solar power generation facilities

Annual Review Marui Group Co., Ltd.
5
Disclaimer
Copyright ©2020 Sustainalytics. All rights reserved.
The information, methodologies and opinions contained or reflected herein are proprietary of Sustainalytics and/or its third party suppliers (Third Party Data), and may be made available to third parties only in the form and format disclosed by Sustainalytics, or provided that appropriate citation and acknowledgement is ensured. They are provided for informational purposes only and (1) do not constitute an endorsement of any product or project; (2) do not constitute investment advice, financial advice or a prospectus; (3) cannot be interpreted as an offer or indication to buy or sell securities, to select a project or make any kind of business transactions; (4) do not represent an assessment of the issuer’s economic performance, financial obligations nor of its creditworthiness; and/or (5) have not and cannot be incorporated into any offering disclosure.
These are based on information made available by the issuer and therefore are not warranted as to their merchantability, completeness, accuracy, up-to-dateness or fitness for a particular purpose. The information and data are provided “as is” and reflect Sustainalytics’ opinion at the date of their elaboration and publication. Sustainalytics accepts no liability for damage arising from the use of the information, data or opinions contained herein, in any manner whatsoever, except where explicitly required by law. Any reference to third party names or Third Party Data is for appropriate acknowledgement of their ownership and does not constitute a sponsorship or endorsement by such owner. A list of our third-party data providers and their respective terms of use is available on our website. For more information, visit http://www.sustainalytics.com/legal-disclaimers.
The issuer is fully responsible for certifying and ensuring the compliance with its commitments, for their implementation and monitoring.
In case of discrepancies between the English language and translated versions, the English language version shall prevail.

Annual Review Marui Group Co., Ltd.
6
Sustainalytics
Sustainalytics is a leading independent ESG and corporate governance research, ratings and analytics firm that supports investors around the world with the development and implementation of responsible investment strategies. For over 25 years, the firm has been at the forefront of developing high-quality, innovative solutions to meet the evolving needs of global investors. Today, Sustainalytics works with hundreds of the world’s leading asset managers and pension funds who incorporate ESG and corporate governance information and assessments into their investment processes. Sustainalytics also works with hundreds of companies and their financial intermediaries to help them consider sustainability in the policies, practices and capital projects. With 16 offices globally, Sustainalytics has more than 600 staff members, including over 200 analysts with varied multidisciplinary expertise across more than 40 industry groups. For more information, visit www.sustainalytics.com.