establishing and maintaining control charts for concrete base … · 2005-01-31 · the purpose of...
TRANSCRIPT

TEST METHOD T 193
ESTABLISHING AND MAINTAINING CONTROL CHARTS FOR CONCRETE BASE COURSE
THICKNESS
REVISION SUMMARY
Date
Clause
Number
Description of Revision
Authorised By Gen Mgr Pavements
July 2003 Draft Issue-Jim Ollis D. Dash


Test Method T193 July 2003 Page 1 of 11
TEST METHOD T 193
ESTABLISHING AND MAINTAINING CONTROL CHARTS FOR CONCRETE BASE COURSE
THICKNESS 1.0 SCOPE
This Test Method describes the procedures for: • establishing an acceptance control chart for the percentage of a concrete
base course less than the design thickness;
• determining the process control limits for the process control chart;
• re-calibrating the process control chart,
• the actions arising from control chart analysis,
when sampling pavement courses thicknesses in accordance with Test Method T 195 and with RTA model specification for construction of concrete pavements. This Test Method applies to thickness measurements determined by conformance verification surveys of the subbase and base surfaces.
2.0 PURPOSE
The purpose of the control charts is to measure and control the variance of the constructed concrete base course thickness to ensure that no more than a specified percentage is less than the design thickness. The process control charts also enable estimation of the capability of the construction process to achieve this outcome.
3.0 OVERVIEW
The acceptance limits on the acceptance control chart are based on the percentage of the base course less than the design thickness. The statistical theory that defines the Q statistic in RTA Specification Q of the model RTA specifications, also defines the acceptance limits for base course thickness. However, this Test Method uses K (capital) for determining acceptance, while Part Q uses k (lower case). The K value of this Test Method differs from the k value of Part Q due to a different producer’s risk and the acceptable percentage defective. Data correlation of the thickness measurements also affects the acceptance limits defined by this Test Method.

Test Method T193 July 2003 Page 2 of 11
Diagram 1 Flow Chart showing the timing and role of acceptance control charts and
process control charts to controlling pavement surface heights.
Prepare and review Quality Plan to comply
with specifications
Set up Acceptance
Control charts and test each
lot for compliance
After placing 1 kilometre measure process
capability by Process Control Charts
Capable?No
Continue to test each lot for
compliance
Continue to monitor process
capability every subsequent 2
kilometres
Yes
Acceptance based on
specifications
Acceptance based on
specifications

Test Method T193 July 2003 Page 3 of 11
4.0 DEFINITIONS
The definitions contained in RTA specification clauses for construction of concrete pavements also apply to this Test Method. Test Method T 195, Clause 5.1, contains the definitions for full and residue lots.
5.0 APPARATUS
To assist electronic data transfer, control charts should be plotted electronically by computer software such as spreadsheet or dedicated statistical packages.
6.0 PROCEDURE
The acceptance limits and process control limits, defined by this Test Method, require compliance with the sampling plan given in Test Method T 195. This Test Method samples the pavement on a lot by lot basis, with each lot defined as 100 lineal metres of pavement of a day’s homogeneous work. However, due to various factors it is not possible to assume that an even multiple of 100 metres of pavement will be placed each day. Test Method TM 195 describes the method of sampling the residue portion of the pavement from the end of the last even 100 lineal metres of pavement to the end of the day’s pour. Tables 1, for Acceptance Limits, and Table 2, for Process Control Charts, provide parameters for residue lots. In addition, trial pavements, equipment breakdown and inclement weather, may lead to less than 80 lineal metres of pavement being placed during a day’s work. Where one day’s work consists of less than 80 metres of pavement, then sample the pavement as one lot in accordance with Test Method T195. Lts less than 80 metres in length are assessed for thickness in accordance with Table A.
Table A - Assessment criteria for thickness for lots less than 80 metres in length
Thickness deficiency (mm) Text Mean Individual (mm) Status/ Reference (mm) Result Frequency Action 5 < 2 Conformance Nil and and Conforming with Cl 5.4.3 ≥ 10 Nil 5 > 2 Nonconforming Nonconformance Nil and and 12% deduction ≥ 10 Nil Nonconformance > 15 Nonconforming, Nonconformance < 10 and > 20 > 1 remove and replace Nonconformance 5 and > 20 Nil Nonconforming,
24% deduction 10 and > 20 Nil Nonconforming,
60% deduction 5 > 2 and/or Nonconforming, Nonconformance Nil and 10 to 15 > 1 45% deduction and > 20 Nil

Test Method T193 July 2003 Page 4 of 11
6.1 ESTABLISHING THE ACCEPTANCE CONTROL CHART
6.1.1 Calculating The Acceptance Limits The acceptance limit for the sample mean of each lot of constructed base course is defined as; AL = DT + Kst (1) Where: AL is the acceptance limit for the lot;
DT is the design thickness in accordance with the specifications; st is the standard deviation of the thickness measurements of the lot as given by equation (4) in Clause 6.2 K is given in Table 1 for full lots and residue lots between 80 and 175 metres in length.
A lot conforms for thickness requirements when its sample mean is equal to or greater than its acceptance limit.
Table 1 K values for Full Lots and Residue Lots
Lot Type Length of Lot K Lot Type Length of Lot K
Residue Lot 80 m 1.94 Residue Lot 130 m 1.82 Residue Lot 85 m 1.93 Residue Lot 135 m 1.81 Residue Lot 90 m 1.91 Residue Lot 140 m 1.80 Residue Lot 95 m 1.90 Residue Lot 145 m 1.80 Full Lot 100 m 1.89 Residue Lot 150 m 1.79
Residue Lot 105 m 1.87 Residue Lot 155 m 1.78 Residue Lot 110 m 1.86 Residue Lot 160 m 1.77 Residue Lot 115 m 1.85 Residue Lot 165 m 1.77 Residue Lot 120 m 1.84 Residue Lot 170 m 1.76 Residue Lot 125 m 1.83 Residue Lot 175 m 1.75
6.1.2 Preparing The Acceptance Control Chart Prior to placing base concrete, establish an acceptance control chart for base course thickness that shows the following:
• a vertical scales to show the mean thickness t , for each lot in millimetres, • a horizontal scale showing the lot numbers in order of construction, • a horizontal line showing the design thickness DT, of the base course in
accordance with the specifications, • a series of short horizontal lines for the acceptance limit of each lot AL,
calculated in accordance with equation (1).
Plot the sample mean thickness t , of each lot on the acceptance control chart in the order of construction and draw a straight line to the previously plotted sample mean. Calculate and plot the acceptance limit (AL) for each lot by equation (1) to show its relationship to the acceptance criterion for thickness.
6.1.3 The Lot Schedule

Test Method T193 July 2003 Page 5 of 11
Prepare a Lot Schedule of that, initially, includes, • a unique identifier of each lot, • date of construction, • full or residue lot, • sample standard deviation of thickness, • sample mean thickness, • sample size, • the acceptance limit for each lot. After calculation of the process control lines by Clause 6.2, add the following, • the process mean, • the upper process control line, • the lower process control line, • the expected average acceptance limit. Adopt the same unique identifier for the thickness lots as adopted for the base surface lots as described in TM194.
6.1.4 Plotting Results
Plot the mean thickness of each lot no later than 48 hours of placement of base concrete. Plot surveys results, first in date order and then in time order of placement of concrete for each day’s pour to track the construction process.
6.2 ESTABLISHING THE PROCESS CONTROL CHART 6.2.1 Plot Process Control Lines on the Acceptance Control Chart
Calculate and plot process control lines on the acceptance control chart after surveying one kilometre of the base course. Addition of the following process control lines converts the acceptance control chart into the process control chart: a) a horizontal line, t , showing the overall mean thickness, also known as the
process mean; b) two horizontal lines for the upper and lower process control limits; c) the expected average acceptance limit showing the expected acceptance
limit, based on recorded process data, if lots continue to have the same average sample standard deviation.
6.2.2 Calculation of the Process Control Lines Include all lots surveyed in the first kilometre for calculations. After calculations, add values of the process control lines to the Lot Schedule described in Clause 6.1.3.
The process mean, t , is the overall mean of the base course thickness measurements in the first kilometre and is calculated by:

Test Method T193 July 2003 Page 6 of 11
∑
∑
=
== m
ii
m
iii
n
tnt
1
1 (2)
where, n
tt
n
ii
i
∑== 1 is the sample mean thickness of the i th lot, which has
thickness measurements and there have been m lots surveyed.
in
The pooled estimate of the process standard deviation, , estimates the average variability within each lot and is given as:
pooledts
( )
∑
∑
=
=
−
−= m
ii
m
iti
pooledt
mn
sns
1
1
21
(3)
where m and ni are given in equation (2) and is the sample standard deviation of the ith lot which is defined as:
ts
( )1
1
2
−
−=
∑=
i
n
iii
t n
tts
i
(4)
where ti is the ith sample of the ith lot, which has a sample mean of it . Equations (2) and (3) give the same estimates of the process mean and standard deviation as AS 3942, when all lots have the same number of sample measurements. However, variable pour widths and residue lots make it unlikely that all lots will have equal sample sizes.
Process variability, , measures the variability of the process about the
process mean
processts
t and is given as;
( )
1
2
1
−
−=
∑=
N
tts
N
jj
processt (5)
where, N is the total number of thickness measurements from all lots in the first
kilometre of paving, tj is the jth thickness measurement and t is given by equation (2). The process variability is the standard deviation of all thickness measurements, from all lots, since the previous calibration. It will usually differ from the pooled estimate of the process standard deviation, given by equation (2), due to effect of data correlation. The upper and lower process control limits for the control chart for sample
mean thicknesses, t , are set equi spaced about t as:
tprocesstst F3± (6)
Test Method T193 July 2003 Page 7 of 11
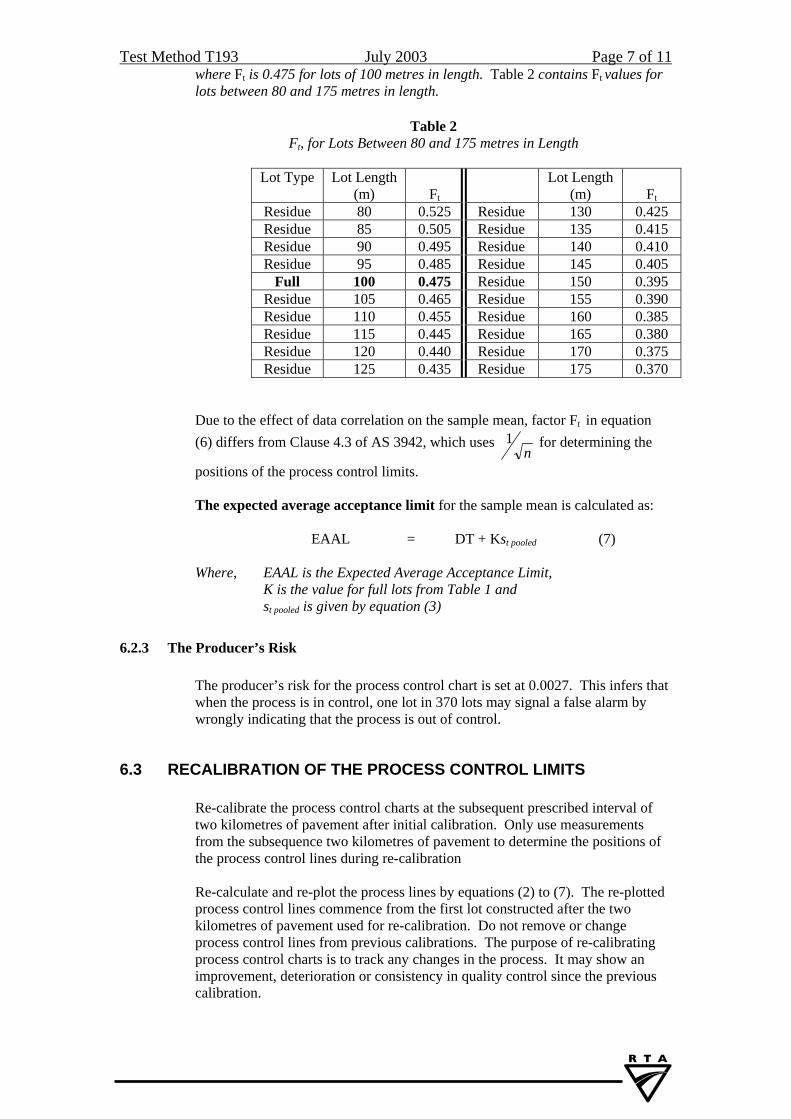
where Ft is 0.475 for lots of 100 metres in length. Table 2 contains Ft values for lots between 80 and 175 metres in length.
Table 2
Ft, for Lots Between 80 and 175 metres in Length
Lot Type Lot Length (m)
Ft
Lot Length (m)
Ft
Residue 80 0.525 Residue 130 0.425 Residue 85 0.505 Residue 135 0.415 Residue 90 0.495 Residue 140 0.410 Residue 95 0.485 Residue 145 0.405
Full 100 0.475 Residue 150 0.395 Residue 105 0.465 Residue 155 0.390 Residue 110 0.455 Residue 160 0.385 Residue 115 0.445 Residue 165 0.380 Residue 120 0.440 Residue 170 0.375 Residue 125 0.435 Residue 175 0.370
Due to the effect of data correlation on the sample mean, factor Ft in equation (6) differs from Clause 4.3 of AS 3942, which uses
n1 for determining the
positions of the process control limits. The expected average acceptance limit for the sample mean is calculated as: EAAL = DT + Kst pooled (7) Where, EAAL is the Expected Average Acceptance Limit,
K is the value for full lots from Table 1 and st pooled is given by equation (3)
6.2.3 The Producer’s Risk The producer’s risk for the process control chart is set at 0.0027. This infers that when the process is in control, one lot in 370 lots may signal a false alarm by wrongly indicating that the process is out of control.
6.3 RECALIBRATION OF THE PROCESS CONTROL LIMITS Re-calibrate the process control charts at the subsequent prescribed interval of two kilometres of pavement after initial calibration. Only use measurements from the subsequence two kilometres of pavement to determine the positions of the process control lines during re-calibration Re-calculate and re-plot the process lines by equations (2) to (7). The re-plotted process control lines commence from the first lot constructed after the two kilometres of pavement used for re-calibration. Do not remove or change process control lines from previous calibrations. The purpose of re-calibrating process control charts is to track any changes in the process. It may show an improvement, deterioration or consistency in quality control since the previous calibration.

Test Method T193 July 2003 Page 8 of 11
Where any recalibration of the process control charts identifies that the process does not conform and corrective action is required to the process, then the next recalibration interval must be 1 kilometre in accordance with Diagram 1.
6.4 HAND PLACED CONCRETE Establish separate acceptance and process control charts for hand placed concrete, using the same formulae as concrete placed by a paving machine, as described in Clauses 6.1 to 6.3.
7.0 REPORTING
7.1 ACCEPTANCE CONTROL CHARTS Acceptance of the base course for thickness is on a lot by lot basis. Accept lots as meeting the requirements for base course thickness if the sample mean thickness t , is equal to or greater than AL by equation (1).
7.2 PROCESS CONTROL CHARTS
7.2.1 Relationship between Acceptance Control Charts and Process Control Charts
The acceptance limits on the acceptance control chart reflect RTA (customer) requirements, as set out in the specifications. The process control limits on process control charts reflect the level of quality possible by the construction process, controlled by the Contractor. The limit lines of the acceptance control chart and the limit lines of the process control chart are therefore independent. However, the Contractor needs to establish process controls that reflect the product quality as defined by the acceptance limits in the specifications to meet RTA requirements. The acceptance limits are set to prevent inadvertent acceptance of lots that have greater than 21/2 % (of the lot) less than the design thickness. The relationship between the expected average acceptance limit and lower process control limit graphically demonstrates the capability of the process to construct the base course to a thickness greater than the design thickness. A lower process control limit that plots above the expected average acceptance limit indicates that the process is capable of constructing the base course with at least 971/2 % of it greater than the design thickness, practically all of the time. A lower process control limit that plots below the expected average acceptance limit indicates a significant probability that the process will produce non-conforming product, which will lead to lot rejection. This is true even though no non-conforming lots may have yet been detected. In these instances a review of process controls is advisable to reduce the risk of lot rejection and to ensure product quality.
7.3 CONTROL CHART ANALYSIS Carry out actions to the base surface levels, as required under Test Method T 194, before carrying out control chart analysis described by this Test Method. Actions required under TM194 may also address actions arising from this Test Method.

Test Method T193 July 2003 Page 9 of 11
Follow the sequence for carrying out control chart analysis for Test Method T 194 and this Test Method as shown in Diagram 2.
7.3.1 Actions Where the Process Does Not Conform. The process for constructing the base course to the specified thickness does not conform when the lower process control limit plots lower than the expected average acceptance limit. Where the process does not conform, after adjusting the base surface controls by TM194, then adjust the base course thickness by adjusting the base surface process controls. Adjustment to the process control lines must be by the same amount that the lower process control limit is lower than the expected average acceptance limit. After adjusting the process control lines of the thickness control charts, then adjust the process control lines of the base surface control charts by the same amount. Clause 7.3 of TM194 provides the description of a method for adjusting the base surface process controls.

Test Method T193 July 2003 Page 10 of 11
Survey Base surface and
calculate Thickness
data
Enter data into control charts
for Base surface and Thickness
Calculate process control
lines for the Base surface
and Thickness
Base surface
conforms?
Adjust process mean and
control limits of the Base
surface by TM194
No
Adjust Thickness process mean and process control limits by the same amount
Control chart analysis of Thickness
control chart
Thickness process
conforms?
Yes
Adjust process mean and
control limits of the Thickness control chart by Section 7.3.1
No
Adjust the process mean
and control limits of the
Base surface by the same
amount
End
Base surface also
conforms?
Test for adjustment for
excessive thickness by Section 7.3.2
Yes
No
Yes
Subbase surface for next 2 kilometres
too high?
Condition in shadded boxes must be satisfied before adjustment for excessive
thickness is possible
No
Yes
Diagram 2 Flow Chart Showing Sequence for Testing Conformity of Process for Constructing Thickness

Test Method T193 July 2003 Page 11 of 11
7.3.2 Adjustment for Excessive Thickness Adjustment for excessive thickness is only possible where: • the process for constructing the base surface to the correct level conforms, • the process for constructing the base course to the correct thickness conforms
and • control chart analysis of the subbase surface, for at least the next two
kilometres over which base concrete will be placed, did not find that the subbase surface was too high.
Where these conditions apply, then calculate the process capability ratio, PCRk by equation (8), to determine whether the thickness is excessive and if adjustment is possible.
t processs
t3
DTPCR k−
= (8)
where: t , the process mean thickness by equation (2) is the process variability by equation (5) processts DT is the specified design thickness. Where the PCRk is greater than 1.33 then the process mean thickness may be reduced by lowering the process mean of the base surface. The base surface process mean may lowered by, etttt arg− mm (9)
where: DT3arg += processtett st (10) The process control lines for the base surface and the thickness control charts must be recalibrated after placing one kilometre of base concrete following adjustment of the base surface process mean. Where this calibration finds the PCRk is equal to or greater than 1.00, then continue recalibration at two kilometre intervals in accordance with Diagram 1. Where this calibration finds the PCRk is less than 1.00, then adjust the base surface process mean by equations (9) (10). Provided the processes for the base surface and thickness still conform then continue to monitor the processes at the prescribed two kilometre intervals in accordance with Diagram 1.
7.4 CONTROL CHARTS AS A MANAGEMENT TOOL Control charts are a management tool that provides feedback to construction personnel on the quality of the processes to which they contribute. This feedback gives recognition to process improvement and looks for input from construction personnel when the process goes out of control or becomes incapable of meeting specified requirements. For this to be effective, project management may consider placing the control charts in a prominent position on site, with all personnel involved in the process having access to view them.
Test Method T193 July 2003 Sheet i of viii
ATTACHMENT
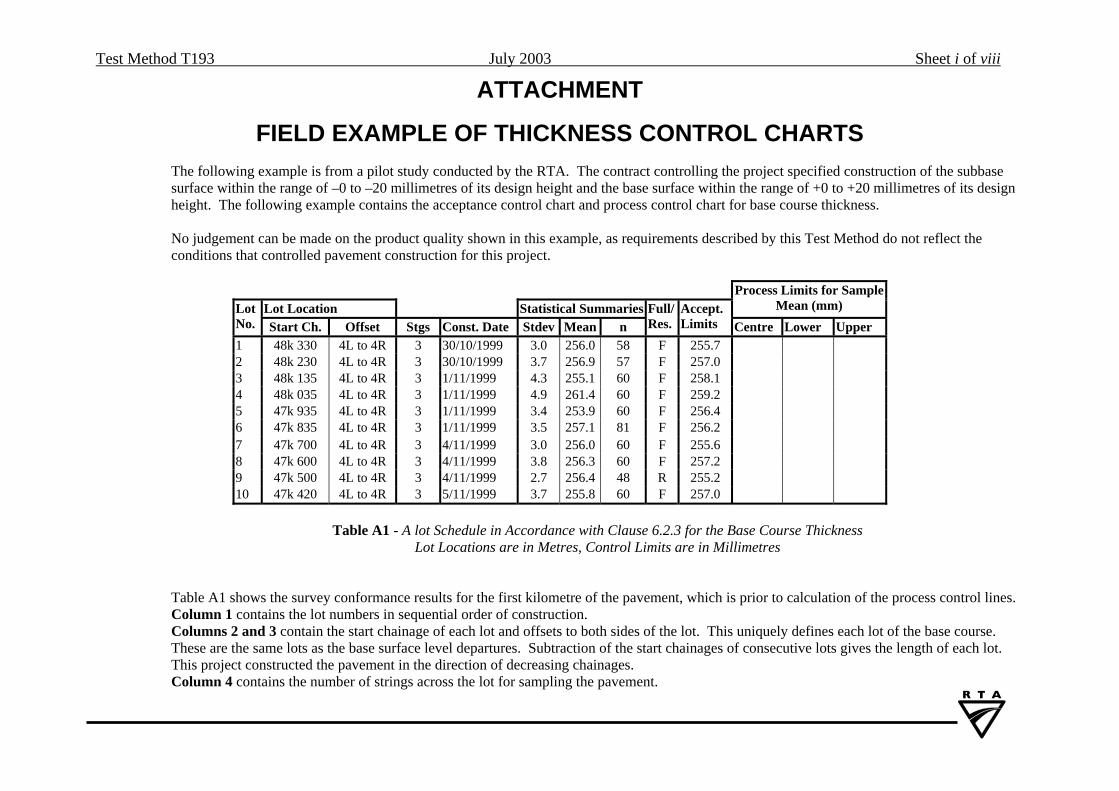
FIELD EXAMPLE OF THICKNESS CONTROL CHARTS The following example is from a pilot study conducted by the RTA. The contract controlling the project specified construction of the subbase surface within the range of –0 to –20 millimetres of its design height and the base surface within the range of +0 to +20 millimetres of its design height. The following example contains the acceptance control chart and process control chart for base course thickness. No judgement can be made on the product quality shown in this example, as requirements described by this Test Method do not reflect the conditions that controlled pavement construction for this project.
Lot Location Statistical Summaries
Process Limits for Sample Mean (mm) Lot
No. Start Ch. Offset Stgs Const. Date Stdev Mean n Full/Res.
Accept. Limits Centre Lower Upper
1 48k 330 4L to 4R 3 30/10/1999 3.0 256.0 58 F 255.7 2 48k 230 4L to 4R 3 30/10/1999 3.7 256.9 57 F 257.0 3 48k 135 4L to 4R 3 1/11/1999 4.3 255.1 60 F 258.1 4 48k 035 4L to 4R 3 1/11/1999 4.9 261.4 60 F 259.2 5 47k 935 4L to 4R 3 1/11/1999 3.4 253.9 60 F 256.4 6 47k 835 4L to 4R 3 1/11/1999 3.5 257.1 81 F 256.2 7 47k 700 4L to 4R 3 4/11/1999 3.0 256.0 60 F 255.6 8 47k 600 4L to 4R 3 4/11/1999 3.8 256.3 60 F 257.2 9 47k 500 4L to 4R 3 4/11/1999 2.7 256.4 48 R 255.2 10 47k 420 4L to 4R 3 5/11/1999 3.7 255.8 60 F 257.0
Table A1 - A lot Schedule in Accordance with Clause 6.2.3 for the Base Course Thickness
Lot Locations are in Metres, Control Limits are in Millimetres
Table A1 shows the survey conformance results for the first kilometre of the pavement, which is prior to calculation of the process control lines. Column 1 contains the lot numbers in sequential order of construction. Columns 2 and 3 contain the start chainage of each lot and offsets to both sides of the lot. This uniquely defines each lot of the base course. These are the same lots as the base surface level departures. Subtraction of the start chainages of consecutive lots gives the length of each lot. This project constructed the pavement in the direction of decreasing chainages. Column 4 contains the number of strings across the lot for sampling the pavement.

Test Method T193 July 2003 Sheet ii of viii
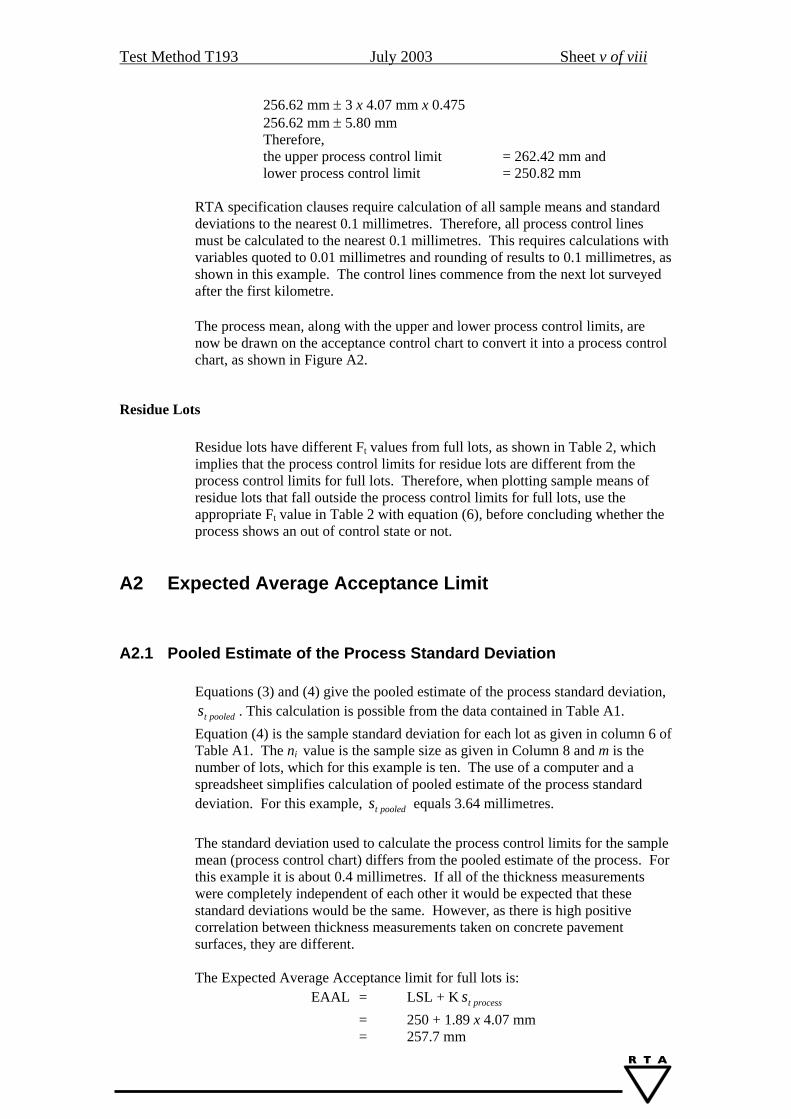
Column 5 contains the construction date. Columns 6, 7 and 8 contain the statistical summaries of each lot; the standard deviation, mean and sample size (n). Column 9 identifies if it is a full or a residue lot. Column 10 contains the acceptance limit for the sample mean in accordance with Clause 6.1. Columns 11, 12, and 13 are blank for the first kilometre of pavement construction. Data from the first kilometre of construction allow calculation of the process control lines for process control chart for the sample mean. Figure A1 is the acceptance control chart for the sample mean of thickness measurements. The mean thickness for each lot shown in Table A1 is plotted against the corresponding lot number. The acceptance limit for each lot is calculated by equation (1) and plotted as a short horizontal line above the corresponding lot number. Where the acceptance limit is below the corresponding sample mean, the lot conforms and where the acceptance limit is plotted above the sample mean, the lot does not conform.

Test Method T193 July 2003 Sheet iii of viii
250.0
252.0
254.0
256.0
258.0
260.0
262.0
264.0
266.0
0 5 10 15 20 25 30 35 40
Lot Numbers
Sam
ple
Mea
n (m
m)
Design Thickness = 250 mm
Figure A1 – Acceptance Control Chart for Base Course Thickness

Test Method T193 July 2003 Sheet iv of viii
A1 Calculation of Process Control Lines for Sample Mean
Figure A1 is the acceptance control chart for the sample mean, this compares the sample mean with tolerances given in the specifications. The control chart shows that 5 of the 10 lots were less than their respective acceptance limit and would have been rejected. The next stage is to convert this into a process control chart, which estimates the state of process control and the capability of the process to meet specified requirements for base course thickness.
A1.1 The Process Control Chart for the Sample Mean
The Process Mean Equation (2) calculates the process mean for the first kilometre of the pavement.
∑
∑
=
== m
ii
m
iii
n
tnt
1
1 (2)
The Table A1 provides the data for solving equation (2). The it values are contained in column 7 and the ni values are contained in column 8. The sum of the multiplications of the sample size times the sample mean for each lot is the numerator of equation (2). The denominator is the sum of column 8, which is the combined sample size of all the lots contained in the first kilometre of pavement.
The process mean by equation (2) for this example is 256.62 millimetres.
The Process Control Limits Equation (2) determines the centre line position for the sample mean process control chart. The upper and lower process control limits are set equispaced about the centre line as given by equation (6). The value is determined by equation (5): processts
( )
1
2
1
−
−=
∑=
N
tts
N
jj
processt (5)
This calculation is not possible with the data provided in Table A1. It requires all the raw survey measurements taken on the first kilometre of pavement and for accuracy and efficiency, the use of a computer. The N value in equation (5) is same as the denominator of equation (2), which for this example is 604 measurements. The value for this example is 4.07 millimetres by equation (5).
processts
From Table 2 the Ft value for full lots is 0.475. Therefore, the upper and lower process control limits are given as:
Test Method T193 July 2003 Sheet v of viii
256.62 mm ± 3 x 4.07 mm x 0.475 256.62 mm ± 5.80 mm Therefore,
the upper process control limit = 262.42 mm and lower process control limit = 250.82 mm
RTA specification clauses require calculation of all sample means and standard deviations to the nearest 0.1 millimetres. Therefore, all process control lines must be calculated to the nearest 0.1 millimetres. This requires calculations with variables quoted to 0.01 millimetres and rounding of results to 0.1 millimetres, as shown in this example. The control lines commence from the next lot surveyed after the first kilometre.
The process mean, along with the upper and lower process control limits, are now be drawn on the acceptance control chart to convert it into a process control chart, as shown in Figure A2.
Residue Lots Residue lots have different Ft values from full lots, as shown in Table 2, which implies that the process control limits for residue lots are different from the process control limits for full lots. Therefore, when plotting sample means of residue lots that fall outside the process control limits for full lots, use the appropriate Ft value in Table 2 with equation (6), before concluding whether the process shows an out of control state or not.
A2 Expected Average Acceptance Limit
A2.1 Pooled Estimate of the Process Standard Deviation Equations (3) and (4) give the pooled estimate of the process standard deviation,
. This calculation is possible from the data contained in Table A1. Equation (4) is the sample standard deviation for each lot as given in column 6 of Table A1. The n
pooledts
i value is the sample size as given in Column 8 and m is the number of lots, which for this example is ten. The use of a computer and a spreadsheet simplifies calculation of pooled estimate of the process standard deviation. For this example, equals 3.64 millimetres. pooledts The standard deviation used to calculate the process control limits for the sample mean (process control chart) differs from the pooled estimate of the process. For this example it is about 0.4 millimetres. If all of the thickness measurements were completely independent of each other it would be expected that these standard deviations would be the same. However, as there is high positive correlation between thickness measurements taken on concrete pavement surfaces, they are different. The Expected Average Acceptance limit for full lots is: EAAL = LSL + K processts = 250 + 1.89 x 4.07 mm = 257.7 mm

Test Method T193 July 2003 Sheet vi of viii
Plotting this value on the process control chart provides an indication of the capability of the process to construct the pavement with the specified minimum thickness. Figure A2 shows the process control limits plotted over the acceptance control chart.

Test Method T193 July 2003 Sheet vii of viii
Lot Location Statistical Summaries Process Limits for Sample
Mean (mm) Lot No. Start Ch. Offset Stgs Const. Date Stdev. Mean n
Full/Res.
Accept. Limits Centre Lower Upper
1 48k 330 4L to 4R 3 30/10/1999 3.0 256.0 58 F 255.7 2 48k 230 4L to 4R 3 30/10/1999 3.7 256.9 57 F 257.0 3 48k 135 4L to 4R 3 1/11/1999 4.3 255.1 60 F 258.1 4 48k 035 4L to 4R 3 1/11/1999 4.9 261.4 60 F 259.2 5 47k 935 4L to 4R 3 1/11/1999 3.4 253.9 60 F 256.4 6 47k 835 4L to 4R 3 1/11/1999 3.5 257.1 81 R 256.0 7 47k 700 4L to 4R 3 4/11/1999 3.0 256.0 60 F 255.6 8 47k 600 4L to 4R 3 4/11/1999 3.8 256.3 60 F 257.2 9 47k 500 4L to 4R 3 4/11/1999 2.7 256.4 48 R 255.2 10 47k 420 4L to 4R 3 5/11/1999 3.7 255.8 60 F 257.0 11 47k 320 4L to 4R 3 5/11/1999 2.7 254.2 60 F 255.1 256.6 250.8 262.412 47k 220 4L to 4R 3 5/11/1999 2.7 254.2 60 F 255.1 256.6 250.8 262.413 47k 120 4L to 4R 3 5/11/1999 3.2 254.9 58 F 256.1 256.6 250.6 262.414 47k 020 4L to 4R 3 5/11/1999 4.8 255.1 60 F 259.0 256.6 250.8 262.415 46k 920 4L to 4R 3 5/11/1999 3.3 253.4 84 R 256.1 256.6 251.6 261.616 46k 780 4L to 4R 3 8/11/1999 4.4 255.1 60 F 258.3 256.6 250.8 262.417 46k 680 4L to 4R 3 8/11/1999 2.2 253.1 60 F 254.1 256.6 250.8 262.418 46k 580 4L to 4R 3 8/11/1999 3.3 256.1 60 F 256.2 256.6 250.8 262.419 46k 480 4L to 4R 3 8/11/1999 3.0 259.2 60 F 255.6 256.6 250.8 262.420 46k 380 4L to 4R 3 8/11/1999 2.8 255.9 63 F 255.3 256.6 250.8 262.421 46k 275 4L to 4R 3 10/11/1999 2.9 258.5 60 F 255.5 256.6 250.8 262.422 46k 175 4L to 4R 3 11/11/1999 2.7 258.8 60 F 255.1 256.6 250.8 262.423 46k 075 4L to 4R 3 11/11/1999 3.2 253.8 60 F 256.0 256.6 250.8 262.424 45k 975 4L to 4R 3 11/11/1999 3.0 258.9 60 F 255.6 256.6 250.8 262.425 45k 875 4L to 4R 3 11/11/1999 2.9 256.1 60 F 255.5 256.6 250.8 262.426 45k 775 4L to 4R 3 11/11/1999 3.1 255.3 60 F 255.8 256.6 250.8 262.427 45k 675 4L to 4R 3 11/11/1999 3.0 260.8 60 F 255.6 256.6 250.8 262.428 45k 575 4L to 4R 3 11/11/1999 2.0 258.9 60 F 253.8 256.6 250.8 262.429 45k 475 4L to 4R 3 12/11/1999 3.2 257.3 60 F 256.0 256.6 250.8 262.430 45k 375 4L to 4R 3 12/11/1999 3.0 254.5 75 R 254.6 256.6 251.3 261.9
Table A2 – Lot Schedule of Base Course Thickness with Process Limits

Test Method T193 July 2003 Sheet viii of viii
250.0
252.0
254.0
256.0
258.0
260.0
262.0
264.0
266.0
0 5 10 15 20 25 30 35 40
Lot Numbers
Sam
ple
Mea
n (m
m)
Low er Process Control Limit = 250.8
Process Mean = 256.2
Upper Process Control Limit = 262.4
Expected Average Acceptance Limit=257.7
Figure A2 - x Acceptance Control Chart Converted to x Process Control Chart by Addition of Process Control Lines