estimates of canadian arctic archipelago runoff from observed hydrometric data
TRANSCRIPT
Journal of Hydrology (2008) 362, 247–259
ava i lab le a t www.sc iencedi rec t . com
journal homepage: www.elsevier .com/ locate / jhydrol
Estimates of Canadian Arctic Archipelago runofffrom observed hydrometric data
Christopher Spence *, Amanda Burke
Environment Canada, 11 Innovation Blvd, Saskatoon, SK, Canada S7N 3H5
Received 21 January 2008; received in revised form 4 July 2008; accepted 24 August 2008
00do
*
KEYWORDSCanada;Arctic Archipelago;Runoff;Regionalization;Hydrometric data
22-1694/$ - see front mattei:10.1016/j.jhydrol.2008.08
Corresponding author. FaxE-mail address: chris.spen
r Crown.019
: +1 [email protected]
Summary Small basin studies in the remote Canadian Arctic Archipelago have revealedthe general nature of runoff processes and the annual rhythms and magnitude of stream-flow in the region, but widespread monitoring of hydrological cycle components is absent.The result is that an understanding of large scale freshwater fluxes from the Arctic Archi-pelago does not exist. Such understanding is important for sound domestic water manage-ment decisions and international obligations to quantify Canada’s freshwater supply to theoceans. The study summarized by this paper, initiated under the auspices of the Interna-tional Polar Year, extrapolated observed streamflow attributes across the Arctic Archipel-ago using statistical regionalization tools. The paucity of hydrometric data necessitatedthe construction of a dataset, which was limited to the period from 1972 to 1994. Reliableestimates of mean May–October freshwater flux were possible from �70% of the Archipel-ago and these total �190 km3. Maximum daily runoff can be up to 13% of the total annualflux from some catchments. Flows were highest from southern Baffin Island, decreasingwestward. The scarcity of data compelled an error analysis that showed average confi-dence intervals around constructed and regionalized data of ±123% and ±63%, respec-tively. Dataset construction errors were inversely related to basin area. There was nospatial pattern to the dataset construction errors, but regionalization error tended tobe higher in the west. It will be argued that our community has little to no idea of the cur-rent freshwater flux from the Arctic Archipelago, or if it is changing. Much work is neededto improve these estimates, including establishing a sustainable, effective and efficientmonitoring and research program of high arctic freshwater systems that can build uponthe legacy of the International Polar Year.Crown Copyright ª 2008 Published by Elsevier B.V. All rights reserved.
Copyright ª 2008 Published by E
975 5143..ca (C. Spence).
Introduction
Canada’s Arctic Archipelago is a region that has generatedmuch societal interest in recent years. The prospect of
lsevier B.V. All rights reserved.

248 C. Spence, A. Burke
continued climate warming in the region (ACIA, 2005) hasincreased interest and explorative activity in mining, hydro-power and tourism. The footprint of human activity willgrow across the Archipelago. The extent of knowledge ofthe Archipelago’s physical environment will dictate theeventual nature of this footprint.
It is important to gauge the state of our knowledge of thisregion now, particularly its freshwater resources, to iden-tify the nature of the gaps in our understanding. This mayallow these gaps to be addressed so that engineered works,when they are formally proposed, can be properly designed.The $320,000,000 cost of recent cleaning of Distant EarlyWarning Line sites implies that the consequences of unsus-tainably designed infrastructure in such an environmentallyfragile location could be severe and expensive. Further-more, the economic costs of over-design are significant inwhat is an increasingly expensive operating environment.An ability to demonstrate knowledge and understanding ofthe hydrological regime of the Archipelago may also assistin cementing Canada’s sovereignty in the region.
The importance of understanding the freshwater flux onthe Arctic Archipelago extends offshore. Because the ArcticOcean is the world’s most river influenced and land lockedocean (Lammers et al., 2001), the freshwater flowing fromthe continental shelf can have a significant impact on theformation of sea ice and corresponding feedbacks to boththe regional and possibly global climate. While mostof the freshwater export from the Archipelago does notenter the Arctic Ocean, it does flow southwards towardsBaffin Bay and enters the Atlantic Ocean via the LabradorCurrent (Carmack, 2000) where it influences global thermo-haline circulation (Kattsov et al., 2007).
Despite the importance of defining the freshwater flux innorthern Canada, knowledge of the state and trends of itshydrological regimes is poor and decreasing (Spenceet al., 2007). It is believed that this is particularly so inthe Arctic Archipelago. The region remains poorly under-stood because of the logistical difficulties in obtainingobservations (Young and Woo, 2004a) and the resulting pau-city of data (Bowling et al., 2000). Not that there have everbeen many hydrometric gauges or weather stations in theArchipelago, but the decrease in polar hydrometric andmeteorological networks since the early 1990s is well docu-mented (i.e., Shiklomanov et al., 2002). There was but oneWater Survey of Canada hydrometric gauge on the entireArchipelago that generated published data between 1994and 2006.
Attempts to quantify the freshwater flux from the Archi-pelago have applied large scale hydrological models(Rawlins et al., 2003) or used the residual of hydroclimato-logical measurements (Cullather et al., 2000) at pan-Arcticscales. Assessments of these estimates in the Archipelagoare hindered by limitations in observational data (Kattsovet al., 2007). Previous studies using observed hydrometricdata that have attempted to estimate runoff from thepan-Arctic region have had to omit the region from analysisbecause of its ungauged nature (Lammers et al., 2001). Inthe 1993 edition of the National Atlas of Canada, estimatesof mean and maximum daily annual runoff were not re-ported for the Archipelago due to insufficient data (Depart-ment of Energy, Mines and Resources, 1993). Prowse andFlegg (2000) estimate the annual runoff from the Archipel-
ago as comparable to that from small basins near Resolute(Woo et al., 1983), having little else at their disposal. Thegoal of the research documented in this paper, part of Can-ada’s contribution to the International Polar Year, is to ad-dress this knowledge gap by estimating components of thestreamflow regime of the Arctic Archipelago using observedhydrometric data and defining the uncertainty in theestimates.
The Arctic Archipelago
Canada’s Arctic Archipelago contains an area of1.3 · 106 km2, or 14% of the country’s land mass (Fig. 1).It is a region of extremes, with winter nights lasting from20 h at Kimmirut on southern Baffin Island to 134 days atAlert on northern Ellesmere Island. Undoubtedly, the cli-mate is cold. Many Meteorological Service of Canada sta-tions report mean annual temperatures near �15 �C. Thelow volume, snow dominated precipitation is difficult toquantify (Goodison, 1978), but gauge measurements implyIqaluit, Sachs Harbour and Alert respectively receive 412,144 and 154 mm of precipitation annually.
The western portion of the Archipelago is underlain byflat-lying Paleozoic and Mesozoic sedimentary bedrock,and consists mostly of lowland plains covered with glacialmoraine, marine deposits and bedrock outcrops. East ofPrince of Wales and Somerset Islands, the terrain is com-posed mainly of Precambrian granitoid bedrock, and tendsto consist of plateaus and rocky hills. A harsh climate, highwinds and shallow soils result in sparse and dwarfed plantlife. Herb and lichen dominated communities constitutethe main vegetative cover. The latter is closely associatedwith rock fields and hilly upland areas. Common herbs arepurple saxifrage, mountain aven, and arctic poppy, oftenmixed with shrubs such as arctic willow. Shrub size de-creases rapidly northward. Vegetative cover tends to begreater in polar oases (Woo and Young, 1997), those areasconfined to coastal lowlands, sheltered valleys and moistnutrient-rich corridors along streams and rivers. The ArcticCordilleran ecozone contains the north shore of Baffin Islandand extends northward up the Smith Sound to the tip ofEllesmere Island. Elevations range from sea level to over2000 m above sea level. Massive ice fields and valley glacierscap many of the mountains with valley glaciers extendinginto valleys and fjords. Almost 75% of the landscape is iceor exposed bedrock. The permafrost is continuous andmay extend to depths of several hundred metres. Cryosolicsoils predominate across the Archipelago (Ecological Strati-fication Working Group, 1996).
Glacier mass balance measurements from 1959 to thepresent across the Archipelago show continuing negativemass balances, likely due to slight increases in summer tem-peratures (Koerner, 2005). Knowledge of the dynamics ofseveral glaciers in the Archipelago has increased in recentyears due to the application of remote sensing techniques(Dowdeswell et al., 2003; Mair et al., 2003; Burgess et al.,2005; Short and Gray, 2005). Ice caps and glaciers in theArchipelago are thinning at lower elevations, but exhibit lit-tle change in accumulation zones (Abdalati et al., 2004).This thinning is more pronounced on Baffin Island than it isfurther north.

Figure 1 Map of Canada’s Arctic Archipelago showing the extent of glacial cover, and selected communities and islands. Only thelargest study basins are visible at this scale.
Estimates of Canadian Arctic Archipelago runoff from observed hydrometric data 249
Hydrological studies in unglaciated portions of the Arc-tic Archipelago have concentrated on understanding thecold regions processes that produce distinct streamflowsignals. Snow falls for six to nine months across the entireregion, accumulating and redistributing with winds andtopography (Woo, 1993). Snowmelt, when it begins in lateMay and June, occurs quickly because of high radiation in-puts during extended daylight hours. Meltwater must tra-vel through the snowpack (Marsh and Woo, 1984; Woo andSauriol, 1980) to reach the frozen ground that has a pro-found influence on soil storage capacity and where runoffis generated (Woo and Steer, 1983). Water is not con-veyed to the catchment outlet until water in snow andsurface channels can coalesce (Woo, 1993). Snow jamsoccupying lake outlets (Woo et al., 1981) further affectthe storage and release of spring meltwater to the catch-ment outlet.
The annual hydrographs across the unglaciated portion ofthe Archipelago are dominated by the snow meltwater sig-nal and have an arctic nival regime (Church, 1974). Woo
et al. (1983)documented several meltwater events atMcMaster River near Resolute that released three quartersof the annual discharge. Differences noted in the basinwater budgets of polar deserts (Woo et al., 1983) and polaroases (Woo and Young, 1997) show that the latter produceless runoff (Young and Woo, 2004b). Some ability to extrap-olate this knowledge exists as Young et al. (1997) found thatrunoff response is closely tied to local topography, soils andvegetation. Topography profoundly affects snow distribu-tion and radiative inputs. Soil and vegetation compositionand structure control ground thaw, storage capacity andevaporative loss.
Methodology and data sources
Hydrometric data
Catchment hydrometric data selected for this study werebased upon the following criteria:

250 C. Spence, A. Burke
1) Catchments must be within either of the two ecoz-ones contained in the Arctic Archipelago; the North-ern Arctic or Arctic Cordilleran (EcologicalStratification Working Group, 1996). Catchments out-side the Archipelago but in the Northern Arctic ecoz-one were included in order to maximize the possiblenumber of stations.
2) Uninterrupted daily streamflow data had to beavailable from May 1 to October 31, or the recordhad to capture an entire flow period from freshetto freeze up for at least one calendar year. Datafrom this six month period is adequate in termsof capturing the significant traits of the annual hyd-rograph. Demanding annual records would havereduced the number of catchments to unworkablelevels because most observations are made onlyduring the thaw season.
Eleven catchments gauged by the Water Survey of Can-ada (WSC) met these criteria. Two catchments gauged byuniversity researchers in the 1980s and 1990s also met thesecriteria (Woo et al., 1983; Woo and Young, 1997). The datafrom these latter catchments were not selected for analysisfor two reasons. First, resultant regionalization errors wereexpected to be high, so it was considered prudent to not usedata from different sources and perhaps introduce furthererror into the results. Secondly, the data from Young andWoo were considered more valuable as an independent testfor the results.
Table 1 Stations selected for analysis
Watershed WSCgauge
Area(km2)
Period ofrecord
Maximdaily(Qmax
Allen River near themouth
10VC001 194.1 1971–1979 30.7
Apex River at Apex 10UH002 59.1 1973–1994 11.7Big River above EggRiver
10TA001 3649 1976–1988 5.6
Duval River nearPangnirtung
10UF001 100 1982–1983 14.4
Freshwater Creek nearCambridge Bay
10TF001 1572 1975–2004 2.2
Hayes River aboveChantry Inlet
10SB001 17,713 1973–1992 10.6
Marcil Creek nearOutlet Bay
10UB001 139.1 1978–1981 8.9
Mecham River nearResolute
10VC002 100.4 1972–1979 18.9
Snowbird Creek nearBradford Island
10VC013 63.7 1976 10
Sylvia Grinnell Rivernear Iqaluit
10UH001 3013 1971–1995 10
Tulugak River onBroughton Island
10UE001 20 1982–1983 28.4
The period of record includes those years in which the data of the annannual precipitation. S is mean slope. %R and %I are percentage of expinformation was derived from Cihlar et al. (2002).
Gap filling of hydrometric data
As Table 1 shows, many records were short and a consistenttime period for analysis was not apparent from the stationrecords. This is a common problem in high latitude areas(Grabs et al., 2000). A comparable period of record had tobe built. Annual mean, maximum, and minimum daily flows(Xi) were calculated for each basin. From these flow values,an overall average mean, maximum and minimum daily flowwas calculated for each selected basin (�X) from which Xiwas normalized as follows:
X 0i ¼1þ ðXi � �XÞ
�Xi
ð1Þ
where X 0i is the normalized mean May–October or maximumannual daily flow for a given year, i. Flows were normalizedin an attempt to prevent autocorrelation within the datasetduring subsequent steps in the methodology. Minimum flowswere not normalized since, for every basin and for everyyear of selected record, minimum annual average daily flowvalues were 0. The analysis continued with a focus on themean maximum annual daily flow and the mean May–Octo-ber flow.
In many statistical extrapolation exercises, neighbor-hoods or regions of common watersheds are selected(Spence et al., 2007; Ouarda et al., 2000; Ribeiro-Correaet al., 1995). In this study, however, too few records existto do so. During initial phases of the analysis, the availabil-ity of data sometimes limited the selection of stations in
um annualrunoff) (mm)
Mean May–Octoberrunoff (Qavg) (mm)
MAP(mm)
S (%) %R %I
382.9 516 0.98 0 100
314.4 329 2.12 1.0 060.8 228 0.96 53.2 1.2
418.9 527 7.45 31.7 4.1
79.8 316 0.41 31.5 0.5
233.4 331 1.35 2.5 0.2
123.8 226 2.83 42.5 11.6
177.6 329 1.11 0 100
148.7 112 1.35 20.9 76.7
327.5 497 1.43 10.4 1.4
437.3 486 2.01 0.7 0
ual hydrograph are complete and used for this study. MAP is meanosed bedrock and permanent snow or ice, respectively. Land cover

Estimates of Canadian Arctic Archipelago runoff from observed hydrometric data 251
neighborhood subsets to one or two; inappropriate forextrapolating. All available stations were used in order tomaximize the amount of useable data for gap filling. Thismay create bias and error in the results, but this was ad-dressed with an error analysis described below.
Annual gaps of normalized mean or maximum stream-flows for each basin were calculated as follows:
X 0ij ¼ mAþ b ð2Þ
where A is basin area (km2) and m and b are coefficients de-rived for each year from a linear regression calculated be-tween basin area and observed X 0ij in each basin, j.Rearranged, Eq. (1) is
Xi ¼ �X þ ½�X � ðX 0i � 1Þ� ð3Þ
which was used to calculate the actual value of either meanMay–October or mean maximum annual daily flow for a yearwith a missing value. No regression was possible for yearswhen data was available from two or fewer basins. Anincomplete period of record remained, but few gaps existduring a period of 22 years, from 1972 to 1994. This was se-lected as the period of record for the study.
Physiographic and climatic data
Physiographic and climatic parameters were gathered foreach of the selected gauged basins. Parameters were se-lected based upon data availability and how significantlythey were expected to affect the hydrological regime.Drainage basin area (A) is the most common variable usedfor extrapolating streamflow (Ouarda et al., 2000; Ribeiro-Correa et al., 1995). These data were obtained from water-sheds digitized at a scale of 1:250,000 within an ArcGIS.Hydrometric station location was used to represent the lat-itude (LAT) and longitude (LONG) of each watershed.
Mean annual precipitation (MAP) and mean annual tem-perature (T) values were obtained from the CANGRID data-set (Louie et al., 2002; Zhang et al., 2000). ThisMeteorological Service of Canada dataset provides griddedprecipitation and temperature values across Canada at a50 km resolution. All the gridded data products availablefor northern Canada rely on the same sparse observationnetwork for calibration. CANGRID uses 27 to grid precipita-tion and temperature across the Archipelago (see Fig. 2 in
Figure 2 Scatterplots of predicted Qavg from Eq. (7) and Qmax froAll units are in mm.
Zhang et al., 2000 for the distribution). The Gandin OptimalInterpolation procedure used in the development of CAN-GRID has proven effective in interpolating data across datasparse regions such as the Mackenzie (Louie et al., 2002).Correlations between gridded and observed temperaturedata were larger than 0.85 and root mean squared errorsof precipitation were as low as 0.3. What differentiatesCANGRID is it is the only dataset to account for inhomogene-ities in the temperature record caused by station reloca-tion, instrument changes and observing practices andinhomogeneities in the precipitation record due to instru-ment changes, observing practices, wind undercatch andwetting loss (Zhang et al., 2000). Undercatch and wettingloss are key sources of precipitation estimation error innorthern Canada (Metcalfe et al., 1994) and were accountedfor using methods described in (Mekis and Hogg, 1999). Inorder to obtain annual precipitation values for each basina GIS overlay procedure was used. The digitized watershedswere overlaid with a gridded form of the CANGRID dataset,from which values were averaged to estimate the MAP and Tvalues for each basin.
Young et al. (1997) demonstrated the importance of ter-rain on runoff response in high Arctic watersheds. With sim-ilar overlay techniques, the mean slope (S) and aspect (ASP)of each watershed was estimated from a 30 s resolution gridof Canadian Digital Elevation Data (CDED) (Natural Re-sources Canada, 1999).
Land cover was also incorporated into the statisticalmodel to account for the influence of land cover on thehydrological response. Basins are expected to produce con-trasting runoff regimes if they contain significantly differentproportions of land cover types representing different evap-orative and storage regimes, such as shrub tundra at polaroases or exposed rock at polar deserts (Young and Woo,2004a,b) or glaciated terrain (Woo, 1993). Land cover distri-bution was assessed for each of the basins using the 1998Canada Centre for Remote Sensing (CCRS) land cover map(Cihlar et al., 2002). The original map divided land coverinto 31 different categories. Relevant classes were mergedinto four broad categories based on expected similaritiesin hydrological properties. These include percentages oflakes and rivers (%W), shrub tundra (%ST), lichen tundra(%LT) and exposed bedrock (%R). A value of 0.01% was ap-plied when measured percentages were zero, which could
m Eq. (8) versus observed data from the 11 gauged watersheds.

Table 2 Observed and constructed (bolded and italicized) mean May–October streamflow
Year Allen Apex Big Duval Freshwater Hayes Marcil Mecham Snowbird Sylvia Grinnell Tulugak
1971 5.9 52.31972 3.9 0.9 10.7 2.1 6.3 143 0.9 0.8 0.5 46.5 0.41973 1.4 2791974 4.7 1.1 1.2 2.5 7.4 124 1.3 0.9 0.6 54.0 0.51975 5.1 1921976 4.4 1.1 12.6 2.5 7.6 255 1.0 1.0 0.6 58.4 0.51977 4.7 1.2 14.0 2.7 8.3 319 1.1 1.2 0.6 64.5 0.51978 5.1 1.4 15.2 3.1 10.3 150 1.2 1.3 0.7 66.8 0.61979 3.4 1.0 8.1 2.2 6.9 223 0.9 1.2 0.5 51.2 0.41980 11.9 7.91981 4.4 1.1 14.5 2.5 5.9 249 1.2 1.0 0.6 57.8 0.51982 4.3 0.7 13.5 2.9 10.0 280 0.9 1.0 0.5 57.8 0.31983 4.8 0.8 16.3 2.4 7.3 212 1.1 1.1 0.6 71.2 0.71984 4.2 1.0 17.6 2.3 5.8 304 0.9 0.9 0.5 52.3 0.41985 5.2 1.3 15.6 2.9 9.1 271 1.2 1.2 0.6 64.3 0.61986 5.9 1.7 18.5 3.3 7.3 225 1.3 1.4 0.8 74.6 0.71987 5.9 1.6 20.9 3.2 9.5 443 1.3 1.4 0.7 74.0 0.71988 5.3 1.3 7.8 2.9 13.4 280 1.2 1.3 0.6 68.2 0.61989 4.3 0.9 13.3 2.4 7.7 259 0.9 1.0 0.5 66.2 0.51990 4.6 1.4 14.4 2.5 5.5 314 1.0 1.0 0.6 67.3 0.51991 4.1 0.9 12.6 2.3 7.8 258 0.9 0.9 0.5 52.7 0.41992 3.9 0.9 11.7 2.2 7.2 187 0.9 0.9 0.5 53.3 0.41993 8.61994 4.6 1.2 15.9 2.5 6.9 455 1.4 1.1 0.6 71.5 0.51995 8.9 51.4
Units are in m3/s.
252 C. Spence, A. Burke
not have been interpreted during the statistical analysis.The extent of glacial coverage in each watershed was calcu-lated by overlaying the National Scale Frameworks glacialcover dataset over each watershed.
Multiple regression analysis
This study applied a multiple regression analysis to predictrunoff characteristics variables across the Arctic Archipel-ago. The streamflow parameters were converted to runoffin order to remove the influence of area. This was donefor two reasons. First, the gap filling process was influencedby basin area and the authors wanted to avoid any possiblebias. Second, basin area can overwhelm any influence otherphysio-climatic variables may have (Ouarda et al., 2000;Spence and Saso, 2005). Simple linear regressions were con-ducted between each independent physio-climatic and run-off parameter to determine the most influential variables oneach component of the streamflow regime. These variableswere used in a multiple regression analysis to derive theequations that best extrapolated runoff. These equationswere input into an ArcGIS platform to permit mapping ofthe regionalized streamflow parameters.
Error analysis
The above methodology describes a great deal of extrapola-tion from some very sparse data. None of the previous stud-ies that have attempted to estimate runoff from the Arctic
Archipelago have conducted explicit error analyses. How-ever, it is incredibly important to be able to gauge the valueof generated numbers and the degree of information thatthey present. The margin of error was calculated usingjack-knife techniques similar to those used by Spenceet al. (2007) for both the gap filling exercise and multipleregression analysis. For the gap filling exercise, the first stepof this process was to remove one station from the group ofstations on which the regression for each year was based,then re-apply the regression analysis using the rest of thedataset. This makes it possible to compare the measuredstreamflow with those estimated by the regression for thepurpose of determining error. Similarly, individual stationswere withdrawn from the multiple regression analysis andvalues estimated for each using the remaining stations.
The accuracy of the estimate was calculated using boththe percentage error, E
E ¼ 100 � ðqc � qeÞqc
ð4Þ
and the root mean square error (RMSE) calculated as
RMSE ¼
ffiffiffiffiffiffiffiffiffiffiffiffiffiffiffiffiffiffiffiffiffiffiffiP qc�qeqc
� �2n
vuutð5Þ
where qc is calculated value with the observed record, qe isthe estimated value by CCA and multiple regression, and n isthe number of estimates, with improvements as RMSE ap-proaches zero. Confidence intervals about the estimate

Estimates of Canadian Arctic Archipelago runoff from observed hydrometric data 253
(CI), as a measure of the uncertainty, were calculated as(Hirsch et al., 1993)
CI ¼ ts
ffiffiffiffiffiffiffiffiffiffiffiffiffiffiffiffiffiffiffiffiffiffiffiffiffiffi1
nþ ðA�
�AÞ2
Sxx
sð6Þ
where t is the point on the Student’s t distribution withn � 2 degrees of freedom, s is the standard error, Sxx isthe sum of squares of the independent variable and n, thenumber of members in the neighborhood. Basin area, A,was selected as the independent variable for the CI analysisfor the gap filling exercise. Mean annual precipitation, MAP,for the multiple regression analysis.
Results
Constructed hydrometric data
Every gauged stream in the Archipelago experienced zeroflow every winter. Even the 17,700 km2 watershed of thelarge Hayes River couldn’t supply enough water to preventflow from ceasing over winter. Analysis of minimum flowswas not warranted. Originally, the authors wished to region-alize monthly flows in addition to annual flows. Data wereeven more sporadic than at the annual scales shown in Ta-bles 2 and 3. The station selection and data retrieval exer-cise at the beginning of the study revealed that only themost basic of streamflow attributes could be analyzed with-in the study. Data were deemed too sparse to subject flowsto any type of frequency analysis. Mean May–October
Table 3 Observed and constructed (bolded and italicized) mean
Year Allen Apex Big Duval Freshwater Hayes
1971 1051972 64.6 7.4 201 15.4 37.3 15951973 9.4 9541974 70.2 9.2 223 19.1 44.5 6091975 37.7 3941976 53.9 6.1 123 12.7 33.3 32301977 56.4 6.8 252 14.0 36.2 28001978 77.0 9.9 253 20.4 61.2 13801979 61.6 7.9 91.5 16.3 38.2 10501980 141 33.91981 46.0 5.3 136 11.1 25.1 5341982 74.6 4.5 264 21.2 60.0 33901983 83.9 10.9 453 13.4 37.0 15801984 58.2 6.7 200 13.8 29.3 23101985 84.2 11.8 262 20.2 46.5 20201986 98.7 11.3 430 23.6 49.0 27501987 84.5 10.5 400 19.8 38.9 50501988 53.1 6.7 150 12.6 33.2 21101989 84.4 7.9 281 20.1 42.2 28201990 53.2 6.5 218 12.3 27.7 40601991 57.8 5.2 194 13.7 44.3 20801992 61.9 5.6 210 14.7 43.1 23001993 59.11994 84.2 10.1 224 20.5 45.21995 52.8
Units are in m3/s.
streamflow, Qavg, and mean annual daily maximums, Qmax,were selected as the only traits that could be viably con-structed and regionalized.
The two hydrometric gauges that span the bulk of the1972–1994 study period measured flows in FreshwaterCreek and Hayes River (Tables 2 and 3). Streams that weremonitored early during the study period were near Resolute;the Allen, Marcil and Mecham. In the 1980s, resources weremore focused around Iqaluit, as the records of the Apex andSylvia Grinnell improved. Station records with too manygaps in daily data (i.e., Big) required gap filling within theperiod of record. The 1972–1994 records of the Duval,Snowbird and Tulugak are almost all constructed. In total,of the 231 station-years of record, 127 or 53% were con-structed. These results demonstrate the scarcity of usabledata across the Archipelago.
Regionalized streamflow
Five of the original twelve physio-climatic parameters werewell correlated with mean May–October streamflow. Theseincluded the percentage of exposed rock, mean slope, pre-cipitation, latitude and longitude (Table 4). The good corre-lation between Qavg and location is interesting as it mayencapsulate regional variations in climate and surficial geol-ogy. The best fit relationship with statistically significant(95%) physio-climatic parameters did not include latitudeand longitude, however:
Q avg ¼ 73:6� 3:3 �%Rþ 28:2 � Sþ 0:49 � MAP ð7Þ
annual maximum streamflow
Marcil Mecham Snowbird Sylvia Grinnell Tulugak
28312.9 19.9 6.6 306 5.9
16.1 27.6 8.3 346 7.4
10.7 16.5 7.5 296 4.911.8 16.2 6.1 314 5.417.6 22.2 8.8 389 7.916.6 27.0 7.1 304 6.4
9.6 14.5 4.8 206 4.314.9 23.0 7.6 392 6.616.9 26.0 8.7 400 6.811.6 18.0 5.9 350 5.317.0 26.3 8.7 319 7.819.9 30.8 10.2 410 9.216.7 25.8 8.6 438 7.710.6 16.5 5.5 270 4.916.9 26.2 8.7 585 7.810.4 16.1 5.3 345 4.711.6 17.9 5.9 275 5.312.4 19.2 6.3 338 5.7
17.3 26.7 8.8 360 8.0240
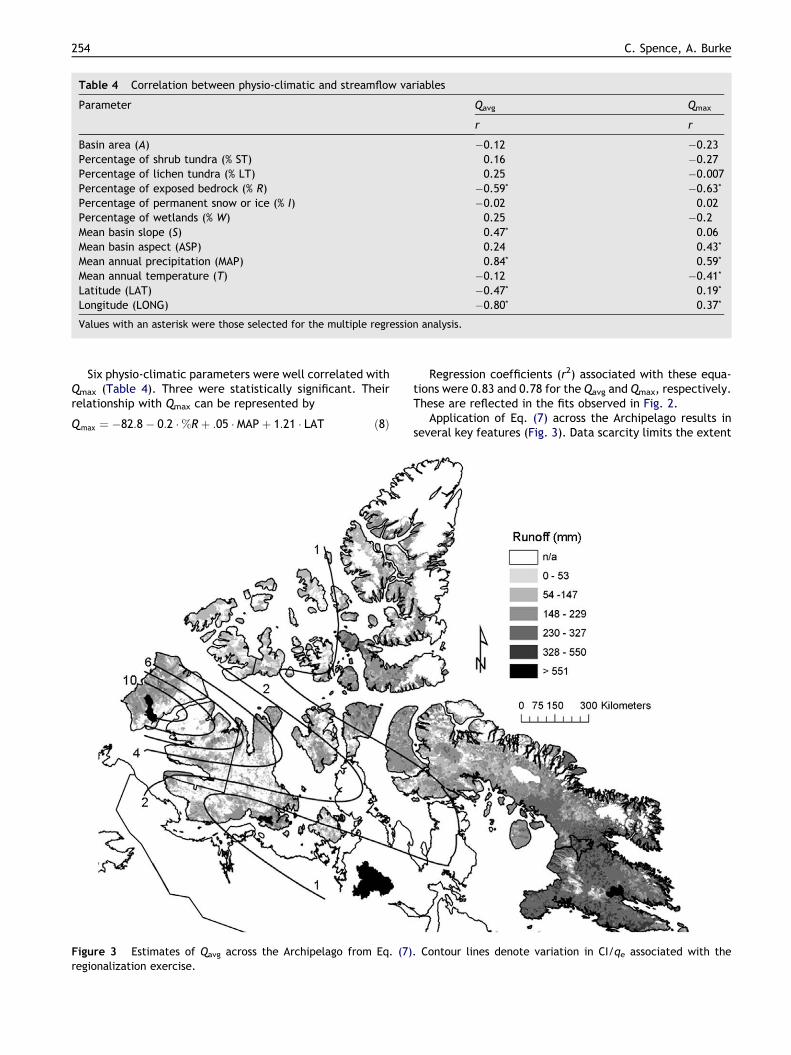
Table 4 Correlation between physio-climatic and streamflow variables
Parameter Qavg Qmax
r r
Basin area (A) �0.12 �0.23Percentage of shrub tundra (% ST) 0.16 �0.27Percentage of lichen tundra (% LT) 0.25 �0.007Percentage of exposed bedrock (% R) �0.59* �0.63*Percentage of permanent snow or ice (% I) �0.02 0.02Percentage of wetlands (% W) 0.25 �0.2Mean basin slope (S) 0.47* 0.06Mean basin aspect (ASP) 0.24 0.43*
Mean annual precipitation (MAP) 0.84* 0.59*
Mean annual temperature (T) �0.12 �0.41*Latitude (LAT) �0.47* 0.19*
Longitude (LONG) �0.80* 0.37*
Values with an asterisk were those selected for the multiple regression analysis.
254 C. Spence, A. Burke
Six physio-climatic parameters were well correlated withQmax (Table 4). Three were statistically significant. Theirrelationship with Qmax can be represented by
Qmax ¼ �82:8� 0:2 �%Rþ :05 � MAPþ 1:21 � LAT ð8Þ
Figure 3 Estimates of Qavg across the Archipelago from Eq. (7)regionalization exercise.
Regression coefficients (r2) associated with these equa-tions were 0.83 and 0.78 for the Qavg and Qmax, respectively.These are reflected in the fits observed in Fig. 2.
Application of Eq. (7) across the Archipelago results inseveral key features (Fig. 3). Data scarcity limits the extent
. Contour lines denote variation in CI/qe associated with the

Estimates of Canadian Arctic Archipelago runoff from observed hydrometric data 255
of the CANGRID dataset to below 82�N, and as such, runoffestimates cannot be made above that latitude. Only one ofthe selected watersheds had glacial coverage (Duval – 4%)so the decision was made not to extrapolate flows into glac-ierized catchments. The mean May–October runoff is high-est in southeastern Baffin Island with predictions rangingfrom 230 mm to as high as 720 mm. Runoff gradually de-creases westward to values of 200 mm near Nanisivik andnorth to Devon Island and much of Ellesmere Island. Runoffcontinues to decrease west of Cornwallis Island. No reason-able estimate of Qavg could be made across the drier areas inthe western Archipelago. In total, reasonable predicted val-ues are available for 70% of the Archipelago. The total an-nual runoff (or freshwater flux) across this 895,000 km2
portion of the Archipelago was 211 mm or 189 km3.The key features in the extrapolated Qmax field (Fig. 4)
also include a lack of estimates north of 82�N and in glaci-ated catchments. The spatial variability of Qmax across theArchipelago as similar to that observed for Qavg. The largestvalues of Qmax are on southeastern Baffin Island but high val-ues also occur in the northern portions of the Archipelago on
Figure 4 Estimates of Qmax across the Archipelago from Eq. (8)regionalization exercise.
Devon, Ellesmere and Cornwallis Islands. The average pre-dicted mean annual maximum daily runoff is 13 mm. The va-lue approaches 30 mm in the wetter locales of southernBaffin Island where it represents 12% of the predicted meanannual freshwater flux.
Error analysis
Errors around the constructed estimates of Qavg variedamong the watersheds (Table 5). The best constructed dataare for the Allen and Marcil catchments, with percentageerrors of 6.2% and 6.8%, respectively. The confidence inter-vals around the estimates from these two catchments werenear the median value of 0.5. The estimates with the small-est confidence intervals were the three largest watersheds;the Hayes, Big and Sylvia Grinnell with confidence intervalsonly 8%, 19% and 8% of the estimate, respectively. Therewas found a significant (95%) relationship (r = 0.85) betweenthe confidence interval and basin area (Fig. 5). A similarcorrelation did not exist between percentage error, RMSEand watershed size.
. Contour lines denote variation in CI/qe associated with the

Table 5 Errors associated with the time series gap filling exercise
Watershed Qavg Qmax
E RMSE CI/qe E RMSE CI/qe
Allen 6.2 0.07 0.36 11.2 0.11 0.72Apex 25.9 0.32 4.9 33.7 0.47 4.7Big 39.3 0.59 0.19 42.2 0.59 0.13Duval 18.4 0.19 0.5 42.6 0.47 0.68Freshwater 24.1 0.31 0.53 25.6 0.28 0.64Hayes 153.3 2.1 0.08 263.7 3.6 0.09Marcil 6.8 0.08 0.59 12.6 0.15 1.04Mecham 13.4 0.16 1.1 25.1 0.25 2.7Snowbird n/a n/a n/a n/a n/a n/aSylvia Grinnell 10.4 0.11 0.08 17.6 0.21 0.08Tulugak 31.6 0.32 2.1 11.6 0.13 3.4
Average 32.9 0.43 0.99 48.6 0.63 1.41
E is percentage error, RMSE is root mean squared error and CI/qe is the ratio of the confidence interval to the estimate, all derived usingEqs. (4)–(6), respectively.
Figure 5 The negative relationship between basin area andconfidence intervals in the estimates.
256 C. Spence, A. Burke
The correlation between basin area and confidence inter-val was even higher for Qmax (r = 0.91) (Fig. 5). In general,error was higher for constructed Qmax than for Qavg (Table5). Average percentage error was 48.6%; RMSE 0.63. Theaverage confidence interval was larger in magnitude thanthe average estimate, with average CI/qe exceeding one.This value and the negative relationship between CI/qeand A imply it is very difficult to construct streamflow datafrom small Arctic Archipelago watersheds with confidence.
Regionalization errors in Qavg were comparable to thoseintroduced by the gap filling exercise, but confidence inter-vals were half the size, on average (Table 6). Regionaliza-tion errors in Qmax were also better than those created bygap filling. Overall, there were larger regionalization errorsassociated with Qmax (i.e., average RMSE = 1.01) than thosein Qavg (i.e., average RMSE = 0.52). No correlation could befound between any physio-climatic parameter and regional-ization error. However, there was a spatial trend towardshigher error in the western portions of the Archipelago(Figs. 3 and 4). This trend was amplified with Qmax becauseof low confidence in the estimates from the Big River.
Comparisons with independent estimates
Previous attempts to estimate Arctic Archipelago runoffhave been part of larger pan-Arctic scale studies and haveused either hydrological models or hydroclimatologicaldata. None of the hydroclimatological studies calculate run-off explicitly. Precipitation minus evapotranspiration(P � E) is calculated from either upscaled rawinsonde orreanalysis datasets. These can be, and have been, used assurrogates for runoff estimates under the assumption thatmany high Arctic basins have little year-to-year change instorage, so annual precipitation can drive the hydrologicalresponse (Kane and Yang, 2004). Using European Centrefor Medium Range Weather Forecasting (ECMWF) and theUnited States National Centers for Environmental Predictionand National Center for Atmospheric Research (NCEP-NCAR)reanalysis data, Cullather et al., 2000 estimate P � E for thepan-Arctic area north of 70�N. When computed using wind,moisture and surface pressure fields, P � E is 188 mm/yr.When applying reanalyzed forecast variables, P � E is122 mm/yr. These results compare well with those derivedfrom rawinsonde data. Using data from upper atmospheremonitoring sites in the vicinity of the Archipelago, Serrezeet al. (1995) and Overland and Turet (1994) estimate P � Eto be 163 mm/yr between 1974 and 1991 and 214 mm/yr be-tween 1965 and 1990, respectively. Similar to the resultspresented here, all these hydroclimatological and modelingstudies imply the highest runoff is from southern Baffin Is-land, but the spatial pattern in the western Archipelago isnot well defined.
Hydrological models run over the pan-Arctic domain areforced with this type of modeled or gridded climate dataand have not necessarily been successful. Kattsov et al.(2007) discuss the importance of applying hydrological mod-els that incorporate important physical processes for pre-dictive success. To this end, Rawlins et al. (2003) applieda hydrological model with a variable active layer. Their re-sults imply values of 300–400 mm/yr from southern BaffinIsland. Average values for the Archipelago are 40 mm/yr;only a seventh of that predicted by the current study. Young

Table 6 Errors associated with regional extrapolation
Watershed Qavg Qmax
E RMSE CI/qe E RMSE CI/qe
Allen 10.4 0.01 0.27 1.5 0.0002 0.25Apex 8.8 0.008 0.28 49.2 0.24 1.43Big 86.8 0.75 11.5 59.0 0.35 3.9Duval 50.5 0.26 0.15 4.5 0.002 0.67Freshwater 100.2 1.0 0.48 312.6 9.76 0.81Hayes 18.2 0.03 0.32 31 0.1 0.6Marcil 0.45 0.00002 0.75 37.6 0.14 1.6Mecham 65.1 0.42 0.29 26.7 0.07 0.3Snowbird 68.2 0.47 1.5 16.3 0.03 1.2Sylvia Grinnell 0.9 0.00008 0.27 61.6 0.38 0.5Tulugak 19.9 0.04 0.27 35.2 0.12 0.4
Average 39.1 0.52 0.46 57.8 1.01 1.07
E is percentage error, RMSE is root mean squared error and CI/qe is the ratio of the confidence interval to the estimate, all derived usingEqs. (4)–(6), respectively.
Estimates of Canadian Arctic Archipelago runoff from observed hydrometric data 257
and Woo (2004a) suggest from their experience that thesehydrological model applications remain flawed by the pau-city of observed data; especially precipitation.
Observed runoff during small scale hydrological processstudies on Cornwallis and Ellesmere Islands compare wellwith Qavg and Qmax results. Woo et al. (1983) documenteda mean annual runoff of 158 mm from the McMaster RiverBasin near Resolute between 1976 and 1981. Eq. (7) esti-mates the value to be 188 mm. At Hot Weather Creek onEllesmere Island, Woo and Young (1997) measured a meanannual runoff of 56 mm between 1989 and 1991. This toocompares well against a value of 60 mm from Eq. (7). Whilethese results apply three different periods, they could besomewhat comparable because Kattsov et al. (2007) suggestthere has been no change in mean annual runoff from theArchipelago between 1980 and 1999. Estimates of Qmax arecomparable to observed data from catchment studies. Re-sults imply that Qmax averages 8% of mean annual runoff,and observations suggest this is common (Woo et al.,1983). Estimates of Qmax near Resolute range from 13–22 mm and Woo et al. (1983) measured values from 16 to31 mm.
Abdalati et al. (2004) utilised regional relationships be-tween elevation and elevation change to determine thatthe 1995–2000 glacier mass balance for the Canadian ArcticIslands is approximately �25 km3/yr of ice. Assuming a sim-ilar decay rate from 1972 to 1994, there would be an addi-tional 25 km3 of runoff over and above the 189 km3 thisstudy suggests flows from 70% of the Archipelago each year.The total value of 214 km3/yr or 201 mm suggests compara-ble runoff per square kilometer to the Mackenzie River Basin(Rouse, 2000).
The outputs from Eqs. (7) and (8) are reasonable andcomparable with the results from previous modeling, clima-tological or process studies. The error analysis detailed inthis study implies there remains a great deal of uncertaintyaround any estimate of extrapolated runoff from the Archi-pelago. This is reflected particularly in the areas in the wes-tern Archipelago for which no reasonable Qavg could bedetermined.
Impacts of uncertainty
The results of this study demonstrated how a lack ofeffective monitoring effectively reduces our ability to esti-mate the variability of runoff (Shiklomanov et al., 2002).Only the most rudimentary of streamflow characteristicscould be estimated. Runoff at finer time scales than annualcould not be estimated. The Qmax estimates support hydro-logical process studies that have demonstrated that much ofthe catchment freshwater flux in the Archipelago occursover short periods during the year. The available data donot permit methods such as those applied here to resolvethe temporal signature of this annual spring pulse. Becauseof the uncertainty around the estimates, defining the vari-ability in Qavg or Qmax becomes very difficult. Trend resultssuch as those reported by Kattsov et al. (2007) are put intocontext when confidence intervals around estimates are farlarger than any detectable trends. Policy makers across theglobe would like to know if the freshwater flux into the Arc-tic Ocean is changing because of its implications for oceanthermohaline circulation. However, in places such as theCanadian Arctic Archipelago, the results presented here im-ply our community cannot reliably answer that question.
To compound the problem, the results from this studyonly apply to the period between 1972 and 1994. This studycould not investigate more recent years because the onlyremaining Water Survey gauge publishing data from theArchipelago was on Freshwater Creek. There were docu-mented changes to the hydrology of small scale featuresin the region in the 1990s (Antoniades et al., 2005b; Wooand Young, 2006; Marsh et al., 2005). Unfortunately, the re-gional data do not exist between 1994 and today to deter-mine if these changes have resulted in large scale impactsacross the region.
Efforts are being made to improve the situation. Develop-ment initiatives by the Qulliq Energy Corporation and miningcompanies on Baffin Island have allowed theWSC to open sev-eral stations there. TheWater Survey of Canada reopened theMecham and Big River gauges in 2007 using funding from theInternational Polar Year. Discussions on how to maintain

258 C. Spence, A. Burke
these stations once funding from IPY ceases have already be-gun. Monitoring and research frameworks are being devel-oped (i.e., Prowse et al., 2005) with international planningprograms such as the Arctic Hydrological Cycle Monitoring,Modelling and Assessment Program (ARCTIC-Hydra) (Snorra-son et al., 2006) and concepts such as a Sustainable ArcticObservation Network (http://www.arcticobserving.org).
Conclusions
The goal of the research documented in this paper was toestimate components of the streamflow regime of the Arc-tic Archipelago using observed hydrometric data. Initially,annual daily minimums, means and maximums were to beestimated. The records at eleven Water Survey of Canadahydrometric gauges across the Arctic Archipelago show thatall the streams in the region experience zero flow each win-ter. Means and maximums could only be calculated once a1972–1994 dataset was constructed from the scarce datarecord. Daily means could only be calculated for the Mayto October period because of the seasonal operation of mostof the hydrometric gauges. This period, however, occupiesthe vast majority of the active streamflow period in theArchipelago. Results suggest that annual May to Octoberrunoff averages 211 mm or 189 km3 from those areas forwhich reasonable estimates could be made. Maximum an-nual daily streamflow can be as much as 12% of this May–October flux, but averages 8%. There is less confidence inthe mean maximum annual daily runoff estimates thanmean May–October flow, as the former had much highergap filling and regionalization errors. Analytical error washigh throughout the study. Average confidence intervalsaround constructed data average ±123% of the estimates.Regionalization confidence intervals of mean and maximumrunoff are ±46% and ±107% of the estimate, respectively.There is no spatial pattern to the dataset construction er-rors, but regionalization error tended to be higher in thewestern portion of the Archipelago and either suites and er-ror was larger in smaller basins.
The results compared well against independent esti-mates from previous modeling, hydroclimatological andsmall basin measurements, but the degree of error impliesthat predicting the state and dynamics of the freshwaterflux from the Arctic Archipelago is difficult and problematic.Shifts in the hydrological regime are likely with the environ-mental changes expected in this region, but at presentthese shifts will be very hard to detect because current pre-dictive uncertainty is much too high. Targets for quantita-tive reductions in uncertainty should be defined with inputfrom northern residents, scientists and water managers.Planning exercises are underway, but targets need to beset, the issue given priority, and resources directed to it.The time is right to build upon the momentum generatedby the International Polar Year and build a sustainable,effective and efficient high arctic freshwater monitoringand research program.
Acknowledgements
Funding for this project was provided by the InternationalPolar Year. The authors wish to thank Heather Haywood
and Jordan Erker for assistance with the GIS analysis. Dis-cussion with Mike Demuth, Al Pietroniro and Terry Prowseaided the direction of this research.
References
Abdalati, W., Krabill, W., Frederick, E., Manizade, S., Martin, C.,Sonntag, J., Swift, R., Thomas, R., Yungel, J., Koerner, R.,2004. Elevation changes of ice caps in the Canadian ArcticArchipelago. Journal of Geophysical Research 109, F04007.doi:10.1029/2003JF000045.
ACIA, 2005. The Arctic Climate Impact Assessment. CambridgeUniversity Press, 1020 pp.
Antoniades, D., Douglas, M.S.V., Smol, J.P., 2005. Quantitativeestimates of recent environmental changes in the Canadian HighArctic inferred from diatoms in lake and pond sediments.Journal of Paleolimnology 33, 349–360.
Bowling, L.C., Lettenmaier, D.P., Matheussen, B.V., 2000. Hydro-climatology of the Arctic drainage basin. In: Lewis, E.L., Jones,E.P., Lemke, P., Prowse, T.D., Wadhams, P. (Eds.), TheFreshwater Budget of the Arctic Ocean. Kluwer Academic, pp.57–90.
Burgess, D.O., Sharp, M.J., Mair, D.W.F., Dowdeswell, J.A.,Benham, T.J., 2005. Flow dynamics and iceberg calving ratesof Devon Ice Cap, Nunavut, Canada. Journal of Glaciology 51(173).
Carmack, E.C., 2000. The Arctic Ocean’s freshwater budget:sources, storage and export. In: Lewis, E.L., Jones, E.P., Lemke,P., Prowse, T.D., Wadhams, P. (Eds.), The Freshwater Budget ofthe Arctic Ocean. Kluwer Academic, pp. 91–126.
Church, M., 1974. Hydrology and permafrost with reference toNorth America. In: Proceedings of Workshop Seminar 1974,Permafrost Hydrology. Canadian National Committee for theInternational Hydrological Decade, Ottawa, pp. 7–20.
Cihlar, J., Beaubien, J., Latifovic, R., 2002. Land Cover of Canada1998. Special Publication, NBIOME Project. Produced by theCanada Centre for Remote Sensing and the Canadian ForestService, Natural Resources Canada. Available from the CanadaCentre for Remote Sensing, Ottawa, Ontario.
Cullather, R.I., Bromwich, D.H., Serreze, M.C., 2000. The Atmo-spheric hydrologic cycle over the Arctic Basin with reanalyses.Part 1. Comparison with observations and previous studies.Journal of Climate 13, 923–937.
Department of Energy, Mines and Resources, 1993. The NationalAtlas of Canada, fifth Edition. Streamflow, Map MCR4178.
Dowdeswell, J.A., Benham, T.J., Gorman, M.R., Burgess, D., Sharp,M.J., 2003. Form and flow of the Devon Island Ice Cap, CanadianArctic. Journal of Geophysical Research 109. doi:10.1029/2003JF000095, F02002.
Ecological Stratification Working Group, 1996. A National EcologicalFramework for Canada. Agriculture and Agri-Food Canada,Research Branch, Centre for Land and Biological ResourcesResearch and Environment Canada, State of Environment Direc-torate, Ottawa/Hull. 125 pp.
Goodison, B.E., 1978. Accuracy of Canadian snow gauge measure-ments. Journal of Applied Meteorology 17, 1541–1548.
Grabs, W.E., Portmann, F., de Couet, T., 2000. Discharge obser-vations networks in Arctic regions: computation of the riverrunoff into the Arctic Ocean, its seasonality and variability. In:Lewis, E.L., Jones, E.P., Lemke, P., Prowse, T.D., Wadhams, P.(Eds.), The Freshwater Budget of the Arctic Ocean. KluwerAcademic, pp. 249–268.
Hirsch, R.M., Helsel, D.R., Cohn, T.A., Gilroy, E.J., 1993. Statisticalanalysis of hydrologic data. In: Maidment, D.R. (Ed.), Handbookof Hydrology. Elsevier, Berlin, pp. 17.1–17.55.
Kane, D.L., Yang, D., 2004. Overview of water balance determina-tions for high latitude watersheds. In: Kane, D.L., Yang, D.

Estimates of Canadian Arctic Archipelago runoff from observed hydrometric data 259
(Eds.), Northern Research Basins Water Balance, AHS Publication290. IAHS, pp. 1–13.
Kattsov, V.M., Walsh, J.E., Chapman, W.L., Govorkova, V.A.,Pavlova, T.V., Zhang, X., 2007. Simulation and projection ofArctic freshwater budget components by the IPCC AR4 globalclimate models. Journal of Hydrometeorology 8, 571–589.
Koerner, R.M., 2005. Mass balance of glaciers in the QueenElizabeth Islands, Nunavut Canada. In: The International Sym-posium on Arctic Glaciology, Geilo, Norway, 23–27 August 2004.Annals of Glaciology 42, 417–423.
Lammers, R.B., Shiklomanov, A.I., Vorosmarty, C.J., Fekete, B.M.,Peterson, B.J., 2001. Assessment of contemporary Arctic riverrunoff based on observational discharge records. Journal ofGeophysical Research 106 (D4), 3321–3334.
Louie, P.Y.T., Hogg, W.D., Mackay, M.D., Zhang, X., Hopkinson,R.F., 2002. The water balance climatology of the MackenzieBasin with reference to the 1994/95 water year. AtmosphereOcean 40, 159–180.
Mair, D., Burgess, D., Sharp, M., 2003. Thirty-seven year massbalance of Devon Ice Cap, Nunavut, Canada, determined byshallow ice coring and melt modeling. Journal of GeophysicalResearch 110, F01011. doi:10.1029/2003JF000099.
Marsh, P., Woo, M.K., 1984. Wetting front advance and freezing ofmeltwater within a snow cover. 1. Observations in the CanadianArctic. Water Resources Research 16, 853–864.
Marsh, P., Russell, M., Onclin, C., 2005. The hydrology of lakes inthe Western Canadian Arctic – implications to proposed naturalgas development. In: Samadeni-Davies, A., Bengtsson, L.,Westerstrom, G.,(Eds.), Proceedings of the Northern ResearchBasins 15th International Symposium and Workshop, Lulea,Sweden, August 29–September 2, 2005, pp. 131–140.
Mekis, E., Hogg, W.D., 1999. Rehabilitation and analysis of Canadiandaily precipitation time series. Atmosphere Ocean 37, 53–85.
Metcalfe, J.R., Ishida, S., Goodison, B.E., 1994. A correctedprecipitation archive for the Northwest Territories, In: Proceed-ings of the 6th Biennial Meeting on Northern Climate and MidStudy Workshop of the MBIS. Cohen, S. (Ed.), Mackenzie BasinImpact Study, Interim Report #2. Yellowknife, NWT, April 10–14, 1994, pp. 110–117.
Natural Resources Canada, 1999. Canadian Digital Elevation Data:Standards and Specifications, 13 pp.
Ouarda, T.B.M.J., Hache, M., Bruneau, P., Bobee, B., 2000. Regionalflood peak and volume estimation in a Northern Canadian Basin.ASCE, Journal of Cold Regions Engineering 14 (4), 176–191.
Overland, J.E., Turet, P., 1994. Variability of the atmosphericenergy flux across 70�N computed from the GFDL data set. ThePolar Oceans and Their Role in Shaping the Global Environ-mentThe Nansen Centennial Volume, Geophysics Monograph No.85. AGU, 313–325.
Prowse, T.D., Flegg, P.O., 2000. Arctic river flow: a review ofcontributing areas. In: Lewis, E.L., Jones, E.P., Lemke, P.,Prowse, T.D., Wadhams, P. (Eds.), The Freshwater Budget of theArctic Ocean. Kluwer Academic, pp. 269–280.
Prowse, T.D., Boggild, C.E., Glazovsky, A.F., Hagen, J.O.M.,Hinzman, L.D., Killingtveit, A.,Lettenmaier, D.P., Nelson, F.E.,Rouse, W.R.,Steffen, K.,Shiklomanov, I.A., Young, K.L., Kotlya-kov, V.M., 2005. ICARPII Science plan chapter 7: Terrestrialcryospheric and hydrological processes and systems. In: SecondInternational Conference on Arctic Research Planning (ICARP II),Copenhagen, Denmark, November 2005.
Rawlins, M.A., Lammers, R.B., Frolking, S., Fekete, B.M., Voro-smarty, C.J., 2003. Simulating pan-Arctic runoff with a macroscale terrestrial water balance model. Hydrological Processes17, 2521–2539.
Ribeiro-Correa, B., Cavadias, G.S., Clement, B., Rousselle, J.,1995. Identification of hydrological neighbourhoods using canon-ical correlation analysis. Journal of Hydrology 173, 71–89.
Rouse, W.R., 2000. Progress in hydrological research in theMackenzie GEWEX study. Hydrological Processes 14, 1667–1685.
Serreze, M.C., Barry, R.G., Walsh, J.E., 1995. Atmosphericwater vapor characteristics at 70�N. Journal of Climate 8,159–207.
Shiklomanov, A.I., Lammers, R.B., Vorosmarty, C.J., 2002. Wide-spread decline in hydrological monitoring threatens pan-Arcticresearch. EOS Transactions 83, 13–16.
Short, N.H., Gray, A.L., 2005. Glacier dynamics in the CanadianHigh Arctic from RADARSAT-1 speckle tracking. Can. J. Rem.Sens. 31 (3), 225–239.
Snorrason, A., Vorosmarty, C.J., Pundsack, J., 2006. Arctic-HYDRA:Integrated Water Cycel Observations and Science for theInternational Polar Year. Presentation at the AGU Fall Meeting,San Francisco
Spence, C., Saso, P., 2005. A hydrological neighbourhood approachto predicting streamflow in the Mackenzie Valley. In: Spence, C.,Pomeroy, J.W., Pietroniro, A. (Eds.), Prediction in UngaugedBasins: Approaches for Canada’s Cold Regions. Canadian WaterResources Association, pp. 21–44.
Spence, C., Saso, P., Rausch, J., 2007. Quantifying the impact ofhydrometric network reductions on regional streamflow predic-tion in northern Canada. Canadian Water Resources Journal 32,1–20.
Woo, M.K., Young, K.L., 2006. High Arctic wetlands: their occur-rence, hydrological characteristics and sustainability. Journal ofHydrology 320, 432–450.
Woo, M.K., Sauriol, J., 1980. Channel development in snow filledvalleys, Resolute, NWT, Canada. Geograifska Annaler 62A, 37–56.
Woo, M.K., Young, K.L., 1997. Hydrology of a small drainage basinwith polar oases environment, Fosheim Peninsula, EllesmereIsland, Canada. Permafrost and Perglacial Processes 8, 257–277.
Woo, M.K., Steer, P., 1983. Slope hydrology as influenced bythawing of the active layer, Resolute, NWT. Canadian Journal ofEarth Sciences 20, 978–986.
Woo, M.K., 1993. Northern hydrology. In: French, H.M., Slaymaker,O. (Eds.), Canada’s Cold Environments. McGill Queen’s Univer-sity Press, pp. 117–142.
Woo, M.K., Marsh, P., Steer, P., 1983. Basin water balance in acontinuous permafrost environment. In: Fourth InternationalPermafrost Conference. National Academy Press, Washington,pp. 1407–1411.
Woo, M.K., Heron, R., Steer, P., 1981. Catchment hydrology of ahigh arctic lake. Cold Regions Science and Technology 5, 29–41.
Young, K.L., Woo, M.K., 2004a. Queen Elizabeth Islands: problemsassociated with water balance research. In: Kane, D.L., Yang, D.(Eds.), Northern Research Basins Water Balance, IAHS Publica-tion 290. IAHS, pp. 237–248.
Young, K.L., Woo, M.K., 2004b. Queen Elizabeth Islands: waterbalance investigations. In: Kane, D.L., Yang, D. (Eds.), NorthernResearch Basins Water Balance, IAHS Publication 290. IAHS, pp.152–163.
Young, K.L., Woo, M.K., Edlund, S.A., 1997. Influence of localtopography, soils and vegetation on microlimate and hydrologyat a high arctic site, Ellesmere Island, Canada. Arctic and AlpineResearch 29, 270–284.
Zhang, X.E., Vincent, L.A., Hogg, W.D., Niitsoo, A., 2000. Temper-ature and precipitation trends in Canada during the 20thcentury. Atmosphere Ocean 38, 395–429.