estimating vat pass through - international monetary fund · pdf fileseptember 2015 abstract...
TRANSCRIPT

WP/15/214
IMF Working Papers describe research in progress by the author(s) and are published to elicit comments and to encourage debate. The views expressed in IMF Working Papers are those of the author(s) and do not necessarily represent the views of the IMF, its Executive Board, or IMF management.
Estimating VAT Pass Through
by Dora Benedek, Ruud De Mooij, Michael Keen and Philippe Wingender

2
© 2015 International Monetary Fund WP/15/214
IMF Working Paper
Fiscal Affairs Department
Estimating VAT Pass Through
Prepared by Dora Benedek, Ruud De Mooij, Michael Keen and Philippe Wingender1
Authorized for distribution by Michael Keen
September 2015
Abstract
This paper estimates the pass through of VAT changes to consumer prices, using a unique dataset providing disaggregated, monthly data on prices and VAT rates for 17 Eurozone countries over 1999-2013. Pass through is much less than full on average, and differs markedly across types of VAT change. For changes in the standard rate, for instance, final pass through is about 100 percent; for reduced rates it is significantly less, at around 30 percent; and for reclassifications it is essentially zero. We also find: differing dynamics of pass through for durables and non-durables; no significant difference in pass through between rate increases and decreases; signs of non-monotonicity in the relationship between pass through and the breadth of the consumption base affected; and indications of significant anticipation effects together with some evidence of lagged effects in the two years around reform. The results are robust against endogeneity and attenuation bias.
JEL Classification Numbers: E31, H22, H25
Keywords: Value added tax; Tax incidence; Price effect; Pass through; Europe. Authors’ E-Mail Addresses: [email protected]; [email protected]; [email protected]; [email protected]
1 We thank seminar participants in the Indirect Taxation International Workshop in Paris, the European Commission DG TAXUD, the IMF Fiscal Affairs Department, the OECD and Sciences Po. We are also grateful to Rabah Arezki, Alessandro Giustiniani, Thomas Hemmelgarn, Arne Kubitza, Constant Lonkeng, Gaëtan Nicodème, Victoria Perry, Grégoire Rota-Graziosi, Juan Toro, Christophe Waerzeggers and Irene Yackovlev for constructive comments and suggestions. We have also benefited from the expertise of Christiane Lytridis and Donato Raponi on VAT-related issues. Kelsey Moser provided excellent research assistance. All errors remain our own.
IMF Working Papers describe research in progress by the author(s) and are published to elicit comments and to encourage debate. The views expressed in IMF Working Papers are those of the author(s) and do not necessarily represent the views of the IMF, its Executive Board, or IMF management.

3
Contents Page
Abstract .......................................................................................................................................................... 2
I. Introduction .............................................................................................................................................. 5
II. Methodology .......................................................................................................................................... 7A. Theory ......................................................................................................................................... 7 B. Empirical Model ..................................................................................................................... 10 C. Data and Estimation ............................................................................................................ 11
III. Results .................................................................................................................................................... 13A. Average VAT Pass Through .............................................................................................. 14 B. Pass Through by Type of VAT Change ......................................................................... 17 C. Pass Through and Durable Consumption................................................................... 20 D. Pass Through and Scope of VAT Reform ................................................................... 21 E. Asymmetric Responses? Pass Through for Rate Increases and Decreases ... 24
IV. Robustness ........................................................................................................................................... 25A. Measurement Error .............................................................................................................. 25 B. Endogeneity ............................................................................................................................ 28
V. Conclusion ............................................................................................................................................. 30
References .................................................................................................................................................. 32
Tables Table 1: Summary Statistics ................................................................................................................. 13 Table 2: Consumer Price Elasticities ................................................................................................. 14 Table 3: Regression Results of Pass Through by Type of VAT Rate Change ................... 18 Table 4: Pass Through for VAT Increases and Decreases ........................................................ 25 Table 5: Pass Through by Type of VAT Rate Change – OLS Estimates .............................. 27 Table 6: Pass Through by Type of VAT Rate Change – IV Estimates .................................. 28 Table 7: Pass Through During Fiscal Consolidation Episodes ............................................... 30 Table A1. Country List and VAT Reforms ....................................................................................... 34 Table A2. Consumption Categories .................................................................................................. 35
Figures Figure 1: Elasticity of Price Responses in Two-Year Interval around the VAT Change 16

4
Figure 2: Cumulative Pass Through by Type of VAT Rate Change ...................................... 18 Figure 3: Cumulative Pass Through for Durables versus Non-Durables ........................... 21 Figure 4: Number of VAT Rate Changes by Type of Reform and Total Consumption Share Targeted ......................................................................................................................................... 22 Figure 5: Pass Through by Share of Consumption Affected .................................................. 23 Figure A1. Comparison of VAT Changes by Source .................................................................. 39
Appendices Appendix A: Constructing HICP-CT-based VAT Rate Changes ............................................. 40 Appendix B: The Elasticity of Substitution and Derivation of Equation (5) ...................... 41
5
I. INTRODUCTION
It is almost universally assumed in practical policy making, and in distributional analyses, that indirect tax changes are fully and exactly passed through to consumer prices: see, for instance the review in Bird and Gendron (2007) and, as typical examples the annual publication for the U.K. of the Office of National Statistics on the Effects of Taxes and Benefits on Household Income Central Statistical Office, and Lustig et al. (2013). Theory, of course, makes clear that this need not be so, and indeed that almost anything is possible: pass through may be less than complete (‘undershifting’), as the standard partial equilibrium analysis of competitive markets allows; more than complete (‘overshifting’), as, in some circumstances, under imperfect competition and/or with endogenous product quality2; it is even possible that the tax-inclusive prices of the taxed good will fall (the Edgeworth paradox).3 It is standard too to assume that pass through occurs contemporaneously with the tax change. But again theory raises many other possibilities: substitution effects may give rise to price movements in anticipation of VAT changes, and/or menu costs may mean response is sluggish.4
The extent and timing of VAT pass through thus become empirical issues—which remain unresolved. Empirical studies report a variety of results, often finding evidence of less than full pass through,5 though some find evidence for full pass through or overshifting.6 Instructive and careful as many of these studies are, their generalizability to address some of the most pressing policy and analytical issues is limited. Many of the most careful studies focus on the effects of changes in the tax treatment of a narrow set of items, such as hair dressing services, housing repairs, new cars, sugary drinks or restaurant meals, using as controls the prices of other items consumed domestically. The choice of ‘similar’ items as controls raises some identification issues, dicussed below. More directly to the point, however, these results cannot speak to what is often the most contentious and highly charged policy concern of changing the standard rate of VAT (that applied to the broadest range of commodities). This has been brought even more to the fore by the post-crisis needs that many countries have for fiscal consolidation,
2 See for example Stern (1987), Delipalla and Keen (1992) and Weyl and Fabinger (2013).
3 On which see, for instance, Vickrey (1960).
4 Kleven and Kreiner (2003). 5 As, for instance, in Carbonnier (2007) and Trannoy (2011) for various VAT reforms in France, Smart (2011) for Canada, Chirakijja et al. (2009) and Crossley et al. (2014) for the UK, Carare and Danninger (2008) for Germany, Batista Politi and Mattos (2011) for Brazil and Kosonen (2013) for Finland.
6 Such as, respectively, Poterba (1996) and Besley and Rosen (1999), both for the U.S.

6
the VAT being a prime candidate when significant sums are needed.7 Yet there is to our knowledge, no empirical evidence of the core incidence question that then arises: How much of an increase in the standard rate of VAT is likely to be passed through to consumer prices? The aim of this paper is to cast new light on these and other fundamental issues in VAT pass through by exploiting a unique, large panel dataset on VAT reforms in the Eurozone between 1999 and 2013, providing monthly price and tax data for 67 consumption items, and covering 1,231 VAT changes. Methodologically, our approach—which is to estimate a reduced form relationship between changes in consumer prices and in applicable VAT rates—follows Poterba (1996) and Besley and Rosen (1999), who look at city-level sales taxes in the United States. Our central contribution thus lies in the use of a large, rich dataset of VAT reforms that enables the identification of the pass through associated with a wide variety of reforms to what is, in Europe as in much of the rest of the world, by far the most important form of indirect taxation. There are, more specifically, three main attractions to the empirical approach pursued here. First, most existing studies on VAT reform use data from a single country, generally consider only one or a small number of tax changes affecting a narrow set of commodities, and use prices of goods and services in the domestic market that are not directly affected by the VAT change as controls to identify pass through effects. But, as spelled out below, this characterization of counterfactual prices is problematic if there are cross-price effects between taxed and untaxed items (a difficulty when, as is often the case, closest related items are chosen as controls). The approach pursued here avoids this bias by exploiting pooled data from 17 integrated economies (sharing a common currency) to provide a more credible counterfactual for the evolution of the prices that are not directly affected by VAT reforms. In effect, we thus take as controls the same commodity but in countries other than that in which the tax change occurs.8 Second, the large number and diversity of reform episodes in the dataset enables us to explore variations in pass through across different types of VAT reform. We look, for instance, not only at the central question of the pass through of standard changes, but also that of changes in reduced VAT rates and of reclassifications (the movement of some item between rate categories).9 We also test for heterogeneity in pass through depending on the scope of the VAT reform (that is, on the share of consumption affected by a VAT rate change) and for asymmetries in pass through between VAT rate increases and decreases. The large, monthly data set also 7 Between 2007 and 2013, for example, 15 EU countries increased their standard rate of VAT.
8 VAT is levied on a destination basis, meaning the tax changes apply only to domestic purchases: a VAT change in Finland, for instance, does not apply to purchases in Denmark or Spain. Cross effects might occur through cross-border shopping. But the cases in which this is seen as a significant problem are few, and mostly relate to excises (cigarettes and the like) that are beyond the scope of this paper.
9 Since there are no VAT rates higher than standard in the dataset, these three are the only possible types of VAT rate change.

7
provides enough statistical power and granularity to explore the dynamics of each type of VAT reform, allowing for both anticipation effects and sluggish response, including, for instance, the potentially quite different dynamics as between durable and non-durable items. These timing issues have received some empirical attention (Carare and Danninger (2008), for instance, on the German VAT reform of 2007), but, again, only for specific and often quite narrow episodes. Finally, the robustness of our results can be assessed with respect to two other possible sources of bias: measurement error and endogeneity. Neither of these has been tested in previous incidence studies. The paper is organized as follows. Section II provides a theoretical framework, sets out our methodology and describes the data. The main empirical results are in Section III, exploring a variety of aspects of VAT reforms, including their dynamics. After assessing typical effects over all VAT reforms, we focus in turn on a variety of more detailed aspects of reform: potential differences between changes in standard rates, reduced rates, and reclassifications; across goods of different durability; the breadth of the base to which changes apply; and possible asymmetries between rate increases and decreases. Section IV addresses the robustness, and Section V concludes.
II. METHODOLOGY
A. Theory
For a (possibly composite) commodity i with consumer price , and producer price ,subject to a tax specified—as most VATs are—at an ad valorem tax-exclusive rate (so that 1
, by degree of ‘pass through’ to the consumer is meant the proportionate response of the consumer price to an increase in the tax factor 1 :
≡Δ /
Δ / 1, 1
Full pass through, with no change in the producer price, and hence Δ Δ Δ / 1,thus corresponds to 1; and zero pass through to 0.
The degree of pass through is likely to depend of course, on the goods being taxed, with a key distinction for the empirics below that between broad-based and narrow increases in VAT rates. Suppose then that there are just two commodities, with aggregate demands10 , and in competitive supply , , with tax levied only on good 1. In the textbook partial equilibrium
10 These are uncompensated demands. Parallel expressions to those that follow expressed in terms of compensated demands may be more appropriate for VAT changes that are part of a broader and roughly revenue-neutral reform. We do not distinguish between the two representations when interpreting our empirical results.

8
setting, with the consumer and producer prices of good 2 assumed unaffected, perturbing the market clearing condition , 1 , gives the familiar formula:
, 2
where denotes the own-price elasticity of supply of commodity i and ≡ ln / ln (minus) its own price elasticity of demand. But for changes in standard rates of VAT, often affecting half or more of all consumer spending, general equilibrium effects cannot be ignored. Allowing for these (by now perturbing the system comprising market clearing for both goods; and assuming, for simplicity, independent supplies) gives
, 3
where ≡ ln / ln , for denotes the (uncompensated) cross-price elasticity. Pass through now reflects not only movement along the demand curve for the taxed good but also movements of that demand curve, induced by changes in the relative prices of the two goods. Strikingly, so long as and are of the same sign, then, whatever that sign is, the degree of pass through is unambiguously higher than the usual partial equilibrium formula would suggest.11 Intuitively, this is because the induced response in the price of the untaxed good, which is given by an analogous pass through coefficient
, 4
always acts to shift outwards the demand for the taxed good. If, for instance, the two are gross substitutes (so that 0) then 0 and the consumer price of good 2 rises; which, so long as is also positive, increases the demand for good 1. If on the other hand the goods are complements (so 0 , then the price of good 2 falls, but this again increases the demand for 1. Equation (4) has important implications for empirical work. It means, not least, that a comparison of the evolution of prices between those goods directly affected by a VAT reform and those of other goods in the consumption basket will not in general yield an unbiased estimate of the pass through on the price of taxed goods. Indeed, individual-country studies that use the prices of untaxed goods as controls in the identification of tax-incidence effects produce an estimate of
, not of . This implies an underestimate of pass through if goods are substitutes and an
11 Equation (3) opens the possibilities, which the partial equilibrium perspective in (2) obscures, of over-shifting or (as in the Edgeworth paradox) of consumer prices falling in response to tax increases even in competitive markets. We leave these aside in this discussion, and assume the denominator in (3) to be strictly positive

9
overestimate if they are complements. This may be less of an issue for tax changes affecting only goods that are a relatively minor part of consumer expenditure—but it is the pass through of changes affecting the bulk of items that is often of much more policy interest. Equation (3) also casts light on how pass through may depend on the breath of the base to which a tax change applies. Appendix B shows that it can be rewritten very simply as
σ1
1, 5
where 0denotes the elasticity of substitution between the two goods, the income elasticity of the taxed good and its budget share. The forces shaping pass through that this implies are complex. Greater ease of substitution between the two goods, for instance, tends to reduce pass through by its effect on the first term in (5); this is a simple intuition based on the standard formula (2), and the thought that higher substitution means more elastic demand. But there is also an effect through the bracketed term in (5), by which route an increase in the elasticity of substitution tends to increase pass through, this being the consequence of the general equilibrium effect discussed after (3): closer substitution means a greater impact on the price of the alternative good 2, which reinforces the increase in the price of the taxed good 1. The direction of the effect of the elasticity of substitution on the extent of pass though is, as a consequence, ambiguous. Similarly opposing effects also shape the impact of the supply elasticity. Intuition might suggest that pass through will be greater the wider the base to which the tax change applies; equation (5) shows that this will indeed be so if, for example, preferences are homothetic CES with 1. But this is not assured in general. A large budget share may be associated with fewer substitution possibilities, for instance, with the ambiguous effect on pass through just noted. The scope of VAT changes might also be systematically associated with different types of commodities: reduced rates, for example, usually not only apply to smaller consumption shares but to basic commodities such as food items which tend to have lower income elasticities, and on that account higher pass through. Importantly, the simple intuition that the extent of pass through should be monotonically increasing in the budget share of the taxed goods can thus prove false: some warning of this comes from the observation that, in terms of relative prices, an increase in the tax applied to a large volume of consumption is equivalent to a cut in that applied to a small volume of production.12 This potential non-monotonicity will emerge as having some practical significance.
12 An example may also help. Suppose that the elasticity of substitution between any two subsets of commodities is unity. Then the term in (5) is zero if the budget share of the taxed (composite) good is either zero or unity (in the latter case, because the income elasticity is then also unity); but in intermediate cases it is strictly greater than zero if the income elasticity of demand for the taxed composite is less than unity.
10
All this assumes competitive markets. There is now a large literature (recently unified and extended by Weyl and Fabinger (2013)) on the determinants of, and range of possibilities for, pass through, including over-shifting, under various forms of imperfect competition and product variation. Pass through then depends critically not only on simple elasticities of the kind above, but on curvatures of demand as well as market behavior and conditions. These considerations may shape the pass through that we report below, though we do not have data enabling us to relate this to aspects of market structure. The dynamics of adjustment to tax changes may also be complex. Demand and supply may of course become more responsive over time, but more subtle effects can also be at work. Price changes might not occur instantaneously at the moment of a VAT change, but before or after. In the presence of menu costs, for example, price responses to an unanticipated tax rate change will occur with a lag. And if consumers anticipate a future VAT change, perhaps because the government has pre-announced it, they may either postpone expenditures (in case of a reduction in VAT) or bring them forward (in case of a VAT increase); and firms may respond to this change in demand by adjusting their pricing before the VAT is actually changed, implying possible lead effects. These potential timing effects are considered closely below.
B. Empirical Model
Following Poterba (1996) and Besley and Rosen (1999), we focus on a reduced-form relationship between changes in consumer prices and in VAT rates that can be interpreted as a linearization of any structural model.13 More precisely, we estimate the following empirical model of monthly log changes of the consumer price index
∆ ∆ 1 6
for consumption category i in country c and month t. The coefficient thus measures the impact on the consumer price at time t of a VAT change in month t+j, with ∈ 12, 12 . Equation (6) describes the full dynamic adjustment over a two-year time horizon centered around the month of the actual VAT change.14 The sum of all ′ over this two year window thus gives the long run consumer price response to a change in the VAT rate , and so is interpreted as the pass through elasticity in equation (1).
13 It is not possible from this reduced-form to distinguish between different models of supply, since perfect and imperfect competition predict overlapping ranges of price response. Nor can the underlying supply and demand elasticities be separately identified without imposing further restrictions.
14 Regressions with lead and lags each up to 24 months suggest no significant effects outside this window.
11
The vector includes control variables meant to capture monthly variation in prices unrelated to VAT reforms. To account for current macroeconomic conditions unrelated to our VAT reform variable, we include the current monthly unemployment rate and real quarterly GDP growth. We also include country and consumption category fixed effects, and , to control for time-invariant characteristics of inflation by country and type of goods and services. The month fixed effects are included to capture Eurozone-wide trends and seasonal patterns in price levels.15 Since we only use data for Eurozone countries, there is no need to control for exchange rate movements or variations in monetary policy responses.
C. Data and Estimation
Price data are taken from the Harmonized Index of Consumer Prices (HICP) published by Eurostat. These indices are provided on a monthly basis according to the detailed ‘Classification of Individual Consumption According to Purpose’ (COICOP), which contains more than 90 consumption categories. Our sample comprises data on the 67 of these for which prices were deemed to be market driven and which were not VAT-exempt in most countries.16 We also use country-specific expenditure shares for the goods and service provided by Eurostat; these are constant throughout a calendar year and updated annually. We use a novel monthly dataset of VAT rates constructed for this paper. This matches VAT rates, by month, to the 67 consumption categories in 17 European countries that were part of the Eurozone from 1999 to 2013. Information on VAT rates, with month of any change, was obtained from the annual publication VAT Rates Applied in the Member States of the European Union of the European Commission (EC). When information about particular VAT rates was not available from the EC publications (for instance, where the precise definition of goods subject to the reduced VAT rate was not sufficiently detailed to match to our consumption categories), we complemented the data with information from the International Bureau for Fiscal Documentation (IBFD). In the few cases in which the rates that applied to specific categories changed from one annual edition of the EC publication to the next without further detail, we assigned January 1 as the date of reform. The full list of countries and number of VAT reforms by type is given in Appendix Table A1. Table 1 below shows summary statistics for VAT rates, prices and control variables in our sample. Approximately 70 percent of the consumption items are taxed at the standard VAT rate, accounting for slightly less than 65 percent of the value of total consumption. Standard VAT rates range between 15 and 23 percent, with an average rate of close to 20 percent. Reduced
15 The month fixed effects will also control for any changes in nominal exchange rates with the rest of the world.
16 The main categories excluded are rental prices, electricity, health care, postal and transport services, social protection, and insurance and other financial services. Appendix Table A2 lists included categories.

12
rates vary between 2.1 and 17 percent, averaging 8 percent. There are 65 distinct VAT reform episodes in the sample (including reclassifications of individual categories from one rate group to another17), which, as shown in Table 1, generate 1,231 individual VAT rate changes. (To clarify, suppose for example that there is an increase in a common VAT rate applied to two categories; this single reform episode will count as two individual VAT rate changes). Changes in the standard rate account for the bulk of these changes, partly because standard VAT rates apply to the largest number of consumption categories. There are 191 changes in reduced VAT rates and 68 reclassifications. The VAT rate changes reported in Table 1 are expressed as log changes in the tax factor,1 , along the lines of equation (6).18 Thus measured, standard VAT rate changes in the sample range from -0.83 to +2.55 percent, averaging 1.05. Changes in reduced VAT rates range more widely, from -6.45 to +6.45, with a smaller average change of 0.42. Changes in VAT rates due to reclassification range more widely still, from −13 to +15 percent, with an average close to zero and large standard deviation. VAT rate decreases have been less numerous than increases, but have tended to be larger. Table 1 also provides descriptive statistics for price changes, unemployment rates and the consumption weights of the 67 categories. The total size of our unbalanced panel consists of 155,385 monthly observations, with the longest individual panels covering the period from January 1999 to September 2013. Finally, prior to estimating (6), we de-seasonalize and de-trend all price indices. All regressions are weighted by the share of each consumption category in the national consumption basket, so that the estimates for the ′ in (6) represent the weighted mean effect of VAT rate changes on consumer prices, with consumption shares used as weights. Standard errors in (6) are clustered at the panel level to account for possible autocorrelation in the error term at the country-consumption category level (for instance, for the price of newspapers in Germany).
17 Moving commodities from one reduced rate to another reduced rate is deemed a change in reduced rate, not a VAT reclassification.
18 For example, a VAT increase from 20 to 21 percent, is reported as a changes of 1.21/1.20 100 0.83 percent.

13
Table 1: Summary Statistics
Number of
obs Mean St Dev Min Max
VAT Levels Standard 107,089 19.24 2.14 15.00 23.00 Reduced 41,667 7.92 3.40 2.10 17.00 Zero-rated 3,341 0.00 0.00 0.00 0.00
VAT changes Standard 972 1.05 0.96 -0.83 2.55 Reduced 191 0.42 1.98 -6.45 6.45 Reclassification 68 -0.32 8.58 -13.38 14.87 VAT increase 1,009 1.67 1.69 0.41 14.87 VAT decrease 222 -3.02 3.49 -13.38 -0.41
Price changes HICP Index 155,385 0.01 1.34 -117.96 142.82
Others Unemployment rate 155,385 8.22 4.15 1.70 27.60 Real Quarterly GDP growth 155,385 0.38 1.20 -8.50 7.90 Consumption weights 155,385 3.38 3.23 0.00 17.56
Notes: Data on VAT rates taken from the EC (various years) and IBFD. Prices, unemployment rates, real GDP growth and consumption weights are taken from Eurostat.
III. RESULTS
This section presents our main results, for pass through equation in (6), using data on VAT reforms in Eurozone countries. It starts with the average pass through of VAT changes and the corresponding timing of these effects. Then, we look at differences between the types of VAT reform, i.e. whether standard rates or reduced rates are modified or if goods or services are moved between standard, reduced or zero rates. We subsequently explore how the pass through varies between durable and non-durable items, with the share of consumption affected by the VAT change and at possible differences between VAT increases and decreases.

14
A. Average VAT Pass Through
Table 2 shows the cumulative price impact of VAT rate changes for three variants of the estimating equation in (6), with standard errors of the cumulative sums in parentheses.19 ‘Pre-reform’ refers to the sum of coefficients from 12 months to one month before the VAT change; the ‘Contemporaneous’ elasticity is the pass through in the month of the rate change; and ‘Post-reform’ refers to the sum of the coefficients from one month to 12 months after the tax change. The cumulative effect for the entire 2-year window is shown in the fourth line. In column (1), estimation is without controls and fixed effects; columns (2) and (3) successively add fixed effects and control variables.
Table 2: Average Pass Through: Treating All VAT Changes Identically (1) (2) (3)
VAT pass through: Pre-Reform 0.12* 0.07 0.08 (0.06) (0.07) (0.07) Contemporaneous 0.17*** 0.15*** 0.15*** (0.03) (0.03) (0.03) Post-Reform 0.11* 0.07 0.09 (0.06) (0.06) (0.06) Total 0.40*** 0.29*** 0.32***
(0.09) (0.10) (0.09) Unemployment Rate -0.01*** (0.00) Real quarterly GDP growth -0.01 (0.01) Fixed Effects No Yes Yes Observations 155,385 155,385 155,385 R-squared 0.00 0.02 0.02 Notes: The table presents the sum of the coefficients of the price elasticity with respect to tax changes for each period. The regressions include 12 leads and lags of the VAT rate changes. Country, consumption category and month fixed effects variables included in columns (2) and (3). Panel-clustered standard errors in parentheses. Individual observations are weighted by their share of total national consumption. * means p<10%, ** p<5%, *** p<1%.
19 Specifically, we report ∑ and SE(∑ for the Pre-Reform period, and SE( for the Contemporaneous impact, ∑ and SE(∑ for the Post-Reform period, and ∑ and SE(∑ for the Total period. Using a different definition of cumulative elasticities ∏ 1 1yields broadly similar results but with larger standard errors. The full set of individual coefficients is available upon request.

15
The cumulative final pass through in column (1) is 40 percent, significant at 1 percent. Slightly less than half of this comes contemporaneously with the tax change, while the other half is split about equally between lead and lagged effects. Adding fixed effects (country, month and consumption category), estimated long run pass through falls in column (2) to around 30 percent. Now only the contemporaneous effect is significant, with magnitude similar to that in Column (1). Adding the unemployment rate and real GDP growth20 in column (3) slightly raises the total cumulative effect to 32 percent. Figure 1 shows the implied pattern of pass through in more detail. The upper panel plots the individual estimated ’s from the regression in column (3) of Table 2, along with each of their 95% confidence intervals, for up to 12 months before and 12 months after a VAT reform. The monthly pass through estimates are typically low—being greatest, as one might expect, at the time of implementation---but generally positive before and after the reform. The lower panel shows the cumulative sums of the estimated coefficients at every month in the two year window around reform, with the 95 percent confidence interval of those sums. Modest anticipation effects are seen some five months before the reform, with more marked effects in the first five months after reform building up to final pas through of 32 percent.
20 The negative point estimate on the unemployment rate is consistent with the usual Phillips curve relation; the negative efficient on real quarterly GDP growth is counterintuitive, but not statistically significant.

16
Figure 1: Average Pass Through Panel A: Price Responses in Two-Year Interval around VAT Change
Panel B: Average Cumulative Pass Through of VAT Change
Two aspects of these results stand out. First, the total effect is statistically different from unity (and from zero) at 99 percent confidence. The null of full pass through—the standard presumption in policy work—is firmly rejected, with the point estimates implying that only around one-third of a VAT change is passed forward to consumer prices. Simply assuming full pass through of all VAT reforms is, it seems, a significant mistake. Second, non-contemporaneous effects matter: though the largest effect is clearly in the month of implementation, something in the order of one-third to one-half of the full effects comes either before or after reform.
-0.1
0.0
0.1
0.2
Ela
stic
ity
-12 -6 0 6 12Month
0.0
0.2
0.4
0.6
Cum
ula
tive
Ela
stic
ity
-12 -6 0 6 12
Month
Coefficient 95% CI
Notes: Panel A shows estimated individual coefficients from Equation (6)with full list of controls and fixed effects as in column (3) of Table 2. PanelB shows cumulative sum of coefficients.

17
These results, however, treat all VAT changes as the same. The rest of this section explores sources of heterogeneity across quite different types of change.
B. Pass Through by Type of VAT Change
VAT reforms may involve changes in the standard VAT, changes in reduced VAT rates, and/or reclassifications of commodities between VAT-rate categories. To explore whether the pass through systematically varies across types of VAT changes, we estimate simultaneously their differential impacts on prices using the following equation
∆ln ∆ln 1∈ , ,
θ δ ε 7
where the ’s are now estimated separately for different types of reform k: standard rate changes , reduced rate changes , and reclassifications . Just as in column (3) of Table 2, we include the full set of fixed effects, unemployment rate and real quarterly GDP growth variables. Note that, since equation (7) specifies own-VAT rate changes for every observation, the estimation can accommodate cases where a particular reform episode comprises multiple types of rate changes or reclassification. Table 3 shows, in the first three columns, the cumulative price impacts pre- and post reform on prices of each type of change, as well as the contemporaneous pass through and the total effect over the 2-year period. Column (4) shows the p-value of a Wald test of equality of coefficients across columns (1) to (3), separately by period. Figure 2 shows the estimated cumulative dynamic effects of the VAT change by type.

18
Table 3: Regression Results of Pass Through by Type of VAT Rate Change (1) (2) (3) (4) Standard Reduced Reclassification Coefficients Equal Pre-Reform 0.71*** -0.13 -0.06 0.00 (0.22) (0.25) (0.06) Contemporaneous 0.30*** 0.36*** 0.10*** 0.00 (0.06) (0.13) (0.03) Post-Reform 0.38** 0.07 0.04 0.18 (0.17) (0.18) (0.06) Total 1.39*** 0.30 0.08 0.00 (0.36) (0.23) (0.07) Number of VAT Changes 972 191 68 Notes: The table presents the sum of the coefficients of the price elasticity with respect to tax changes for each period. The regression includes 12 leads and lags of the VAT rate changes by type of change. Number of observations is 155,385. Additional controls not shown include unemployment rates, real quarterly GDP growth and country, consumption category and month fixed effects. Individual observations are weighted by their share of total national consumption. Panel-clustered standard errors in parentheses. * means p<10%, ** p<5%, *** p<1%. Column (4) presents the p-value from a Wald test of equality of coefficients across columns (1)-(3).
Figure 2: Cumulative Pass Through by Type of VAT Rate Change
The pattern of price responses differs markedly between the three types of VAT reform. For changes in the standard VAT rate, there are significant positive anticipation effects starting about nine months before the VAT rate change, becoming cumulatively statistically different from zero seven months prior to the VAT change. Table 3 shows that the total lead effects on consumer
-0.5
0.0
0.5
1.0
1.5
Cum
ulat
ive
Ela
stic
ity
-12 -6 0 6 12
Month
Standard Reduced
Reclassification
Notes: Cumulative sum of coefficients from Equation (7) by type of VAT ratechange separately with full list of controls and fixed effects as in Table 3.

19
prices add up to a strikingly large 71 percent of the VAT change.21 The contemporaneous price effect adds another 30 percent, implying that full pass through is achieved at the month of the actual VAT change. Lagged effects, occurring mainly in the 8 months immediately after the VAT change, add another 38 percent to this. Hence, the long-run point estimate of the overall effect suggests overshifting of standard VAT rate changes by some 39 percent. However, with a standard error of 0.36, we cannot reject the null hypothesis of full cumulative pass through in the long run. Changes in reduced VAT rates show a very different pass through pattern. For these, anticipation effects are insignificant and, indeed the cumulative point estimate for all price responses prior to the VAT change is negative at −0.13. The contemporaneous price effect is 36 percent and highly significant. During the months after the reform, there are some lagged price responses that add up another 7 percent. Overall, the cumulative pass through in the long run is estimated at only 30 percent, but this is statistically different from zero. Clearly, however, estimated long run pass through is statistically different from unity, so the results firmly reject the null that reduced VAT rates have been fully passed on. VAT reclassifications have virtually no effect on prices over the two year window. Prior to the reform, lead effects add up to a small but insignificant amount, which is largely offset by a similar, but again insignificant cumulative lagged effect. Only the contemporaneous pass through is significant and positive, but at only 10 percent of the VAT increase; the null of zero total pass through cannot be rejected. As with reduced rate changes, we can clearly reject full pass through of reclassifications. This result for reclassification contrasts with those of several studies of reclassification of specific consumption items from standard to reduced rates in France (car sales, housing repair services and restaurants) and Finland (hairdressing services), for which pass through was estimated between 40 and 75 percent (Carbonnier, 2007; Kosonen, 2013, Trannoy, 2011). This is somewhat surprising since as discussed earlier, the choice of counterfactual prices typically involves substitutes (such as, for restaurant services, canteens) for which we would expect a price increase following a VAT reclassification. In turn, this would lead to an underestimate of the pass through for the targeted item. The last column in Table 2 assesses whether pass through estimates for the three types of VAT change are statistically different from each other, both for each period and over the entire treatment window. The Wald test rejects the null of equivalence between the three types of VAT reform for the pre-reform period, the contemporaneous effect and the total cumulative effect. Pair-wise F-tests indicate that pass through for standard VAT rate changes is significantly larger than for both changes in reduced VAT rates and for VAT reclassifications. Only for the post-
21 We are not aware of any systematic compilation of announcement dates of VAT reforms, which would allow us to further analyze these anticipation effects.

20
reform period do we find that the pass through does not significantly vary across the three types of VAT reform: in each of these cases, the impact is small. What could explain this marked difference in pass through across different types of VAT change? Reflecting distributional concerns, goods taxed at reduced rates often include food items and other necessities that might be expected to have relatively low income elasticities; which (5) above suggests should actually imply higher pass though. Equation (5) also indicates, however, that this effect is muted when the budget share is small, and that a high elasticity of substitution then points towards lower pass through. These latter effects, it seems, dominate. For example, the category of mineral waters, soft drinks, fruit and vegetable juices (CP0122) has the largest number of reduced VAT rate changes and reclassifications (15) in our sample. But this has a very modest budget share—less than one percent of average—and it seems plausible that it is relatively easy for consumers to substitute away from these items to coffee, tea, alcoholic beverages or other foods instead.
C. Pass Through and Durable Consumption
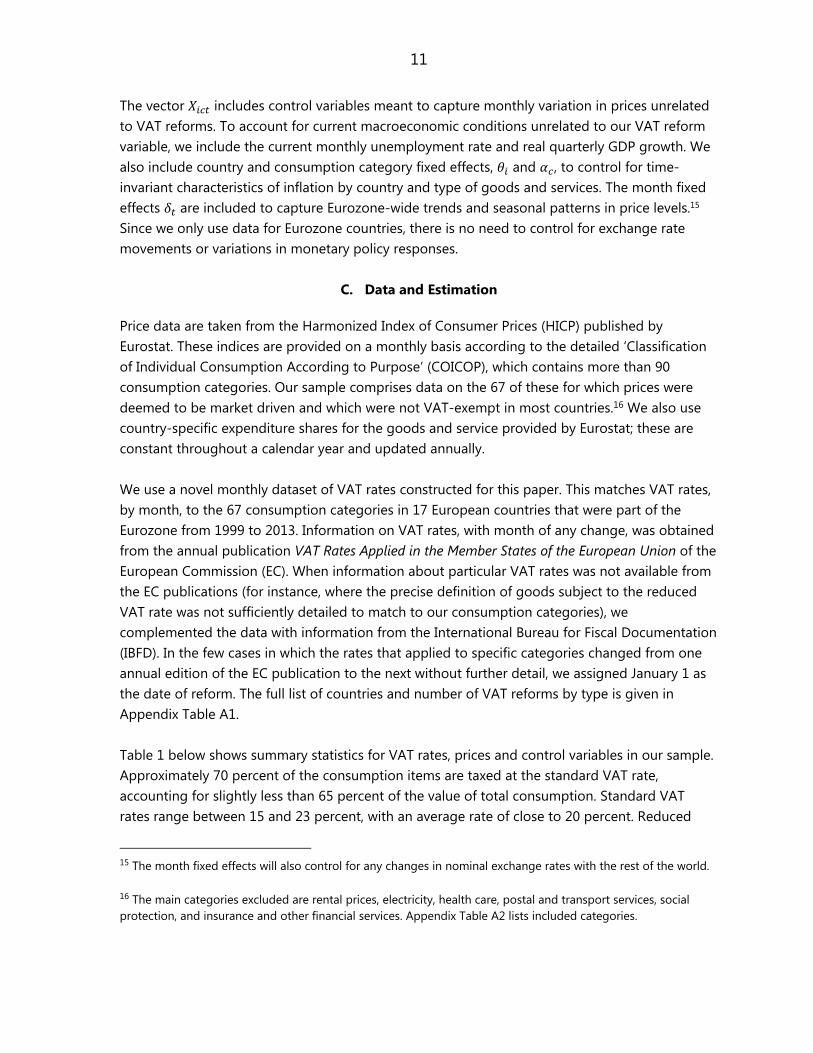
Differences in storability, and perhaps in other features such as the salience of tax changes, open the possibility of different patterns of pass through between durable and non-durable commodities. To explore this, we split our consumption categories into durable and non-durable items (as described in Appendix Table A2) and run the same regression as before, including fixed effects and controls. Figure 3 shows the results. Figure 3 shows that anticipation effects are important for durable items, but not for non-durables: for durables, pass through of 35 percent is achieved before the actual VAT change is enacted for durable goods, while for non-durables there are no signs of such anticipation effects. This is as one might expect, at least to the extent that consumers anticipate the VAT increases, since the gain in purchasing in advance of the rate increase is greater for durables, which one might in turn expect to see reflected in prices (Carare and Danninger (2008)). The subsequent patterns of contemporaneous and lagged price effects are similar between the two types of items, implying that the long-run overall pass through is also larger for durables, at around 50 percent—still significantly different, however, from full pass through. This result can also partly explain the lower pass through found above for reduced VAT rates, since many countries tend to tax several non-durable items at a reduced VAT rate, while durables are commonly taxed at the standard VAT rate. In our sample, close to 45 percent of non-durables commodities are taxed at either a reduced or zero-rate while more than 95 percent of durables are taxed at the standard rate.
21
Figure 3: Cumulative Pass Through for Durables versus Non-Durables
D. Pass Through and Scope of VAT Reform
There is a strong association between the type of VAT reform and the share of consumption affected by that reform. For instance, and as Figure 4 shows, changes in the standard VAT rate apply, almost by definition, to a larger share of consumption than do reduced rate changes; and reclassifications almost always apply to quite small consumption shares.
-0.2
0.0
0.2
0.4
0.6
Cum
ulat
ive
Ela
stic
ity
-12 -6 0 6 12
Month
Durables Non-durables
Notes: Cumulative sum of coefficients from Equation (7) for durables and non-durables separately with full list of controls and fixed effects as in Table 3.

22
Figure 4: Number of VAT Rate Changes by Type of Reform and Total Consumption Share Affected
To explore the role of consumption shares in determining the pass through of VAT reform, we now estimate an equation of the form:
∆ln ∆ 1 , ; θ δ ε , 8
using two alternative functional forms for . . The first interacts the VAT rate change with a series of indicators ∈ determining whether a reform episode in country and month affects a particular quantile of total consumption share 22. That is, for period we take
∆ 1 , ; ∈ ∆ 1∈
,
where the set includes the following bins: 0-10 percent of total consumption basket, 10-20, 20-26, 26-40, 40-50, 50-60 and 60-74 (the highest consumption share affected by a single VAT reform episode). The specific choice of bins was made to ensure a balanced distribution of treatments and sufficient flexibility to estimate heterogeneous pass through over the entire
22 Subscript refers to the 65 distinct VAT reform episodes, while subscript refers to the 1,231 individual rate changes.
050
100
150
Num
ber
of
Cha
nges
0 25 50 75
Percent of Consumption Basket
Reclassification Reduced Standard
Notes: The figure plots the histograms of the consumption share affectedby type of VAT rate changes separately. Dashed lines represent theaverage consumption share affected by type of change.

23
range of consumption shares.23 Figure 5 shows the point estimates and confidence intervals for total pass through with this specification, evaluated at the midpoint of each of the share classes. The second approach interacts the VAT change with a cubic polynomial of the total consumption share affected
∆ 1 ,
from which we can also infer a possibly non-linear relationship between pass through and consumption share. The solid line in Figure 5 shows the total estimated pass through as a function of the consumption share, with dashed lines showing the 90 percent confidence interval.
Figure 5: Pass Through by Share of Consumption Affected
Both approaches, as Figure 5 shows, imply an inverted U-shaped relationship between total pass through and the consumption share: pass through is relatively small for VAT reforms that affect a small consumption share, is highest—and close to full—for VAT reforms affecting around half of all consumption and is again smaller for VAT reforms affecting a large share of consumption. More precisely, pass through is not significantly different from zero when the VAT applies to a consumption share less than 10 percent or more than 65 percent. At the same time, however, given the large standard errors for reforms affecting a large consumption share—recall from
23 To simplify interpretation, we do not weigh Equation (8) by individual consumption shares. However, results are largely unchanged when the estimation uses individual consumption weights.
-1.0
0.0
1.0
2.0
Cu
mul
ativ
e E
last
icity
0 25 50 75
Month
Consumption share k 90% CI
Cubic Polynomial 90% CI
Notes: The figure plots the total pass through of a VAT change by the level ofthe consumption share directly affected by the reform. Total pass throughs areestimated separately by interacting VAT rate changes with 1) a series of indicatorsfor the level of total consumption share targeted and 2) a cubic polynomialin the share of consumption targeted by a reform. See main textfor details.

24
Figure 4 that there are very few reforms affecting more than around 60 percent of consumption—the null of full pass through cannot be rejected for VAT reforms affecting more than 30 percent of consumption. Indeed, the declining part of the inverted U-shape in Figure 5 is not statistically significant: it would be possible to draw a horizontal line beyond 50 percent of total consumption that lies entirely within the confidence bounds of both sets of estimates. These results, and the impression left by both methods in Figure 5, are striking nonetheless. They are, at a minimum, a caution against the intuitively appealing presumption that pass through will tend to be greater the wider the base to which a VAT increase applies. The theory set out in Section II warns that this is not necessarily the case: the wider the set of commodities to which a tax increase applies, for instance the larger one would expect the corresponding income elasticity of the composite taxed good to be—which, equation (4) indicates, tends to imply lower pass through; and increased difficulty of substituting away from taxed goods may also, as seen above, be associated with lesser pass through. The results here suggest that considerations of this kind, which might initially appear to be counterintuitive implications, can be of some importance in practice.
E. Asymmetric Responses? Pass Through for Rate Increases and Decreases
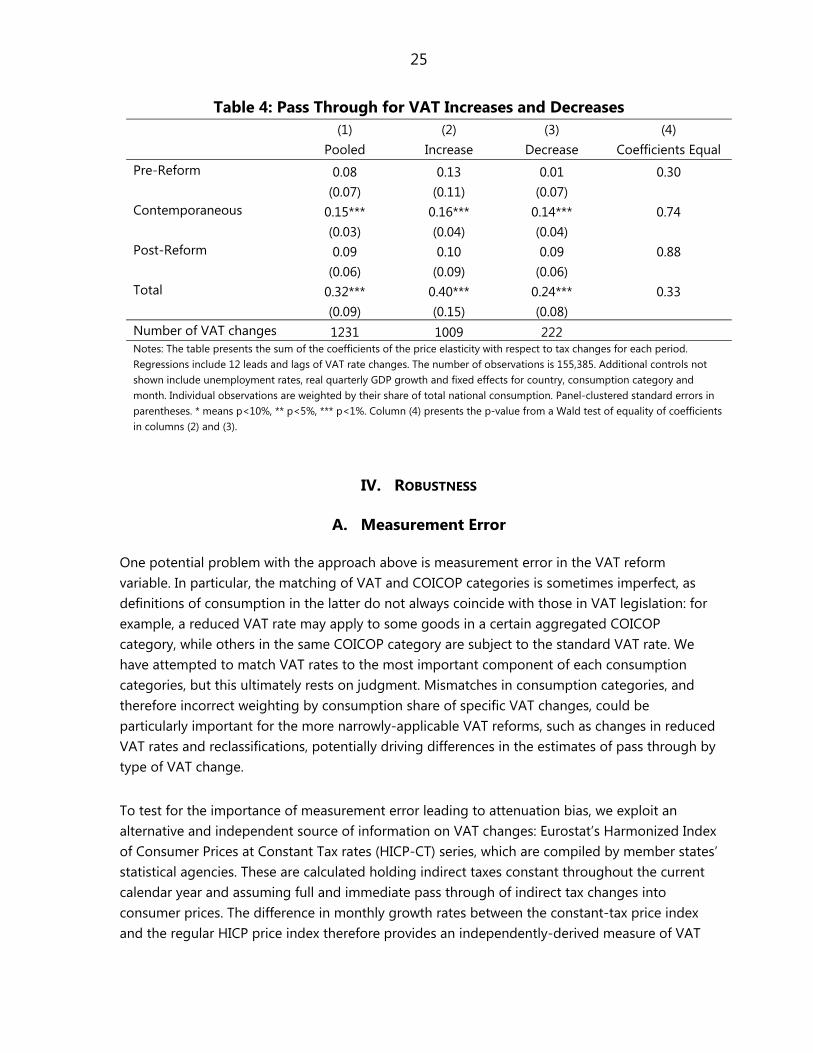
The final issue addressed here is possible asymmetry in the pass through of VAT reform between rate increases and rate decreases. In particular, if downward nominal rigidities are important VAT decreases might cause consumer price to fall by the same amount as an equally large VAT increase would cause them to rise.24 To explore this, we split the sample into VAT rate increases and VAT rate decreases.25 Results are in Table 4, again for the specification with fixed effects and controlling for the unemployment rate and real GDP growth. We also weigh individual observations using consumption shares. As a benchmark, column (1) combines all changes, whatever their sign: cumulative pass through is then 0.32 (this is the same result as in column (3) of Table 2). Columns (2) and (3) of Table 4 report estimated pass through for VAT increases and decreases separately. These are in each case close to each other and the Wald tests reported in column (4) cannot reject equivalence. This contrasts sharply with previous findings, notably that for food items in Brazil, of greater pass through for VAT increases than for decreases (Batista Politi and Mattos (2011)). The main asymmetry between rate increases and decreases that emerges here is in terms of timing, the point estimate for the pre-reform pass through being larger for rate increases (at 13 percent) than for decreases (0.01 percent); but the Wald test in column (4) cannot reject equivalence. 24 See Batista Politi and Mattos (2011) for a broader discussion of asymmetric pass through.
25 The main conclusions regarding potential asymmetry of pass through are unchanged when including standard rate changes only, or when excluding reclassifications.
25
Table 4: Pass Through for VAT Increases and Decreases (1) (2) (3) (4) Pooled Increase Decrease Coefficients Equal Pre-Reform 0.08 0.13 0.01 0.30 (0.07) (0.11) (0.07) Contemporaneous 0.15*** 0.16*** 0.14*** 0.74 (0.03) (0.04) (0.04) Post-Reform 0.09 0.10 0.09 0.88 (0.06) (0.09) (0.06) Total 0.32*** 0.40*** 0.24*** 0.33 (0.09) (0.15) (0.08) Number of VAT changes 1231 1009 222 Notes: The table presents the sum of the coefficients of the price elasticity with respect to tax changes for each period. Regressions include 12 leads and lags of VAT rate changes. The number of observations is 155,385. Additional controls not shown include unemployment rates, real quarterly GDP growth and fixed effects for country, consumption category and month. Individual observations are weighted by their share of total national consumption. Panel-clustered standard errors in parentheses. * means p<10%, ** p<5%, *** p<1%. Column (4) presents the p-value from a Wald test of equality of coefficients in columns (2) and (3).
IV. ROBUSTNESS
A. Measurement Error
One potential problem with the approach above is measurement error in the VAT reform variable. In particular, the matching of VAT and COICOP categories is sometimes imperfect, as definitions of consumption in the latter do not always coincide with those in VAT legislation: for example, a reduced VAT rate may apply to some goods in a certain aggregated COICOP category, while others in the same COICOP category are subject to the standard VAT rate. We have attempted to match VAT rates to the most important component of each consumption categories, but this ultimately rests on judgment. Mismatches in consumption categories, and therefore incorrect weighting by consumption share of specific VAT changes, could be particularly important for the more narrowly-applicable VAT reforms, such as changes in reduced VAT rates and reclassifications, potentially driving differences in the estimates of pass through by type of VAT change. To test for the importance of measurement error leading to attenuation bias, we exploit an alternative and independent source of information on VAT changes: Eurostat’s Harmonized Index of Consumer Prices at Constant Tax rates (HICP-CT) series, which are compiled by member states’ statistical agencies. These are calculated holding indirect taxes constant throughout the current calendar year and assuming full and immediate pass through of indirect tax changes into consumer prices. The difference in monthly growth rates between the constant-tax price index and the regular HICP price index therefore provides an independently-derived measure of VAT

26
changes that can be used to address the potential measurement error in our own VAT change series.26 The main drawback of using these HICP-CT series is that they are only available for more aggregated categories of consumption, such as ‘processed food’, ‘unprocessed food’, ‘non-energy industrial goods’, ‘energy’ and ‘services’, and only from 2002 to 2013.27 Under the classical errors-in-variables (CEV) assumption, the observed value for a particular VAT rate change is the sum of the true unobserved VAT rate change and an error term that is uncorrelated with the true value. By instrumenting our measure of VAT change with the HICP-CT-based measure and assuming that both variables are the sum of the true VAT change and an uncorrelated measurement error term, we can therefore recover an unbiased estimate of the pass through to consumer prices (Ashenfelter and Krueger 1994; Wooldridge 2010). We do this for each of the three types of VAT reform distinguished above—changes in standard VAT rates, in reduced VAT rates and reclassifications—to assess possible attenuation bias for each. More specifically, any statistically significant difference between the OLS estimate and the IV estimate would be indicative of the presence of systematic measurement error in the VAT change variable used above. As a first check on the possible importance of measurement error, we correlate the HICP-CT-derived VAT reform series published by Eurostat with our own measure of VAT rate change. The correlation coefficient by type of change is 0.81, 0.64 and 0.66 for, respectively, standard VAT rates, reduced rates and VAT reclassifications (see Figure A1). This indicates that, as the considerations above suggested, the ratio of information to noise is likely highest for standard rate changes and lowest for reduced rate changes and reclassifications. Table 5 presents OLS estimates of pass through by type of VAT change as in equation (7), using the smaller sample that coincides with the available HICP-CT data. Most of the results are qualitatively similar to those in Table 3, the main difference being in the timing of pass through for reduced VAT rate changes: the pre-reform negative pass through is now much larger in absolute value, but both the contemporaneous and lagged pass through are also higher, so total pass through for reduced rate changes remains at 0.30. The total estimated pass through also remains statistically different from one at the 5 percent level. The estimated pass through for reclassifications remains insignificant, while that for the standard VAT rate change decreases somewhat from 1.39 to 1.30.
26 Annex A describes the algebra underlying the construction of the HICP-CT series and how to recover the implied VAT rate changes. See also Eurostat’s HICP-CT Manual (Eurostat 2009) for further details.
27 The HICP-CT series are also not available for Ireland.

27
Table 5: Pass Through by Type of VAT Rate Change – OLS Estimates (1) (2) (3) (4)
Standard Reduced Reclassification Coefficients
Equal Pre-Reform 0.74*** -0.45 -0.10* 0.00 (0.24) (0.29) (0.06) Contemporaneous 0.27*** 0.59*** 0.13*** 0.00 (0.07) (0.15) (0.03) Post-Reform 0.29 0.17 0.02 0.48 (0.21) (0.30) (0.08) Total 1.30*** 0.30 0.05 0.01 (0.42) (0.28) (0.08) Number of VAT Changes 666 167 51 Notes: The table presents the sum of the coefficients of the price elasticity with respect to tax changes for each period. The regression includes 12 leads and lags of the VAT rate changes. The number of observations is 104,212. Additional controls not shown include unemployment rates, real quarterly GDP growth and fixed effects for type of rate change, country, consumption category and month. Individual observations are weighted by their share of total national consumption. Panel-clustered standard errors in parentheses. * means p<10%, ** p<5%, *** p<1%. Column (4) presents the p-value from a Wald test of equality of coefficients across columns (1)-(3).
To test for the presence of attenuation bias, we compare the OLS estimates from Table 5 with the IV estimates in Table 6, where our measure of VAT changes is instrumented using VAT changes derived from the HICP-CT data. The F statistics for the excluded instrument in the contemporaneous VAT change equation confirms that, with values well exceeding 10, the HICP-CT-based measure is strongly correlated with our own measure for all types of VAT change and is not subject to weak instrument bias. The Wald tests (reported in the bottom row of Table 6) cannot reject equality of pass through between the OLS and IV estimates for each of the three types of VAT change. This gives reassurance that the results presented earlier are not driven by measurement error. Looking at the IV estimates themselves, the results are broadly similar to those from OLS estimation in Tables 3 and 5. One difference is that the point estimates for standard VAT rate changes are now larger, total pass through now being close to two; but the standard errors are larger, so that the Wald test cannot reject the null of full pass through. Total pass through for reduced VAT rate decreases from 0.30 to 0.16 while total pass through for reclassifications increases from 0.05 to 0.23, However, pass through remains in both cases statistically different from one at the 5 percent level of confidence, as in the OLS results.

28
Table 6: Pass Through by Type of VAT Rate Change – IV Estimates (1) (2) (3) (4) Standard Reduced Reclassification Coefficients Equal Pre-Reform 1.10** -0.50** -0.38* 0.00 (0.50) (0.24) (0.22) Contemporaneous 0.37*** 0.59*** 0.21** 0.26 (0.13) (0.23) (0.09) Post-Reform 0.51* 0.08 0.39 0.61 (0.30) (0.39) (0.41) Total 1.98** 0.16 0.23 0.03 (0.82) (0.35) (0.22) Number of VAT Changes 666 167 51 F-Stat Instrument 194.7 278.7 29.1 OLS=IV (p-value) 0.17 0.61 0.29 Notes: The table presents the sum of the second stage coefficients of the price elasticity with respect to tax changes for each period obtained by instrumental variables estimation. The VAT rate changes are instrumented using VAT rate changes as reported in the HICP-CT price series published by Eurostat (see Data Appendix for details). The table also presents the Angrist-Pischke F statistics for the excluded instruments in the contemporaneous VAT rate change regressions and the p-value of a Wald test for the equality of total pass through estimated by OLS (as in Table 5) and IV. All regressions include 12 leads and lags of the VAT rate changes. Number of observations is 104,212. Additional controls not shown include unemployment rates, real quarterly GDP growth and country, consumption category and month fixed effects. Individual observations are weighted by their share of total national consumption. Panel-clustered standard errors in parentheses. * means p<10%, ** p<5%, *** p<1%. Column (4) presents the p-value from a Wald test of equality of coefficients across columns (1)-(3).
B. Endogeneity
A second potential source of bias in our estimates is endogeneity of VAT reforms. These are undertaken for a variety of reasons, including the need for fiscal consolidation or the desire for fiscal stimulus in response to business cycle developments, including inflation. In the latter case, VAT reform could be driven by policy-makers’ forecast of the business cycle and therefore be correlated with unobserved shocks to consumer prices. In particular, stimulus-motivated VAT cuts may come when times are hard and prices soft, so that we might expect a positive correlation between the unobserved error term and our VAT reform variable. This in turn would lead us to overestimate the degree of pass through of VAT changes. To address this potential endogeneity bias, we seek to identify VAT reforms that were exogenous in the sense of being initiated independently of market conditions. For this, we use an indicator developed in the 2010 IMF World Economic Outlook (WEO), which follows the narrative approach of Romer and Romer (2010) to identify episodes of fiscal policy reform and their rationale from individual country reports and budget documents. These data refer to 16 advanced economies

29
for the period 1980-2009.28 We use this action-based fiscal reform database to split our sample into two types of VAT reform episodes, focusing on changes in standard and reduced rates: those that are explicitly identified as exogenous to the business cycle, i.e. motivated by fiscal consolidation purposes and independent of the state of the economy29 (deemed to be so if they occur in the same year as a broader fiscal consolidation reform identified in the WEO (2010) dataset) and other reforms. Comparing the estimated coefficients for the two subgroups provides a test for the presence of endogeneity bias. Table 7 reports the results of such an exercise, comparing pass through estimates for 198 VAT changes that are explicitly identified as being exogenous and the 636 others.30 Column (3) shows the Wald test for equality of coefficients. The pre-reform estimates for the identified exogenous (or consolidation-driven) reforms are lower than those for other reforms, which is consistent with the prior intuition that VAT reforms undertaken in response to business cycle considerations would lead to OLS to overestimate pass through. The Wald test in column (3), however, indicates that the difference is not statistically significant. The contemporaneous effect for the exogenous reforms is also half as large as for the others, and in this case the difference is statistically significant at 1 percent. The post-reform effects are also lower but equality cannot be rejected. Overall, the estimated final pass through is lower for exogenous reforms, but, once again, the Wald test cannot reject equality. Endogeneity thus seems unlikely to fundamentally jeopardize the broad conclusions above on the cumulative pass through in the long run, though there are signs that they it may imply some overestimation of the contemporaneous pass through in the results above.
28 A conventional measure to assess fiscal consolidation is the change in the cyclically adjusted primary balance (CAPB). Guajardo et al (2011) find that instrumenting the change in the CAPB with the action-based series yields robust results, implying that the action-based measure has explanatory power of the CAPB-based measure of fiscal consolidation.
29 For this exercise use only reforms in standard and reduced VAT rates, comparable to column (1) and (2) of Table 3. The results are broadly similar when only using standard VAT rate changes. We do not use VAT reclassifications as these are unlikely to be part of the broad fiscal consolidation reforms identified in the WEO dataset. As noted in Table 3, they also display a significantly different pass through pattern, which would lead to spurious results.
30 The WEO dataset only contains information for Austria, Belgium, Finland, France, Germany, Ireland, Italy, Netherlands, Portugal and Spain among Eurozone countries.

30
Table 7: Pass Through During Fiscal Consolidation Episodes
(1) (2) (3) Identified Exogenous Others Coefficients Equal Pre-Reform 0.27 0.50* 0.50 (0.20) (0.28) Contemporaneous 0.22*** 0.47*** 0.01 (0.07) (0.09) Post-Reform 0.27 0.41 0.77 (0.42) (0.27) Total 0.76* 1.39*** 0.20 (0.44) (0.33) Number of VAT Changes 198 636 Notes: The table presents the sum of the coefficients of the price elasticity with respect to tax changes for each period. Column (1) uses VAT changes in standard or reduced rates that occurred during episodes of fiscal consolidation as identified in IMF (2010). Column (2) uses the remaining standard and reduced rate VAT reforms in the sample. Countries included in the estimation are: Austria, Belgium, Finland, France, Germany, Ireland, Italy, Netherlands, Portugal and Spain. The regression includes 12 leads and lags of the VAT rate changes. Number of observations is 98,287. Additional controls not shown include unemployment rates, real quarterly GDP growth and country, consumption category and month fixed effects. Individual observations are weighted by their share of total national consumption. Panel-clustered standard errors in parentheses. * means p<10%, ** p<5%, *** p<1%. Column (3) presents the p-value from a Wald test of equality of coefficients across columns (1) and (2).
V. CONCLUSION
The results here, which seem reasonably robust against endogeneity and measurement error concerns, cast light on several aspects of VAT pass through. Perhaps most important, they stress that this can be quite different depending on the nature of the VAT change. For changes in the standard rate, for instance, the assumption of 100 percent pass through—which has been standard practice, albeit with little empirical basis—appears a reasonable starting point. This is much less true, however, of changes in reduced rates, for which pass through is significantly less than one, perhaps around 30 percent; and for simple reclassifications pass through seems close to zero. While this might suggest a general conclusion that pass through is increasing in the breadth of the consumption base affected, and this does indeed appear to be the case over most of the practically relevant range, there are signs that the relationship is flat or even decreasing at the highest levels of coverage---which, as has also been seen, is consistent with theory. Pass through appears to differ too according to the nature of the goods affected, being seemingly greater for durables than non-durables. Contrary, however, to a popular conception, and some previous evidence, there seems no systematic tendency for pass through to be greater for tax increases than for tax cuts.

31
The pass through dynamics too can be both significant and quite different for different types of reform. The lion’s share of the pass through of standard rate changes, for instance, occurs in the months before the actual VAT change, pointing to significant anticipation effects; such effects also appear strong for durables. For reduced VAT rates, however, anticipation effects seem weaker. These results have significant implications for both policy makers and policy analysts. While they tend to validate the conventional treatment of standard rate changes, for instance, they caution against the equally conventional assumption that the benefits of reduced rates are fully passed on to the poorer households they are generally intended to benefit. At the same time, of course, practical application of the broad results presented here will need to be tempered by considering the circumstances of each case. Indeed several factors that one might expect to have a systematic impact on pass through have not been addressed here, generally through want of data. Information on announcement dates, for instance, could be used to further unpack the dynamics. And market structure,31 trade intensity and the degree of compliance32 could all be expected to play a role, as could be the business cycle, and, in countries not part of a monetary union, exchange rate and monetary policies. The analysis here has simply demonstrated and explored some marked heterogeneities of VAT pass through. Fuller understanding of these can provide a more compelling approach to policy design and analysis than the traditional presumption that it is in all cases 100 percent—which, indeed, the results here call further into question.
31Jametti et al. (2013) find retail concentration to affect pass through of gasoline taxes across Canadian cities.
32 Kopczuk et al. (2013) identity differences in pass through of gasoline taxes across U.S. states according to the point of collection, their preferred explanation lying in the impact on compliance.

32
References Ashenfelter, O., and Krueger, A. (1994). "Estimates of the Economic Return to Schooling from a New Sample of Twins," The American Economic Review, 84(5), 1157-1173. Batista Politi, R. and Mattos, E. (2011). “Ad-Valorem Tax Incidence and After-Tax Price Adjustments: Evidence from Brazilian Basic Basket Food,” Canadian Journal of Economics, 44(4), 1438-1470. Besley, T. J. and Rosen, H. S. (1999). “Sales Taxes and Prices: An Empirical Analysis,” National Tax Journal, 52(2), 157-78. Bird, R., and Gendron, P. P. (2007). The VAT in Developing and Transitional Countries. Cambridge University Press. Carare, A. and Danninger, S. (2008), Inflation Smoothing and the Modest Effect of VAT in Germany, IMF Working Paper, WP/08/175. Carbonnier, C. (2007). “Who pays sales taxes? Evidence from French VAT reforms, 1987–1999,” Journal of Public Economics, 91, 1219–29. Chirakijja, J., Crossley, T. F., Lührmann, M. and O´Dea, C. (2009). “The Stimulus Effect of the 2008 UK Temporary Vat Cut,” Prepared for: Value-Added Tax: Fiscal and Practical Potential, National Tax Association Annual Meeting 2009. Crossley, T.F., Low, H.W. and Sleeman, C. (2014). “Using a Temporary Indirect Tax Cut as a Fiscal Stimulus: Evidence from the UK,” IFS Working Paper (W14/16). Delipalla, S., and M. J. Keen (1992). “The comparison between ad valorem and specific taxation under imperfect competition,” Journal of Public Economics, 49, 351–67. Eurostat (2009). HICP-CT Manual, HCPI 09/547 rev. 3, European Commission, Luxembourg. European Commission (various years). VAT Rates Applied in the Member States of the European Union Situation.

33
Guajardo, J., Leigh, D. and Pescatori, A. (2011). “Expansionary Austerity: New International Evidence,” IMF Working Paper, WP/11/158. Jametti, M., Redonda, A. and Sen, A. (2013). “The Power to Pass on Taxes—A Test for Shifting Based on Observables,” CESifo Working Paper No. 4265. Kleven, H. J., and Kreiner, C. T. (2003). “The Role of Taxes as Automatic Destabilizers in New Keynesian Economics,” Journal of Public Economics, 87(5), 1123-1136. Kopczuk, W., Marion, J. Muehlegger E. and Slemrod, J. (2013). “Do the Laws of Tax Incidence Hold? Point of Collection and the Pass-Through of State Diesel Taxes,” NBER Working Paper 19410. Kosonen, T. (2013). “More Haircut After VAT Cut? On the Efficiency of Service Sector Consumption Taxes,” Government Institute for Economic Research VATT Working Papers 49/2013. Lustig, N., Pessino C. and Scott, J. (2013). “The Impact of Taxes and Social Spending on Inequality and Poverty in Argentina, Bolivia, Brazil, Mexico, Peru and Uruguay: An Overview,” University of Tulane, Working Paper No. 13. Poterba, J. (1996). “Retail Price Reactions to Changes in State and Local Sales Taxes,” National Tax Journal, 49, 165–76. Smart, M., (2011). “The Impact of Sales Tax Reform on Ontario Consumers: A First Look at the Evidence,” The School of Public Policy Research Paper 11/03. Stern, N. H. (1987). “The Effects of Taxation, Price Control and Government Contracts in Oligopoly and Monopolistic Competition,” Journal of Public Economics, 32, 133-158. Trannoy, A. (2011). “The Shifting Rate of the VAT Cut on Restaurants in France: A Conflict between Commitment and Market forces,” Mimeo. Vickrey, W. (1960). “Can Excises Lower Prices”, in R.W. Plouts (ed.) Essays in Economics and Econometrics: A Volume in Honor of Harold Hotelling, University of North Carolina Press; Chapel Hill), 165-177. Weyl, E.G., and Fabinger, M. (2013). “Pass through as an Economic Tool: Principles of Incidence under Imperfect Competition,” Journal of Political Economy, 121 (3), 528-583. Wooldridge, J. M. (2010). Econometric Analysis of Cross Section and Panel Data. (Cambridge MA: MIT Press).

34
Table A1. Country List and VAT Reforms
Country First year in
sample Number of VAT
reforms Number of Consumption Categories Affected Standard Reduced Reclassification
Austria 1999 3 0 0 4 Belgium 1999 4 0 0 6 Cyprus 2008 6 44 1 17 Estonia 2011 0 0 0 0 Finland 1999 4 44 30 4 France 1999 6 49 6 4 Germany 1999 2 51 0 1 Greece 2001 6 136 83 2 Ireland 1999 7 168 21 4 Italy 1999 2 51 1 1 Luxembourg 1999 5 0 0 6 Malta 2008 2 0 1 2 Netherlands 1999 1 41 0 0 Portugal 1999 10 242 20 9 Slovakia 2009 1 62 0 0 Slovenia 2007 4 0 0 8 Spain 1999 2 84 28 0 Notes: Data from EC (various years) and IBFD.

35
Table A2. Consumption Categories
COICOP Consumption Items Average
Expenditure Share
Average VAT Rate
Number of
Durable Standard Rate
Change
Reduced Rate
Change Reclassification
CP0111 Bread and cereals 2.7 6.6 1 7 1 0 CP0112 Meat 3.8 7.3 1 9 1 0 CP0113 Fish and seafood 1.1 7.3 1 9 1 0 CP0114 Milk, cheese and eggs 2.4 6.6 1 7 1 0 CP0115 Oils and fats 0.6 6.8 1 9 1 0 CP0116 Fruit 1.2 6.6 1 7 1 0 CP0117 Vegetables 1.6 6.6 1 7 1 0
CP0118 Sugar, jam, honey, chocolate and confectionery
1.0 8.3 6 8 1 0
CP0119 Other food products 0.5 9.1 7 8 1 0 CP0121 Coffee, tea and cocoa 0.4 10.0 6 8 1 0
CP0122 Mineral waters, soft drinks, fruit and vegetable juices
0.9 9.8 2 10 4 0
CP0211 Spirits 0.5 19.2 22 0 0 0 CP0212 Wine 0.8 18.3 17 2 0 0 CP0213 Beer 0.7 19.2 22 0 0 0 CP022 Tobacco 3.0 19.1 22 0 1 0 CP0311 Clothing materials 0.1 19.1 14 0 0 0 CP0312 Garments 5.1 19.2 22 0 0 0
CP0313 Other articles of clothing and clothing accessories
0.2 18.6 17 1 0 0
CP0314 Cleaning, repair and hire of clothing 0.2 14.7 12 7 5 0 CP032 Footwear including repair 1.4 19.2 22 0 0 0
CP0431 Materials for the maintenance and repair of the dwelling
0.8 18.2 21 0 0 0
CP0432 Services for the maintenance and repair of the dwelling
0.9 13.0 5 8 3 0
CP0444 Other services relating to the dwelling 0.8 17.2 16 1 1 0

36
Table A2. Consumption Categories (Cont.) CP0452 Gas 1.4 14.3 6 6 4 0 CP0453 Liquid fuels 0.9 18.0 12 1 1 0 CP0454 Solid fuels 0.3 14.9 9 5 1 0 CP0511 Furniture and furnishings 2.2 19.2 22 0 0 1 CP0512 Carpets and other floor coverings 0.2 19.2 22 0 0 1
CP0513 Repair of furniture, furnishings and floor coverings
0.1 19.5 10 0 0 0
CP052 Household textiles 0.6 19.2 22 0 0 0
CP0531/532 Major and small electric household appliances
1.0 19.2 22 0 0 1
CP0533 Repair of household appliances 0.1 19.2 22 0 0 0
CP054 Glassware, tableware and household utensils
0.5 19.2 22 0 0 0
CP055 Tools and equipment for house and garden
0.4 19.2 22 0 0 1
CP0561 Non-durable household goods (for routine household maintenance)
1.1 19.2 22 0 0 0
CP0562 Domestic services and household services
0.9 17.6 17 1 5 0
CP0611 Pharmaceutical products 1.2 7.1 1 8 2 0 CP0711 Motor cars 4.9 19.0 22 0 2 1 CP0712/713/714
Motor cycles, bicycles and animal drawn vehicles
0.3 19.0 22 0 2 1
CP0721 Spares parts and accessories for personal transport equipment
0.8 19.2 22 0 0 1
CP0722 Fuels and lubricants for personal transport equipment
4.6 19.0 22 0 0 0
CP0723 Maintenance and repair of personal transport equipment
2.0 19.0 22 0 1 0
CP0724 Other services in respect of personal transport equipment
0.7 19.0 22 0 1 0
CP082 Telephone and telefax equipment 0.2 19.1 16 0 0 1

37
Table A2. Consumption Categories (Cont.) CP083 Telephone and telefax services 2.7 19.0 16 0 1 0
CP0911 Equipment for the reception, recording and reproduction of sound and pictures
0.5 19.2 22 0 0 1
CP0912 Photographic and cinematographic equipment and optical instruments
0.1 19.2 22 0 0 1
CP0913 Information processing equipment 0.4 19.2 22 0 0 1 CP0914 Recording media 0.3 19.2 22 0 0 1
CP0915 Repair of audio-visual, photographic and information processing equipment
0.1 19.1 15 0 0 0
CP0921/922 Major durables for indoor and outdoor recreation including musical instruments
0.3 19.3 22 0 0 1
CP0931 Games, toys and hobbies 0.5 19.2 22 0 0 0
CP0932 Equipment for sport, camping and open-air recreation
0.3 19.2 22 0 0 0
CP0933 Gardens, plants and flowers 0.6 12.1 7 4 3 0
CP0934/935 Pets and related products; veterinary and other services for pets
0.5 18.5 20 2 0 0
CP0941 Recreational and sporting services 1.0 11.2 2 10 2 0 CP0951 Books 0.6 7.8 6 6 0 0 CP0952 Newspapers and periodicals 0.9 7.5 2 7 0 0
CP0953/954 Miscellaneous printed matter; stationery and drawing materials
0.3 16.2 18 4 0 0
CP096 Package holidays 1.5 17.7 17 0 3 0 CP1111 Restaurants, cafés and the like 8.3 13.6 7 6 5 0 CP1112 Canteens 0.9 12.2 6 6 5 0 CP112 Accommodation services 1.9 9.0 3 13 2 0
CP1211 Hairdressing salons and personal grooming establishments
1.1 16.4 14 4 4 0
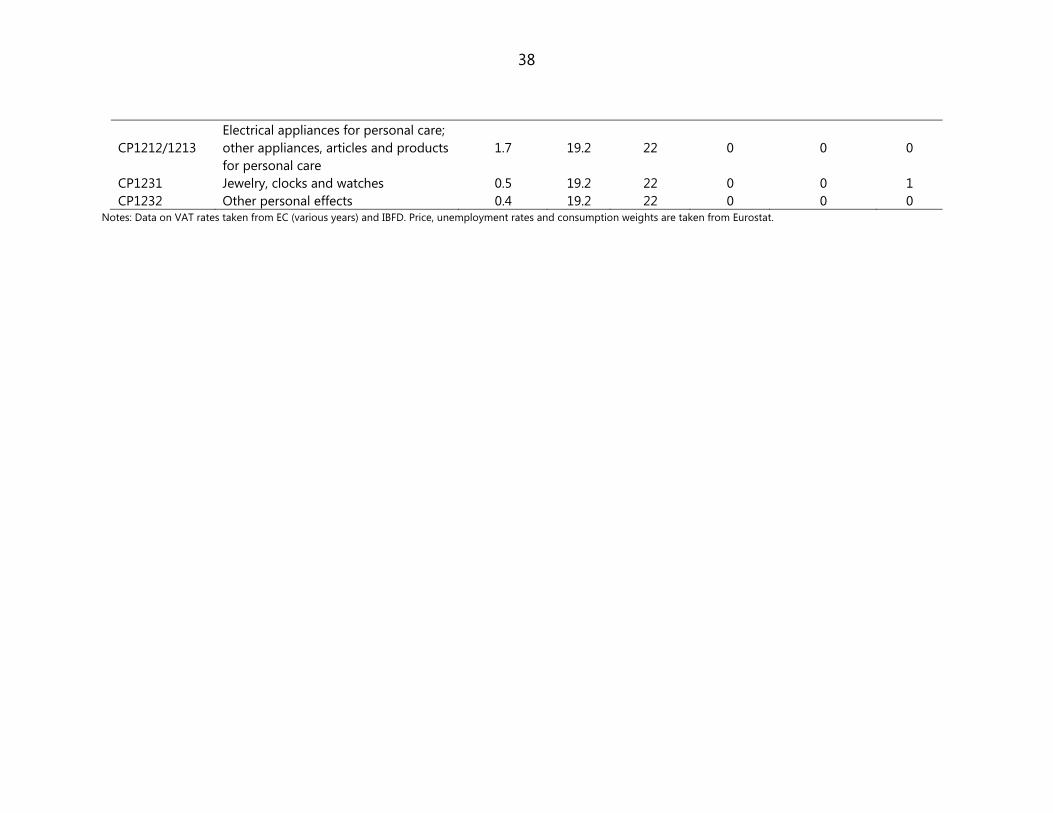
38
CP1212/1213 Electrical appliances for personal care; other appliances, articles and products for personal care
1.7 19.2 22 0 0 0
CP1231 Jewelry, clocks and watches 0.5 19.2 22 0 0 1 CP1232 Other personal effects 0.4 19.2 22 0 0 0
Notes: Data on VAT rates taken from EC (various years) and IBFD. Price, unemployment rates and consumption weights are taken from Eurostat.

39
Figure A1. Comparison of VAT Changes by Source
a) Standard Rate Changes
b) Reduced Rate Changes
c) Reclassification
-0.0
20.
000.
020.
040.
06
VA
T C
hang
es
-0.02 0.00 0.02 0.04 0.06
VAT Changes - HICP-CT
-0.0
4-0
.02
0.00
0.02
0.04
0.06
VA
T C
hang
es
-0.04 -0.02 0.00 0.02 0.04 0.06
VAT Changes - HICP-CT
-0.2
0-0
.10
0.0
00
.10
0.2
0V
AT
Cha
nges
-0.02 0.00 0.02 0.04 0.06
VAT Changes - HICP-CT
Notes: The figure shows the scatter plots of VAT changes weightedby consumption share as measured in the sample against VAT changes derived from the HICP-CT data and the linear relationestimated via OLS by type of VAT reform separately.

40
Appendix A: Constructing HICP-CT-based VAT Rate Changes
The HICP-CT series are constructed to provide users with consumer price indexes that only reflect the evolution of underlying economic activity and are not affected by changes in tax rates. To achieve this, national statistical agencies seek to identify any change in national-level indirect taxes including VAT, excise duties, consumption and other specific and special taxes. Under the assumption that any change in tax is fully passed on to the consumer immediately, one can recover the hypothetical underlying producer price in any time period. These producer prices are than grossed up by the various taxes that applied in some reference period to yield the HICP-CT index. The difference in growth rates between the HICP and HICP-CT series in any time period will therefore reflect only the changes in taxes. It’s important to note that these implied values of tax changes will not only encompass instances of VAT changes but of many other ad valorem and specific tax rates as well. We therefore restrict the HICP-CT-derived tax rate change series to include only months in which our own series records a VAT rate change. Despite this restriction, we would not necessarily expect perfect correlation between the two measures even absent any measurement error due to erroneous matching of rates and consumption category since VAT reform episodes can occur simultaneously with other changes in indirect tax rates. The HICP-CT is calculated as a Laspeyres-type index defined as follows in period :
HICP-CT1 11 1
where is the hypothetical producer price (recovered from the consumer price by assuming full and instantaneous pass through) of sub-item in current period . This producer price is multiplied by the VAT rate that was applicable during a reference period 0, an ad valorem sales tax rate and is increased by any specific tax . The term is the actual producer price of the sub-item in reference period 0 and is the consumption weight of all sub-items belonging to a COICOP category. Note that the HICP-CT differs from the standard HICP index as the latter uses tax rates that apply in current period in the numerator. Denoting the weighted average pre-VAT (but inclusive of other indirect taxes) price 1 and assuming all the the sub-items in a given COICOP category are taxed at the same tax rates (VAT and others), we can write the HICP-CT and HICP as
HICP-CT ,andHICP11
The two series will therefore only differ in months when a tax change occurs, leading to be different from . Relaxing the assumptions of uniform VAT and other taxes within a same COICOP category would imply different values for , and . However, as long as changes in VAT rates are not systematically correlated with these deviations, the HICP-CT series should constitute a suitable instrument for our own VAT reform measure.

41
Appendix B: The Elasticity of Substitution and Derivation of Equation (5) Denoting compensated demands for the two goods by , , where ≡ / and u denotes utility, we define the elasticity of substitution between them as
≡/
. A. 1
Differentiating gives
A. 2
A. 3
1 A. 4
A. 5
where (A.3) uses symmetry of compensated demand effects, (A.4) homogeneity of degree zero of compensated demands, and M in (A.5) denotes income. Expressed in terms of compensated elasticities and budget shares, (A.5) implies (using symmetry for the first equality and homogeneity of degree zero for the second) that
, 1,2and . A. 6
Using the Slutsky equation / / / in (A.6) then gives, for 1,2
, ; . A. 7 To derive equation (5), substitute from (A.7) into (3) to give, assuming ,
. A. 8
Multiplying the bracketed term through by , the terms in
cancel, leaving
η. A. 9
The result follows on noting, using the implication of adding up that 1, that the denominator simplifies to 1 and the numerator can be written as 1 .