ethos consulting - fire and emergency new zealand · ethos consulting the focus of this research...
TRANSCRIPT

DIFFERENTIATING STRONG AND STRUGGLING VOLUNTEER BRIGADES Ethos Consulting
The focus of this research was to identify the key factors that
differentiate strong and struggling volunteer brigades. The
research indicates that brigades have their own unique set of
characteristics. The research was conducted in three stages:
• interviews and mapping exercises
• development and trialing of the Volunteer Brigade
Profiling tool
• statistical analysis of staffing data
The Volunteer Brigade Profiling tool can be used to support
brigade development especially as this research suggests that
a blanket approach may not be suitable for supporting
volunteer brigade development.
Research funded by the Contestable Research Fund
July 2017

Fire and Emergency New Zealand Research Report Number 150
ISBN Number 978-1-92-728715-6 ISSN Number 1178-3648
© Copyright Fire and Emergency New Zealand
Copyright ©. Except for the Fire and Emergency New Zealand emblem, this copyright work is licensed under the Creative Commons
Attribution 3.0 New Zealand licence. In essence, you are free to copy, distribute and adapt the work, as long as you attribute the
work to Fire and Emergency New Zealand and abide by the other licence terms. To view a copy of this licence, visit
http://creativecommons.org/licenses/by/3.0/nz/. Please note that the Fire and Emergency New Zealand emblem must not be used
in any way which infringes any provision of the Flags, Emblems, and Names Protection Act 1981 or would infringe such provision if
the relevant use occurred within New Zealand. Attribution to the Fire and Emergency New Zealand should be in written form and not
by reproduction of the Fire and Emergency New Zealand emblem.
Differentiating Strong and Struggling Volunteer
Brigades
Contestable Research Fund
New Zealand Fire Service
Research Report
Ethos Consulting Group

Abstract
The focus of this research was to identify the key factors that differentiate strong and
struggling volunteer brigades, then to use these findings to develop a bespoke, brigade
profiling tool for ongoing, developmental, internal use. The research was undertaken in
three phases.
Phase one involved a series of interviews and mapping exercises with 16 internally-
nominated NZFS staff, the criteria for internal selection being that nominated participants
were considered to have both extensive knowledge as well as experience of volunteer
brigades. 220 volunteer brigades were reviewed in this phase. Results showed that
characteristics of all brigades could be mapped within 30 key factors, 14 of which typified
strong brigades, whereas 16 differentiating factors were identified as typifying brigades
which were seen to be struggling.
Phase two involved the development and trialling of the Volunteer Brigade Profiler tool
(VBP) based on the findings in phase one. A total of 94 brigades were profiled with this tool
by 15 internally-nominated NZFS staff. Results showed that no brigades profiled exactly the
same, regardless of whether they were identified in either the strong or struggling groups.
What was clear however was that each brigade had its own particular set of characteristics.
This emphasised the need for brigades to be understood as unique units, and in going
forward suggests a blanket policy may not be a suitable approach to either the management
or development of volunteer brigades.
Phase three involved an extensive statistical analysis of internally-held data on current
staffing, including the Dashboard. Results showed that data gathered from the Dashboard
and the VBP trials had no strong correlation in that they appeared to be measuring different
elements of a brigade. The internal data gathered currently by NZFS via the Dashboard
system seems to measure performance outputs, whereas the VBP identifies the underlying
factors that influence that performance. It is therefore suggested that well-rounded insight
into brigades could be gained from using both in conjunction with each other.
Table of Contents
Introduction and Acknowledgements
Volunteer fire brigades in context – challenges now and into the future 1
Focus and goals of this research 4
Phase 1: Differentiating Strong and Struggling Brigades 6
Methodology 6
Results
Factors from mapping analysis: Strong brigades 14
Factors from mapping analysis: Struggling brigades 23
Phase 2: Online questionnaire – the Volunteer Brigade Profiler 38
Methodology 41
Results 41
Comments section 50
Phase 3 Analysis of existing quantitative data 65
Considerations and conclusions 83

Introduction and acknowledgements
The New Zealand Fire Service (NZFS) has more than eight thousand volunteers serving in
nearly 400 brigades nationwide. Their highly valued contribution to New Zealand is vital,
covering emergency response services across a wide range of situations. Volunteer brigades
are often comprised of long standing members, in several cases inter-generational. For
many volunteers, being a fire fighter is a strong part of their personal identity, it’s ‘in their
blood’ and their service to their community is rightfully felt as a source of pride. While
brigades are comprised of different people from all walks of life in a wide range of different
geographic locations, they are bound by the overall unifying purpose of providing effective
emergency response. The unpredictability and urgency of varying emergency call-outs
require a brigade to be a highly effective unit, dealing with complex, dangerous and
sometimes life-threatening situations. Few other volunteer groups face such challenges.
Unity of purpose doesn’t necessarily equate to unity of performance, however, and
volunteer brigades, like any other groups, vary in terms of capability, functioning and
performance. The focus of this research is to identify reasons behind this variance. What are
the contributing factors that differentiate strong and high-performing volunteer brigades
from those that are seen as struggling? This is a complex question but an important one,
given the essential role brigades play within our communities. The following report is the
result of an 18-month study that investigates this question in depth from different
perspectives.
This report is presented in three sections reflecting each phase of the research. The first
section presents a multi-method research process of understanding how brigade experts
map brigades and differentiate between high functioning and struggling brigades, eliciting
their observations through structured interviews.
Section Two presents an overview into the development and application of a NZFS volunteer
brigade-specific profiling measure, the Volunteer Brigade Profiler (VBP). The VBP is the
psychometric culmination of the material from section one.
Section Three looks at data collected from the NZFS Dashboard and other available sources.
The Dashboard monitors a range of brigade composition and performance indicators. The
analysis presented here looks at statistical associations among Dashboard indicators and
brigade activities, and possible relationships to overall performance. This analysis was
carried out with considerable academic, statistical rigor. We have, however, endeavoured to
present this complex analysis in as easy a form to understand as possible.
We believe the real value of this research is its ongoing developmental application through
the implementation and use of the VBP measure. Often research becomes a report that sits
on a book shelf gathering dust with minimal effect. Our goal from the outset was to develop
the findings of this project into a psychometric instrument that will allow ongoing
monitoring of brigades and enable the NZFS to clearly identify the underlying factors that
are contributing to the success or struggles any individual volunteer brigade is experiencing
at any given time, and to use the same tool to also be able to monitor changes over time.
Research of this design is strongly dependent on the quality of insight provided by key
informants. In this respect we are indebted to all the staff of the NZFS who were internally
nominated to contribute to this project. It was a pleasure working with every one of you and
we thank you for your time and commitment.
Dr David Bimler
Dr Jeff Simpson
Penny Brander

Volunteer fire brigades in context – challenges now and into the future
Volunteer fire brigades have a long history in New Zealand communities, with the first
volunteer brigade established in Auckland in 1854. Identification with the NZFS is part of
this country’s culture and in the conscious psyche of many New Zealanders. Most NZ
children will have experienced school or pre-school visits to their local station or had fire
fighters visit their classroom to talk about fire safety. Many NZ secondary schools have
NZFS staff visit as part of career days. The NZFS has a presence. In a way this isn’t surprising
due to the numbers of people associated, particularly as volunteers. Volunteers make up
80% of the NZFS workforce. There are 8,100 volunteers and 350 volunteer stations
throughout New Zealand, including some of our most northern communities such as Kaitaia,
as far south as Stewart Island, as far east as the Chatham Islands and as far west as Karamea
and Westport.
A strong volunteer base is therefore absolutely fundamental to New Zealand’s ability to
effectively respond to emergencies in local communities throughout the entire country.
Supporting volunteers in the fire services is a strategic priority and understandably one of
the major focus areas for the NZFS.
Challenges
As with almost any volunteer organisation, attracting and retaining suitable members can be
difficult. However, the volunteer landscape in fire services is undoubtedly of greater
complexity than most. Compared to other voluntary organisations, the NZFS places greater
demands on its volunteers by:
The unpredictability of call outs – when, duration and type
The need for and commitment to ongoing training and skills maintenance
Volunteers often being in unpredictable and dangerous situations
Many voluntary brigades being in remote communities with small population bases from
which to source members
2
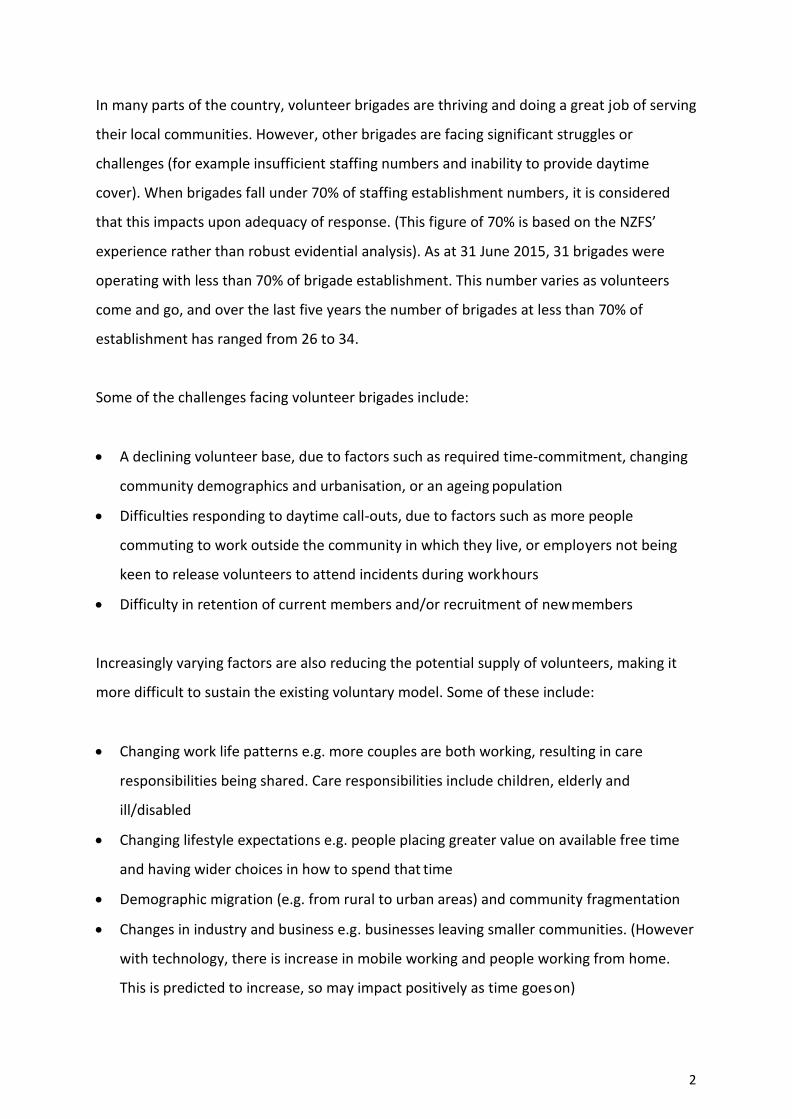
In many parts of the country, volunteer brigades are thriving and doing a great job of serving
their local communities. However, other brigades are facing significant struggles or
challenges (for example insufficient staffing numbers and inability to provide daytime
cover). When brigades fall under 70% of staffing establishment numbers, it is considered
that this impacts upon adequacy of response. (This figure of 70% is based on the NZFS’
experience rather than robust evidential analysis). As at 31 June 2015, 31 brigades were
operating with less than 70% of brigade establishment. This number varies as volunteers
come and go, and over the last five years the number of brigades at less than 70% of
establishment has ranged from 26 to 34.
Some of the challenges facing volunteer brigades include:
A declining volunteer base, due to factors such as required time-commitment, changing
community demographics and urbanisation, or an ageing population
Difficulties responding to daytime call-outs, due to factors such as more people
commuting to work outside the community in which they live, or employers not being
keen to release volunteers to attend incidents during work hours
Difficulty in retention of current members and/or recruitment of new members
Increasingly varying factors are also reducing the potential supply of volunteers, making it
more difficult to sustain the existing voluntary model. Some of these include:
Changing work life patterns e.g. more couples are both working, resulting in care
responsibilities being shared. Care responsibilities include children, elderly and
ill/disabled
Changing lifestyle expectations e.g. people placing greater value on available free time
and having wider choices in how to spend that time
Demographic migration (e.g. from rural to urban areas) and community fragmentation
Changes in industry and business e.g. businesses leaving smaller communities. (However
with technology, there is increase in mobile working and people working from home.
This is predicted to increase, so may impact positively as time goes on)

3
Technological advancements in industry, manufacturing, agriculture and horticulture e.g.
robotics replacing manual labour
Increased time requirements of volunteering in Fire Services, which is impacting on the
pool of volunteers and people’s ability to commit to being a member of a voluntary
brigade (e.g. the broadening range of calls – means more callouts and increased training
requirements, increased standards and expectations resulting in more
compliance/administration requirements.)
Over the years, various interventions have been put in place to better support volunteers,
but many of the issues with recruiting, retaining and supporting volunteers remain. The
NZFS has data and information on factors (e.g. community demographic change, brigade
leadership) that impact brigade performance and strength. However, there are cases where
some brigades are thriving despite the presence of factors NZFS consider should be
negatively impacting on their performance and strength and vice versa. The challenges
facing volunteer brigades and their ‘strength’ are complex. Some are within the NZFS’s
control (e.g. developing systems and processes to reduce administration, providing IT
support and equipment, recruitment support, providing training etc., support for employers
of the NZFS volunteers) but some are outside the NZFS’s control (e.g. community
demographic change, socio-economic factors, presence of local industry/employment).
Complex issues or problems are not always able to be quickly or easily resolved. They need
to be understood in-depth from a non-biased, objective viewpoint. Sometimes, in complex
situations, too much data can lead to cluttered confusion. A good starting point is to
understand what NZFS can and can’t control. As indicated above, the range of influences
and pressure points appear numerous. This research was undertaken to identify and hone in
on the areas on which the NZFS should focus.
4
Focus and goals of this research
This research project is simply titled “Differentiating Strong and Struggling Brigades” but the
complex process of understanding what actually differentiates brigades requires rigour. It is
doubtful that any two brigades are exactly the same in terms of their dynamics,
membership or experience level. There will be variance in the types of callouts they attend,
e.g. medical, forestry, and highway/motor vehicle. The communities they serve can also
vary greatly in terms of size, location, prosperity, demographic, people resources, education
levels and population fluctuations, to mention just a few. There are numerous potential
influences that could determine how successfully or otherwise a brigade operates. It is
important to note that as researchers, we took a ‘zero assumption’ approach to the
distinguishing qualities of high-performing and struggling brigades. We did not set out to
test or follow any pre-existing hypotheses or suggested ideas, nor did we endeavour to
confirm or replicate any results from existing research. We have instead applied an
independent, comprehensive and in-depth methodology to guide the process throughout.
The reasons behind why some brigades are considered strong and high-performing while
others are deemed to be struggling are likely to be as varied in nature as the brigades
themselves and it is therefore important not to make assumptions or draw overly-simplistic
conclusions. For example, Brigade A may be fully staffed and performing well, whereas
Brigade C struggling for membership numbers may not be performing well. It would
therefore be easy to assume that a full complement of staff is a key indicating factor of
performance success. However, on further investigation we could also find this assumption
is not always necessarily applicable, and that not all brigades with a full staffing complement
are strong/highly functioning. Likewise, we may equally find that not all brigades with low
memberships are actually under-performing and, even though they may be struggling in
terms of numbers, they are performing their duties well. It could also be assumed that a
brigade that has a high community presence is a key predictor to brigade strength but then
find that this does not necessarily mean they are attracting membership. There are a wide
range of possibilities and variables that affect brigades and even more importantly, those
influences may not be static. We cannot ever say the current state of a brigade is its

5
permanent state; hence our goal of creating a tool that can be used in an ongoing,
developmental application.
Our role in this research is to identify the key, core influences that have the greatest impact
on brigades. We take a wide investigative approach to endeavour to create a map/menu of
the range of key themes that affect a broad section of brigades across New Zealand. Due to
brigade diversity, the potential themes will be wide-ranging and not applicable to all
individual brigades, but the goal is to create an overall map that is broad enough to
incorporate the relevant characteristics of any volunteer brigade. Once created, it forms the
basis of our second key goal, the creation of a measure/metric that is completely centric to
the NZFS Volunteer Brigades. This is where the research becomes applied and usable
beyond this project/report. Any volunteer brigade will be able to be profiled to identify the
key elements that influence its functioning, and then re-profiled over time to observe any
changes. We see this as a key output of this project. In summary, this research will
incorporate the following three phases:
Phase One
The use of multi-dimensional methodology (Andmapping) to identify key
themes that differentiate strong and struggling brigades
Phase Two
Create a profiling tool that encapsulates those key themes
Trial the profiling tool with brigades and analysis outputs
Phase Three
Undertake statistical analysis on Dashboard data and investigate
relationship, if any with mapping and profiling process
6
Phase 1: Differentiating Strong and Struggling Brigades
Methodology
One of the objectives of this project was to obtain insights into how high-performing
brigades and struggling brigades differed from one another. The aim was to investigate and
identify the key dimensions that separate brigade performance. An additional focus was to
also investigate the variance within brigade groups, for example, are all strong brigades
strong for the same reasons? Likewise, do struggling brigades all have core similarities or
does each strong or struggling brigade have unique contributing characteristics that are
unrelated to other brigades?
From an organisational development perspective, such insights could help direct where to
best allocate resources, particularly when working with struggling brigades. If for example
struggling brigades are struggling for similar reasons, a general blanket approach of
developmental assistance would be advantageous. If, however, struggling brigades
significantly differ from each other, a more individually targeted approach focusing on the
unique aspects of that brigade would potentially be more beneficial.
Phase one of the project began with a series of interviews and exercises with NZFS
leadership staff considered by NZFS to have both extensive experience of and insights into
volunteer brigades. These participants were nominated by NZFS as being people whose
perspectives were considered to be of high value. In total, 16 participants were involved
with this phase. Three were staff from the NZFS National Headquarters while the remaining
13 were nominated from a spread of regions.
The National Headquarters participants were interviewed by the Research team and
provided their general perspectives of volunteer brigades, focusing on what they believed
characterised higher performing and struggling brigades. The 13 participants from other
regions undertook a more in-depth methodology which will be briefly outlined below. The
responses from both participant groups were included in the data analysis.

7
A number of research and statistical methods were used in this project including
multidimensional scaling, factor analysis and narrative analysis. The combination of
multidimensional scaling and subsequent interviewing of participants we term as
‘AndMapping’. These are all complex methodologies and an extensive technical description
of each goes beyond the purpose of this section; however, these methodologies are
commonly used in social science research and were deemed to be best suited to this
project.
Rationale
There are a number of reasons for the use of this particular research methodology, of key
importance being the most suitable fit for purpose, i.e. to address the complexity of the task
of identifying what differentiates between strong and struggling brigades. The method of
differentiation is a very effective way of getting to the core of understanding the variation
between constructs, in this case brigades. As outlined below, this process requires the
participant to differentiate between brigades, not merely describe them in isolation. This is
a complex and cognitively more demanding task, requiring deep consideration. It provides
the best opportunity to produce a more measured, focused, in-depth, quality of response,
not obtainable by simply asking a participant to describe or rate a brigade’s performance in
isolation. As the participants in this process were nominated based on extensive
experiences and expertise in volunteer brigades, it was important to this research that we
fully tap into their specialist knowledge of what differentiates brigades. The key
differentiating components as identified by these participants created the lists of critical
items used to develop the Volunteer Brigade Profiler (VBP) in phase two of this research. By
using direct quotes in the natural, organisational language from participants, the content
validity of the VBP was ensured. The items included in the profile questionnaire would be
understood by informed internal users, as well as relevant to what the instrument was
actually aiming to measure. As the VBP was a three- way forced- choice questionnaire, it
was imperative the items were valid. This is discussed further in phase two of this report.
Multidimensional scaling is, in short, the initial visual representation or map of those

8
differentiations (see figure 2, page 10), often referred to as ‘information-visualisation’. This
mapping display is easier to understand than a series of statistical charts, although statistical
procedures strongly underlie the creation of the resulting visual map.
Process
Data and information was collected from the regional participants in the following two
steps.
Step one
Participants were asked to provide a list of brigades within their region they knew and
understood thoroughly. The number of brigades provided by each participant ranged
between twelve and twenty-six. The brigades were loaded into an on-line sorting exercise
for that participant to undertake.
The participant was presented with the following instructions:
Thank you for providing your list of brigades. A number of unique triads (groups of three) of
brigade names have been selected from this list and are presented on the linked site. Each
name will occur several times, but each time in a different grouping. (Each name has also
been assigned a number in front of it for our computer programme, but just ignore the
numbers as you focus on your selections.)
For every triad, choose the one brigade you consider most different from the remaining two
according to some criterion. Think about these three brigades in terms of your knowledge
surrounding their general work culture, competencies, community engagement, morale,
situation, leadership etc. For each of your decisions, you may change the criteria applied for
making your choice. (For this sorting exercise, we do not need to be informed of the bases
for making these choices).
9
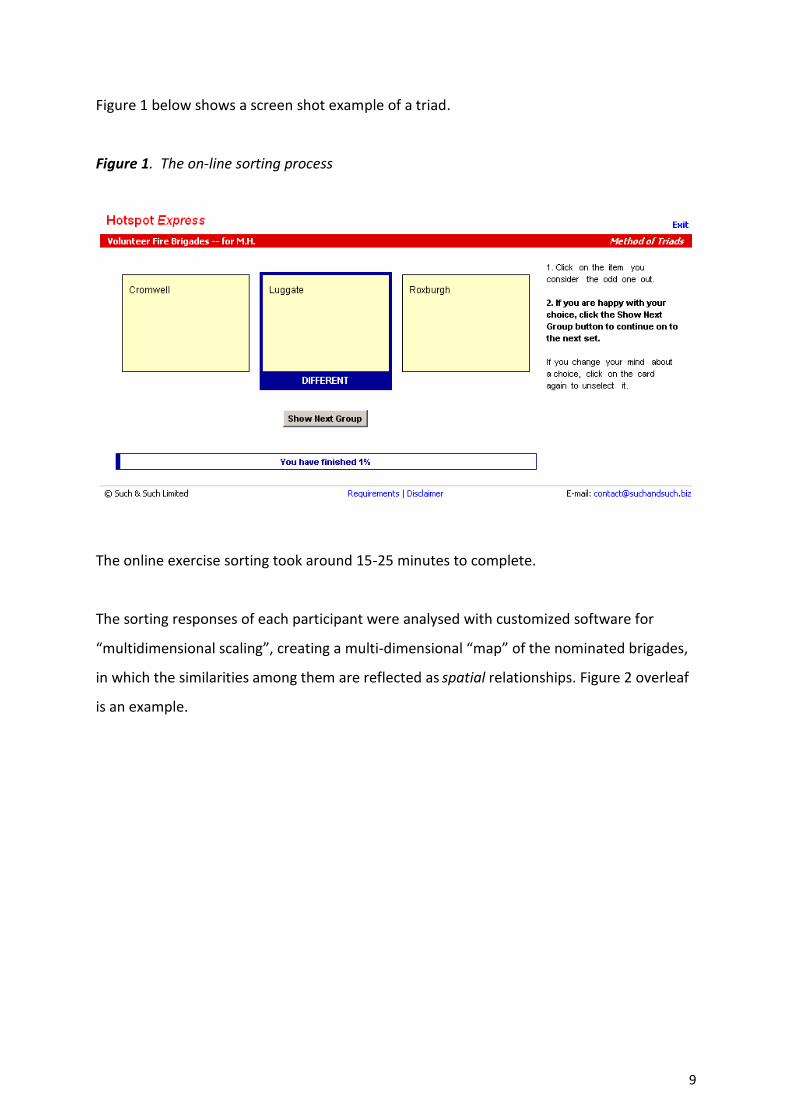
Figure 1 below shows a screen shot example of a triad.
Figure 1. The on-line sorting process
The online exercise sorting took around 15-25 minutes to complete.
The sorting responses of each participant were analysed with customized software for
“multidimensional scaling”, creating a multi-dimensional “map” of the nominated brigades,
in which the similarities among them are reflected as spatial relationships. Figure 2 overleaf
is an example.
10
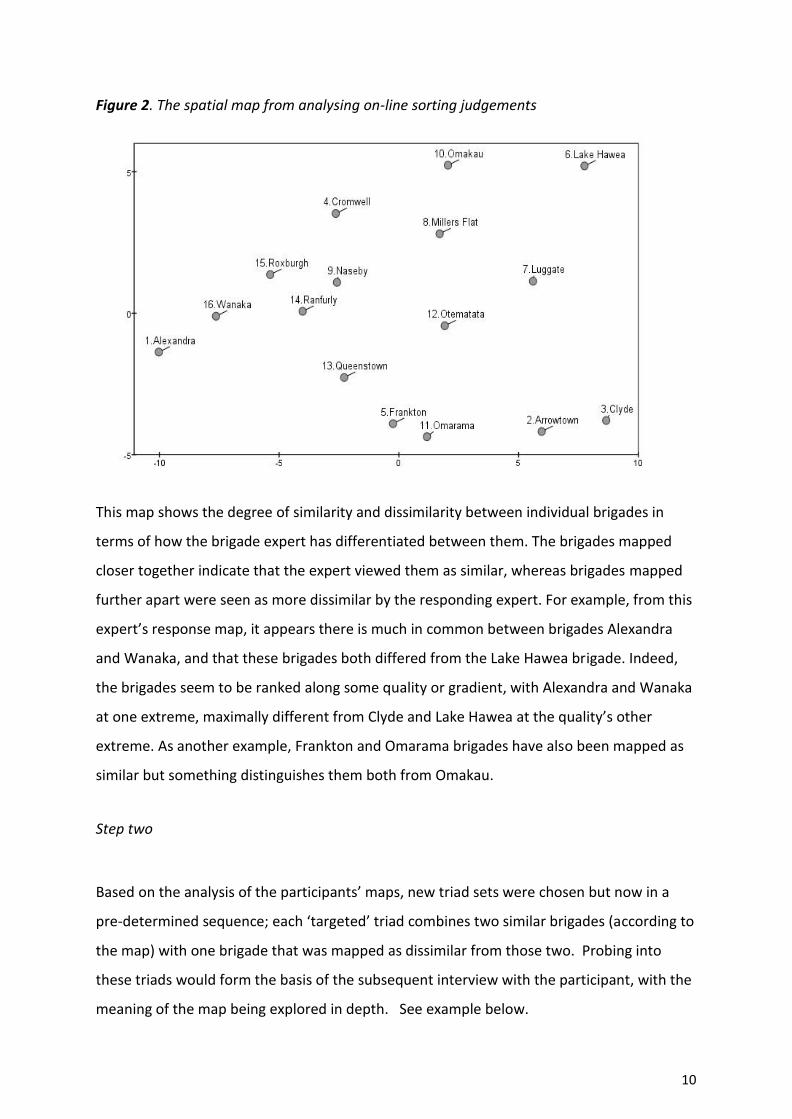
Figure 2. The spatial map from analysing on-line sorting judgements
This map shows the degree of similarity and dissimilarity between individual brigades in
terms of how the brigade expert has differentiated between them. The brigades mapped
closer together indicate that the expert viewed them as similar, whereas brigades mapped
further apart were seen as more dissimilar by the responding expert. For example, from this
expert’s response map, it appears there is much in common between brigades Alexandra
and Wanaka, and that these brigades both differed from the Lake Hawea brigade. Indeed,
the brigades seem to be ranked along some quality or gradient, with Alexandra and Wanaka
at one extreme, maximally different from Clyde and Lake Hawea at the quality’s other
extreme. As another example, Frankton and Omarama brigades have also been mapped as
similar but something distinguishes them both from Omakau.
Step two
Based on the analysis of the participants’ maps, new triad sets were chosen but now in a
pre-determined sequence; each ‘targeted’ triad combines two similar brigades (according to
the map) with one brigade that was mapped as dissimilar from those two. Probing into
these triads would form the basis of the subsequent interview with the participant, with the
meaning of the map being explored in depth. See example below.
11
Set one
1. Alexandra
6. Lake Hawea
16. Wanaka
Set two
2. Arrowtown
3. Clyde
4. Cromwell
This sequence was repeated until all brigades within a participant’s map were included in
various combinations.
Each participant was interviewed either face-to-face or by video conference. For each triad
in turn, the task for the brigade expert was to consider and explain what it was that
differentiated one brigade from the other two brigades – which was the odd-one-out, and
why? Did the other two brigades have features in common? It was expected, and was
generally the case, that the “odd one out” selected by the expert in each triad set during the
interview was also the brigade that was spatially furthest away from the other two following
the interviewee’s initial sorting in step one. Recall that the triadic context for each brigade
was ‘targeted’ to focus attention on especially stark oppositions among them. All responses
and descriptions given by the brigade expert were recorded by two interviewers.
Having described what differentiated the individually selected brigades, a second stage of
the interview asked the brigade expert to look at groups of brigades in terms of similarities
as well as differences. For all of the brigades under review, participants were asked to sort
them into three ranked sub-groups as follows: the ‘A group’ – consisting of the brigades
they perceived to be highest functioning; a ‘B group’; and a ‘C group’ – consisting of the
brigades they perceived to be struggling in some way. Usually these three ranks could be
recognised as spatially distinct regions of the ‘map’.
They were then asked to identify and describe the common themes within each group, for

12
example, what is common among all the brigades within your C group? What ties them
together? What are the things that differ between the brigades within the C group, what is
the variance? The same questions were asked of the A and B brigade groups. The final task
was to describe what significant differences the participant could identify between their ‘A
group’ and their ‘C group’.
As mentioned earlier, the task for the participants was cognitively very demanding. The
emphasis was on differentiating between brigades – not merely by describing brigades in
isolation, but in identifying in what way(s) they were different. The map created from their
initial sorting exercise (figure 3, page 23) provides an indication of the degree of difference
but the subsequent interview described above provided the context(s) for those differences.
While differentiating between brigades can be a complex task for a participant, it is also rich
in terms of information quality. The task of differentiating requires a lot of thought and
consideration. It was therefore of utmost importance that participants had extensive
knowledge of the brigades within their region and it was this criterion that guided NZFS’s
participant selection for this phase of the research.
Across the data collection process, 220 brigades in total were discussed and differentiated
by participants. Close textual scrutiny of the phrases they used yielded approximately 500
descriptions (items) deemed suitable for the next phase of data analysis. From a research
perspective this was a high number of items, but it also reflected the wealth and depth of
knowledge participants had on their brigades. In effect, participants provided us with a rich
vocabulary of “statements that can be made about volunteer brigades”. The goal of the
subsequent analysis was to bring this vocabulary down to manageable proportions.
While participants were usually reviewing different brigades, from their own perspective, a
number of descriptions were replicated among them as they differentiated between
struggling and high performance. In a number of steps, we identified recurring themes
within the phrases and sentences, and looked for relationships among those themes.
It was found that statements characterising high-performing brigades could be clustered
into fourteen themes, and struggling brigades into sixteen. It is important to note that not
13
all high performing brigades displayed all fourteen elements, and not all struggling brigades
could be characterised by all sixteen negative elements. However, these clusters cover the
full range of descriptors provided at the interviews about the volunteer brigades and what
differentiates between them. They can be likened to a menu that covers all possible
elements. These themes are presented below. The theme headings reflect the most
common descriptor used by participants within a particular cluster. For the sake of
authenticity, no paraphrasing has taken place. These are direct quotes that were repeatedly
used by multiple participants when describing a particular brigade, or a term commonly used
to differentiate between brigades. This applies to all cluster headings. The heading is the
dominant theme. Examples of direct quotes representing the theme are also presented
followed by a short summary of key themes.

14
Results
Factors from Mapping Analysis: Strong Brigades
Professional operational standards
This factor referred to the brigade’s commitment to function at the highest level of
operating standard. They were diligent and took an active responsibility to ensure the
effective and efficient day-to-day running of their brigade. They were up-to-date and
accurate in their administrational processes and seamless in the general running of their
station. Everything was in order. Low error rates were a hall-mark theme of high performing
brigades.
The following were typical statements used by the participants when describing such
brigades.
“Professional – functions like a paid organisation”
“High level operational ability”
“Good systems and processes”
Self-managing / Low- maintenance
Self-managing brigades operate effectively with little need for input from the wider NZFS
and are solid and reliable operators. They do not reject input by NZFS, but are largely
independent and run effectively. The brigade is typified as low fuss, and having low
emotional reactivity. They are described as being stable with a mature leadership group.
The following were typical statements used by the participants when describing such
brigades.
“Very rarely have to step in”
“Don’t cause Fire Service any issues”
“Self- managing brigade”
15
Motivated, engaged brigade
High positive energy and motivation is the key theme of this cluster of descriptions. These
brigades have an interpersonal connectedness about them with a clarity of united purpose
and sense of team. Brigade members appear to be equally engaged with maintenance tasks
within the station as well as with callouts. They express pride in their brigade.
Typical statements used by the participants when describing such brigades:
“Has a high level of engagement across the brigade”
“Impeccable maintenance”
“All members happy to be there and know each other well”
Recruitment success
This theme is based on the positive reputation these brigades have within the community.
They are seen as a good group to be part of and the work undertaken viewed as important
and meaningful. This is particularly advantageous in brigades where the quality of recruit is
high – i.e. where there are skilled people wanting to join. In addition, the positive reputation
of the chiefs within these brigades has a high impact on their positive reputation.
Typical statements used by the participants when describing such brigades:
“Brigade attracts members easily”
“Has a waiting list”
“People keen to join because they hear good things”
Rural / remote
Remote/ isolated brigades tend to be made up of people with similar backgrounds and often
have their own sense of collective identity and common unity. Supporting one’s neighbour is
a key theme. High-performing rural brigades are also effective due to their volunteers’
relevant skill sets, which they employ in their own practical day to day work.
Typical statements used by the participants when describing such brigades:
16
“Geographically isolated but robust and self-sufficient”
“Small, remote rural community but high performers”
“All members are farmers”
Community Involvement
This theme related to the integration of the station within the community, as well as the
status in which the brigade is held. High-performing brigades were defined as being visible
and broadly involved within their community. They were highly valued for their contribution
to that community.
Typical statements used by the participants when describing such brigades:
“Strong employer support – gives time off for training and call outs”
“High profile station within community”
“Good community buy-in, well integrated into the community”
Chief’s occupational status
This refers to the higher-level managerial and leadership skills chiefs use in their day jobs
and how these skills are then successfully applied within their brigade. Their success as
leaders (including those who are self-employed and run their own business) is very relevant
and applicable to their role as brigade chiefs.
Typical statements used by the participants when describing such brigades:
“Chief works in high-management position in day job”
“Chief also a community leader”
“Chief is a successful self-employed business owner”
Leadership attributes/characteristics
This theme collected the highest number of descriptive items of all areas discussed by
participants. It refers to the general leadership ability in influencing the successful
performance of the brigade. High-performing leaders take responsibility for their role. They

17
are realistic, balanced and set high standards with clear vision.
Typical statements used by the participants when describing such brigades:
“Very proactive leadership”
“Capable, competent and effective”
“Chief has good understanding of what is and isn’t possible”
Chief / Deputy dynamic
This refers to the dynamic between the two leaders of the brigade and its wider effect on
the brigade’s performance. It is important to note that this isn’t necessarily one of
friendship, but one that operates with a professional efficiency. Whether there is an
interpersonal closeness or not, it doesn’t affect or be allowed to affect the wider brigade’s
functioning.
Typical statements used by the participants when describing such brigades:
“Chief and Deputy get on very well”
“Deputy respects Chief and keeps him up to date”
“Some issues at times between Chief and Deputy”
Good succession planning
This theme refers to the emphasis of actively developing future potential within the brigade
– the systematic process of ensuring all future contingencies are covered. This was a
prominent theme within the characteristics of high-performing brigades.
Typical statements used by the participants when describing such brigades
“Brigade’s succession is seamless”
“Great progression structure”
“Chief could leave tomorrow and brigade would be alright”

18
Strong leadership group
This refers to the strong alignment within the brigade leadership group. They are typified by
mutual respect, consistency of approach and goals and a good working knowledge of each
other.
Typical statements used by the participants when describing such brigades:
“Established management team”
“Strategic leadership team”
“Good support team under chief”
Recent brigade improvement
This refers to brigades which have previously been under-performing and problematic but
through effective intervention, particularly around the brigades’ leadership, performance
has been noticeably turned around.
Typical statements used by the participants when describing such brigades:
“New leadership has greatly improved brigade performance”
“Leadership has turned brigade around”
“Used to be under-performing brigade but new leadership has lifted performance”
High callout rates
Brigades with high callouts have the opportunity to maintain and develop their skills
through repetition. Busy brigades tend to be high- performing due to their regular exposure
to emergency situations.
Typical statements used by the participants when describing such brigades:
“Busy station”
“Regular workload”

19
Positive engagement to NZFS
This refers to the positive interaction a brigade has with the NZFS. Through this there tends
to be a clear understanding of requirements of the brigade and a commitment to high
standards. Both parties feel they can comfortably approach the other.
Typical statements used by the participants when describing such brigades:
“Well informed group who understand requirements of modern NZFS”
“Leadership encompasses where NZFS is going”
“Healthy interaction between paid and volunteer fire fighters”
General Comments on High-Performing Brigade Characteristics
Many of the themes of high- performing brigades are self-explanatory and would be
common across a number of organisations in different sectors. From a mapping perspective,
many of the themes are closely related, for example, “Professional operating standards” and
“Good succession planning” were closely related but still independent themes. Other
themes mapped as less related to each other but still characteristic of high- performing
brigades, for example, “Chief/Deputy dynamic” and “Rural/remote”.
Leadership was the single most-reported theme when participants described and contrasted
brigades across the data collection phase. However, leadership could be broken into a
number of different sub-themes. For example, the occupational status of a brigade chief
was a significant differentiating feature between high and low performing brigades. High
performing brigades appeared to often have chiefs that in their day jobs were employed in
leadership / managerial positions or were successfully self-employed and employers of staff.
This theme was less common with struggling brigades. High-performing brigade chiefs were
often community leaders in terms of having a high community involvement. Many
participants commented that the level of visual presence and the level of respect the chief
had within the community had a bearing as to whether or not people wanted to join that
particular brigade. Reputation matters. Having a highly skilled chief had a positive effect not
only in terms of how a brigade performed but also on how attractive it was to be a part of in
20
terms of recruitment.
From a competency perspective, chiefs of high performing brigades were often described as
having a style that strongly resembled highly effective project managers. They appeared to
be good multi-taskers, understood how to use limited time effectively and manage
resources. They knew how to deliver within the resources they had, which naturally related
with high professional standards within the brigade. The cluster of effective leadership and
professional operating standards not only related strongly to each other but was a major
differentiating factor from struggling brigades.
A corollary of this was a recurring theme in which changing the leadership had an impact by
lifting brigade performance. In some cases, brigades that in the past were considered to be
struggling (C team brigades) were now approaching high performance (A team). This
transformation was typified by having new leadership in place. Replacing a poor-performing
chief with a high-performing one appeared to have a significant positive effect on the
performance of some brigades. Positive change was possible with good selection.
Struggling brigades were not always destined to struggle.
While excellent leadership from a chief was prominent, it was not always a prerequisite of a
high-performing brigade. Some highly functional brigades displayed noticeable tensions
between chief and deputy, though this didn’t appear to spill over beyond that relationship
to wider parts of the brigade. There were also cases where the chief was considered by
some participants as being poor in the role, but the wider leadership team were highly
experienced and effective. Within these brigades, high-performance was based on the
wider collective ability of the leadership group rather than ability of the chief. They were an
effective unit despite the chief.
The “rural/remote” theme is also of interest as two sides of this coin feature in high-
performing and struggling brigades. From a high-performing perspective, being a more
geographically remote brigade, with a smaller pool of potential recruits became a source of
morale and community solidarity rather than leading to struggle. There were a number of

21
remote brigades that were considered high-performing due to the members within that
brigade. This appeared to be most noticeable with brigades made up predominantly of
farmers. They were described as being highly skilled in terms of their practical abilities,
where much of the machinery used during call outs was familiar enough to them in their day
to day work. There was also a strong theme of neighbour looking out for neighbour and
being able to attend call outs when required to.
The “positive engagement with NZFS” theme had a wide-ranging span. It not only referred
to engagement with the organisation but also with other brigades within their region. There
was cooperation, a want to support their neighbouring brigades. During callouts of other
brigades, high-performing brigades would ask “how can we help you”? This was opposed to
an ‘us vs them’ dynamic – a brigade version of a turf war.
Professional operating standards and good succession planning also related not only to
professional performance during callouts but also to the physical presentation of both the
brigade members and the station itself. Participants often commented that you could tell
how good a brigade was by just walking into the station. High-performing brigades had
immaculate stations where everything was clean and in order. There was a pride in the
station itself. High-performing brigades also had high turn-outs for meetings and training,
right down to a sense of pride and belonging displayed by brigade members electing to wear
NZFS- issued clothing to meetings.
Not all high-performing brigades were perfect across the board and some were described by
participants as being sometimes demanding and difficult to deal with, but they still did their
job well. In essence, high-performing brigades were nimble enough to cover their gaps and
those gaps didn’t become weaknesses.
Further mapping analysis showed these 14 factors discussed could be clustered into three
key themes:
1. Leadership
Leadership attributes

22
Chief’s occupational status
Self-managing – low maintenance
Strong leadership group
Positive Chief / Deputy dynamic
Positive engagement to NZFS
2. Brigade Culture
Motivated – engaged
Recent improvement
Recruitment success*
Professional operating standards
Succession planning
3. Community Involvement
High community involvement
Recruitment success*
Rural – remote
High callout rates
* Recruitment success related strongly to both brigade culture and community involvement
Figure 3. Summary of the key factors of strong brigades

23
Factors from Mapping Analysis: Struggling Brigades
Unstructured practices
This is a broad- ranging theme characterised by unstructured practices and a generally
unprofessional approach. These brigades tended to work their own way with a “she’ll be
right” attitude. Their protocols at callout were loose and they tended to charge on in rather
than properly evaluate situations. Whilst there appeared to be some level of camaraderie
within such brigades, it was seen as more social rather than that of a serious emergency
provider. Brigades within this profile tended to have a reasonably long history of this
culture.
What makes such brigades a risk is not only in their poor practice, seriously putting
themselves and others in danger at emergency callouts, but also they can be seen as a
‘closed shop’ and an unattractive group to join. Membership will be desirable only to those
who fit these brigades’ cultural profile, thus a lack of membership-diversity limits the
brigades’ adaptive potential.
Common descriptions of these brigades were;
“Independent to level of lone cowboys”
“Culture of its own – cavalier – don’t follow policy”
“Chief disregards NZFS requirements”
“Boys’ club”
“Drinking culture”
Change resistant brigade
Brigades that fell within this theme were typified by a resistance to new ideas and ways of
doing things, blocking any consideration to ways that may potentially improve performance.
The attitude of such brigades (of the chief particularly) was one of “if it’s not broken why fix
it?” or “this is the way we have always done it so there is no need to change”.
In reality most things can be improved and few things stay static. Technological advances

24
and organisational development assist performance. Being closed-off to change or
advancement limits the scope of a brigade’s ability to adapt, grow and improve. In addition
it limits the development of the brigade members. It is at the opposite end of proactive
open-mindedness.
Common descriptions of these brigades were;
“Set in their ways, resistant to change”
“Very old style leadership”
“Very regimented”
Low callout rates
This is a self-explanatory theme which highlights that some brigades are simply not very
busy. A lack of regular callouts reduces the opportunity to hone skills. It also doesn’t provide
enough real-life situations to learn to operate as an effective team under such
circumstances. While practice is important, having nothing to practice for can potentially
reduce motivation for practice. Lack of regular, cohesive practice coupled with lack of actual
experience makes it difficult to equip volunteers with the necessary skills to deal with
unfamiliar emergency situations.
Common descriptions of these brigades were;
“Low callout rates”
“Operate in narrow callout requirements – i.e. scrub fires”
“Lack of practice due to few fires”
“Only train once a month”
Remote community
Geographical isolation inhibited some brigades’ connectedness to NZFS and also limited
their capacity to build a strong and skilled brigade based on the demographic make-up of
the community. Often members were located far from each other and had limited access to
technology. Building an available and coherent brigade is important to responding to
25
emergency callouts. Due to the geographic nature of some brigades, this is very difficult to
execute effectively.
Common descriptions of these brigades were;
“Very isolated”
“Community geography spread”
“Remote location”
Limited recruitment pool
Some brigades simply don’t have a critical mass of people within their community who are
deemed suitable by NZFS to be members, or for some, the community itself is diminishing in
terms of residential population.
There is also a reality that not all communities are the same or have the same pool of
potential members to call upon. Although the NZFS has what appear to be very sound
criteria around those who can qualify to join as volunteers, some of the research
participants talked of the criteria needing to be lowered in some circumstances, to increase
the number of potential members able to join their local brigade. They felt that the ‘One
size fits all’ recruitment policy simply cannot be applied to all communities. Such
communities had brigades struggling to get a full complement of members, but actually did
have sufficient numbers of people within the community who were keen and available to
train to become members. They didn’t however fit the required criteria to join, for various
reasons.
In dropping a recruitment standard, an organisation runs a major risk of lowered
performance, which in turn has potentially critical implications around the delivery of
emergency services. Analysis of the Dashboard data shows that having a full complement
within a brigade relates to high performance. Lowering the complement can (but does not
always) relate to a brigade struggling. This presents a challenging dilemma.
For example, from a community perspective it is better to have unemployed and lower

26
educated people doing something positive and contributing to their community, rather than
doing nothing or being excluded. For these people it could also be an opportunity to build
their skills and have a focus that could potentially make them more employable in their
future. Training as a volunteer fire fighter is a hugely positive step. However, it is
questionable whether it is the role of the NZFS to be an educational provider to those who
don’t fit the criteria for membership. There is no guarantee that these people could be
capable of working successfully within a brigade, even with all the training and positive good
will.
If exceptions were to be made to allow people to train and potentially join a brigade due to
severe brigade shortage within a community, it would be critical that the brigade leadership
is of a very high standard. Lesser- skilled people have potential to grow with very good
leadership around them. A poor leadership standard in charge of lower- skilled people
seldom ends well.
Common descriptions of these brigades/communities were:
“Derelict town/town dying”
“Community lacks good range of practical skills”
“Poor recruitment pool to call from – unskilled, uneducated, criminal records”
Members working out of town
Some members are unavailable during normal work hours due to their place of employment
being away from their residential community, leaving few people behind able to attend
callouts during the day.
A common description of these brigades/communities was:
“Members work elsewhere making day time crewing difficult”
Community disconnect
Some brigades were largely invisible within their community or lacked credibility mainly due
27
to the chief and leadership group. Community connectedness is critical in attracting
potential members. If the brigade is largely unknown or not respected within the
community, they are not going attract willing volunteers to join. Similarly, if a brigade is
seen as a closed shop, it will tend to have an aging membership with no new members to
revitalise it. This has a direct implication for contingency planning. As earlier mentioned,
contingency planning is directly related to high-performing brigades.
Common descriptions of these brigades/communities were:
“Total disconnect with their community”
“Chief doesn’t have community support”
“Leadership doesn’t connect with the wider community”
Insufficient skills
This theme refers to the basic inability to lead a brigade. It does not necessarily relate to a
lack of motive or desire to effectively lead, but the actual skill level is at a low level of
development. Leadership is a central theme in terms of brigade performance and has a big
impact. Sub-standard leadership, either based on a lack of skills (the current theme), or in
the following four themes, basic inability, toxic leadership style, rigidity, and a lack of
delegation, all strongly relate to poor brigade performance. All reflect poor leadership
practice, though are different in their delivery. This is discussed later in the chapter. In
general, poor leadership relates to poor brigade functioning, though as noted previously
there are exceptions where a brigade can perform successfully despite their chief.
Common descriptions of these brigades were:
“Senior officers don’t have the skills to develop brigade” (this was a common comment)
“Lack of genuine management skills”
“Lack of overall skills within brigade but could improve with training”
Low leadership accountability
The key element of this theme is a chief not taking responsibility for their role as director of
28
operations. In some cases, it is due to a chief taking too much of a ‘hands on’ approach to
the role rather than directing operations, effectively communicating across the brigade and
ensuring the development of others.
Common descriptions of these brigades were:
“Chief won’t stand back and take a leadership role”
“Poor leadership”
“Chief cannot communicate requirements”
Autocratic leadership
Dominance and power are the central themes under this heading. In such brigades the chief
is too central and negative a figure within the brigade.
Common descriptions of these brigades were:
“Chief is overly aggressive”
“Chief is a bully”
“Autocratic, controlling chief – is a one-man band”
Inflexible leadership
This theme was typified by chiefs exhibiting an unbending and narrow range of operational
scope. They view change as a threat to their established status quo. Although closely related
to the ‘old school’ practice theme, chiefs who come under this theme do not necessarily just
base their style on the way things have always been historically, as in the way of the ‘old
school’ chief, but more exhibit a combination of a personal need for power and influence
together with an inflexible personality style.
Common descriptions of these brigades were:
“Chief very closed off to new ideas”
“Chief resisting moving with organisational change”

29
“Chief negatively questions – why should I have to do that”
No delegation
This theme is typified by the chiefs’ lack of information-sharing and/or responsibility-
sharing in order to maintain their position of power over the brigade. These chiefs often
justify such a stance as not wanting to burden others with responsibility they see as theirs to
manage.
Common descriptions of these brigades were:
“Chief doesn’t delegate”
“Chief keeps all information to himself”
“Chief sees up-skilling of members as a threat”
Low brigade sustainability
This theme reflects a lack of emphasise on future planning by brigade leadership. Such
brigades are vulnerable, if, for example, key members either leave or retire and have no
transition plans in place to cover for these eventualities.
Common descriptions of these brigades were:
“No sustainability systems in place”
“No progression system in place” (this statement was repeated a number of times by
different participants)
Lack of robust systems and processes
Brigades characterised within this theme tended to be viewed as operationally ill-
disciplined or lazy, scattered and ad-hoc in their approach. There are numerous risks
associated with poor operational management. A brigade cannot function to anywhere near
its full delivery potential if it is disorganised. This is a clear theme among brigades.
Common descriptions of these brigades were:
30
“Operationally weak”
“Poor management of people resources”
“Disorganised brigade”
Interpersonal conflict
While in some cases a degree of tension, if managed properly, can lift a team’s performance
it can also inhibit it. Brigades identified as having a culture of interpersonal conflict strongly
related with poorer performance. Brigades which fell under this theme had a culture which
was very much dominated by interpersonal conflict, some which had been ongoing for many
years. In some brigades, research participants saw this as being the result of weak
leadership, with the chief lacking the courage to step in and sort it out. In other brigades the
chief was seen as the antagonist and cause of conflict.
Brigades, like any group, thrive on a positive and cohesive culture. Where there is ongoing
conflict, there will be division within the group. It fosters an ‘us versus them’ or ‘in-group’
versus ‘out-group’ sub-culture, where members feel they either have to take sides or run
the risk of isolation. Neither option provides an environment for positive brigade
engagement or development.
Common descriptions of these brigades were:
“Personality issues within leadership group”
“Long-held festering historic issues”
“Conflict with paid staff”
“Union has strong negative influence”
Low autonomy
This theme refers to the degree of support a brigade requires either from the NZFS or from
other surrounding brigades. Reasons largely due to either a lack of experience of either the
chief or brigade members, or to a lack of initiative or confidence within the brigade
leadership team. Such brigades can be perceived as a burden to others and come across as
indecisive and ill-prepared.

31
Common descriptions of these brigades were:
“Very dependent on NZFS for support”
“Needs a lot of time and effort spent on them”
“Chief needs a lot of support”
General comments on related themes amongst struggling brigades
The most prominent and commonly referred-to characteristics of struggling brigades as
described by the research participants were in the following 5 categories:
Change resistant brigade
Autocratic leadership
Inflexible leadership
No delegation
Interpersonal conflict
This 5-theme cluster could be termed power, rigidity, and change resistance. From the
mapping exercise, these themes related and interacted closely to each other but were also
separate themes in their own way.
Change resistant brigade was typified by brigades with long-standing chiefs who the
research participants considered to be ‘past their use-by dates’. These chiefs didn’t tend to
bring others up within their brigade and were highly resistant to change, viewing
development as unnecessary. They were not necessarily aggressive or defensive with others
but more set in their ways with a strong historic perspective – they hadn’t moved with the
times or kept up with ongoing developments. In some cases it was more about inactivity
rather than active resistance.
Autocratic leadership was typified by a bullying leadership style, sometimes aggressive and
unapproachable. They were described as controlling information flows, withholding
32
information and defensive when dealing with people who had different opinions from their
own. They were considered as unapproachable people who ruled by fear and were highly
critical of others who didn’t agree with them. They were not necessarily lacking in
knowledge or intellectual ability in terms of fire service practice, but maintaining power to
exert that knowledge was their main driver.
Inflexible leadership fell between autocratic and change resistant styles. It was typified by
an attitude of” this is how we do it here” or “don’t try and tell us how we should do our job”.
Inflexible brigade chiefs had a narrow perspective of what they would and wouldn’t do, and
appeared to regard change as someone else’s priority (i.e. NZFS) rather than a requirement
for their particular brigade. External suggestions were viewed as threatening or encroaching
rather than helpful. These brigades (their chiefs, at least) often took an “us versus them”
stance.
No delegation reflected a narrowness of shared practice. This wasn’t necessarily done in the
aggressive or defensive way that exemplified the toxic leader, but was just as controlling.
This theme was typified as withholding of power by the chief to ward off challenges, in an
active maintenance of their leadership status. Development of others was avoided which
ultimately stifled the brigade’s potential to improve, ultimately leading to the unit’s poor
performance.
Interpersonal conflict was a wide-ranging theme that spanned across one-to-one issues,
within brigades and between brigades. Many appeared to be long-standing issues due to the
long-term membership of many volunteers. In some cases, feuds were generational.
Volunteers within the NZFS are composed of many highly passionate and committed people
who identify very strongly with the service they belong to. It also means that when there is
discord it will be felt and seemingly often expressed with equal commitment, which can be
detrimental to the overall performance of a brigade. Whereas high-performing chiefs were
often described as dealing with conflict issues quickly, chiefs within conflict-ridden brigades
were either part of the conflict itself or tended to turn a blind eye to it or even just accept it
Four other themes related to each other but again were separate clusters, these being:

33
Remote community
Low call out rate
Limited recruitment pool
Members working out of town
This grouping can be termed as geographic and demographic issues as opposed to
attitudinal disposition as outlined in the previous section.
Remote community reflected a physical disconnect with the wider NZFS and in some cases
reflected a lack of IT services and resources within that community. Participants often
described such communities as transient with an unstable population to call upon, wide
distances to cover and few members to cover the span.
Due to the geographic location, some brigades simply had very few callouts and so members
had little opportunity to develop their skills or improve through consistent repetition. This
was in direct contrast to many high-performing brigades that were constantly busy and
therefore well practiced.
Limited recruitment pool reflected a number of issues including simply not enough people in
the community available during day-time at least (e.g. a dormitory settlement for people
employed elsewhere) and/or people being unsuitable for the brigade due to age (e.g. a
retirement community), lack of suitable skills or disqualification of potential members due
to criminal record or lack of learning/training capability. There were instances where people
wanted to join their brigade but were excluded by their background. Some research
participants questioned whether the NZFS volunteer membership criteria could be
realistically applied to such communities where recruitment is already very difficult.
Two further themes mapped closely related but were also independent of each other, these
being:
Low brigade sustainability
Lack of robust systems and processes

34
These could collectively come under the heading of systems and planning. Both reflect a
lack of operational professionalism, but the timing of their inefficiency differs. Lack of robust
systems and processes were reported as more a day to day issue, a culture of being
operationally disorganized and scattered. Reporting was poor and systems unclear. Lack of
succession planning reflected a lack of future emphasis. Like the high-performing brigades,
succession planning was a very common theme; where emphasis was placed on it, it typified
high functioning brigades; where emphasis was lacking, it typified a common descriptor of
struggling brigades. The reasons for lack of planning with struggling brigades differed. For
some brigades it was part of a chief maintaining their position –an “if no plans are in place I
can’t be removed” stance, or a matter of belief that nothing will actually change in the
future or that if it does, they will deal with it then and only if they need to. For others, their
somewhat chaotic and reactive style inhibited their ability to plan outside the current
moment.
An additional related theme cluster was:
Insufficient skills
Low leadership accountability
Low autonomy
These were closely-related themes reflecting a simple lack of skilled ability to functionally
run a brigade. These themes were not necessarily related to chief- related power plays or
operational inefficiency. In some cases, these brigades worked with the very best intentions
but were simply not up to the complexity of running an effective brigade. “Useless
leadership” reflects a common description made by research participants. When drilled
down, it was often typified by a chief who simply wouldn’t stand back and still wanted to
rather than actually leading the process of the callout.
Insufficient skills often reflected some developmental gaps of skills/experience at critical
levels within a brigade. For example, some brigades described in this way were typified by
lacking an experienced middle core of members – a lot of newer members but lacking an
experienced group at the next step up. Similarly, some brigades were described as having

35
few if no skilled members below the chief and/or deputy.
A final theme emerged:
Community disconnect
This related to a disconnect between the brigade and the community it serviced. This often
had negative implications for recruitment of members and for the broader identity of the
brigade within its community.
There were clear indicators of struggling brigades, and research participants were able to
describe them in comprehensive detail. It was also clear that there were differentiating
features between struggling brigades; they struggled in different ways to each other. This
will be expanded upon further in the following section.
Overarching themes with struggling brigades
Three clear themes emerge within the characteristics of struggling brigades. First, some
brigades appear to be struggling due to demographic circumstances while other brigades
underperform and are struggling more due to how they are led and/or how they function
operationally.
Struggling due to demographic issues:
Remote community
Low call out rate
Limited recruitment pool
Members working out of town
Struggling due to leadership-related issues:
Change resistant brigade
Low leadership accountability
Autocratic leadership
36
Inflexible leadership
No delegation
Interpersonal conflict
Low brigade sustainability
Lack of robust systems and processes
Insufficient skills
Unstructured practices
Low autonomy
Struggling due to community disengagement:
Community disconnect
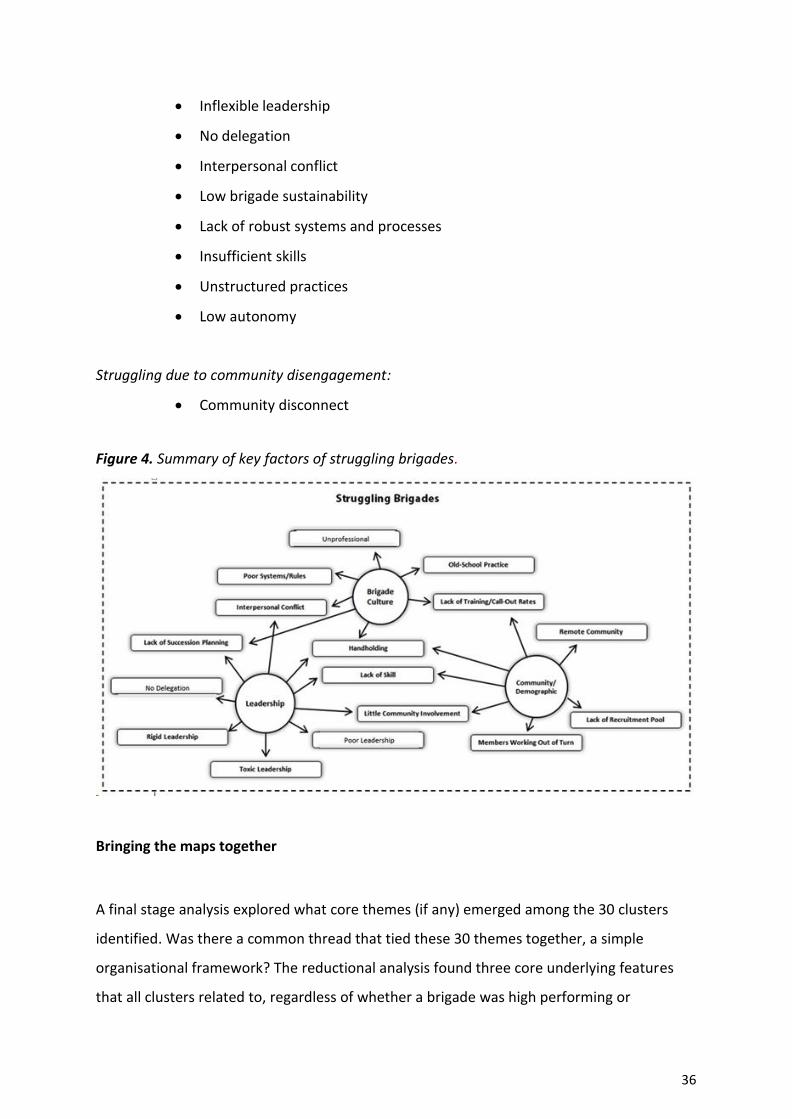
Figure 4. Summary of key factors of struggling brigades.
Bringing the maps together
A final stage analysis explored what core themes (if any) emerged among the 30 clusters
identified. Was there a common thread that tied these 30 themes together, a simple
organisational framework? The reductional analysis found three core underlying features
that all clusters related to, regardless of whether a brigade was high performing or
37
struggling. These were: Leadership, Brigade Culture (particularly professional operating
standards) and Community/Demographic. All statements made by participants about
brigades and differentiating brigades fell under one of these three broad umbrellas. All
themes from the Andmapping process were subcomponents of these three core areas.
Themes within and between each dimension also related to each other. For example, a high
performing chief had an effect on community involvement, which also positively related to
recruitment success. Few themes were strictly unrelated.
Key points
All research participants were nominated internally by the NZFS based on their
perceived expertise and extensive understanding of volunteer brigades. Participants
undertook an online mapping exercise and subsequent interview process to
articulate features that differentiated strong and struggling brigades. The
researchers had no pre-conceived ideas as to which factors defined strong versus
struggling brigades. These definitions were applied by the internally nominated
experts themselves and were guided by their differentiating descriptions.
Research participants differentiated between strong and struggling brigades in a
number of ways. From over 500 descriptions presented by participants, a map was
created covering the range of themes represented by these experts.
Fourteen themes characterised the range of descriptions of strong brigades, while
sixteen themes characterised the range of descriptions of struggling brigades.
All themes stemmed from three core areas, Leadership, Community/Demographic,
and Brigade Culture.
38
Phase 2: On-line questionnaire – the Volunteer Brigade
Profiler (VBP)
The next step of this project was to design an instrument based on the information gathered
from phase one. The resulting measurement instrument, the Voluntary Brigade Profiler
(VBP) is comprised of a battery of statements for an informed, internal observer to endorse
or reject, according to how well they match a target brigade, to quantify the observer’s
experience. This purpose was best served by keeping the language of questionnaire items as
natural and relevant as possible to the NZFS therefore, only descriptions presented by
research participants during phase one were used as items within the VBP.
It should be noted that careful consideration by the NZFS would need to be given as to the
most appropriate respondents for the VBP questionnaire, for example, as many of the
descriptive statements pertain to brigade leadership, it would not necessarily be
appropriate for Chief Fire Officers to rate themselves, unless the tool was being used more
in a 360 review context, a use to which it could be well adapted.
The development of any measure of this type is a technical discipline within itself so the
following methodological description is kept to a summary level.
Phase one explained how a vocabulary of several hundred phrases and sentences,
characterising strong and struggling brigades, was elicited from a group of nominated
participants. These were then organised within a framework of 30 themes with three over-
arching “spheres of influence”, leadership, brigade culture and community/demographic. In
the process of statement analysis, redundant and synonymous statements were merged or
eliminated, until 129 core statements remained. As future users of the VBP were likely to
find it a lengthy and arduous task to rate all 129 statements separately, we opted instead
for the efficiency of a multiple-choice format, arranging the statements into 43 three-
answer combinations. Users were instructed to choose the statement from each of these
“trilemmas” that best applies to the target brigade (or to select ‘none’ if none applied). It

39
may be that two or even all three statements from a trilemma are true of the target; in such
cases, the user must choose the statement that is most relevant or applicable. This forced-
choice format was easily implemented as an on-line form (Figure 5).
Figure 5. Questionnaire example
Trilemma design was an important consideration. One example of bad design is a
combination where three statements all express the same theme, for if one were true of a
brigade, then the others would be likely to apply as well. By the same token, to include two
statements from a single theme – or even closely-related themes – is less than ideal. It is
also desirable to vary the contexts: that is, if one trilemma presents a statement from theme
‘X’ in the company of statements from themes ‘Y’ and ‘Z’, then the next statement from ‘Z’
should appear in the company of different themes (‘A’ and ‘B’, say); repeating the previous
combination of themes would be a duplication, wasting the user’s time to provide little new
information.
We therefore followed a rational combinatorial procedure to assign statements to
40
trilemmas so that the user’s responses were as informative as possible. 18 trilemmas
present forced choices among positive statements (for the 14 scales formed from
descriptions of strong brigades), and will often be skipped when a low-performing brigade is
the focus; 15 involve negative statements (from the 16 scales descriptive of struggling
brigades). The remaining 10 trilemmas combine and contrast statements from both
polarities. The on-line questionnaire presents these trilemmas to every user in a fixed
sequence, which alternates between all-positive, all-negative and mixed. The order of the
three choices within each trilemma is randomised for each user.
Responses to the 43 trilemmas are referred back to the 30 thematic scales by a spreadsheet,
and summed into 30 scores. Note that this leaves open the option of fine-tuning the
instrument in the future. The spreadsheet can be modified if, according to the
preponderance of evidence, an item does not belong in the theme to which we assigned it,
but empirically comes under the umbrella of a different theme.
The completion of VBP questionnaire results in a specific brigade profile being produced.
Examples of these are provided later in this section. In most cases a brigade will show scores
on two profiles; a positive indicator and a negative indicator. The greater the weighting on
the positive indicator profile will highlight where a brigade is strong, and likewise, a greater
weighting on the negative indicator profile will highlight where a brigade is struggling.
It is also important to note that these profiles are a moment in time and the current profiles
used as a base line. As earlier indicated, brigades can change and the VBP could be used to
mark changes within a brigade over time as much as an indication of current state.
Key points
To ensure the content validity, as well as organisational relevance, only descriptions
in their natural language, as supplied by research participants were used to create
the VBP. No other amendments/additions form any part of this profiling
questionnaire.
The VBP is a specific measure designed to understand the characteristics of
volunteer brigades within the NZFS at a point in time.
41
Methodology
15 participants completed the VBP resulting in 94 completed brigade profiles. Ten of the
participant group had already been involved in phase one of this project. The other five
participants were nominated by participants from phase one. These five additional
participants were people who the original participants believed would provide a useful
insight into the process, as they had significant involvement with particular brigades under
review. In this exercise we got participants to complete a VBP focusing on specific brigades
that fell either into their strong or struggling categories from phase one. The 94 brigades
profiled provided a statistically robust base from which to conduct further analysis.
Results
As the VBP is a newly created profile measure, the 94 completed VBP questionnaires were
subjected to an extensive factor analysis to understand its psychometric structure and
possible relationships between themes within the profile. Put another way, we explored if
there were patterns within a brigade’s profile, or if there were clear indicators as to
“types” of brigades. Did brigades that had been identified as strong in phase one of the
research significantly profile as strong through the VBP? Conversely, did brigades that had
been identified as struggling also profile as struggling? Did strong brigades profiles show
any similar shared patterns with one another or was there variance between them? Did
profile patterns amongst struggling brigades emerge or did their profiles show distinct
differences?
The statistical analysis undertaken in this process produces a large amount of data which is
normally presented in the form of tables of correlations and other statistical language that
can be difficult to understand without having a background in statistical research
methodology. For ease of understanding and consistency, these results are presented in a
map format similar to the result outputs in phase one. This solution provides a visual
representation of relationships among items and themes that are easy to comprehend. As
outlined in phase one, points that are presented closer together represent similarity, whilst

42
points that are further apart represent dissimilarity.
As earlier explained, the VBP is made up of 43 three-way choices, with the participant’s
responses collapsed onto the 30 scales. To emphasise the specific strengths and
vulnerabilities of each brigade profiled, the 30 descriptive values are shown as ‘radar’ or
‘spider web’ plots, a form of radial diagram.
Three points should be emphasised about these scales:
1. The label we have assigned to each one is an attempt to sum up the common theme of
items contributing to it. The labels are provisional, and are open to revision.
2. Two scales have similar labels, but one bears negative connotations (‘remote
community’) and the other is more positive (‘rural / remote’). The former is an umbrella for
items that bear on community isolation and limited volunteer pool, as a source of stress.
The latter subsumes items that address remoteness as a source of community solidarity,
identity and pride.
3. The forced-choice nature of the questionnaire means that observers cannot give a high
rating to all the scales. Every item picked from a ‘trilemma’ – increasing the rating of one
scale – is a rejection of the other two items, where points cannot be given to two other
scales. This forced-choice questionnaire design is more efficient to complete and ensures a
respondent gives deeper consideration to the most relevant description applicable to the
brigade under review. By comparison, on a Likert-scale type questionnaire for example,
where a respondent is simply asked to rate individual items/descriptions on a scale e.g.
from ‘strongly disagree’ through to ‘strongly agree’ there is a known tendency to largely
respond somewhere in the middle of the scales.
The following profiles are actual examples taken from the 94 completed brigades. To
recap, the VBP produces two profiles for each brigade – a positive indicator and a negative
indicator. As can be seen, for Strong Brigade 1 below, scores only appear on the positive
indicator profile, indicating that in the eyes of this reviewer, this brigade is currently not

43
experiencing any of the negative factors. On the profile of Strong Brigades number 2, while
most scores fall on the positive indicator profile, some issues have been identified on their
respective negative profiles also.
As we move to the Struggling Brigade profiles, most scores fall on their negative indicator
profiles, but we can still see where some positive indicators have been identified on their
accompanying positive profiles.
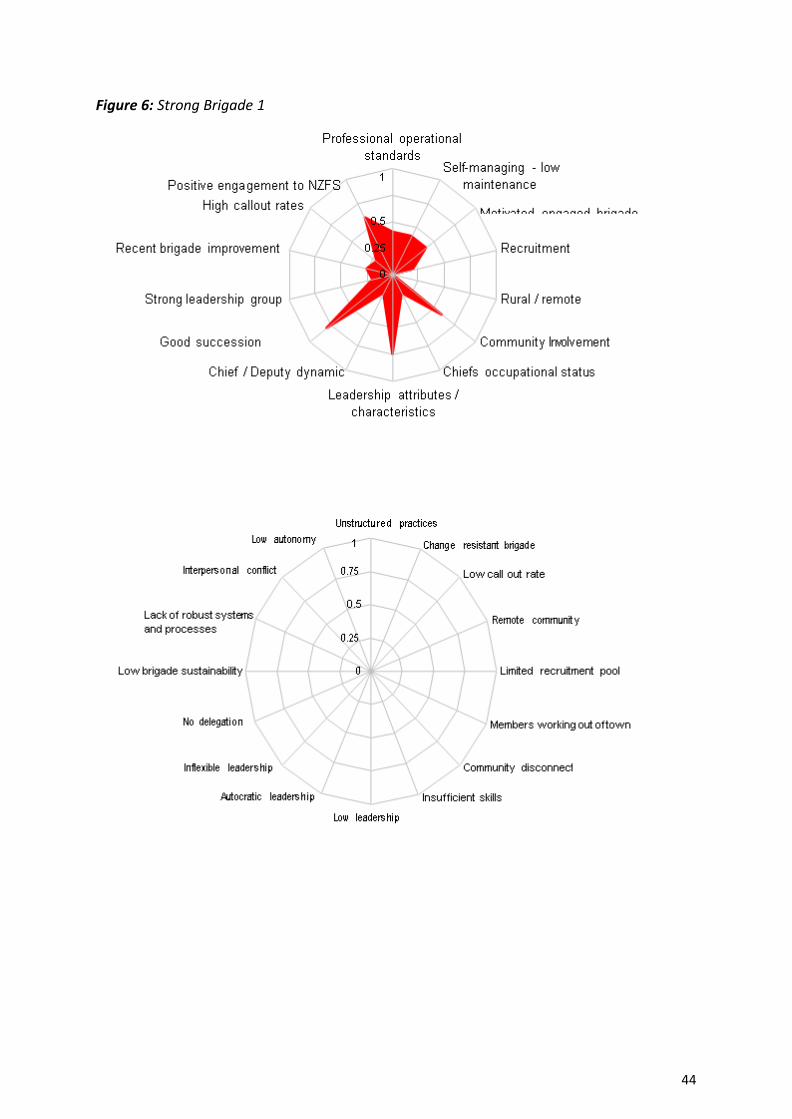
44
Figure 6: Strong Brigade 1

45
Figure 7: Strong Brigade 2
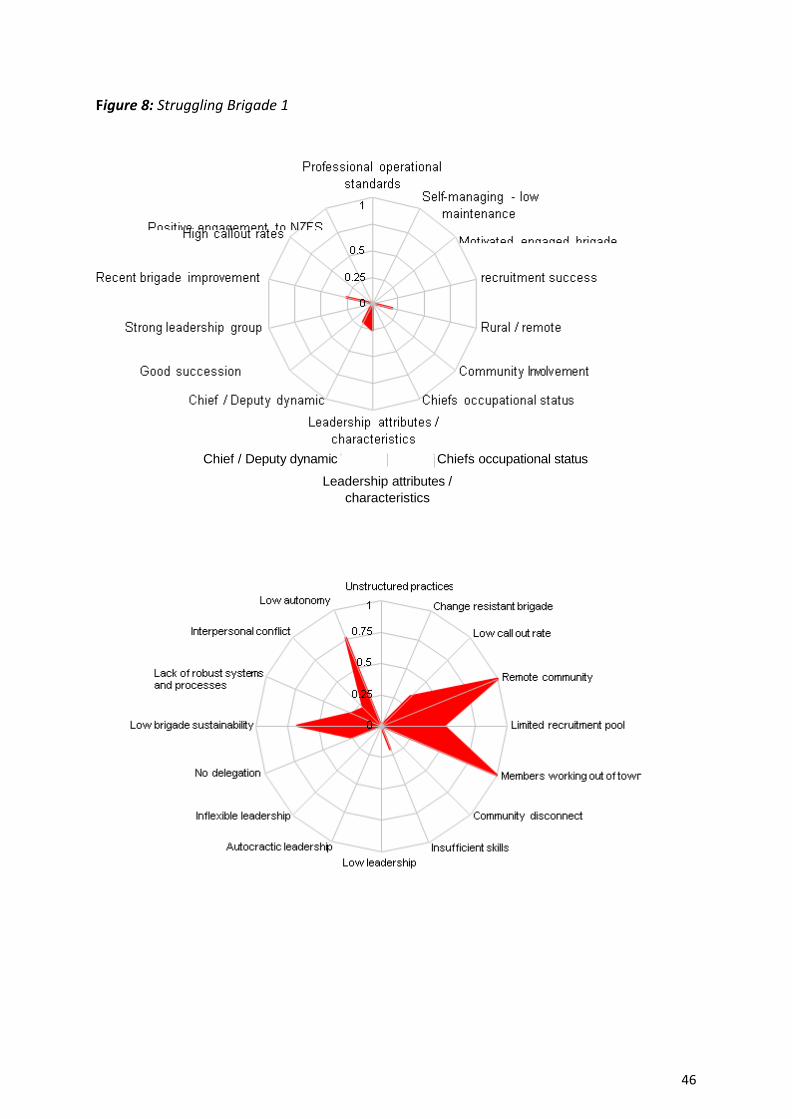
46
Professional operational
standards
Positive engagement to NZFS
High call out rates 0.75
Self-managing - low
maintenance
Motivated engaged brigade 0.5
Recent brigade improvement 0.25 recruitment success
Strong leadership group Rural / remote
Good succession planning
Community Involvement
Chief / Deputy dynamic Chiefs occupational status
Leadership attributes /
characteristics
Figure 8: Struggling Brigade 1
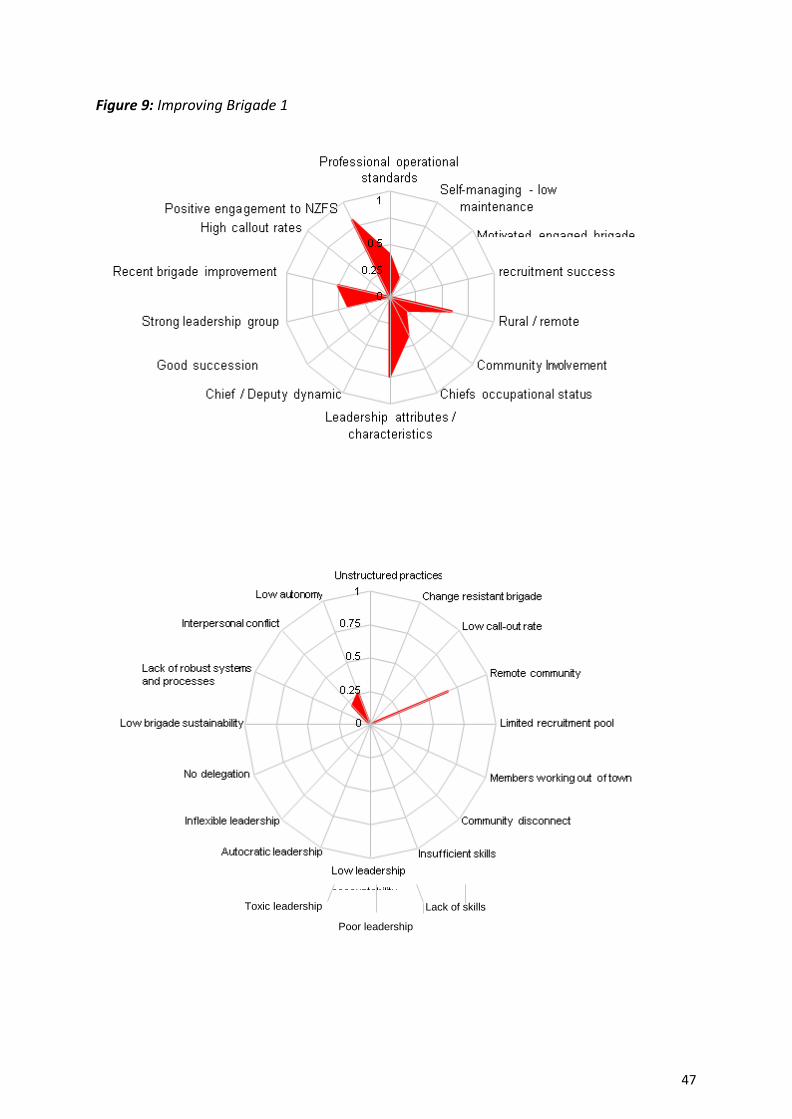
47
Need handholding
Unstructured
practices
1 Old-school practice
Interpersonal conflict 0.75 lack of training / call-outs
0.5
Poor systems / roles Remote community
0.25
Lack of succession planning Lack of recruitment pool
Delegation Members working out of town
Rigid leadership Little community involvement
Toxic leadership Lack of skills
Poor leadership
Figure 9: Improving Brigade 1
48
Overall analysis of the 94 brigade profiles shows that no brigade profiles in the exact same
way. Each brigade appears to be unique regardless of it being a strong or struggling brigade.
This has an interesting implication for the NZFS in working with individual brigades. It would
appear a blanket approach of treating each brigade the same would not be advantageous.
If, for example, a brigade is identified as struggling, via the VBP tool the NZFS can now
extract more information and pinpoint the kind of stress the brigade is under in order to
provide a more targeted approach to any form of assistance rather than a ‘One-size fits all’
policy.
Strong and struggling brigades clearly fall into different sides of the overall map. Brigades
that were identified as either strong or struggling in phase one of this research remained in
these categories when profiled using the VBP. The VBP clearly differentiates between strong
and struggling brigades.
The VBP is a measure specifically designed to provide a map of a brigade at its current point
of time. Our analysis suggests it can differentiate between strong and struggling brigades
and provide specific insights into the variations between those brigades. From a practical
perspective, the questionnaire takes between 10-15 minutes to complete and is therefore
more economic than an extensive interview. As with any measure, it requires ongoing
evaluation and changes made if required. Future use should also investigate multiple
reviewers’ perspectives on the same brigade – what degree of variation is there, if any, from
different people’s perspectives.
It is of great importance that any future use of the VBP is developmental in focus and it is
clearly understood that is not designed to be used as a performance measure. It should be
used in conjunction with other approaches to understand and identify how to assist
brigades and where those areas of assistance should best be focused.
Key points
Brigades that were identified as being strong in phase one of the research also profiled
positively on the VBP. When using the VBP, no brigade that was initially rated as a strong
brigade subsequently profiled as a struggling brigade. Similarly, brigades that were
49
identified as struggling also profiled as struggling, on the VBP.
A very important finding showed that none of the 94 brigades profiled were exactly the
same. Each brigade was unique and had its own profile shape (characteristics) regardless
of being strong or struggling. Brigades could be strong or struggling for different reasons.
This suggests each brigade should be viewed in terms of its own characteristics. A
blanket approach to working with brigades would not be effective.
Characteristics of both positive and negative profile elements were evident in strong and
struggling brigades. For example, some struggling brigades sometimes also had elements
of positive features and some strong brigades recorded scores on the negative profile.
However, these were not prominent.
While each brigade profile was unique, there were themes and patterns within the
strong and struggling brigades. When all the scores from profiles within each group
(strong or struggling) were combined, the analysis showed that struggling brigades had a
greater variance. In other words, struggling brigades struggle for a wide range of
reasons. Strong brigades, while differing from each other do not differ as widely as
struggling brigades.
50
VBP – Comments Section
As part of the VBP, participants were able to provide written comments regarding their
profile responses and given the opportunity to add any additional thoughts they had. The
addition of this section provided a further opportunity to gain further data and insights.
A total of 155 statements was collected from the comments section and underwent a
sorting and grouping process to identify key themes. This was a similar process used to
identify key themes in section one. Analysis from this process showed the emergence of
several distinct themes. In order of highest to lowest frequency commented upon, these
themes were leadership, staffing numbers, dynamics, individual attitudes and behaviours,
skills and training, improvement and processes. All themes contained both positive and
negative comments. Some examples are below.
Leadership
“Proactive chief and deputy who allow members to become involved”
“Chief is well liked, and has been around a long time”
“Chief has sought assistance to resolve issues”
“New chief has improved brigade”
“Chief is very good at his job and is well liked”
“Good chief- management, all members have involvement in the running of the brigade”
“Top performing brigade due to strong confident leadership”
“Leadership is a problem due to lack of motivation and innovation”
“Management is poor due to dominant chief”
“Chief difficult to communicate with – a know it all and can be dishonest”
“Chief makes excuses for slack members”
“Old school chief trying to control new members into doing things the old school way”
“Chief not connected with community but no one to take their place”
Staffing numbers
“Recruitment lifted by door knock campaign”
“Recent recruitment drive saved brigade”
51
“Recruitment and retention of members a problem in small community”
“Brigade in community of mostly very young or aging people who are not suitable
volunteers”
“Small isolated community struggles to attract new members”
“Small brigade sometimes has trouble with day manning”
“Biggest problem for brigade is attracting new members in a small community”
“Due to low numbers members having to do more than one role”
Dynamics
“Brigade works well as chief and deputy complement each other”
“All members have a job to do in station so all feel part owners of the brigade”
“Generally friendly atmosphere”
“Resignations due to conflict”
“Brigade has personality issues that create tensions and affect the ability of members”
“Chief and deputy noticeably don’t get along”
“Brigade has problems due to friction between chief and deputy”
Individual attitudes and behaviour
“Some individuals don’t want the responsibility of their role”
“Chief tries to dominate neighbouring brigades”
“Chief doesn’t like to embrace things that VSOs put in place to help the brigade out”
“Chief has very dominant personality and won’t accept some things”
“Some members not engaged, only turn up to training nights when they feel like it”
“Chief borders on bullying tactics”
Note. Some of these items could also been applied to Leadership theme
Skills and training
“New station officer has brought improvement to brigade training levels”
“Not a high callout rate but skills are good due to commitment to maintaining levels through
regular use of the training department”
“Chief’s over- involvement at callouts prevents others from developing”

52
Improvement
“New members who have attended new courses have really improved the brigade and will
take senior roles in a few years”
“New Training Officer has improved all aspects of brigade requirements”
“Brigade has improved with the appointment of the new Chief”
Processes
“Station is kept clean; safety notices well displayed, book work orderly, good management
structure”
“Very poor succession plan in place”
“Not keeping up with data input is sometimes an issue”
The comments section provided a further opportunity to collect perspectives of brigades. As
with phase one, leadership, both positive and negative was the most commented on theme
of this phase. The importance of leadership and its effect is drawn out further when each
theme is mapped against each other in terms of similarity / dissimilarity. Leadership was
closely related to and had a strong effect on the themes of dynamics, individual attitudes
and behaviour and improvement. Processes and skills and training related closely together
while numbers mapped independently from the aforementioned themes.
53
Phase 3
Analysis of existing quantitative data
Overview
In this phase of the project we performed an exploratory analysis of the available
quantitative indicators of the composition and performance collected by NZFS over time of
volunteer brigades within the NZFS. This data was provided for analysis from a range
different data sheets including information from the Volunteer Dashboard system. The
purpose of this phase was to investigate any themes that could emerge from current NZFS
data that may be insightful and useful. It is important to note however that NZFS measures
and our research processes and findings in phases one and two are not necessarily
measuring the same things and should be viewed as independent of each other. We have
not set out to test the validity of the NZFS data, critique it or create alternative measures to
surpass any current systems. The following section is presented as simply as possible with a
series of key summary sections for ease of understanding.
The NZFS evaluate volunteer brigades in a variety of ways. The measurements do not all say
the same thing or converge on the same conclusions. Nevertheless, we have found there is a
pattern among these measurements across brigades. Seven aggregated scales or factors
emerged from the sea of data, providing a summary description of individual units. The
main body of this phase explains the origin of these factors. The seven factors are
provisionally identified as: Staffing, Shortfall, Workload, Processes, Skills, Qualifications
and Commitment.
On face values, no single factor score stands out as an obvious indicator of whether a
brigade is performing above expectations as a model for other volunteer groups, or
alternatively is stretched beyond its capabilities. In particular, these factors are largely
independent of one another: they do not converge to single out at-risk units. If a predictor

54
of overall performance can be obtained from the quantitative data, it is likely to be a
combination of factor scores considered in context. It may be that outliers are of particular
importance – that is, brigades that fall outside the general distribution of one or more factor
values.
For instance, some brigades are far more active than their staffing level predicts e.g. one
particular brigade has a chronic problem recruiting the full volunteer complement but is
growing far faster than one would expect from this staffing shortfall.
Two other variables ‘Growth’ and ‘Turnover’ are possibly relevant to the question of
‘brigade performance’ and are used in this analysis, without assimilating them into the
aggregated scales described above.
Finally, this analysis should be considered as a work in progress. The general framework of
this analysis is open to the inclusion of further future data.
Analytic Approach
The general approach taken here is correlational. Factor Analysis (FA) was the main
statistical tool, used to identify which indicators are empirically related across brigades, and
to group them together into a more manageable number of underlying ‘factors’.
Volunteer Dashboard
This analysis drew upon information from the Volunteer Dashboard, the online reporting
system for tracking brigades’ performance, preparedness and compliance. As its name
suggests, the Dashboard interface uses colour-coded flags in the manner of dashboard
gauges to signal departures from objectives. It compares quantifiable outputs from a
brigade against benchmark values, delivering reports to the Chief Fire Officers and to
various levels of NZFS management.
We were provided with a “Measure Definitions” document, which describes the specific
outputs and corresponding benchmarks covered by the Dashboard grouping these under

55
broad headings. Among them,
1. Personnel – as well as the number of volunteers in a brigade, flagging whether too many
were inactive, or not attending training sessions;
2. Qualifications – whether volunteers were available with expertise in particular skills.
3. Operational Skills Management (OMS) – whether everyone has acquired the basic
central or core skills;
4. Station Management System (SMS) – flagging lapses in the record-keeping and paper
trail after operational incidents;
5. Audit status – whether corrective actions had been completed.
To foreshadow the results below, four broad themes or factors emerged from the analysis,
where each factor summarises the scores on several of these outputs.
The SMS measures were all sufficiently inter-correlated to coalesce into a single factor,
which we provisionally labelled Accordance with processes.
The second factor, Qualifications, combined three measures from the Qualifications
heading, along with ‘Operational Staffing’ (from Personnel) and ‘Audit Status’.
A third factor, Member Skills, combined two OMS measures. The emphasis on all
volunteers meeting the standard is what distinguishes this from Qualifications.
The fourth factor combined two remaining Personnel measures, along with ‘sufficient
number of officers’ from Qualifications, and a measure of turn-out promptness. We
identified it as Commitment although Participation would also be appropriate.
Caveats
Various caveats apply. Just because a measurement can be made, does not necessarily
mean that it is related to the topic of interest. We are also aware that many volunteer
brigades may regard the provision of emergency services as a higher priority than
documenting their every activity. Special caution is required with the green / amber / red
performance concerns obtained through the Dashboard interface, which record lapses from
56
NZFS goals and guidelines but do not rate a brigade’s performance on less easily-quantified
variables. In general, the map is not the territory.
We summarised the available quantitative information about the brigades as seven
scales or factors
Brigades’ values on these scales differ systematically across geographical regions and
type of brigade
These are possible areas for predicting brigade performance
Staffing and understaffing (shortfall)
One primary source provided for analysis contained staffing information for 395 brigades –
classified as V (Volunteer), A (Auxiliary), C (Composite, where volunteers share premises
with paid staff), Sub (Suburban) and FPB (Fire Police facilities, i.e. Operational Support
Units). Note that this list does not entirely overlap with other data analysed. Some brigades
have staffing information but no workload indicators. These include several Operational
Support Units, but also Composite brigades at Masterton, Nelson, Trentham and
Waitemata, plus the Onetangi Suburban brigade. Conversely, there are also brigades for
which workload indicators are available but not staff levels or classification.
The main contents of the spreadsheet are the complement agreed upon in each brigade’s
Business Plan, and the actual volunteer count, over several years, from 2008 to December
2013. Volunteer counts are recorded for 2009, 2010, 2011, 2012, June 2013 and Dec. 2013.
These staffing-level snapshots in turn provide the staffing shortfall for each year – the
difference between the count and the complement (where a positive shortfall indicates a
reserve of volunteers). The trend across the six snapshots for each brigade provides an index
of its growth. Ngaruawahia was the fastest-growing brigade during the period (slipping to 21
in 2011 but then rising to 33 in the next two years); while Wairoa and New Brighton were in
negative growth (Wairoa shrinking from 30 in 2009 to 21 in December 2013). As well as the
absolute growth, we considered the relative growth, i.e. as a fraction of average count.

57
Naturally there is a great deal of redundancy and repetition among these indicators: the
agreed-upon staffing targets change little from one assessment to the next, and are highly
correlated across brigades; actual volunteer counts are also relatively constant, as in turn
are shortfalls. We applied Factor Analysis to these indicators to reduce them to a small
number of parameters for subsequent analyses. We included Mean complement, Mean
count and Mean shortfall in this analysis, as well as the growth trend, and finally a turn-over
score.
Two principal components accounted for 77% of total variance. One factor is in effect an
average across the complements and counts for all years; the second is an average of all
years’ shortfalls. We retained these as “Staffing” and “Shortfall” indicators, as shown as
Figure 10. The two indices are not significantly correlated: overall, there is no tendency for
larger brigades to have more problems (or fewer problems) with recruiting volunteers. As
for the ‘growth’ and ‘turnover’ indicators, they are not strongly related to either
component, as shown by their central location in the solution.
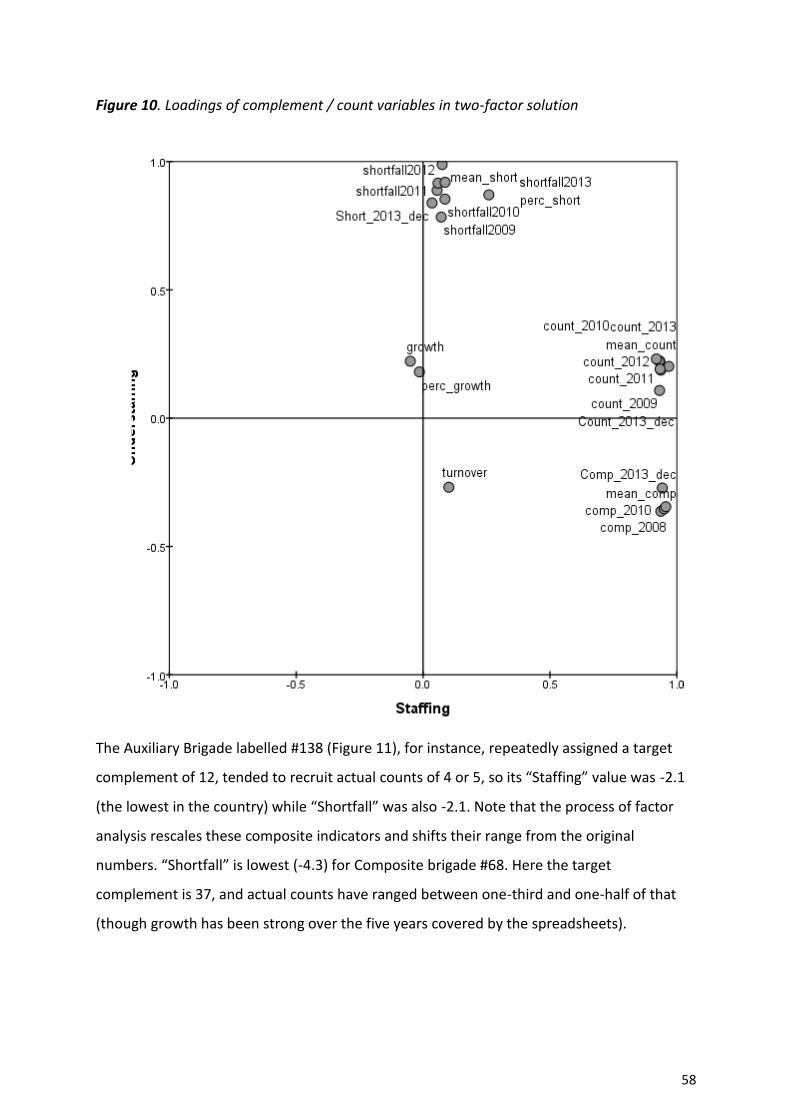
58
Figure 10. Loadings of complement / count variables in two-factor solution
The Auxiliary Brigade labelled #138 (Figure 11), for instance, repeatedly assigned a target
complement of 12, tended to recruit actual counts of 4 or 5, so its “Staffing” value was -2.1
(the lowest in the country) while “Shortfall” was also -2.1. Note that the process of factor
analysis rescales these composite indicators and shifts their range from the original
numbers. “Shortfall” is lowest (-4.3) for Composite brigade #68. Here the target
complement is 37, and actual counts have ranged between one-third and one-half of that
(though growth has been strong over the five years covered by the spreadsheets).

59
Figure 11. Staffing scores for brigades (colour-coded by type of brigade)
However, the earlier overall comparison obscures differences in the kind of brigade. For the
28 Auxiliary brigades in isolation, there is a highly significant positive correlation (r = 0.65):
larger brigades find it easier to meet their targets. The same is true for the Suburban
brigades, where the correlation between Staffing and Shortfall is r = 0.55, although this is
less significant due to the smaller number of such brigades (only 13).
When we look at the range of staffing levels within each type of brigade, there are no
surprises: Auxiliary brigades tend to be smaller than the others. Operational Support groups
also tend to be smaller than Volunteer and Composite stations, with the exception of the
Auckland OS Unit.
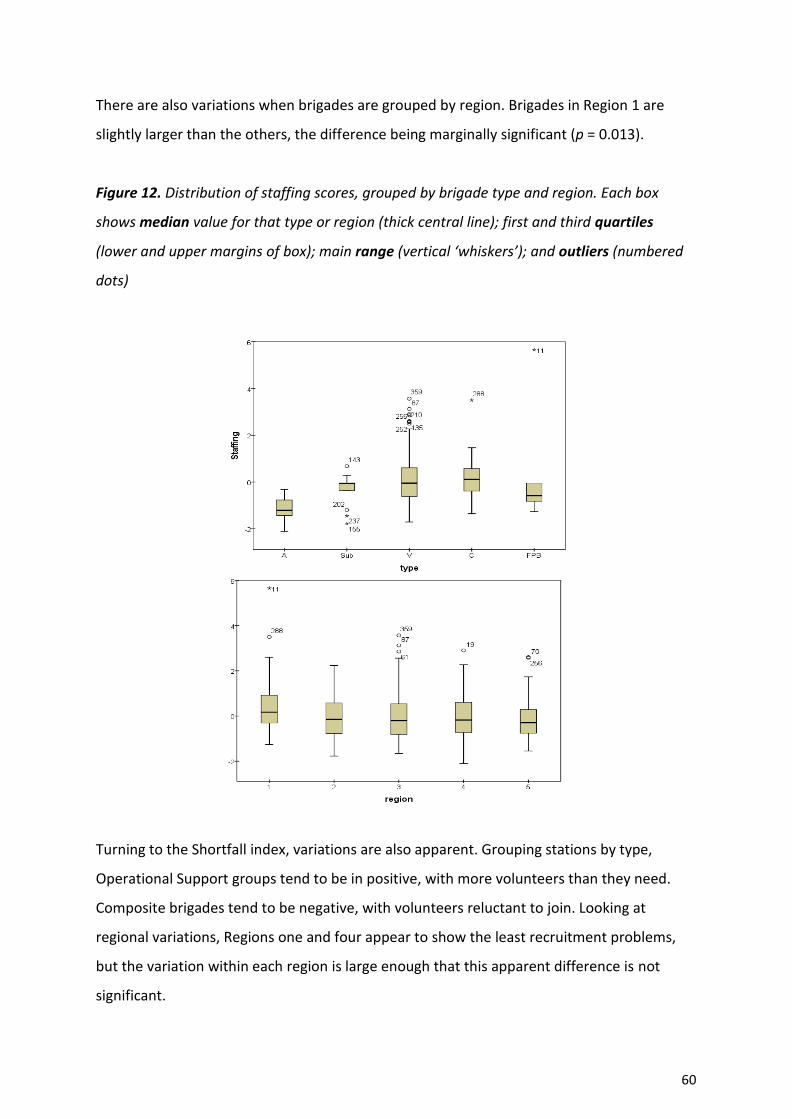
60
There are also variations when brigades are grouped by region. Brigades in Region 1 are
slightly larger than the others, the difference being marginally significant (p = 0.013).
Figure 12. Distribution of staffing scores, grouped by brigade type and region. Each box
shows median value for that type or region (thick central line); first and third quartiles
(lower and upper margins of box); main range (vertical ‘whiskers’); and outliers (numbered
dots)
Turning to the Shortfall index, variations are also apparent. Grouping stations by type,
Operational Support groups tend to be in positive, with more volunteers than they need.
Composite brigades tend to be negative, with volunteers reluctant to join. Looking at
regional variations, Regions one and four appear to show the least recruitment problems,
but the variation within each region is large enough that this apparent difference is not
significant.

61
Figure 13. Distribution of Staffing Shortfall scores, grouped by type and region
We considered changes in brigade staffing – the ‘growth’ index mentioned earlier. In the
ideal world, the most understaffed brigades would react by becoming the fastest-growing,
but in fact the opposite is the case (Figure 14). There is a small but positive correlation
between Shortfall and growth (r = 0.22): understaffed brigades are experiencing negative
growth.
This index is not significantly different between regions, or between kinds of brigade.
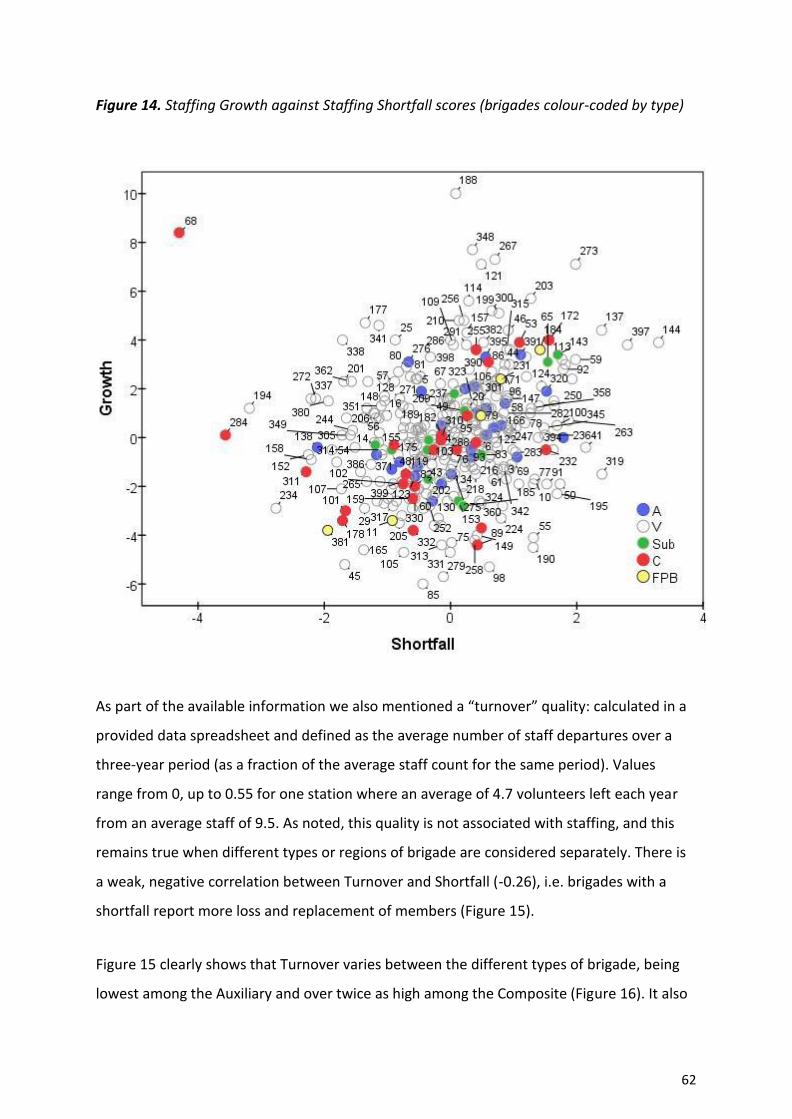
62
Figure 14. Staffing Growth against Staffing Shortfall scores (brigades colour-coded by type)
As part of the available information we also mentioned a “turnover” quality: calculated in a
provided data spreadsheet and defined as the average number of staff departures over a
three-year period (as a fraction of the average staff count for the same period). Values
range from 0, up to 0.55 for one station where an average of 4.7 volunteers left each year
from an average staff of 9.5. As noted, this quality is not associated with staffing, and this
remains true when different types or regions of brigade are considered separately. There is
a weak, negative correlation between Turnover and Shortfall (-0.26), i.e. brigades with a
shortfall report more loss and replacement of members (Figure 15).
Figure 15 clearly shows that Turnover varies between the different types of brigade, being
lowest among the Auxiliary and over twice as high among the Composite (Figure 16). It also
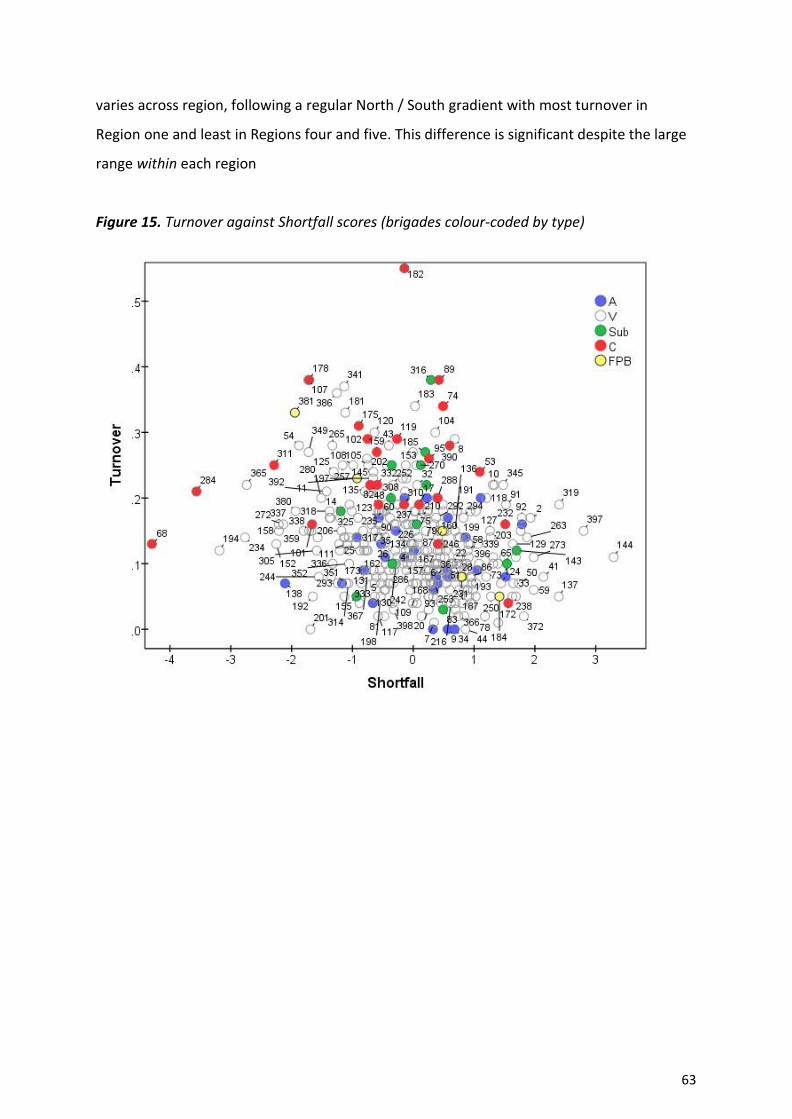
63
varies across region, following a regular North / South gradient with most turnover in
Region one and least in Regions four and five. This difference is significant despite the large
range within each region
Figure 15. Turnover against Shortfall scores (brigades colour-coded by type)
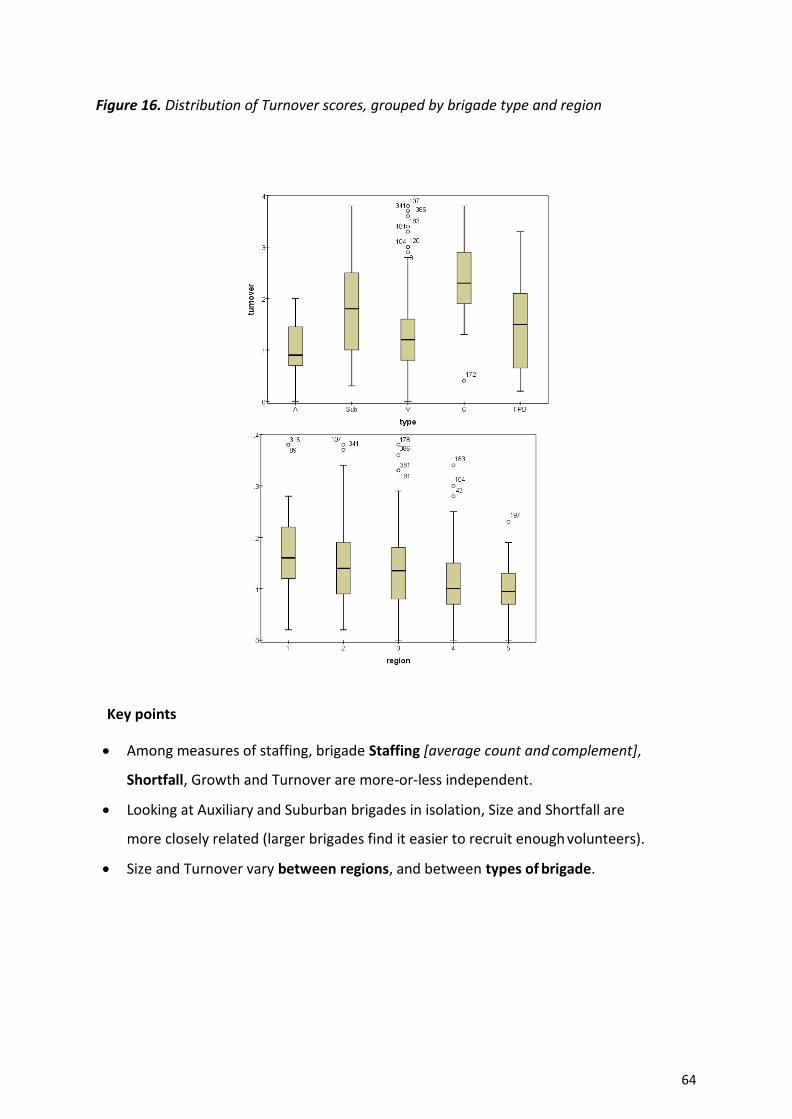
64
Figure 16. Distribution of Turnover scores, grouped by brigade type and region
Key points
Among measures of staffing, brigade Staffing [average count and complement],
Shortfall, Growth and Turnover are more-or-less independent.
Looking at Auxiliary and Suburban brigades in isolation, Size and Shortfall are
more closely related (larger brigades find it easier to recruit enough volunteers).
Size and Turnover vary between regions, and between types of brigade.

65
Workload
2013/14 Data was provided by NZFS which recorded workload for Volunteer Stations under
the following five headings for each brigade:
Incidents in First Response Area (Number of incidents at which the station listed was the
first response)
Total Appliance Turnouts (Number of responses by the listed stations. This is a count of the
number of times that appliances rolled out the station door regardless of the incident
location)
Total Incidents Attended (Number of incidents attended by the stations regardless of the
incident location. Excludes cover moves)
Back up incidents (Incidents outside First Response Area)
And in addition, Total Incidents Attended for the previous year.
We are aware that the nature of the workload varies greatly across brigades, depending on
local conditions, initiatives and decisions (e.g. Rolleston and Tawa take on additional
paramedical training and responsibilities; there may be overlaps with other volunteer
groups such as St John’s Ambulance).
Further date provided on daytime crewing includes a breakdown of incident numbers and
durations into specific kinds, times of day and durations of activity. However, it is not clear
whether this breakdown is consistently applied, while segmenting brigades by the nature of
their activity is not necessarily linked to questions of robustness and high performance, so
we have not analysed this particular data in depth.
This data also contains summary workload records, again for the 2013/14 year. Specifically,
Total Incidents, Total Turnouts and Total Duration are recorded for each brigade. These do
not replicate the values from the first set of records, appearing to use different criteria or
different units. This is not an issue here, where we are interested in the correlations among
these indicators, and whether they are sufficiently associated with one another to reduce to

66
a single summary value for subsequent analysis.
Factor Analysis confirms that the correlations among these indicators are indeed high.
In particular, counts of “incident” and counts of “turnout” are strongly associated with one
another and are in effect measuring the same quality. The first two components of Principal
Components Analysis (being the simplest form of factor analysis where the components it
produces are the factors) account for 85% and 10% of the total variation across the
brigades, that second factor indicating that there are some differences between the activity
measurements (Figure 17). In particular, there is a distinction between Backup call-outs
(assisting neighbouring brigades) and specifically local call-outs. The ‘local call-out’ factor
dominates the incident-count and turnout-count variables, while “Total incident duration”
lies midway between these two extremes. This distinction arises because local conditions
are not identical for all brigades, with the accessibility and capability of neighbouring
brigades affecting the number of backup calls independently of overall activity.

67
Figure 17. Loadings of incident / turnout variables in two-factor solution
However, the second factor is not well-supported by the data, and we retained a single
Activity factor, Workload – which collapses Backup, Incident-duration and local-count
indicators in with the others. In essence this is a weighted average of the different indicators
(each one weighted by its reliability, i.e. how well it is associated with the others).
Naturally Workload is associated with Staffing, but the correlation is not perfect (r = 0.70).
Some brigades (#153, #273) have a workload substantially higher than their muster would
predict; others are in the opposite situation (Figures 18 and 19). This is a convenient point to
note that Workload is not a strong driver of the Turnover measure (r= 0.185).

68
Figure 18. Workload against Staffing scores (brigades colour-coded by type)
There are significant group differences in Workload between the kinds of station. Sub
brigades are on average the most active, followed by Composite, while Auxiliary brigades
are least active, followed by FPBs – Auckland being the exception. This contributes in turn to
the mismatch with Staffing, for as noted above, Suburban brigades are not the most highly
staffed. This places these stations on the low staff-to-workload-ratio side of the distribution
(Fig. 19).
Brigades can also be grouped by region. Here again there are differences, which are
significant, and also systematic Workload varies along a North-South gradient, with brigades
in Region one having on average the highest workload, and those in region five having on
average the lowest. This is what one would expect from shifts in the population over the
years since the brigades were established (northward drift and urban drift) while their

69
boundaries or ‘catchment areas’ remain fixed. As noted earlier, the regional differences in
Staffing are not as marked. The net result is to place Region five brigades on the high staff-
to-activity side of the distribution (Figure 19).
Figure 19. Distribution of Workload scores, grouped by brigade type and region
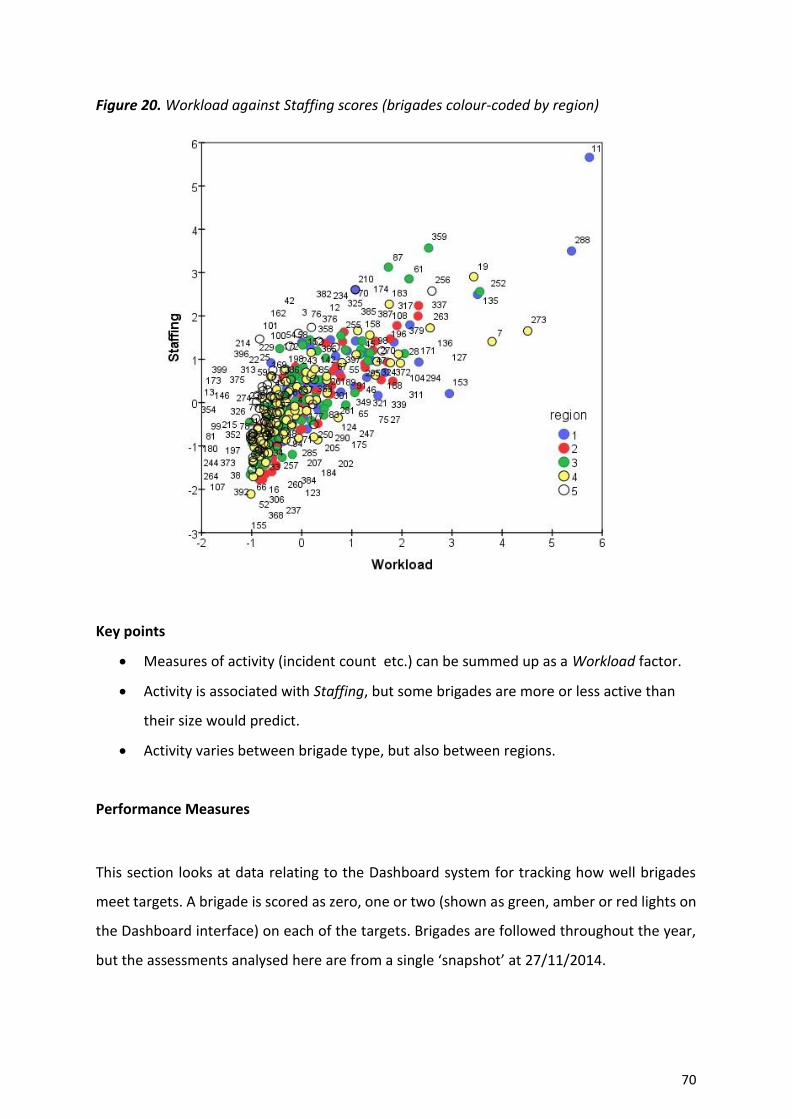
70
Figure 20. Workload against Staffing scores (brigades colour-coded by region)
Key points
Measures of activity (incident count etc.) can be summed up as a Workload factor.
Activity is associated with Staffing, but some brigades are more or less active than
their size would predict.
Activity varies between brigade type, but also between regions.
Performance Measures
This section looks at data relating to the Dashboard system for tracking how well brigades
meet targets. A brigade is scored as zero, one or two (shown as green, amber or red lights on
the Dashboard interface) on each of the targets. Brigades are followed throughout the year,
but the assessments analysed here are from a single ‘snapshot’ at 27/11/2014.
71
A total of 15 measures are in general use. They are described below, with a capsule
description of the goals or criteria against which brigades are judged. Seven measures are
applicable to all units and marked in red, while the other eight are not applicable to
Operational Support units.
Three come under the rubric of Personnel:
Operational Staffing (comparing “Number of operational members against
establishment”)
Inactive Members (“Number of fully operational members making 10% of incidents
or less”)
Training Attendance (“Percentage of operational members attaining 50% of
musters”)
Four are under the heading of Qualifications:
Officers (“20% of total membership or total establishment will be officers”)
Operational Drivers (“40% of operational membership will hold driver qualification”)
BA Wearers (“80% of operational membership will hold BA qualification”)
Rescue Tender Operators. (“70% of operational members will hold Rescue Tender
Operator qualification”). This is unrecorded for about half the brigades, which do not
operate rescue tenders
Two are Operational skill measures, signalling the need for individual volunteers to up-skill:
Critical Skills Status (“Operational members with Critical Skills currently at Red
status”)
Core Skills Status (“Percentage of operational members with Core Skills currently at
Red status”)
One measure is classified as Response:
Turnouts (“First appliance will be K1 within five minutes 90% of the time”)
Five come under the heading of SMS, tapping into the Station Management System:
72
Complete Incidents (“Incomplete ‘Complete Incident’ tasks overdue”)
Incident Response (“Incomplete ‘Incident Response’ tasks overdue”)
Operational Readiness (“Incomplete ‘Operational Readiness’ tasks overdue”)
Standard Testing (“Incomplete ‘Standard Testing’ tasks overdue”)
Outputs vs Plan (“Difference between target and percentage of year elapsed”)
There is one Audit Status:
Corrective Actions (“Incomplete Corrective Actions overdue”).
Finally, there are two measures, Support Staffing and Support Drivers, which only apply to
Operational Support units, where they take the place of Operational Staffing and
Operational Drivers flags (Personnel and Qualification respectively).
The spreadsheet includes a column (Avg Score) which is the total across all 18 measures. Its
value is not entirely redundant because it includes the two Support measures, which are not
otherwise examined here. We found it more useful to take the average of scores, averaged
across the number of applicable measures, which varies across brigades.
In factor analysis, the first four factors accounted for 46% of total variance. Subsequent
factors only provided small incremental improvements so the four-factor solution was
retained. Table 1 below shows the ‘factor loadings’ for the 17 measures, i.e. how much each
measure contributes to the aggregate score on each factor. Note that the labels
characterizing the factors are only provisional. The loadings are also shown in Figure 21.
The SMS measures were all inter-correlated and coalesced into a single Accordance with
Processes factor. ‘Critical skills’ and ‘Core skills’ were inter-correlated and formed a second
factor, Member Skills (to which the Average also contributed). Five measures of personnel
and qualifications formed a third Qualification factor, with the remaining personnel /
qualification measures (including member inactivity and training attendance) coalescing into
a fourth Commitment factor.

73
Turnout promptness contributes to all the factors except Processes, but marginally more to
Commitment. It is also worth noting that the Corrective Actions measure contributes most to
the Qualifications factor, but it also contributes negatively to Commitment (i.e. the presence
of overdue corrective actions is empirically less common in brigades with numerous
‘commitment’ red flags).
Table 1. Associations between 17 measures and four summary factors. Yellow highlighting
indicates the strongest association for each measure
Processes
SMS: Incident Response .681 -.069 .228 .014
SMS: Complete Incidents .634 -.015 -.006 -.032
SMS. Standard Tests .594 -.103 -.175 .179
SMS: Outputs vs. Plan .544 .267 .289 -.026
SMS: Operational Readiness .478 .175 .067 .000
Qualification
Q. Operational Drivers -.040 .709 -.080 .122
Q. Breathing Apparatus -.042 .673 -.196 .141
A. Corrective .186 .517 .299 -.446
P. Operational Staffing .057 .381 .084 .059
Q: Rescue tender operators .125 .252 .028 .161
Member skills
OMS. Core Skills .113 .015 .808 -.052
OMS. Critical Skills .103 -.153 .737 .134
Average score .531 .503 .561 .352
Commitment
P. Inactive Members .056 .050 .032 .692
P. Training Attendance -.139 .344 .218 .515
Q. Officers .167 .145 .000 .510
R. Turnouts -.134 .227 .344 .348
Comparing these indicators with those already described, there are significant negative
correlations between Qualification and Workload, Staffing and Shortfall (r = -0.273, -0.357

74
and -0.272 respectively). Qualification is also correlated with “Proportional population” (r =
0.267), so in small communities where proportionally more of the population has
volunteered, it is harder to ensure that everyone meets the training standards; and weakly
correlated with ‘turnover’ (r = 0.145). Commitment has similar but smaller negative
correlations with Workload, Staffing and Shortfall, and a positive correlation (r = 0.168) with
‘turnover’.
Each of these indicators is uncorrelated with the other three across the brigades, because of
the particular form of factor analysis used to obtain them. When a slightly different
approach is used (“Oblimin rotation”) which does not impose independence, they are still
only weakly inter-related, the highest correlations being 0.192 between Qualification and
Commitment, and 0.189 between Qualification and Skills.
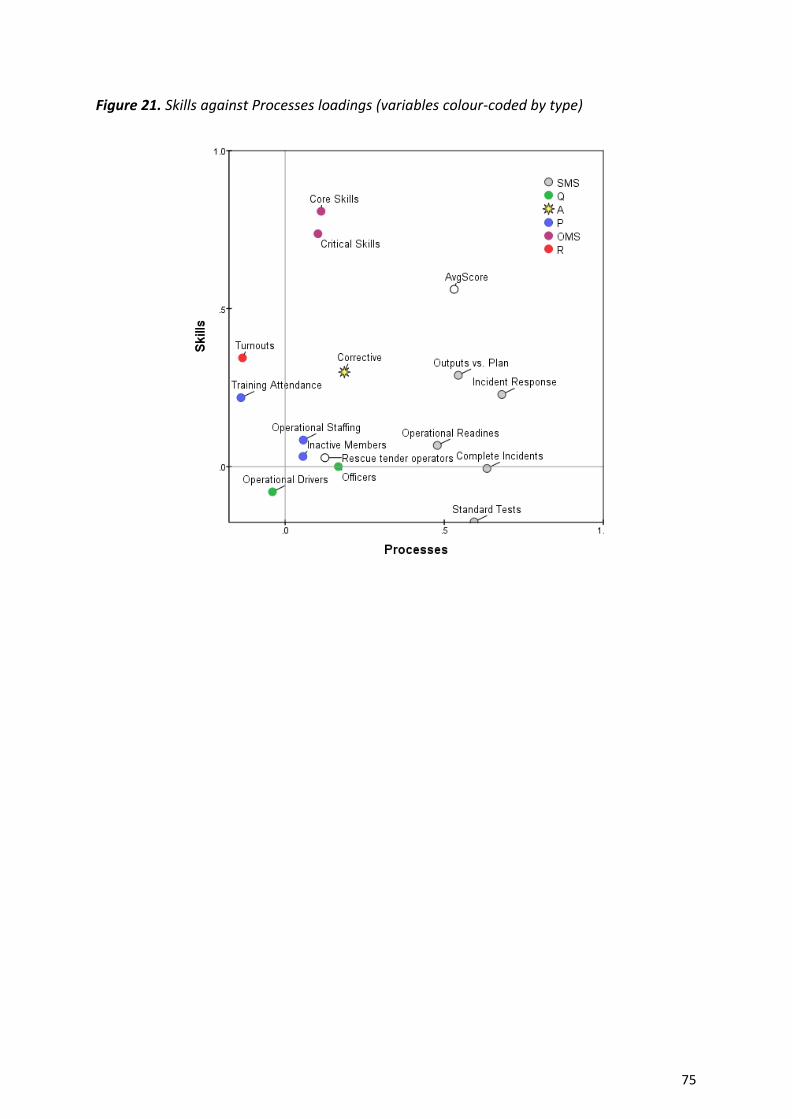
75
Figure 21. Skills against Processes loadings (variables colour-coded by type)

76
Figure 22. Commitment against Qualifications loadings for the measures

77
Figure 23. Distribution of Processes and Skills scores, grouped by brigade region
Looking first at Processes and Member Skills, both vary significantly across regions, with
brigades in Region 4 (Upper South Island) tending to display more red flags (Figure 24). There
are no significant variations between types of brigade.

78
Figure 24. Processes against Skills scores (brigades colour-coded by region)
The distribution of Processes is strongly skewed (Figure 24). The vast majority of brigades
come close to meeting targets, with scores that are zero or negative (recall that the process
of creating these aggregate scores normalizes and rescales them to have zero as their mean
value). However, a minority seem to have abandoned tasks such as ‘Complete Incidents’ and
‘Standard Testing’ completely, resulting in scores ranging up to 5.01 (#44), 4.76 (#81) and
(#20). The distribution of Skills is more symmetrical, ranging from -2.1 (#52) up to 2.80
(#170), 2.61 (#126) and 2.60 (#138).

79
Figure 25. Distribution of Commitment scores, grouped by brigade type
Turning to Qualifications and Commitment, again there are variations between the regions.
Brigades in Region 3 tend to display more Qualification-related red lights, while those in
Region 2 raise more Commitment-related concerns. What is perhaps more interesting is that
Commitment varies between types of brigade – the only Dashboard factor to do so – with
significantly more red lights among Auxiliary and Composite brigades (Figure 25).

80
Figure 26. Commitment against Qualification (brigades colour-coded by type)
Both factors display skewed distributions, with zero or negative scores for most brigades
(Figure 16). Values for Qualifications range up to 5.43 for #66 and 4.48 for #392. Values
for Commitment range up to 4.03 for #175 and 4.28 for #159.
Key points
The red flags and causes for concern recorded in the Dashboard system fell into four
factors: Skills, Processes, Qualifications, Commitment.
Processes, Qualifications and Commitment scores show a notably skewed
distribution, with a small scattering of brigades attracting any number of red flags.
Commitment scores are the only ones to vary between types of brigade.
Qualifications and Commitment scores are associated with the earlier measures of
Staffing and Workload.
81
Summary
The available information from the Dashboard system for tracking brigade performance
reduced down to four broad scales (factors): Processes, Skills, Qualification and
Commitment. Each scale is a sum of a different combination of the Dashboard ‘red lights’,
and provides a different way of comparing the membership of a given brigade against the FS
expectations. In the same way, other information – recording the volunteer brigades’
activities and complements – reduced to three broad scales: Staffing, Shortfall and
Workload. There are meaningful correlations between these scales and meaningful
variations across geographical regions and across the five categories of brigade. However,
these summary values for a given brigade do not in themselves predict whether it is
performing above expectations or is stretched beyond its capacity. Rather, they seem to
provide a context for interpreting independent assessments or evaluations; or a baseline
against which an assessment can be performed.
Key points
Records of brigade staffing and function yielded three broad scales of Staffing, Shortfall
and Activity. Levels of Staffing varied across the five regions of NZFS (as might be
expected from historical population shifts), and between types of brigade.
Measures of volunteer Growth Trend and Turnover were independent of these other
staffing measures. They were not associated with the observational scale.
Data from the Dashboard system – scoring how well brigades had met their
performance / preparation goals and expectations – could be reduced to four broad
factors which we identified as Processes; Skills; Qualifications; Commitment. Of these,
only Commitment was predictive of a brigade’s at-risk status. These scales come with
the caveats that the Dashboard system was not intended for this purpose. Only one key
relationship was found: small, quiet or under-staffed brigades are not necessarily
struggling, but large brigades, and busy ones are never viewed as struggling.
Values of Staffing, Activity and Shortfall were correlated with a brigade’s position on the
strong or struggling scales that emerged from phase one of this research.
The culmination of data in phase one lead to the development of the on-line

82
questionnaire, the VBP, designed to distinguish between strong and struggling brigades
and the nuances within each brigade. It was found that the information from the
Volunteer Dashboard did not correlate well with the VBP apart from staffing numbers,
as indicated in the previous bullet point. This is not surprising in that the focus of each
measure was different. The Volunteer Dashboard focuses on measurable outcomes
whereas the VBP maps key features within the brigade itself. The Volunteer Dashboard
measures brigade performance against a set of criteria; the VBP measures the key
features of a brigade that affects that performance. The use of both can provide a
valuable insight to a brigade.

83
Considerations and Conclusions
Volunteer fire brigades play an essential role within NZ. They are unique in terms of the
complexity of services they deliver and the expertise required in delivering those services
well. While undertaking this research, we were constantly impressed by the commitment to
excellence many brigades display and had to consciously remind ourselves it was volunteers
being described to us, not paid professionals.
As with all large organisations we find variance and in this case, there was variance between
volunteer brigades. The key focus of this research was to better understand what
differentiates strong and struggling brigades, investigate the causes of these variations, map
those features and provide a method of profiling them for on-going use and development.
In phase one the results indicated that there are thirty factors/themes that differentiate
brigades, 14 of which were mapped as positive factors, which represented a range of features
of strong brigades and 16 negative factors, representing the range of features of struggling
brigades. It is important to note however that no single brigade had all of these features,
either positive or negative. Strong brigades were not characterised by all 14 positive factors
and no struggling brigades had all 16 negative factors. The overall analysis showed that all
thirty factors could be related back to three key themes: Leadership (positive – negative),
Community/demographic (positive – negative), Brigade Culture (positive – negative).
Subsequent analysis of the comments section in the VBP reinforces these three core themes
as being central to most differentiating features between brigades. In short, almost all
descriptions of individual brigades and how they differ from each other stem from within
these three core areas, though the factors that make up these core themes can vary a lot, for
example the Leadership theme can vary from strong to toxic.
Leadership itself was found to be the most dominant theme across the research in both
phases one and two. Whilst leadership didn’t connect with every factor (for example low
call-out rates, or members working out of town during day time were not related to
leadership), it was connected to a wide range of other related factors. Leadership and who

84
held the chief’s position had a considerable ripple effect. No other factor featured as
predominantly as to how a brigade operated. Chiefs were associated with influencing the
brigade culture and professional operational standards, the development of others, the
degree of wider community connectedness and whether or not people wanted to join as
volunteer members. Good chief fire officers resemble good leaders and managers that are
found across most occupational sectors. While the relationship between leadership
capability and style related strongly to brigade functioning, the relationship was not 100%.
Although not prominent, there were examples of brigades that were considered strong,
despite the chief. This occurred within brigades where other members within the
management team were suitably skilled to cover for any of the gaps or deficiencies the chief
had. Similarly, though in the minority, there were good chiefs that simply worked in very
difficult circumstances which resulted in the brigade being seen as struggling, in spite of
their leadership ability.
A very heartening finding was the Recent (Brigade) Improvement factor. Some brigades
that had been previously viewed as struggling were starting to turn around and move into
the strong category. Leadership appeared to play a key role in this development of this, and
it was often due to a new Chief being appointed to the position that was facilitating that
positive transition. This also carried over to increasing membership in communities that had
previously been struggling to attract people to join. Some chiefs, often with wider NZFS
assistance, ran innovative recruitment drives resulting in increased memberships. A key
feature of the analysis in phase three was the importance of a full staffing complement. Of
the brigades viewed in this phase, there were no brigades with a full complement of staff
that were seen as struggling, while conversely, a low complement of staffing was often
identified as a feature of struggling brigades.
Overall, in terms of the Recent Improvement factor, the evidence suggests that struggling
brigades can potentially improve as long as the specific circumstances of what is causing
them to struggle is clearly identified. This is a very important consideration due to the
finding from phase two of this research that across a wide spectrum of factors, each
brigade’s profile was unique whether strong or struggling. In terms of supporting brigades, a
blanket approach to working with brigades or viewing brigades in the same way is not likely
85
to be effective. A full understanding of the situational, environmental, economic,
demographic, group dynamics and leadership features unique to that particular brigade
appears to be essential. A targeted, individual approach should guide any support,
intervention or brigade development. The development of the VBP plays a valuable role
here.
The VBP
Due to the unique nature of volunteer brigades, any measure or psychometric developed
should, by nature of its content, reflect that uniqueness. Hence the items that make up VBP
measure are direct quotes from the internal research participants when differentiating
between strong and struggling brigades. As such, it is a bespoke metric, specific to and in
the natural language of the NZFS volunteer brigades. It encompasses the thirty factors
identified in phase one into a trilemma online questionnaire to produce both a positive and
negative profile. The analysis subsequently showed that brigades that had been identified
as strong in phase one scored predominantly on the positive indicator profile in phase two
and less, if any on the negative indicator profile, while brigades identified as struggling in
phase one scored more predominantly on the negative indicator profile and lower on the
positive indicator profile.
Use of the VBP
From a Psychometric perspective, we are satisfied that the collection of 94 brigade profiles
is a good starting point for the use and integration of the instrument, but it still only
represents approximately a quarter of the number of volunteer brigades in NZ. Measures
mature with ongoing use and reviews of data, so it is important to collect more brigade
profiles from a variety of sources and to be prepared to make alterations if evidence would
suggest changes are needed.
It is important to be clear that the VBP should not be used as part of a performance
management system or used as part of a disciplinary process. It should be used as a
86
research and development tool. Its intention is to map the specific make up of a brigade and
provide insights into areas of potential development and assistance if required.
We believe, however, the VBP has a genuine value in tracking changes within a brigade over
time, for example profiling a brigade pre and post any developmental input. If, for example,
a brigade has mapped as low on Lack of Succession Planning, and some assistance has been
provided to address this, it can then be re- measured at a later date to see if any change in
this area has occurred.
Future research using the VBP could focus on a number of important areas. For example,
the use of the VBP could also assist in the early detection of negative changes within a
brigade. Where a brigade profile has started to shift over time to the more negative
indicators, the VBP would provide an early indicator of the problem and also specifically
pinpoint where that negative shift is occurring.
It could also be applied to research how brigades could be profiled from different
reviewers. For example, do different people see a brigade in similar or different ways? Does
a VSO view and profile a specific brigade in the same way the Area Manager does when
profiling the same brigade? If they view the brigade differently, on what particular factors
do they differ on? What are the implications of such different perspectives for the brigade
itself? If developmental assistance is provided to a brigade to help improve an aspect of
their functioning, how far reaching are any changes seen? Did they have a ripple effect in
terms of how the brigade was seen? Did for example the VSO note an improvement in
succession planning and was that improvement also recorded by the Area Manager though
the VBP? If not, why not? What was the disconnect? Where, if any, was the gap of
knowledge or perception? It would be of potentially great benefit for observers to compare
their profiles of a brigade and explore the areas of difference, if any, and discuss where and
why their perception differs.
The VBP provides a common organizational language in which to understand the dynamic
within a brigade and map its progress. When used as outlined, we believe the VBP will
provide the NZFS with targeted, relevant, focused information on both the strengths and

87
struggles of volunteer brigades in an efficient way. Using combined information gleaned on
the positive and negative indicators of a brigade’s two profiles, any emerging potential risk
or existing risk factors can be readily identified so as to enable the NZFS to implement
brigade support and interventions as deemed appropriate to the brigade’s individual
situation.