eusociality outcompetes egalitarian and solitary ... · reproductive individual only. depending on...
TRANSCRIPT

Ecology and Evolution. 2018;1–12. | 1www.ecolevol.org
1 | INTRODUC TION
The evolution and maintenance of cooperative behavior in animals has been a topic of ongoing interest since the days of Darwin. A num‐ber of possible factors favoring cooperation have been proposed (re‐viewed in Krause & Ruxton, 2002; Nowak, 2006; Lehmann & Keller, 2006; West, Griffin, & Gardner, 2007) including direct benefits of co‐operation and indirect benefits that are received through increased
fitness of relatives (Hamilton, 1964a,b), for instance. We focus on ecological factors and constraints (see e.g., Avila & Fromhage, 2015) as a driving force for the evolution and maintenance of cooperative behavior, specifically resource variance and competition for limited resources.
Food resources, specifically the mean amount of resources as well as resource variance, affect foraging decisions as suggested by risk‐sensitive foraging theory (reviewed in Bednekoff, 1996;
Received:10October2017 | Revised:20September2018 | Accepted:22October2018DOI: 10.1002/ece3.4737
O R I G I N A L R E S E A R C H
Eusociality outcompetes egalitarian and solitary strategies when resources are limited and reproduction is costly
Emanuel A. Fronhofer1,2,3,4 | Jürgen Liebig5 | Oliver Mitesser4 | Hans Joachim Poethke4
This is an open access article under the terms of the Creative Commons Attribution License, which permits use, distribution and reproduction in any medium, provided the original work is properly cited.© 2018 The Authors. Ecology and EvolutionpublishedbyJohnWiley&SonsLtd.
1Department of Aquatic Ecology, Eawag: SwissFederalInstituteofAquaticScienceandTechnology,Dübendorf,Switzerland2Department of Evolutionary Biology and EnvironmentalStudies,UniversityofZurich,Zürich,Switzerland3ISEM,UniversitédeMontpellier,CNRS,IRD,EPHE,Montpellier,France4FieldStationFabrikschleichach,UniversityofWürzburg,Rauhenebrach,Germany5SchoolofLifeSciencesandCenterforSocialDynamicsandComplexity,ArizonaStateUniversity,Tempe,Arizona
CorrespondenceEmanuelA.Fronhofer,InstitutdesSciencesdel’EvolutiondeMontpellier,UMR5554,UniversitédeMontpellier,CC065,MontpellierCedex5,France.Email: [email protected]
Funding informationGerman Research Foundation, Grant/Award Number:SFB554;Eawag
AbstractExplaining the evolution and maintenance of animal groups remains a challenge. Surprisingly,fundamentalecologicalfactors,suchasresourcevarianceandcompeti‐tion for limited resources, tend to be ignored in models of cooperation. We use a mathematical model previously developed to quantify the influence of different groupsizesonresourceuseefficiencyinegalitariangroupsandextenditsscopetogroups with severe reproductive skew (eusocial groups). Accounting for resource limitation,themodelallowscalculationofoptimalgroupsizes(highestresourceuseefficiency)andequilibriumpopulationsizesinegalitarianaswellaseusocialgroupsfor a broad spectrum of environmental conditions (variance of resource supply). We show that, in contrast to egalitarian groups, eusocial groups may not only reduce variance in resource supply for survival, thus reducing the risk of starvation, they may also increase variance in resource supply for reproduction. The latter effect allows reproduction even in situations when resources are scarce. These two facets of eu‐social groups, resource sharing for survival and resource pooling for reproduction, constitute two beneficial mechanisms of group formation. In a majority of environ‐mental situations, these two benefits of eusociality increase resource use efficiency and lead to supersaturation—a strong increase in carrying capacity. The increase in resource use efficiency provides indirect benefits to group members even for low intra‐group relatedness and may represent one potential explanation for the evolu‐tion and especially the maintenance of eusociality and cooperative breeding.
K E Y W O R D S
cooperation, resource sharing, risk‐sensitive foraging, sociality, supersaturation

2 | FRONHOFER Et al.
Kacelnik&Bateson,1996;Smallwood,1996;Bateson,2002).Inthiscontext, group formation has traditionally been seen as a risk‐averse mechanism reducing the variance in resource supply (Caraco, 1981; Caraco,Uetz,Gillespie,&Giraldeau,1995;Clark&Mangel, 1986;Uetz, 1996;Uetz&Hieber, 1997;Wenzel&Pickering, 1991). Thesimple idea behind these models is that foraging success may vary: individuals may find more resources than what they are able to fully utilize,oralternatively,theymaynotfindanyresourcesatall,whichleads to certain death (Figure 1b). Foraging with subsequent egali‐tarian resource sharing in groups allows animals to dampen such en‐vironmental variance (Figure 1a), as all group members will receive an intermediate amount of resources which may guarantee survival andreproduction(seealsoFronhofer,Pasurka,Mitesser,&Poethke,2011).
Yet, as Poethke and Liebig (2008) point out, group formation is not necessarily a variance‐reducing mechanism. It may be seen as an important means of variance manipulation in general: whether variance in resource availability is reduced or increased depends on the degree of reproductive division of labor. While egalitarian re‐source allocation decreases intra‐group variance as explained above (Figure 1a), skewed resource allocation, by contrast, increases vari‐ance (Figure 1c). If resource availability and variance are low, solitary foragers may collect more resources than needed for survival, but not enough to reproduce in one reproductive period. If individuals forage, subsequently pool the surplus of resources not needed for survival and then redirect this surplus toward one (or a few) indi‐vidual(s), individuals in such groups will survive and specific group members have a chance to reproduce. Throughout our analysis, we will use the term “eusocial” for highly skewed reproduction with one reproductive individual only. Depending on the shape of the fertil‐ity function such skewed reproduction clearly may increase fitness, either through direct fitness benefits (for the reproductive individ‐ual) or through indirect fitness benefits (via intra‐group relatedness). Thus, Poethke and Liebig (2008) suggest that egalitarian groups, as
a risk‐reducing foraging strategy, should be favored in environments with high resource variance and eusocial animal groups should be fa‐vored in habitats with low resource variance, since this group struc‐ture increases inter‐individual variance.
Yet, in nature, egalitarian animal groups are only rarely found (Packer, Pusey, & Eberly, 2001). We assume that this discrepancy be‐tween model predictions and empirical observations stems from the fact that previous theoretical work on eusocial group formation as a risk‐sensitive foraging strategy accounts for a limited individual for‐aging rate (including Poethke & Liebig, 2008) but ignores the feed‐back of competition for limited resources, that is, the interaction betweenpopulationsizeandresourceavailability.Moreconcretely,while the relevant models may assume foraging success to be a func‐tion of forager strategies, foraging success is usually not modeled as being a function of the emerging number of individuals, that is, com‐petition for limited resources which leads to density dependence at the population level. However, competition for resources has been shown to be of high relevance in the context of risk‐sensitive forag‐ingingeneral(Fronhofer,Pasurka,Poitrineau,Mitesser,&Poethke,2011) and for egalitarian resource sharing in particular (Fronhofer, Pasurka,Mitesser,etal.,2011).Thelatterworkclearlydemonstratesthat including resource limitation into models of egalitarian resource sharing yields a more complex evolutionary pattern than the simple dichotomy of risk‐prone or risk‐averse behavior.
In the following we will extend the work of Fronhofer, Pasurka, Mitesser,etal. (2011),which focusesonegalitarian resourceshar‐ing, to groups with reproductive skew. We will thus compare two types of cooperative animal groups: On the one hand, individu‐als forming egalitarian groups forage and subsequently share the pooled resources so that every group member receives roughly the same amount of resources (examples include lions and social spi‐ders: Packer et al., 2001; Whitehouse & Lubin, 2005). On the other hand, one can find animal groups in which just one individual re‐ceives all the resources for reproduction while the other members
F I G U R E 1 Schematiccomparisonofdifferentmodesofresourcesharingingroupsofanimals.Individualscollectresourcesindividuallyandvaryintheirsuccessoveronereproductiveperiod(i.e.,aseason).Solitaryindividuals(b)thusdifferintheamountofresourcesindividualsmayuseforsurvival(lightgray)andreproduction(darkgray).Someindividuals(3,5,andN) will die of starvation and not reproduce because they are not able to cross the survival threshold (dashed line). In egalitarian groups (a), resources are evenly shared after solitary foraging (b). All individuals can survive and receive a small amount for reproduction. In eusocial groups (c), individuals receive sufficient resources for survival and channel all remaining resources to the reproductive dominant individual (here individual 1). Of course, the evolutionary advantages of these resource sharing strategies will be impacted by how resources are exactly translated into survival and offspring, that is, the mortality and fertility functions, which is beyond the scope of this schematic representation. Note that the term “eusocial” group in this context only implies that only one individual will reproduce
(a) (b) (c)E
| 3FRONHOFER Et al.
of the group only obtain a share necessary for their survival (Wilson, 1971; Clutton‐Brock, West, Ratnieks, & Foley, 2009, for example, eusocial insectsormole‐rats).Suchgroupsarehenceforth termed“eusocial.” The term “despotic,” which one may also find in the liter‐ature, is equivalent here. Of course, egalitarian and eusocial groups are rare situations at the ends of a continuum of different degrees of reproductive division of labor (that is, skew, for a review see Reeve & Keller, 2001). Evidently, as Sherman, Lacey, Reeve, and Keller(1995) point out, other degrees of reproductive division of labor in between these two extremes are possible and often encountered (for numerous examples from insect societies alone see Wilson, 1971; Hölldobler & Wilson, 1990; Costa, 2006; Hölldobler & Wilson, 2009). Nevertheless, theory suggests that these extremes may be favored over intermediate strategies (Cooper & West, 2018). We will here focus on the extremes for simplicity.
We will calculate the amount of resources required by groups acrossdifferentgroupsizesinpopulationequilibrium.Thisallowsusto compare the competitive ability of the different strategies (type T ∊ {“egalitarian”, “eusocial”}andsizeofgroupN ∊ {1, 2, 3, …}) and to determineoptimumgroupsizesforegalitarianandeusocialgroupsbyidentifyingthegroupsizesthataremostcompetitive,thatis,min‐imizetheamountofresourcesrequiredatequilibrium.Wefindthat,in contrast to egalitarian groups, eusocial groups may not only re‐duce variance in resource supply for survival, thus reducing the risk of starvation, they may also increase variance in resource supply for reproduction within the group. The latter effect allows reproduction even in situations when resources are scarce, which gives eusocial groups a competitive advantage over egalitarian groups and solitary strategies, specifically when resources are limiting and reproduction is costly. At the population level, this competitive advantage leads to increased carrying capacities, a phenomenon which has been termed “supersaturation” in cooperatively breeding birds (Dickinson & Hatchwell, 2004).
2 | MODEL DESCRIPTION AND NUMERIC AL RESULTS
2.1 | Resource availability
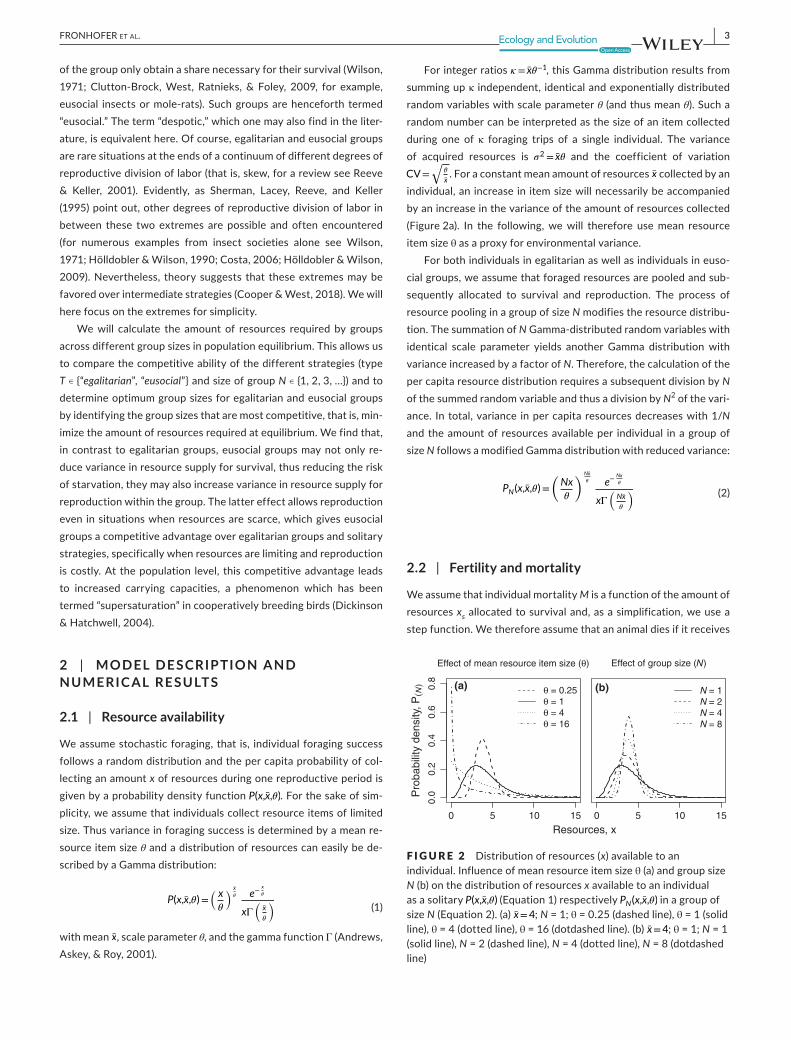
We assume stochastic foraging, that is, individual foraging success follows a random distribution and the per capita probability of col‐lecting an amount x of resources during one reproductive period is given by a probability density function P(x,x̄,𝜃). For the sake of sim‐plicity, we assume that individuals collect resource items of limited size.Thusvarianceinforagingsuccessisdeterminedbyameanre‐sourceitemsizeθ and a distribution of resources can easily be de‐scribed by a Gamma distribution:
with mean x̄, scale parameter θ, and the gamma function Γ (Andrews, Askey, & Roy, 2001).
For integer ratios 𝜅= x̄𝜃−1, this Gamma distribution results from summing up κ independent, identical and exponentially distributed random variables with scale parameter θ (and thus mean θ).Sucharandomnumbercanbeinterpretedasthesizeofanitemcollectedduring one of κ foraging trips of a single individual. The variance of acquired resources is 𝜎2= x̄𝜃 and the coefficient of variation CV=
√𝜃
x̄. For a constant mean amount of resources x̄ collected by an
individual,anincreaseinitemsizewillnecessarilybeaccompaniedby an increase in the variance of the amount of resources collected (Figure 2a). In the following, we will therefore use mean resource itemsizeθ as a proxy for environmental variance.
For both individuals in egalitarian as well as individuals in euso‐cial groups, we assume that foraged resources are pooled and sub‐sequently allocated to survival and reproduction. The process of resourcepoolinginagroupofsizeN modifies the resource distribu‐tion. The summation of N Gamma‐distributed random variables with identical scale parameter yields another Gamma distribution with variance increased by a factor of N. Therefore, the calculation of the per capita resource distribution requires a subsequent division by N of the summed random variable and thus a division by N2 of the vari‐ance. In total, variance in per capita resources decreases with 1/N and the amount of resources available per individual in a group of sizeN follows a modified Gamma distribution with reduced variance:
2.2 | Fertility and mortality
We assume that individual mortality M is a function of the amount of resources xs allocated to survival and, as a simplification, we use a step function. We therefore assume that an animal dies if it receives
(1)P(x,x̄,𝜃)=
(x
𝜃
) x̄
𝜃 e−
x
𝜃
xΓ
(x̄
𝜃
)
(2)PN(x,x̄,𝜃)=
(Nx
𝜃
) Nx̄
𝜃 e−
Nx
𝜃
xΓ
(Nx̄
𝜃
)
F I G U R E 2 Distribution of resources (x) available to an individual.Influenceofmeanresourceitemsizeθ(a)andgroupsizeN (b) on the distribution of resources x available to an individual as a solitary P(x,x̄,𝜃) (Equation 1) respectively PN(x,x̄,𝜃) in a group of sizeN (Equation 2). (a) x̄=4; N = 1; θ = 0.25 (dashed line), θ = 1 (solid line), θ = 4 (dotted line), θ = 16 (dotdashed line). (b) x̄=4; θ = 1; N = 1 (solid line), N = 2 (dashed line), N = 4 (dotted line), N = 8 (dotdashed line)
0.0
0.2
0.4
0.6
0.8
(a)
Effect of mean resource item size (θ)
θ = 0.25θ = 1θ = 4θ = 16
0 5 10 15 0 5 10 15
(b)
Effect of group size (N)
N = 1N = 2N = 4N = 8
Resources, x
Pro
babi
lity
dens
ity, P
(N)

4 | FRONHOFER Et al.
less resources than a certain threshold resource value (oM) and sur‐viveswithprobability(1−M(xs)) if it receives more (Figure 3):
with the resource independent baseline mortality Mb, resulting from predationordisease, for instance.Wepreviouslyanalyzed the in‐fluence of including a sigmoid function for mortality and could show that this does not change our results qualitatively (Fronhofer, Pasurka,Mitesser,etal.,2011).
Pooled resources are first allocated to survival of group mem‐bers until all individuals have received the amount xs = oM preventing death from starvation. Individuals die if there are not sufficient re‐sources available. We thus get for the per capita mortality in a group ofsizeN:
All remaining resources are allocated to reproduction, either by giving them to a single reproductively dominant individual (euso‐cial groups) or by equally sharing them between all members of the group (egalitarian groups). In general, reproduction F is a function of the resources available per capita x. As fertility is not unlimited, the functional relationship between fertility and the resources remaining after consumption for survival xr = max(0, x−oM) allo‐cated to reproduction can be assumed to follow a sigmoid shape (Figure 3):
where Fmax determines fecundity, that is, the maximal value the re‐production function can take. For low values of xr, the steepness of the fertility function is determined by 1/c0. Therefore, c0 can be in‐terpreted as the cost of reproduction. For an overview of parameter combinations under consideration see Table 1.
Using Equation5,wemay calculate the per capita natality forindividualsingroupsofsizeNasafunctionofgroupsize.Forindivid‐uals in egalitarian groups one obtains
and for individuals in eusocial groups with only one reproductive individual
with xr = max(0, x−oM). Note that expression 7 can be generated from expression 6 by shifting the evaluation of the fertility function to N times greater resource values and dividing by the number of individuals for calculation of the per capita rate.
Both per capita natality (Equations 6 and 7) and mortality (Equation 4) are functions of the distribution of resources acquired by individuals (PN(x,x̄,𝜃), Equation 2). While fertility increases with the amount of resources available to individuals, mean mortality decreases when resources become more abundant. We assume that resources are limited. Thus, resources available to individu‐alsdecreasewithincreasingpopulationsizeandpopulationsreach
(3)M(xs)=
{1 if xs<oM
Mb if xs≥oM
(4)𝜇(N,x̄,𝜃)=∫∞
0
PN(xs,x̄,𝜃)M(xs)dxs
(5)F(xr)=Fmax
⎛⎜⎜⎝1−e
−
�xr
c0Fmax
�2⎞⎟⎟⎠
(6)𝜙egalitarian(N,x̄,𝜃)=∫∞
0
PN(x,x̄,𝜃)F(xr)dx
(7)𝜙eusocial(N,x̄,𝜃)=1
N ∫∞
0
PN(x,x̄,𝜃)F(Nxr)dx
F I G U R E 3 Influence of model parameters on the fertility function (F(x = xr); solid line) and the mortality function (M(x = xs); dashed line) for four exemplary parameter combinations. (a) standard parameter set (Fmax = 3; c0 = 4; Mb = 0.1; oM = 1); (b) increased mortality (Fmax = 3; c0 = 4; Mb = 0.2; oM = 1); (c) increased cost of reproduction (Fmax = 3; c0 = 8; Mb = 0.1; oM = 1); (d) increased fecundity (Fmax = 5; c0 = 4; Mb = 0.1; oM = 1)
(a)
Standard scenario
Fertility, FMortality, M
(b)
Increased mortality
(c)
Increased cost of reproduction
0 5 10 15 20
0.0
1.0
2.0
3.0
0 5 10 15 20 0 5 10 15 20 0 5 10 15 20
(d)
Increased fecundity
0.0
0.4
0.8
Mor
talit
y, M
Resources, x
Fer
tility
, F
TA B L E 1 Modelparameters,meaningandtestedvalues.Notethat fecundity (Fmax) is a net rate, that is, for solitaries Fmax = 5 leads toaquintuplingofpopulationsize
Parameter Values Meaning
Fmax [3, 5] Fecundity, i.e., maximal number of offspring
c0 [4, 8] Costs of offspring production
θ ]0, 32] Environmental variance (mean itemsize)
Mb [0.1, 0.2] Baseline mortality (resource independent)
oM 1.0 Minimumamountofresourcesneeded for survival

| 5FRONHOFER Et al.
theirequilibriumpopulationsize (“carryingcapacity”)whenmor‐tality balances natality. We may thus formulate the equilibrium condition for populations consisting of individuals in groups of sizeN as
Equation 8 yields an implicit relation that allows us to determine theinfluenceofgroupsizeNandresourceitemsizeθ on the minimal mean amount of resources x̄N per individual needed to balance re‐production and mortality (Figure 4a). The carrying capacity is then determined by the total amount of resources available (X) and the minimal amount of resources required per individual x̄N:
IfcurrenttotalpopulationsizeNtot is less than K, the mean per capita amount of resources available for individuals (x̄) is greater than x̄N resulting in an increase in population size as natality is greaterthan mortality. The opposite is the case if Ntot > K.
We assume that the evolution of an optimal grouping strategy (group size and type) will increase resource use efficiency, thusminimizingresourcerequirementinequilibriumandmaximizingcar‐rying capacity (see among othersMacArthur, 1962;MacArthur&Wilson,1967;Boyce,1984;Lande,Engen,&Saether,2009).Amin‐imization of x̄N (Figure 4) thus allows us to determine the optimal groupsizeNopt(Fronhofer,Pasurka,Mitesser,etal.,2011;Fronhofer,Pasurka, Poitrineau, et al., 2011). Clearly, it is well known that evolu‐tiondoesnotgenerallymaximizecarryingcapacity(e.g.,Fronhofer&Altermatt,2015;Fronhofer,Nitsche,&Altermatt,2017;Matessi&Gatto,1984;Reznick,Bryant,&Bashey,2002).Inordertoshowthat, under the model assumptions outlined above, optimal strate‐giesthatmaximizecarryingcapacityareindeedcontinuouslystablestrategies, we compare the results of our optimality approach with aninvasibilityanalysisintheAppendixS1.
Strictly speaking, our reasoning only holds if all group mem‐bers have the possibility to reproduce, which, of course, is given in egalitarian groups and holds for eusocial groups if the reproductive individual is determined by a lottery. However, in eusocial groups, subordinates may never be able to reproduce. In the latter case, the optimal group size derived as described abovemay not be evolu‐tionarily stable, as subordinates will mainly benefit from indirect fitness gains via relatedness. This implies that we have to take into account the degree of intra‐group relatedness. For simplicity, we will first present results that hold true if the reproductive individual of eusocial groups is defined by a lottery or if intra‐group relatedness equals 1. We will then relax this assumption, introduce intra‐group relatedness <1 into our model and explore its robustness in the sec‐tion “Joining or leaving a group: evolutionary stability of eusocial groups” below.
2.3 | Optimal group sizes and minimum resource requirements
As Equation 8 cannot be solved analytically, we approximated the results numerically. Figure 5 gives the resulting mean amount of resources needed at population equilibrium and the correspond‐ent optimal group sizes for a broad range of environmental vari‐ance (0.1≤θ≤16). For amean amount of resources collectedperindividual of approximately x̄≈4, this corresponds to a coefficient ofvariationrangingfromCV≈0.16toCV≈2(seeEquations1andFigure 2). The results reveal that reproductive skew in eusocial groups experiencing competition does not simply increase inter‐in‐dividual variance, and the benefit of this strategy is not restricted to situations of low environmental variance, as postulated by Poethke and Liebig (2008).
A careful analysis of the results reveals that we must distinguish three fundamentally different situations: Firstly, for very low values of environmental variance (approx. θ≤1;Figure5,leftdottedline)areduction of variance would actually decrease the expected fitness of individuals. This is due to the fact that under low resource avail‐ability (which is implied in our population equilibrium assumption; Equation 8) the fertility function is convex (Figure 3) and Jensen’s
(8)𝜙(N,x̄N,𝜃)=𝜇(N,x̄N,𝜃).
(9)K(N)=X
x̄N
.
F I G U R E 4 Influenceofgroupsizeon(a)meanamountofresources needed to balance mortality and fertility in eusocial groups and (b) corresponding carrying capacity. Carrying capacity is shown relative to the carrying capacity of the solitary strategy. Numerical solution of Equation 8 for Fmax = 3, c0 = 4, Mb = 0.1, θ = 5 and oM = 1
Mea
n re
sour
ces
need
edin
equ
ilibr
ium
, x
1 Nopt Nmax
x(N
opt)
x (1 )
Relative advantageof cooperation
(a)
Car
ryin
g ca
paci
ty, K
29191
11.
21.
41.
61.
8 (b)
Group size, N
6 | FRONHOFER Et al.
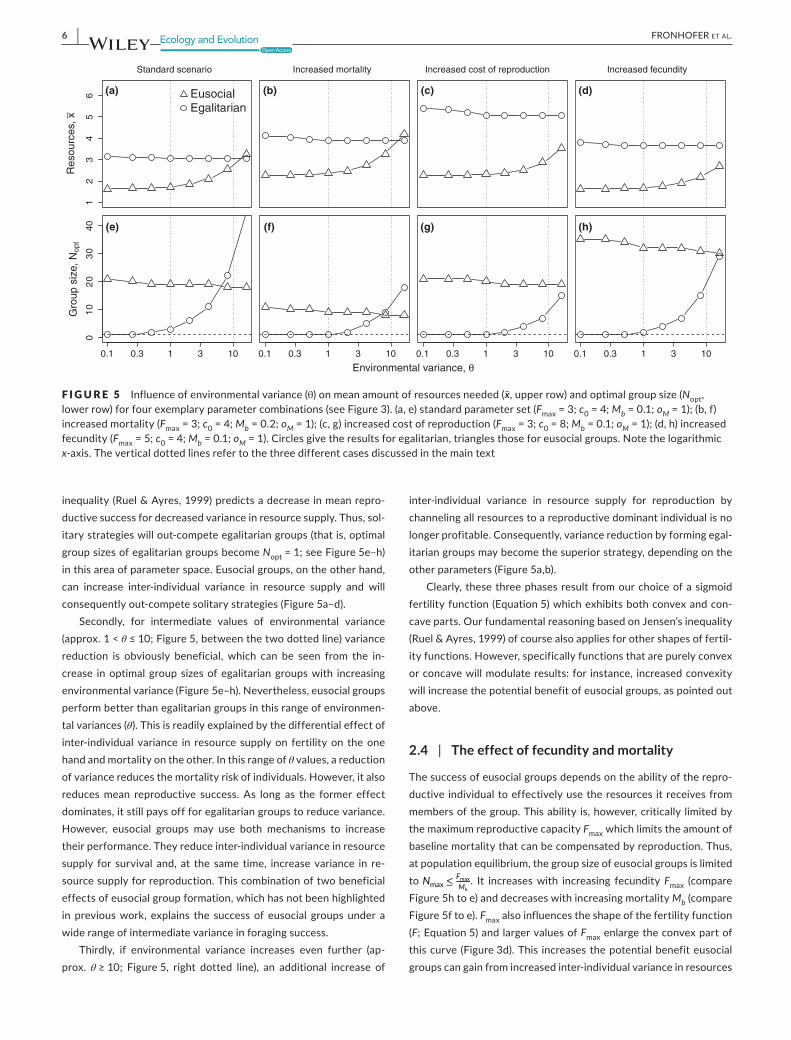
inequality (Ruel & Ayres, 1999) predicts a decrease in mean repro‐ductive success for decreased variance in resource supply. Thus, sol‐itary strategies will out‐compete egalitarian groups (that is, optimal groupsizesofegalitariangroupsbecomeNopt = 1; see Figure 5e–h) in this area of parameter space. Eusocial groups, on the other hand, can increase inter‐individual variance in resource supply and will consequently out‐compete solitary strategies (Figure 5a–d).
Secondly, for intermediate values of environmental variance(approx. 1 < θ≤10;Figure5,betweenthetwodottedline)variancereduction is obviously beneficial, which can be seen from the in‐crease inoptimalgroupsizesofegalitariangroupswith increasingenvironmental variance (Figure 5e–h). Nevertheless, eusocial groups perform better than egalitarian groups in this range of environmen‐tal variances (θ). This is readily explained by the differential effect of inter‐individual variance in resource supply on fertility on the one hand and mortality on the other. In this range of θ values, a reduction of variance reduces the mortality risk of individuals. However, it also reduces mean reproductive success. As long as the former effect dominates, it still pays off for egalitarian groups to reduce variance. However, eusocial groups may use both mechanisms to increase their performance. They reduce inter‐individual variance in resource supply for survival and, at the same time, increase variance in re‐source supply for reproduction. This combination of two beneficial effects of eusocial group formation, which has not been highlighted in previous work, explains the success of eusocial groups under a wide range of intermediate variance in foraging success.
Thirdly, if environmental variance increases even further (ap‐prox. θ≥10; Figure5, right dotted line), an additional increase of
inter‐individual variance in resource supply for reproduction by channeling all resources to a reproductive dominant individual is no longer profitable. Consequently, variance reduction by forming egal‐itarian groups may become the superior strategy, depending on the other parameters (Figure 5a,b).
Clearly, these three phases result from our choice of a sigmoid fertility function (Equation 5) which exhibits both convex and con‐cave parts. Our fundamental reasoning based on Jensen’s inequality (Ruel & Ayres, 1999) of course also applies for other shapes of fertil‐ity functions. However, specifically functions that are purely convex or concave will modulate results: for instance, increased convexity will increase the potential benefit of eusocial groups, as pointed out above.
2.4 | The effect of fecundity and mortality
The success of eusocial groups depends on the ability of the repro‐ductive individual to effectively use the resources it receives from members of the group. This ability is, however, critically limited by the maximum reproductive capacity Fmax which limits the amount of baseline mortality that can be compensated by reproduction. Thus, atpopulationequilibrium,thegroupsizeofeusocialgroupsislimitedto Nmax≤ Fmax
Mb
. It increases with increasing fecundity Fmax (compare Figure 5h to e) and decreases with increasing mortality Mb (compare Figure 5f to e). Fmax also influences the shape of the fertility function (F; Equation 5) and larger values of Fmax enlarge the convex part of this curve (Figure 3d). This increases the potential benefit eusocial groups can gain from increased inter‐individual variance in resources
F I G U R E 5 Influence of environmental variance (θ) on mean amount of resources needed (x̄,upperrow)andoptimalgroupsize(Nopt, lower row) for four exemplary parameter combinations (see Figure 3). (a, e) standard parameter set (Fmax = 3; c0 = 4; Mb = 0.1; oM = 1); (b, f) increased mortality (Fmax = 3; c0 = 4; Mb = 0.2; oM = 1); (c, g) increased cost of reproduction (Fmax = 3; c0 = 8; Mb = 0.1; oM = 1); (d, h) increased fecundity (Fmax = 5; c0 = 4; Mb = 0.1; oM = 1). Circles give the results for egalitarian, triangles those for eusocial groups. Note the logarithmic x‐axis. The vertical dotted lines refer to the three different cases discussed in the main text
EusocialEgalitarian
(a)
Standard scenario
12
34
56
01
02
03
040 (e)
(b)
Increased mortality
(f)
(c)
Increased cost of reproduction
(g)
(d)
Increased fecundity
0.1 0.3 1 3 10 0.1 0.3 1 3 10 0.1 0.3 1 3 10 0.1 0.3 1 3 10
(h)
Environmental variance, θ
Res
ourc
es, x
Gro
up s
ize,
Nop
t

| 7FRONHOFER Et al.
for reproduction. Consequently, in eusocial groups, the amount of resources needed at population equilibrium decreases and optimal groupsizesseverelyincreasewithincreasingvaluesofFmax (compare Figure 5d to a). A similar argument holds for increased cost of repro‐duction c0. c0 also increases the convex part of the fertility func‐tion (Figure 3c) and consequently increases the benefit of eusocial groups (Figure 5c).
For egalitarian groups, the influence of Fmax on resources needed at population equilibrium as well as on optimal group sizes is farless pronounced. As larger values of Fmax enlarge the convex part of the fertility function and intra‐specific competition reduces the amount of resources available for reproduction xr, the variance re‐ducing effect of egalitarian resource sharing actually reduces mean fertility 𝜙(N,x̄,𝜃). Thus, the amount of resources x̄ needed by egali‐tariangroupsincreases(compareFigure5dtoa)andgroupsizesofegalitarian groups decrease (compare Figure 5h–e) with increasing fecundity Fmax.
Baseline mortality Mb has a similar effect on resource require‐ment. It increases the amount of resources x̄ needed because higher baseline mortality must (at equilibrium) be compensated by higher reproduction and consequently by higher mean amounts of re‐sources acquired. By contrast, costs of reproduction c0 have only a negligible effect on the amount of resources needed x̄ as well as on optimalgroupsizesNopt of egalitarian groups.
2.5 | Joining or leaving a group: evolutionary stability of eusocial groups
For all results presented above, we assume that, whenever a large population of groups of size Npop>1 utilizes resources more ef‐ficiently (that is, reaches a higher carrying capacity) than a popu‐lation of solitary individuals it can, in principle, not be invaded by individuals following a solitary strategy. This phenomenon is known from cooperatively breeding birds as “supersaturation” (Dickinson & Hatchwell, 2004). The group strategy of sizeNpop > 1 evolves be‐cause, at population equilibrium, the groups would drive mean re‐source availability below the critical value that allows the growth of a solitary strategy.
As pointed out above, our results hold true for egalitarian groups in general and for eusocial groups if the reproductive individual is determined by a lottery or if intra‐group relatedness equals 1. However, in eusocial groups, the reproductive individual is often not determined by a lottery and intra‐group relatedness is likely <1. Therefore,directfitnessofsubordinatesiszeroandtheadvantageof subordinates living in a eusocial group is solely determined by in‐direct fitness benefits, that is, by its relatedness to the offspring of the dominant individual (Hamilton, 1964a,b), if we ignore other di‐rect benefits such as queuing for a dominant position (see, for exam‐ple, Kokko & Johnstone, 1999). Thus, it would clearly be beneficial to leaveagroupofsizeNpop, and such groups would become unstable, ifthefitnessofasolitaryindividualinapopulationofgroupsofsizeNpop exceeds the (inclusive) fitness of a subordinate in a group of sizeNpop.
To analyze the evolutionary stability of different strategies(that is, different group sizesN) in a heuristic extension of our model, we use a simple fitness measure: the lifetime reproductive success of an individual (Ψ). For our model, lifetime reproductive success may be derived from mean fertility 𝜙(N,x̄,𝜃) (Equation 7) and the mean lifetime 1
𝜇(N,x̄,𝜃) (according to Equation 4) of individu‐
als as Ψ=𝜙(N,x̄,𝜃)
𝜇(N,x̄,𝜃). ΨisafunctionofthesizeN of the group an indi‐
vidualisamemberof,themeansizeofresourceitemsθ collected by individuals and the mean amount of resources collected x̄. As the latter is itself an emergent property resulting from intra‐spe‐cific competition in an equilibrium population of groups of sizeNpop, we may denote it as Ψ(N, Npop, θ). In a habitat saturated by groupswithaspecificgroupsizeNpop = N, the rate of increase of groupsofthesamesizewillbeΨ(N, N, θ) = 1 at equilibrium, while it may take different values Ψ(Ni, N, θ)≠1foranyothergroupsizeNi when N≠Ni.
So far, we have used Ψ as the mean fitness of a strategy. However, in eusocial groups, the inclusive fitness Φ of an indi‐vidual depends on its role. The inclusive fitness Φsub(N, N, θ) of subordinatesinagroupofsizeN living in an infinitely large pop‐ulationof groupsof the same sizeN is determined by their life expectancy 1
𝜇(N,x̄N ,𝜃) and the fertility N ⋅𝜙(N,x̄N,𝜃) of the related dom‐
inant as
where r denotes the coefficient of relatedness while the mean amount of resources collected per individual x̄N is a function of the population strategy N. When subordinates defect, leave the group and live as solitary individuals (Ni = 1) they will lose indirect fitness benefits (as the related group now lacks one subordinate helper) but gain direct fitness benefits as a reproducing solitary individual. Now their inclusive fitness will be
Note that, strictly speaking, the inclusive fitness approach only holds as long as a strategy is not more likely to interact with itself than with unrelated strategies (for a detailed discussion see, for ex‐ample,Hines&Maynard Smith, 1979). Subordinates should leavethe group whenever leaving would result in a net increase in inclu‐sive fitness, that is, when
Equation 12 allows to derive the minimum relatedness rmin pre‐venting individuals from leaving a group, that is, the minimum relat‐edness that allows the evolutionary stability of eusocial groups (see Figure 6).
Numerical solutions of Equation 12 (Figure 6) show that, particularly for low environmental variance θ, the benefit of eu‐social groups is sufficient to make the role of subordinate group members attractive even for individuals only modestly related to
(10)Φsub(N,N,𝜃)= rN𝜙(N,x̄N,𝜃)
𝜇(N,x̄N,𝜃)
(11)Φdef(1,N,𝜃)=𝜙(1,x̄N,𝜃)
𝜇(1,x̄N,𝜃)+ r
(N−1)𝜙(N−1,x̄N,𝜃)
𝜇(N−1,x̄N,𝜃).
(12)Φdef(1,N,𝜃)>Φsub(N,N,𝜃).

8 | FRONHOFER Et al.
the dominant (rmin≈0.1).While increased baseline mortalityMb (Figure 6b) increases the relatedness necessary for the stability of eusocial groups, increased cost of reproduction c0 (Figure 6c) and increased fecundity Fmax (Figure 6d) significantly decrease it and make eusocial groups evolutionarily stable even for extremely high environmental variance and low coefficients of relatedness (r < 0.25).
3 | DISCUSSION
In contrast to the work of Poethke and Liebig (2008), the present model explicitly quantifies birth and death rates as functions of resource availability. This allows us to take into account competi‐tion for resources between individuals (see also Pen & Weissing, 2000) which reduces resource availability and ultimately results in selection for resource‐use efficiency. Our results show that, for a broad spectrum of model parameters, cooperative breeding with resource sharing, and in particular, the formation of eusocial groups with extreme reproductive skew, may substantially increase carrying capacity (Figure 5a–d). This will lead to the competitive exclusion of solitary foragers and breeders, a phenomenon known from cooperatively breeding birds as “supersaturation” (Dickinson & Hatchwell, 2004) which also makes a reversion to solitary breed‐ing less likely.
Our results demonstrate the potential of variance manipulation as a driving force for the evolution of cooperative animal groups. It may thus have contributed to the evolution of eusocial animal groups.More importantly, thedemonstrated ecological benefit ofgroup formationmayhavebeen important for the stabilizationofcooperative breeding or eusociality after the transition from soli‐tary life had already occurred, as our model does not explicitly con‐sider the initial mechanism of group formation. Our model provides an ecological explanation for the benefit of group formation which sets it apart from previous models of reproductive skew (Johnstone, 2000; Reeve & Keller, 2001; Vehrencamp, 1983) that are often based on a predefined arbitrary benefit of group formation. In our simple
consumer‐resource model such an assumption is not required, as group formation evolves because of the emergent advantages of variance manipulation.
As mentioned earlier, Poethke and Liebig (2008) demonstrate that egalitarian group formation, a variance reducing foraging strat‐egy, is favored at high resource variances and that, by contrast, euso‐cial groups or cooperative breeding is advantageous when resource variance is low, because this strategy increases inter‐individual vari‐ance in resource supply. However, when competition for resources is taken into account, as in the present study as a result of our popula‐tion equilibrium assumption (Equation 8), these predictions change. Eusocial groups remain at a clear advantage for low resource vari‐ances but become advantageous even for intermediate and rather high variance in resource availability (see Figure 5). This is due to the beneficial effects of eusocial groups on resource variance: (a) inter‐individual variance is indeed increased for reproduction, which makes reproduction possible even when solitary individuals do not collect sufficient resources for survival and reproduction. (b) At the same time, for survival the opposite is true, individuals that do not collect sufficient resources for survival as solitaries may survive in the group because they profit from resource sharing. The combined effect of these two mechanisms may explain the dominance of euso‐ciality over egalitarian group.
3.1 | Model limitations
Throughoutthiswork,wehaveanalyzedtheformationofeusocialgroups under equilibrium conditions. However, in a temporally and spatially heterogeneous landscape, and particularly in a metapopula‐tion (Fronhofer, Kubisch, Hilker, Hovestadt, & Poethke, 2012), one will always find local populations that have not reached equilibrium density,yet. Innewlycolonizedlocalhabitatpatches,forexample,resources will usually be rather abundant and competition will be weak. This will necessarily favor solitary strategies with their high potential offspring numbers. Thus, landscape fragmentation and temporal heterogeneity in resource availability may lead to the co‐existence of eusocial and solitary strategies.
F I G U R E 6 Influence of environmental variance (θ) on minimum relatedness rmin of group members required to secure stability of eusocial groupsofoptimalgroupsize(Nopt, see Figure 5e–h) for four exemplary parameter combinations. (a) standard parameter set (Fmax = 3; c0 = 4; Mb = 0.1; oM = 1); (b) increased mortality (Fmax = 3; c0 = 4; Mb = 0.2; oM = 1); (c) increased cost of reproduction (Fmax = 3; c0 = 8; Mb = 0.1; oM = 1); (d) increased fecundity (Fmax = 5; c0 = 4; Mb = 0.1; oM = 1). Note the logarithmic x‐axis
(a)
Standard scenario
(b)
Increased mortality
(c)
Increased cost of reproduction
(d)0.
00.
20.
40.
60.
81.
0
0.1 0.3 1 3 10 0.1 0.3 1 3 10 0.1 0.3 1 3 10 0.1 0.3 1 3 10
Increased fecundity
Environmental variance, θ
Rel
ated
ness
, rm
in

| 9FRONHOFER Et al.
Whilewedoanalyzetheconsequencesofrelatedness,andshowthat the ecological benefits of eusociality may be very large, which makes eusocial groups evolutionarily stable even at low levels of re‐latedness, our modeling procedure implicitly assumes that groups have already been formed and ignores the process of group forma‐tion. Group formation strategies are diverse and include the estab‐lishment of entire colonies after nest foundation by a single or few individuals as observed in halictid bees or wasps, for example, but also establishment after colony fission as in highly eusocial insect species like honeybees or ants. Our omission of the group formation process necessarily limits the scope of our analyses and highlights that our model may be best thought of as showcasing ecological benefitsthatarerelevantforthemaintenanceandincreaseinsizeof already existing eusocial groups. Note that these restrictions do not apply to eusocial groups in which all members initially have a chancetobecomethedominantindividual.Suchgroupscanevolveby mutualism and indirect fitness benefits via relatedness are not necessary(seee.g.,Rissing,Pollock,Higgins,Hagen,&Smith,1989).
Furthermore, it is important to note that our inclusive fitness analysis is heuristic in the sense that we do not use an explicit model of evolutionary competition between different strategies. As Olejarz,Allen,Veller,andNowak(2015)haveshownrecently,inva‐sibility and stability of an altruistic allele need not be linear in any relatedness parameter and our analysis must therefore be seen as a conceptual extension of our model and not as an in‐depth analysis.
In addition to the points discussed with regards to relatedness, in both the egalitarian and eusocial case resource redistribution rules according to group type might be violated by cheating individuals which try to increase their reproductive share. However, this addi‐tional level of complexity is out of the scope of our approach and buthasbeenanalyzedelsewhere,forinstancebyHamilton(2004),Wenseleers,Helanterä,Hart,andRatnieks(2004),orSchneiderandBilde (2008).
A further limitation of our model is its comparison of only the two extreme cases of group formation (egalitarian vs. eusocial groups), while in nature one will observe a continuum of cooperative strategies (see,e.g.,Shermanetal.,1995,butseeCooper&West,2018). While this may impact our results quantitatively, the two beneficial mechanisms of eusocial group formation discussed above remain potentially important ecological mechanisms responsible for the evolution and maintenance of eusocial groups.
Of course, other factors (e.g., reviewed in Krause & Ruxton, 2002; Nowak, 2006; Lehmann & Keller, 2006) will also play a role for the evolution of eusociality and the relative importance of the different mechanisms may vary. Nevertheless, our model is general in the sense that dealing with limited resources and variance in re‐source supply are challenges likely faced by a majority of organisms.
Clearly, the ecological conditions we consider exclusively relate to the distribution and especially the variance in resource supply. While our model shows the relevance of intraspecific competition for resources, we do not consider interspecific competition or pre‐dation, for instance (seeRankin, López‐Sepulcre, Foster,&Kokko,2007; Tsuji, 2013).
Finally, the assumption that evolutionwillminimize resourcerequirementandthereforemaximizecarryingcapacityisvalidforourmodel(seeAppendixS1foraninvasibilityanalysis).However,this hinges upon our description of the resource distribution (Equation 1) and the implicit assumption that the environmen‐tal resource distribution itself does not change over time (see AppendixS1).Therefore,ourresultsarevalidforconsumersthatfeed on abiotic, renewing resources or for other consumer‐re‐sourcesystemsinwhichassimilationefficiencyismaximized(seealsoFronhofer&Altermatt,2015;Matessi&Gatto,1984;Reznicket al., 2002).
3.2 | Empirical examples
It is interesting to note that, in our model, the increase in carrying capacity is generally more pronounced in eusocial than in egalitar‐ian groups. Our model thus suggests that eusocial groups should dominate for a majority of environmental settings and life‐history strategies. Although our model is very simple and compares only the extreme cases of egalitarian and eusocial groups, the dominance of eusocial groups in nature can be observed empirically: most coop‐erative societies are eusocial while truly egalitarian groups seem to be rare (Packer et al., 2001).
Typical eusocial groups are found among insects. In accordance with our model, the ubiquitously present and very successful ants alone show a fascinating array of different life‐history strategies and feed on resources with typically low but also high variance (Hölldobler & Wilson, 1990). Interestingly, egalitarian societies have been reported from two ant species, Ooceraea (formerly Cerapachys) biroi (Tsuji & Yamauchi, 1995) and Pristomyrmex punctatus (Tsuji & Dobata, 2011), in which all workers reproduce and help oth‐ers. While we can only speculate with regards to the evolutionary forces responsible for this secondarily evolved egalitarian behavior, Pristomyrmex punctatus shows rather low fecundities (Tsuji, 1988) and their nomadic life history may suggest important variance in re‐sources, which is in line with our model predictions.
While these examples come from highly derived insect soci‐eties, our model may be more appropriate for primitively euso‐cial insects where subordinates are not sterile, for instance. An additional example are polistine wasps (reviewed in the context of skew theory in Reeve & Keller, 2001): While in the founding phase of a wasp nest the chance of becoming the reproductively dominant will make joining another female an attractive strategy, the probability to stay and accept the role of a “worker” will ulti‐mately depend on the relatedness with the reproductively domi‐nant individual. However, when an expensive nest is a prerequisite of successful reproduction this will change the shape of the fer‐tility function. Suchprimary investmentsmaybemodeled as anoffset that shifts the fertility function toward higher amounts of resources needed (Fronhofer, Pasurka,Mitesser, etal., 2011).Additional investments make reproduction more costly and will thus severely reduce the relatedness rmin (see Figure 6c) necessary tostabilizeeusocialgroups.

10 | FRONHOFER Et al.
Cooperative systems with non‐reproductive helpers can also be found in cooperatively breeding birds (Dickinson & Hatchwell, 2004) and the phenomenon of “supersaturation” has been well described in his context. In line with our results that predict an advantage of eusocial groups at low baseline mortalities, Arnold and Owens (1998) report that cooperatively breeding birds that demonstrate some reproductive skew are generally character‐ized by low mortality rates. Furthermore, cooperative breedingseems to be consistently associated with low environmental vari‐ance in nature (Arnold & Owens, 1998, 1999; Ford, Bell, Nias, & Noske, 1988;Gonzalez, Sheldon,&Tobias, 2013), although Jetzand Rubenstein (2011) find evidence for the opposite pattern. Our model corroborates these findings as it predicts an advantage for cooperative breeding and eusocial groups for both low and high resource variance.
By contrast, eusocial societies are rare in mammals (Clutton‐Brock et al., 2009). Cooperative breeding with high reproductive skew or eusociality has only evolved in four taxa: marmosets and tamarins, dogs, diurnal mongooses and African mole‐rats. Typically, females in these groups show unusually high levels of fecundity.
Of course, also some examples of egalitarian groups are known. Social spiders have been discussed at length elsewhere (e.g.,Fronhofer,Pasurka,Mitesser,etal.,2011).Ourmodelpredictsthategalitarian animal societies evolve when resource variance is high and offspring are few. These life‐history traits are typically found in large mammals like lions (Packer et al., 2001) which do form egal‐itarian groups.
All these examples show that global patterns of the occurrence of eusocial and cooperatively breeding groups in natural arthropod and vertebrate systems can, at least tentatively, be explained by the above presented model, specifically by the influence of resource variance and life‐history parameters (offspring cost and number), despite its great simplicity and caveats.
4 | CONCLUSIONS
In egalitarian as well as in eusocial groups, pooling of resources re‐duces the risk of starvation. In eusocial groups, it has the additional effect that it may increase intra‐group variance in the amount of re‐sources individuals may invest in reproduction. For upward convex fertility functions, eusocial groups thus out‐compete solitary indi‐viduals as well as egalitarian groups. Whenever population growth is limited by resource availability, resources will necessarily be scarce and reproductive output will be dominantly determined by the con‐vex part of the fertility function.
We show that in situations of limited food supply risk‐sensitive group formation has the potential to lead to the evolution of coop‐erativebreedingandeusociality (Figure5).More importantly, risk‐sensitivity is likely important for the maintenance of eusocial groups and in the transition from small to larger groups that had previously formed due to other mechanisms. In our model, selection for in‐creased resource‐use efficiency leads to supersaturation (Dickinson
& Hatchwell, 2004) of the environment, that is, an increase in equi‐librium population density (Figure 4).
Finally, our model yields some clear and testable predictions. In summary, these are (a) Eusocial groups are favored when off‐spring are numerous and cheap regardless of resource variance. (b) Egalitarian groups may evolve when resource variance is high and offspring are few and costly. (c) Increasing baseline mortality favors smaller eusocial groups and ultimately solitary living. (d) Eusocial groups can evolve and be maintained despite low levels of relat‐edness. (e) Globally, eusocial groups should be more frequent than egalitarian animal societies.
ACKNOWLEDG MENTS
The authors thank the editor, two referees and Hanna Kokko for comments on an earlier version of the text. E.A.F. was supported by Eawag. H.J.P. was supported by the German Research Foundation, DFG (SFB 554, TP C6). This is publication ISEM‐2018‐233 of theInstitutdesSciencesdel’Evolution–Montpellier.
CONFLIC T OF INTERE S T
None declared.
AUTHOR CONTRIBUTIONS
Allauthorsdesigned thestudy.E.A.F.,O.M.,andH.J.P.developedandanalyzedthemodel.E.A.F.wrotethefirstversionofthetextandall authors contributed to revisions.
DATA ACCE SSIBILIT Y
The R‐scripts used for numerical approximations and to gener‐ate the figures are available via Zenodo (https://doi.org/10.5281/zenodo.1481657).
R E FE R E N C E S
Andrews, G. E., Askey, R., & Roy, R. (2001). Special functions. Cambridge: CambridgeUniversityPress.
Arnold, K. E., & Owens, I. P. F. (1998). Cooperative breeding in birds: A comparative test of the life history hypothesis. Proceedings of the Royal Society of London. Series B, Biological Sciences, 265, 739–745. https://doi.org/10.1098/rspb.1998.0355
Arnold, K. E., & Owens, I. P. F. (1999). Cooperative breeding in birds: The role of ecology. Behavioral Ecology, 10, 465–471. https://doi.org/10.1093/beheco/10.5.465
Avila, P., & Fromhage, L. (2015). No synergy needed: Ecological con‐straints favor the evolution of eusociality. American Naturalist, 186, 31–40. https://doi.org/10.1086/681637
Bateson,M.(2002).Recentadvancesinourunderstandingofrisk‐sen‐sitive foraging preferences. Proceedings of the Nutrition Society, 61, 509–516.https://doi.org/10.1079/PNS2002181
Bednekoff, P. A. (1996). Risk‐sensitive foraging, fitness, and life histories: Where does reproduction fit into the big picture? American Zoologist, 36, 471–483. https://doi.org/10.1093/icb/36.4.471

| 11FRONHOFER Et al.
Boyce, M. S. (1984). Restitution of r‐ and K‐selection as a model ofdensity‐dependent natural selection. Annual Review of Ecology and Systematics, 15, 427–447. https://doi.org/10.1146/annurev.es.15.110184.002235
Caraco, T. (1981). Risk‐sensitivity and foraging groups. Ecology, 62, 527–531. https://doi.org/10.2307/1937716
Caraco,T.,Uetz,G.W.,Gillespie,R.G.,&Giraldeau,L.‐A.(1995).Resourceconsumption variance within and among individuals: On coloniality in spiders. Ecology, 76, 196–205. https://doi.org/10.2307/1940641
Clark, C. W., & Mangel, M. (1986). The evolutionary advantages ofgroup foraging. Theoretical Population Biology, 30, 45–75. https://doi.org/10.1016/0040‐5809(86)90024‐9
Clutton‐Brock,T.,West,S.A.,Ratnieks,F. L.W.,&Foley,R. (2009).Theevolution of society. Philosophical Transactions of the Royal Society B: Biological Sciences, 364, 3127–3133. https://doi.org/10.1098/rstb.2009.0207
Cooper,G.A.,&West,S.A.(2018).Divisionoflabourandtheevolutionofextremespecialization.Nature Ecology and Evolution, 2, 1161–1167. https://doi.org/10.1038/s41559‐018‐0564‐9
Costa, J. T. (2006). The other insect societies.Cambridge,MA:TheBelknapPressofHarvardUniversityPress.
Dickinson, J. L., & Hatchwell, B. J. (2004). Fitness consequences of help‐ing. In W. Koenig, & J. Dickinson (Eds.), Ecology and evolution of co-operative breeding in birds (pp. 48–66). Cambridge, UK: CambridgeUniversityPress.https://doi.org/10.1017/CBO9780511606816
Ford, H. A., Bell, H., Nias, R., & Noske, R. (1988). The relationship between ecology and the incidence of cooperative breeding in Australian birds. Behavioral Ecology and Sociobiology, 22, 239–249. https://doi.org/10.1007/BF00299838
Fronhofer, E. A., & Altermatt, F. (2015). Eco‐evolutionary feedbacks during experimental range expansions. Nature Communications, 6, 6844. https://doi.org/10.1038/ncomms7844
Fronhofer,E.A.,Kubisch,A.,Hilker,F.M.,Hovestadt,T.,&Poethke,H.J. (2012). Why are metapopulations so rare? Ecology, 93, 1967–1978. https://doi.org/10.1890/11‐1814.1
Fronhofer, E. A., Nitsche, N., & Altermatt, F. (2017). Information use shapes the dynamics of range expansions into environmental gra‐dients. Global Ecology and Biogeography, 26, 400–411. https://doi.org/10.1111/geb.12547
Fronhofer, E. A., Pasurka, H., Mitesser, O., & Poethke, H. J. (2011).Scarce resources, risk‐sensitivity and egalitarian resource sharing.Evolutionary Ecology Research, 13, 253–267.
Fronhofer, E. A., Pasurka, H., Poitrineau, K., Mitesser, O., & Poethke,H. J. (2011). Risk‐sensitivity revisited: From individuals to popu‐lations. Animal Behavior, 82, 875–883. https://doi.org/10.1016/j.anbehav.2011.07.027
Gonzalez,J.‐C.T.,Sheldon,B.C.,&Tobias,J.A. (2013).Environmentalstability and the evolution of cooperative breeding in hornbills. Proceedings of the Royal Society of London. Series B, Biological Sciences, 280, 20131297. https://doi.org/10.1098/rspb.2013.1297
Hamilton, W. D. (1964a). Genetical evolution of social be‐haviour I. Journal of Theoretical Biology, 7, 1–16. https://doi.org/10.1016/0022‐5193(64)90038‐4
Hamilton, W. D. (1964b). Genetical evolution of social be‐haviour II. Journal of Theoretical Biology, 7, 17–52. https://doi.org/10.1016/0022‐5193(64)90039‐6
Hamilton,I.M.(2004).Acommitmentmodelofreproductiveinhibitionin cooperatively breeding groups. Behavioral Ecology, 15, 585–591. https://doi.org/10.1093/beheco/arh047
Hines, W., & Maynard Smith, J. (1979). Games between rela‐tives. Journal of Theoretical Biology, 79, 19–30. https://doi.org/10.1016/0022‐5193(79)90254‐6
Hölldobler, B., & Wilson, E. O. (1990). The ants. Cambridge, MA:The Belknap Press of Harvard University Press. https://doi.org/10.1007/978‐3‐662‐10306‐7
Hölldobler, B., & Wilson, E. O. (2009). The Superorganism: The beauty, ele-gance, and strangeness of insect societies. New York & London: W. W. Norton & Company.
Jetz,W.,&Rubenstein,D.R.(2011).Environmentaluncertaintyandtheglobal biogeography of cooperative breeding in birds. Current Biology, 21, 72–78. https://doi.org/10.1016/j.cub.2010.11.075
Johnstone, R. A. (2000). Models of reproductive skew: A re‐view and synthesis. Ethology, 106, 5–26. https://doi.org/10.1046/j.1439‐0310.2000.00529.x
Kacelnik,A.,&Bateson,M.(1996).Riskytheories|theeffectsofvarianceon foraging decisions. American Zoologist, 36, 402–434. https://doi.org/10.1093/icb/36.4.402
Kokko,H., & Johnstone, R. A. (1999). Social queuing in animal societ‐ies: A dynamic model of reproductive skew. Proceedings of the Royal Society of London. Series B, Biological Sciences, 266, 571–578. https://doi.org/10.1098/rspb.1999.0674
Krause, J., & Ruxton, G. D. (2002). Living in groups.Oxford,UK:OxfordUniversityPress.
Lande,R.,Engen,S.,&Saether,B.E.(2009).Anevolutionarymaximumprinciple for density‐dependent population dynamics in a uctu‐ating environment. Philosophical Transactions of the Royal Society B: Biological Sciences, 364, 1511–1518. https://doi.org/10.1098/rstb.2009.0017
Lehmann, L., & Keller, L. (2006). The evolution of cooperation and altruism|a general framework and a classification of mod‐els. Journal of Evolutionary Biology, 19, 1365–1376. https://doi.org/10.1111/j.1420‐9101.2006.01119.x
MacArthur,R.H.(1962).Somegeneralizedtheoremsofnaturalselection.Proceedings of the National Academy of Sciences of the United States of America, 48, 1893–1897. https://doi.org/10.1073/pnas.48.11. 1893
MacArthur,R.H.,&Wilson,E.O.(1967).The theory of Island biogeogra-phy.Princeton,NJ:PrincetonUniversityPress.
Matessi, C., & Gatto, M. (1984). Does k‐selection imply prudent pre‐dation? Theoretical Population Biology, 25, 347–363. https://doi.org/10.1016/0040‐5809(84)90014‐5
Nowak,M.A.(2006).Fiverulesfortheevolutionofcooperation.Science, 314, 1560–1563. https://doi.org/10.1126/science.1133755
Olejarz,J.W.,Allen,B.,Veller,C.,&Nowak,M.A.(2015).Theevolutionof nonreproductive workers in insect colonies with haplodiploid ge‐netics. eLife, 4, e08918. https://doi.org/10.7554/eLife.08918
Packer, C., Pusey, A. E., & Eberly, L. E. (2001). Egalitarianism in female African lions. Science, 293, 690–693. https://doi.org/10.1126/science.1062320
Pen, I., & Weissing, F. J. (2000). Towards a unified theory of coopera‐tive breeding: The role of ecology and life history re‐examined. Proceedings of the Royal Society of London. Series B, Biological Sciences, 267, 2411–2418. https://doi.org/10.1098/rspb.2000.1299
Poethke, H. J., & Liebig, J. (2008). Risk‐sensitive foraging and the evolu‐tion of cooperative breeding and reproductive skew. BMC Ecology, 8, Article No.: 2. https://doi.org/10.1186/1472‐6785‐8‐2
Rankin, D. J., López‐Sepulcre, A., Foster, K. R., & Kokko, H. (2007).Species‐levelselectionreducesselfishnessthroughcompetitiveex‐clusion. Journal of Evolutionary Biology, 20, 1459–1468. https://doi.org/10.1111/j.1420‐9101.2007.01337.x
Reeve, H. K., & Keller, L. (2001). Tests of reproductive‐skew models in social insects. Annual Review of Entomology, 46, 347–385. https://doi.org/10.1146/annurev.ento.46.1.347
Reznick, D., Bryant,M. J., & Bashey, F. (2002). r‐ and K‐selection re‐visited: The role of population regulation in life‐history evolution. Ecology, 83, 1509–1520. https://doi.org/10.2307/3071970
Rissing,S.W.,Pollock,G.B.,Higgins,M.R.,Hagen,R.H.,&Smith,D.R.(1989).Foragingspecializationwithoutrelatednessordominanceamong co‐founding ant queens. Nature, 338, 420–422. https://doi.org/10.1038/338420a0

12 | FRONHOFER Et al.
Ruel,J.J.,&Ayres,M.P.(1999).Jensen’sinequalitypredictseffectsofenvi‐ronmental variation. Trends in Ecology & Evolution, 14, 261–366.
Schneider, J.M., & Bilde, T. (2008). Benefits of cooperation with ge‐netic kin in a subsocial spider. Proceedings of the National Academy of Sciences of the United States of America, 105, 10843–10846. https://doi.org/10.1073/pnas.0804126105
Sherman,P.W., Lacey,E.A.,Reeve,H.K.,&Keller, L. (1995).Theeu‐sociality continuum. Behavioral Ecology, 6, 102–108. https://doi.org/10.1093/beheco/6.1.102
Smallwood,P.D. (1996).An introductiontorisksensitivity:TheuseofJensen’s inequality to clarify evolutionary arguments of adapta‐tion and constraint. American Zoologist, 36, 392–401. https://doi.org/10.1093/icb/36.4.392
Tsuji, K. (1988). Obligate parthenogenesis and reproductive division of labor in the Japanese queenless ant Pristomyrmex pungens. Behavioral Ecology and Sociobiology, 23, 247–255. https://doi.org/10.1007/BF00302947
Tsuji, K. (2013). Kin selection, species richness and community. Biology Letters, 9, 20130491. https://doi.org/10.1098/rsbl.2013.0491
Tsuji, K., & Dobata, S. (2011). Social cancer and the biology of theclonal ant Pristo‐myrmex punctatus (hymenoptera: Formicidae). Myrmecological News, 15, 91–99.
Tsuji, K., & Yamauchi, K. (1995). Production of females by parthenogene‐sis in the ant, Cerapachys biroi. Insectes Sociaux, 42, 333–336. https://doi.org/10.1007/BF01240430
Uetz, G.W. (1996). Risk sensitivity and the paradox of colonial web‐building in spiders. American Zoologist, 36, 459–470. https://doi.org/10.1093/icb/36.4.459
Uetz, G. W., & Hieber, C. S. (1997). Colonial web‐building spiders:Balancing the costs and benefits of group‐living. In J. C. Choe, & B. J. Crespi (Eds.), The evolution of social behavior in insects and arachnids (pp.458–475).Cambridge,MA:CambridgeUniversityPress.https://doi.org/10.1017/CBO9780511721953
Vehrencamp, S. L. (1983). Amodel for the evolution of despotic ver‐sus egalitarian societies. Animal Behavior, 31, 667–682. https://doi.org/10.1016/S0003‐3472(83)80222‐X
Wenseleers, T., Helanterä, H., Hart, A., & Ratnieks, F. (2004). Worker reproduction and policing in insect societies: An ess analy‐sis. Journal of Evolutionary Biology, 17, 1035–1047. https://doi.org/10.1111/j.1420‐9101.2004.00751.x
Wenzel,J.W.,&Pickering,J.(1991).Cooperativeforaging,productivity,and the central limit theorem. Proceedings of the National Academy of Sciences of the United States of America, 88, 36–38. https://doi.org/10.1073/pnas.88.1.36
West,S.A.,Griffin,A.S.,&Gardner,A. (2007).Evolutionaryexplana‐tions for cooperation. Current Biology, 17, R661–R672. https://doi.org/10.1016/j.cub.2007.06.004
Whitehouse,M.E.A.,&Lubin,Y.(2005).Thefunctionsofsocietiesandtheevolutionofgroupliving:Spidersocietiesasatestcase.Biological Reviews, 80,347–361.https://doi.org/10.1017/S1464793104006694
Wilson, E. O. (1971). The insect societies.Cambridge,MA:TheBelknapPressofHarvardUniversityPress.
SUPPORTING INFORMATION
Additional supporting information may be found online in the SupportingInformationsectionattheendofthearticle.
How to cite this article:FronhoferEA,LiebigJ,MitesserO,Poethke HJ. Eusociality outcompetes egalitarian and solitary strategies when resources are limited and reproduction is costly. Ecol Evol. 2018;00:1–12. https://doi.org/10.1002/ece3.4737