evaluation of two new vaisala sensors for road … · road surface condition data ... vaisala...
TRANSCRIPT
Ministry of Transportation Provincial Highways Management Division Report
Highway Infrastructure Innovation Funding Program
Evaluation of Two New Vaisala Sensors for Road Surface Conditions Monitoring
HIIFP-054 Final Report
August 2008
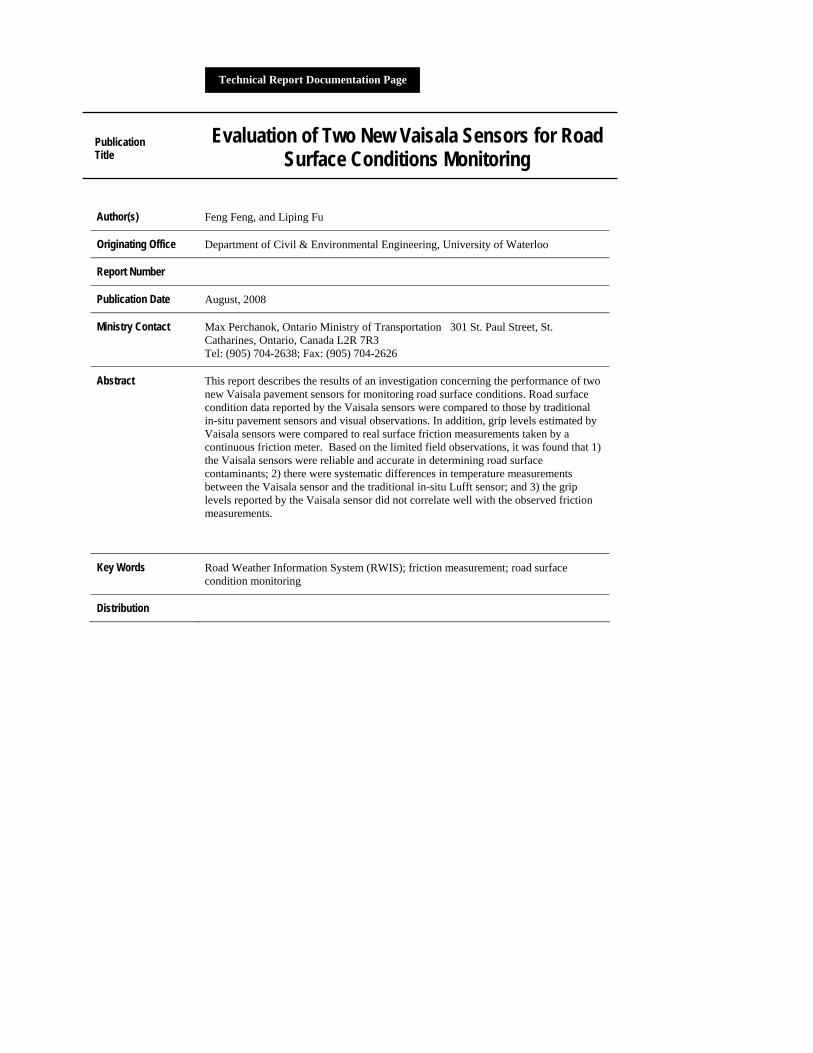
Technical Report Documentation Page
Publication Title
Author(s) Feng Feng, and Liping Fu
Evaluation of Two New Vaisala Sensors for Road Surface Conditions Monitoring
Originating Office Department of Civil & Environmental Engineering, University of Waterloo
Report Number
Publication Date August, 2008
Ministry Contact Max Perchanok, Ontario Ministry of Transportation 301 St. Paul Street, St. Catharines, Ontario, Canada L2R 7R3 Tel: (905) 704-2638; Fax: (905) 704-2626
Abstract This report describes the results of an investigation concerning the performance of two new Vaisala pavement sensors for monitoring road surface conditions. Road surface condition data reported by the Vaisala sensors were compared to those by traditional in-situ pavement sensors and visual observations. In addition, grip levels estimated by Vaisala sensors were compared to real surface friction measurements taken by a continuous friction meter. Based on the limited field observations, it was found that 1) the Vaisala sensors were reliable and accurate in determining road surface contaminants; 2) there were systematic differences in temperature measurements between the Vaisala sensor and the traditional in-situ Lufft sensor; and 3) the grip levels reported by the Vaisala sensor did not correlate well with the observed friction measurements.
Key Words Road Weather Information System (RWIS); friction measurement; road surface condition monitoring
Distribution
Ministry of Transportation
Evaluation of Two New Vaisala Sensors for Road Surface
Conditions Monitoring
August 2005
Prepared by Department of Civil & Environmental Engineering
University of Waterloo
200 University Ave. W., Waterloo, Ontario, Canada N2L 3G1
Tel: (519) 888-4567; Fax (519) 888-6197
Published without prejudice as to the
application of the findings. Crown copyright reserved.
- i -
Table of Contents
Introduction.....................................................................................................................................1
Study Site and Test Arrangements ............................................................................................... 3
6
9
12
16
17
18
22
24
27
36
Test Result I: Road Surface Temperature.....................................................................................
Test Result II: Road Surface State.................................................................................................
Test Result III: Grip Level.............................................................................................................
Conclusions ..................................................................................................................................
References.....................................................................................................................................
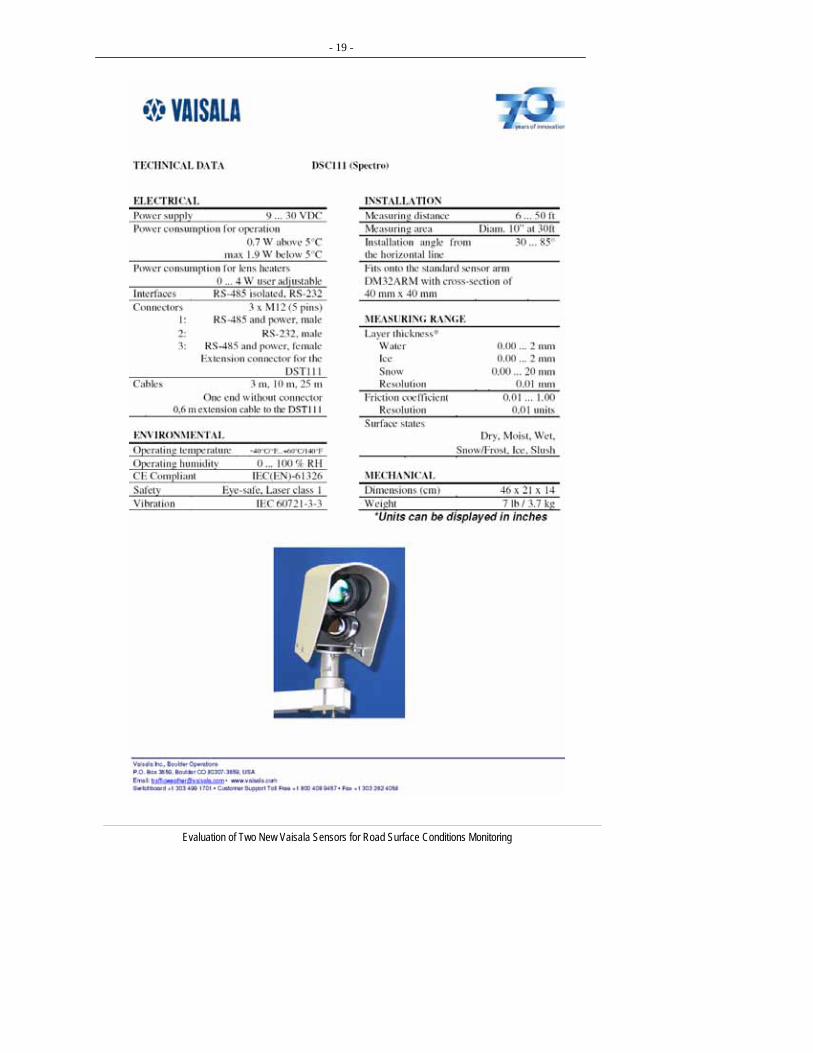
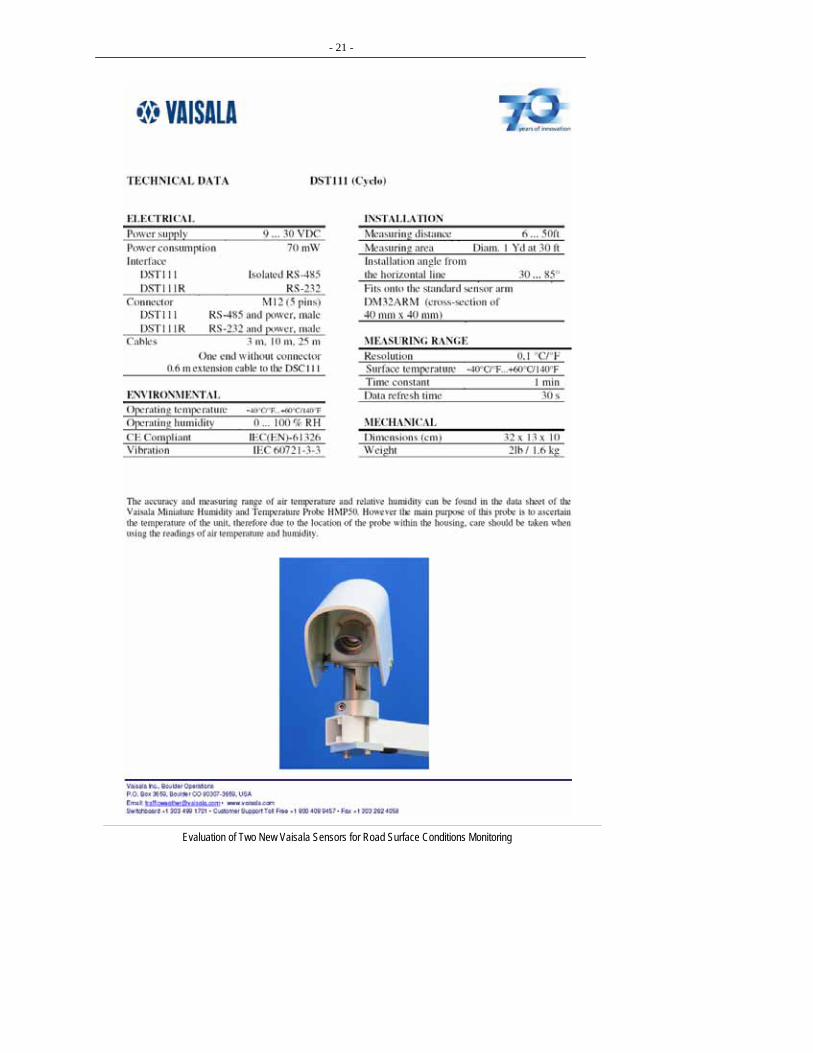
Appendix A: Specifications of Vaisala Sensors.........................................................................
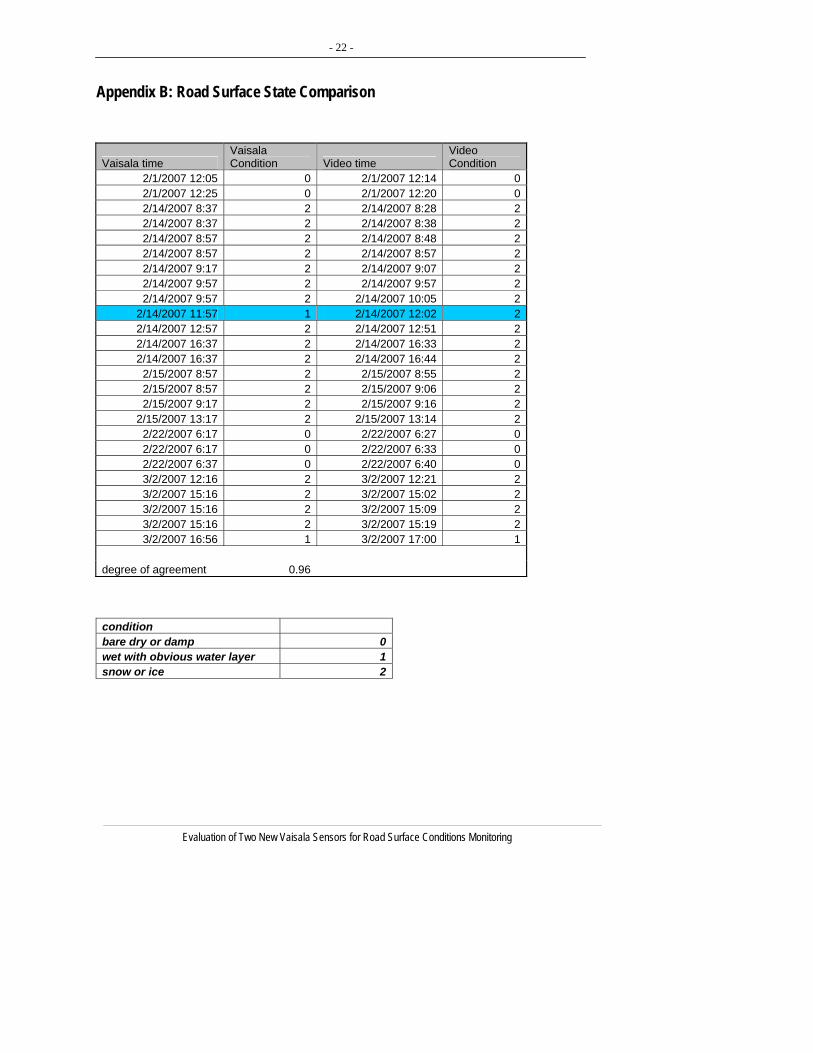
Appendix B: Road Surface State Comparison ...........................................................................
Appendix C: Grip Level and Friction Measurements.................................................................
Appendix D: Temperature Reading Difference Statistics..........................................................
Appendix E: Temperature Reading Difference Statistics by Temperature Ranges ................
Evaluation of Two New Vaisala Sensors for Road Surface Conditions Monitoring
- 1 -
Introduction
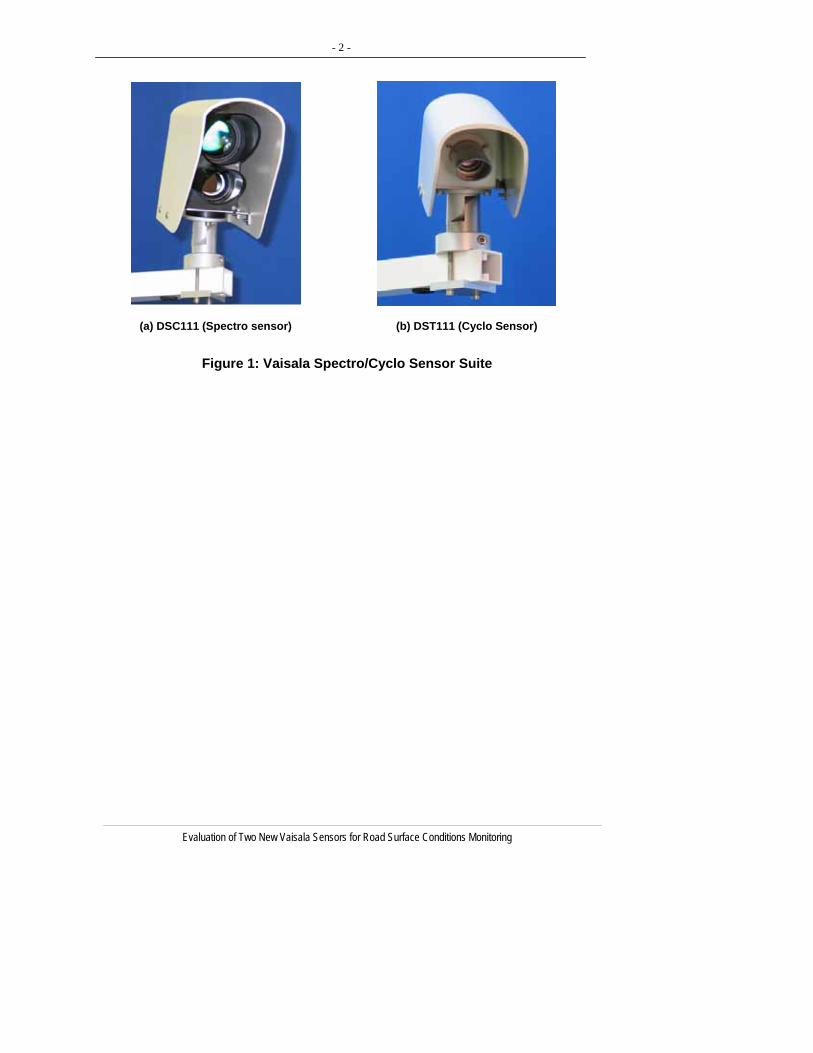
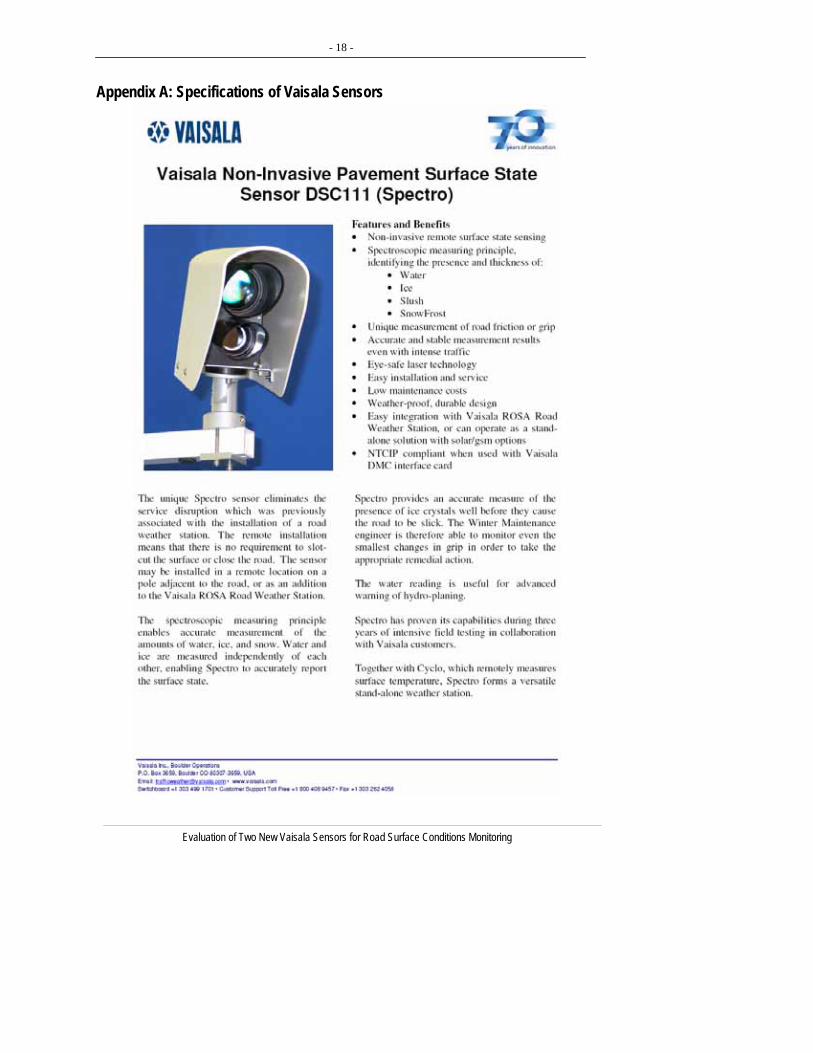
The purpose of this project was to evaluate the performance of two new remote optical sensors (collectively called Vaisala Spectro/Cyclo sensors), namely, Vaisala Remote Road Surface State Sensor (DSC111) and Vaisala Remote Road Surface Temperature Sensor (DST111), as shown in Fig.1. DSC111 is an active near-infrared band (-1 µm) remote sensor, which sends infrared light beams to the road surface and detects the backscattered signals at selected wavelengths. Based on observed difference in light absorption, it can differentiate pavement contaminant layers and thus surface state such as dry, moist, wet, icy, snowy/frosty or slushy [1]. The sensor also provides a measure called grip level which is intended to represent the level of friction of the road surface. This grip level is estimated using an empirical model based on the surface state and contaminant depth detected by the sensor [2]. DSC111 reports the following data items:
• Pavement states: dry, wet (thin water layer), slushy (thick water layer, no ice or snow), snow or frost (white ice), ice (black ice)
• Pavement contaminant depth in equivalent liquid water amount (in mm) • Estimated surface grip level (0.01-1.00)
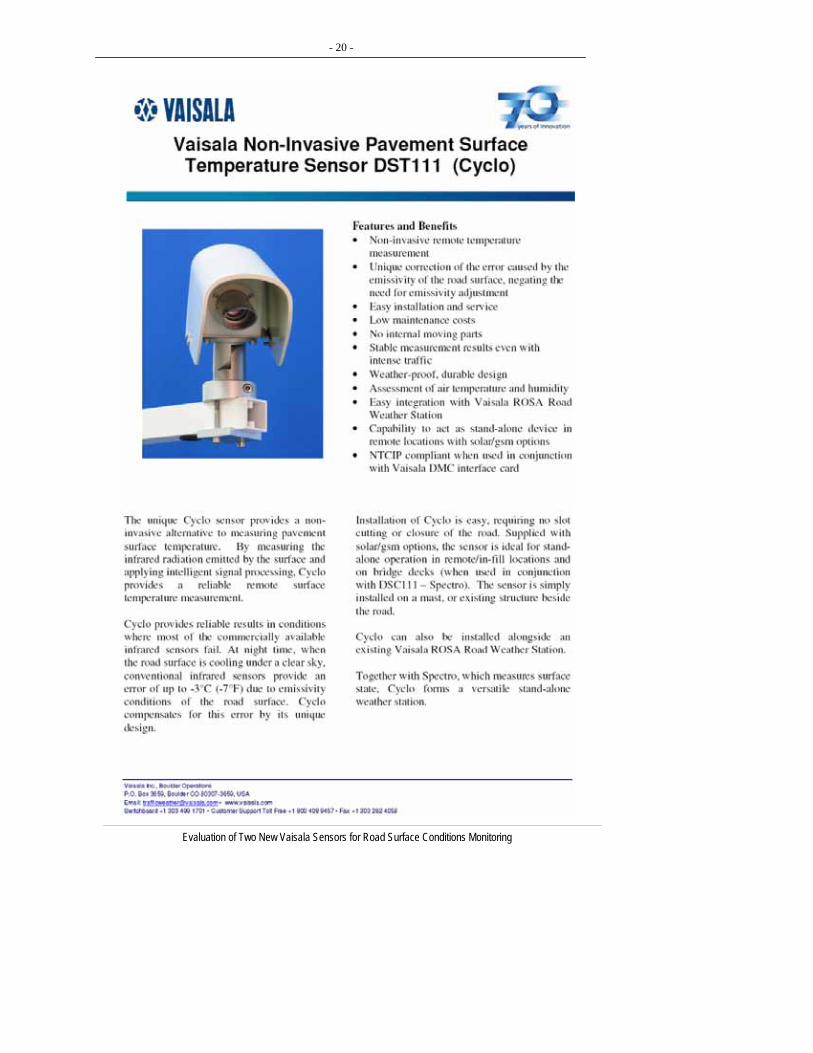
DST111 is a temperature sensor based on infrared technology. It measures the difference of long wave infrared radiations between the sensor instrument itself and the road surface. This difference can be calibrated to a known temperature difference and thus used to estimate the pavement temperature. According to its product specifications, DST111 is accurate up to 0.3 ºC in typical icing conditions [1]. The detailed specifications for DSC111 and DST111 are attached in Appendix A. A DST111 report includes the following data:
• Pavement surface temperature in ºC • Air temperature in ºC • Dew point temperature in ºC • Relative humidity in percentage
Evaluation of Two New Vaisala Sensors for Road Surface Conditions Monitoring
- 2 -
(a) DSC111 (Spectro sensor)
(b) DST111 (Cyclo Sensor)
Figure 1: Vaisala Spectro/Cyclo Sensor Suite
Evaluation of Two New Vaisala Sensors for Road Surface Conditions Monitoring
- 3 -
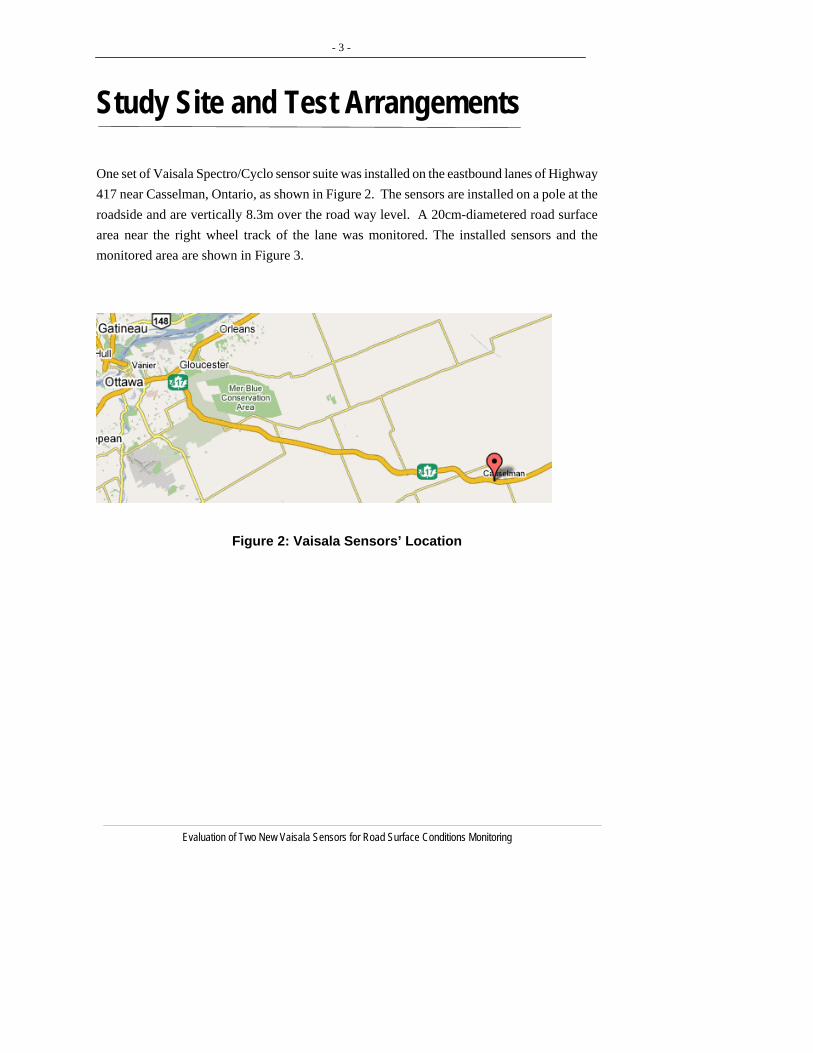
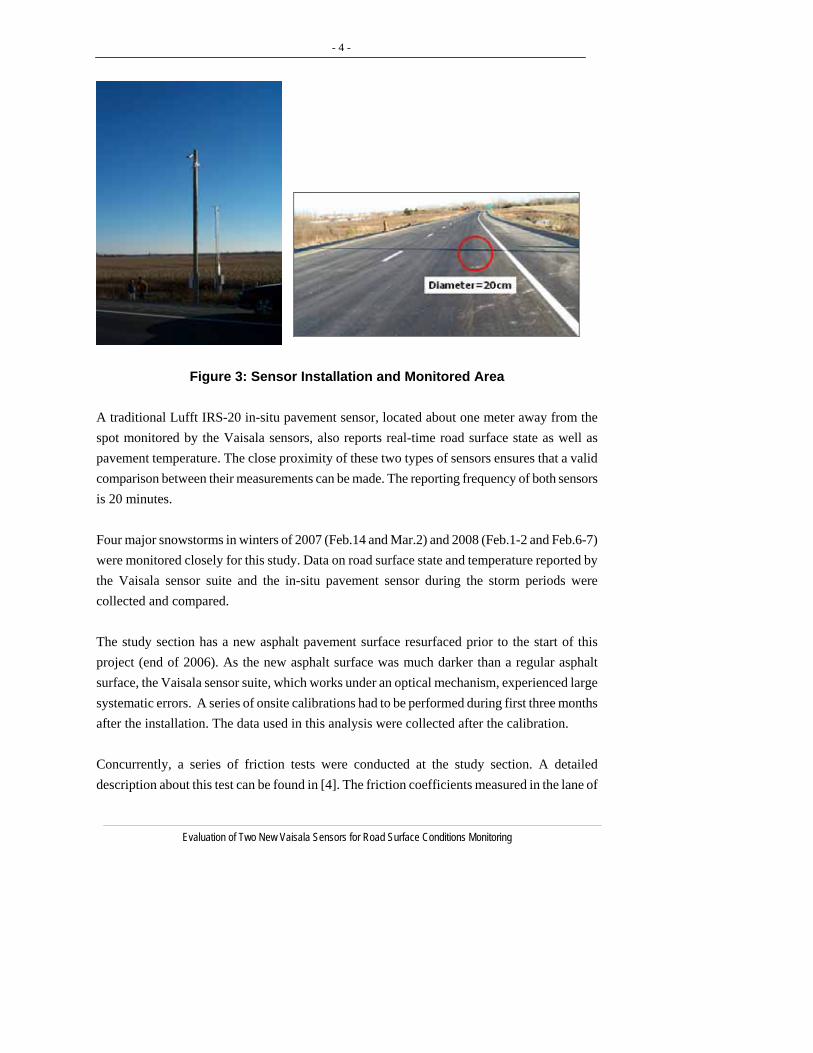
Study Site and Test Arrangements One set of Vaisala Spectro/Cyclo sensor suite was installed on the eastbound lanes of Highway 417 near Casselman, Ontario, as shown in Figure 2. The sensors are installed on a pole at the roadside and are vertically 8.3m over the road way level. A 20cm-diametered road surface area near the right wheel track of the lane was monitored. The installed sensors and the monitored area are shown in Figure 3.
Figure 2: Vaisala Sensors’ Location
Evaluation of Two New Vaisala Sensors for Road Surface Conditions Monitoring
- 4 -
Figure 3: Sensor Installation and Monitored Area
A traditional Lufft IRS-20 in-situ pavement sensor, located about one meter away from the spot monitored by the Vaisala sensors, also reports real-time road surface state as well as pavement temperature. The close proximity of these two types of sensors ensures that a valid comparison between their measurements can be made. The reporting frequency of both sensors is 20 minutes. Four major snowstorms in winters of 2007 (Feb.14 and Mar.2) and 2008 (Feb.1-2 and Feb.6-7) were monitored closely for this study. Data on road surface state and temperature reported by the Vaisala sensor suite and the in-situ pavement sensor during the storm periods were collected and compared. The study section has a new asphalt pavement surface resurfaced prior to the start of this project (end of 2006). As the new asphalt surface was much darker than a regular asphalt surface, the Vaisala sensor suite, which works under an optical mechanism, experienced large systematic errors. A series of onsite calibrations had to be performed during first three months after the installation. The data used in this analysis were collected after the calibration. Concurrently, a series of friction tests were conducted at the study section. A detailed description about this test can be found in [4]. The friction coefficients measured in the lane of
Evaluation of Two New Vaisala Sensors for Road Surface Conditions Monitoring

- 5 -
Evaluation of Two New Vaisala Sensors for Road Surface Conditions Monitoring
the monitored area when the friction trailer passing the monitored area were compared to the estimated grip level by DSC111 at the closest reporting time.
- 6 -
Test Result I: Road Surface Temperature
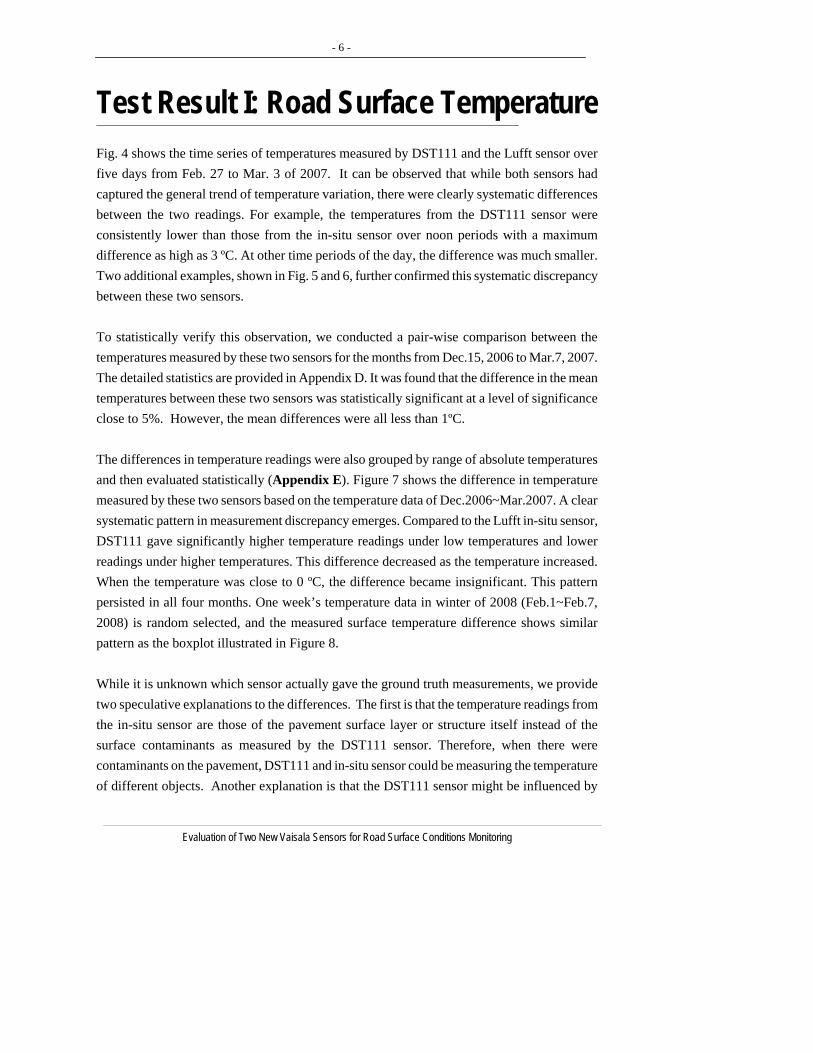
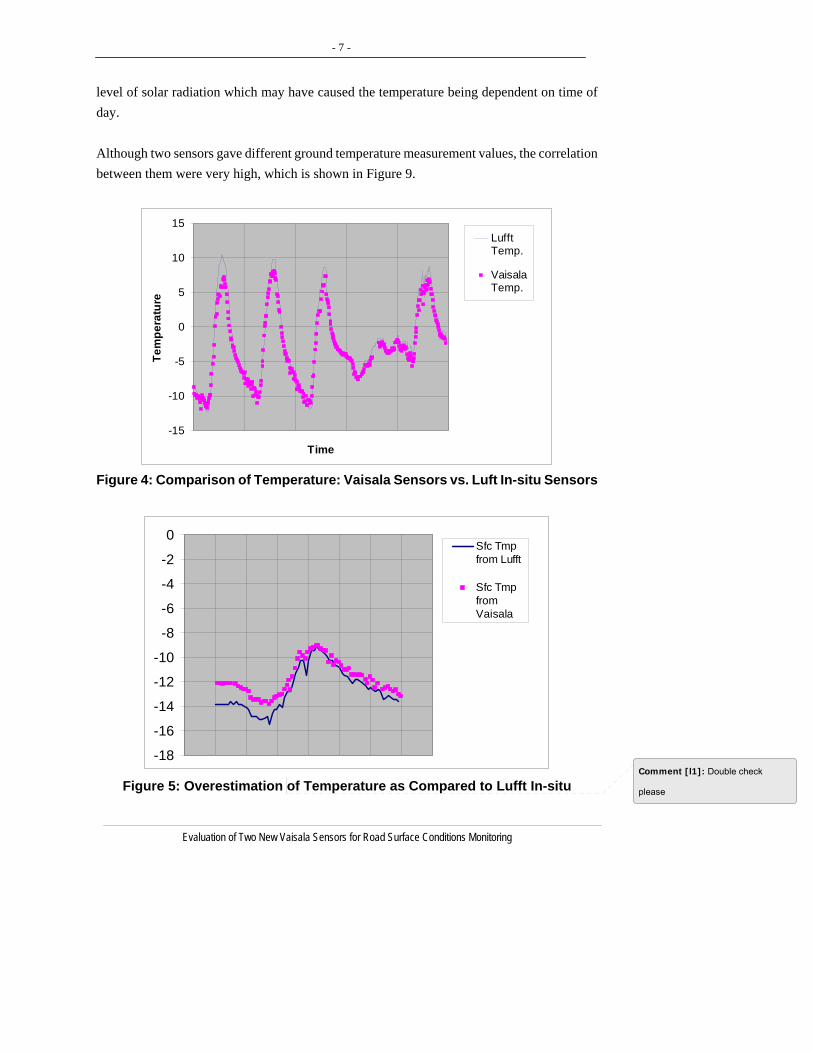
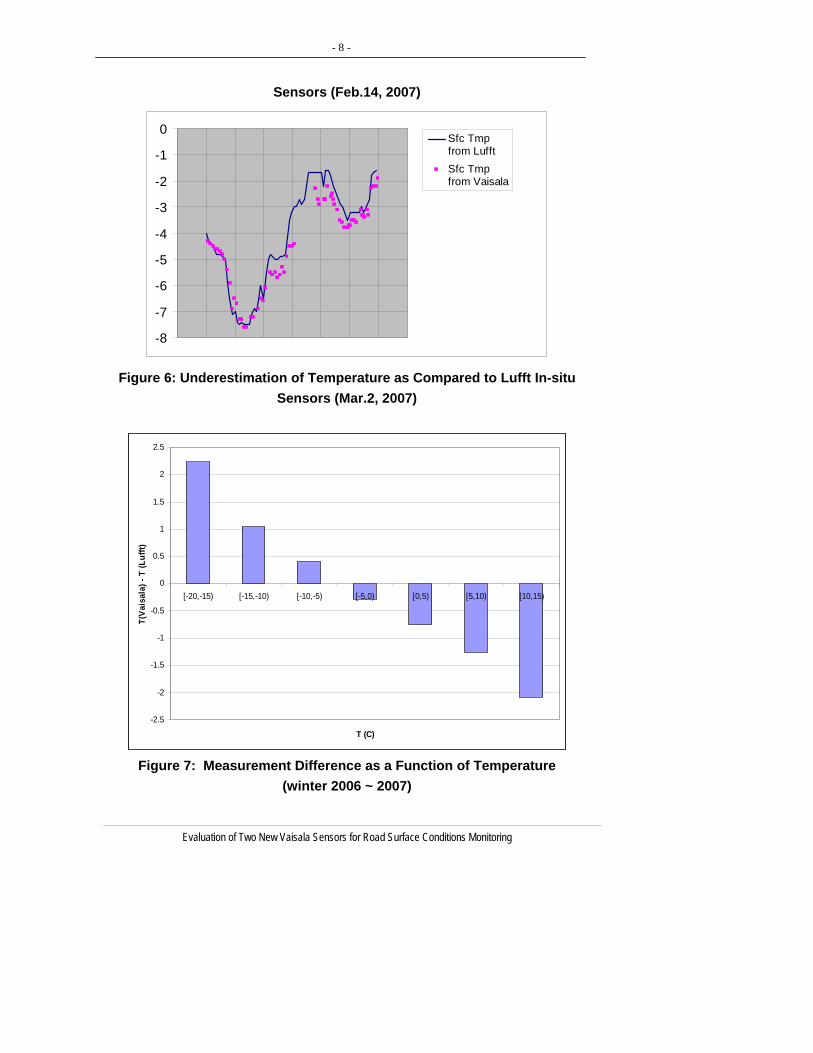
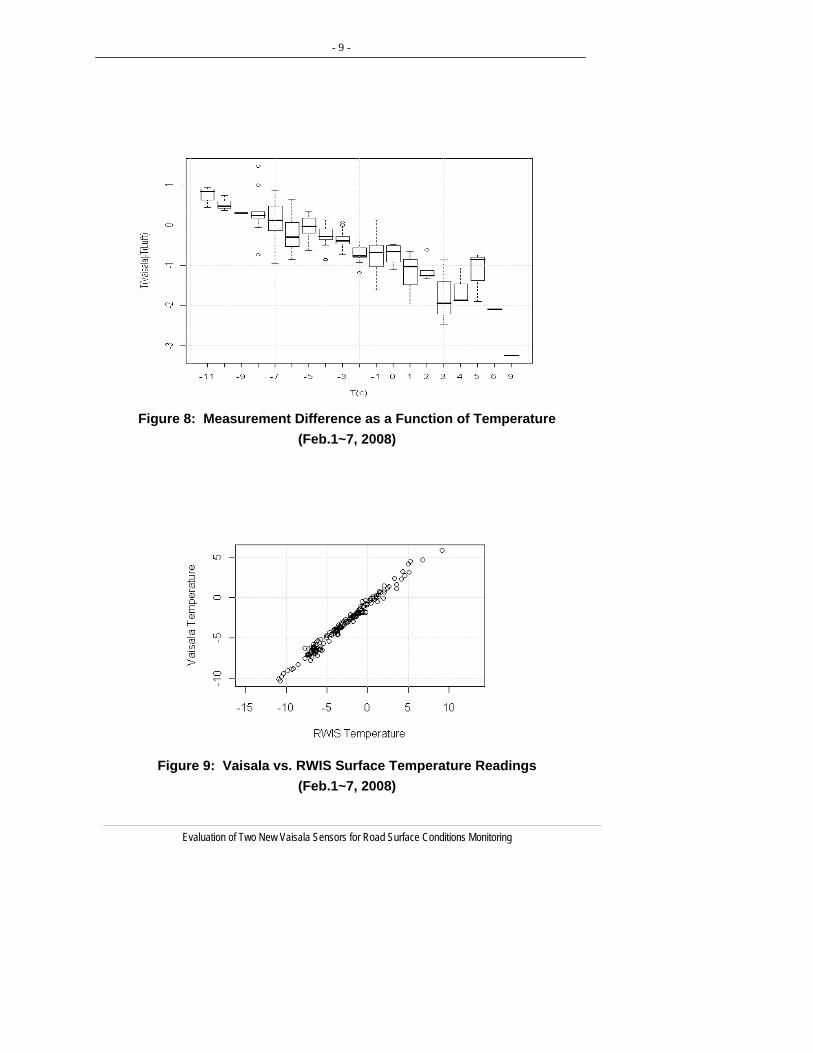
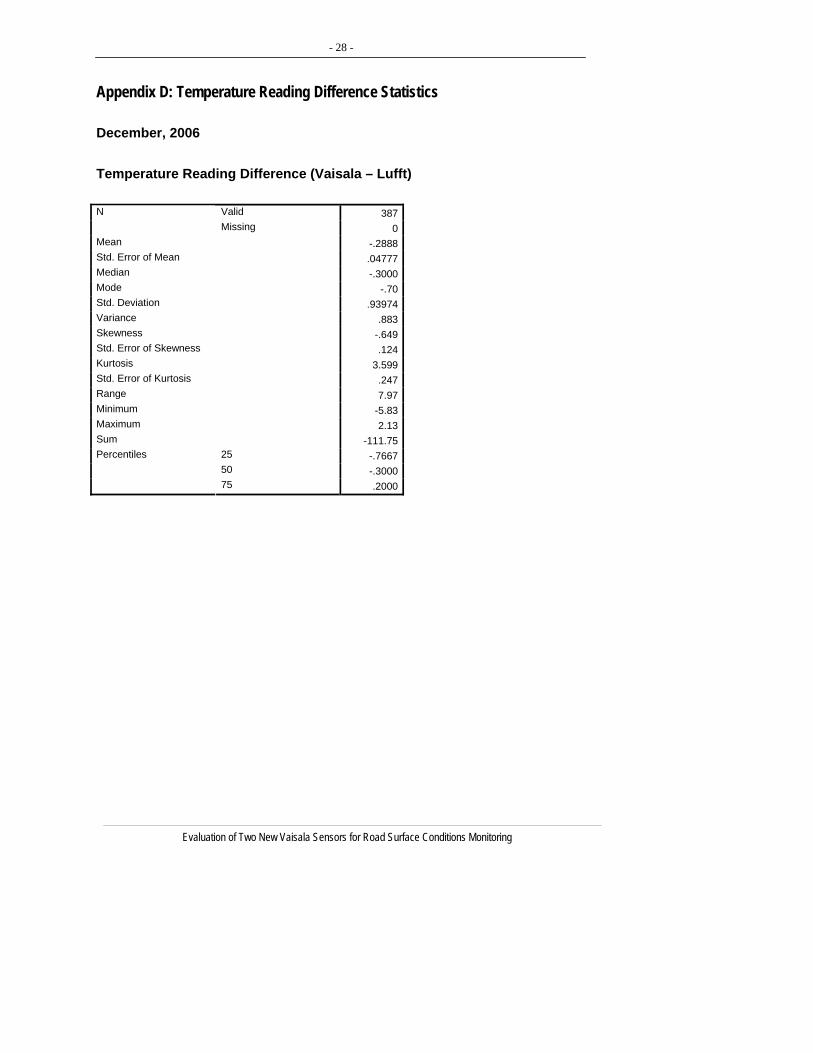
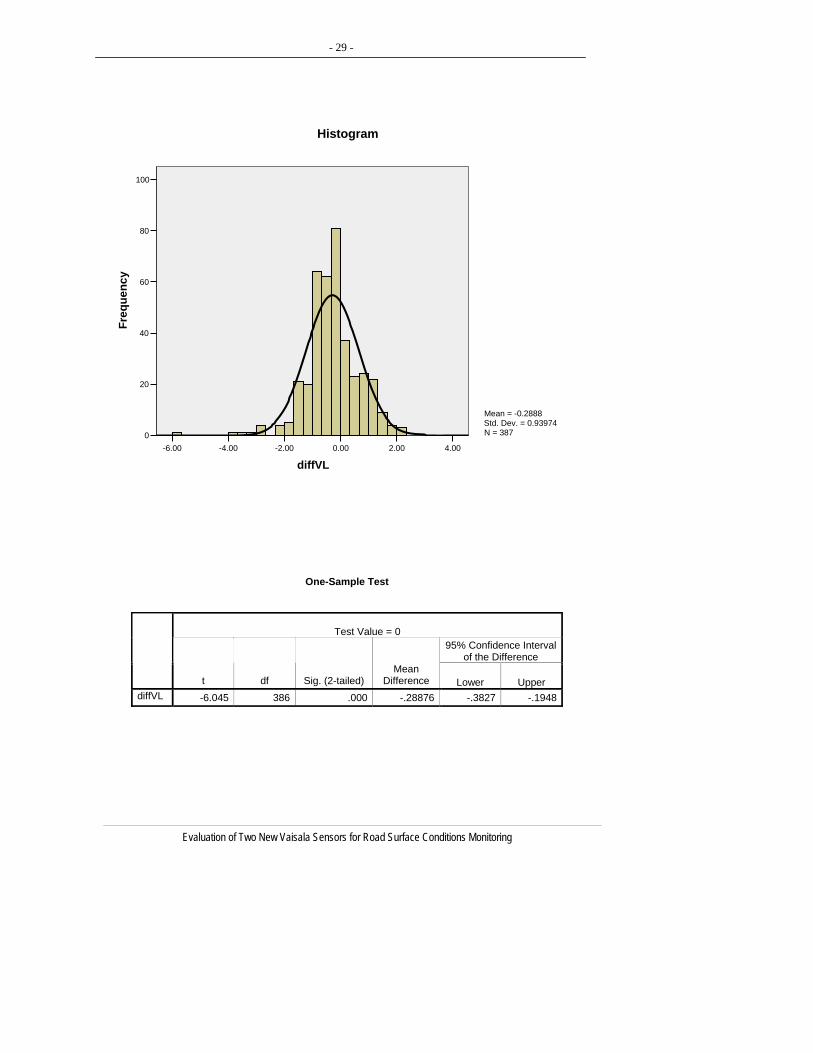
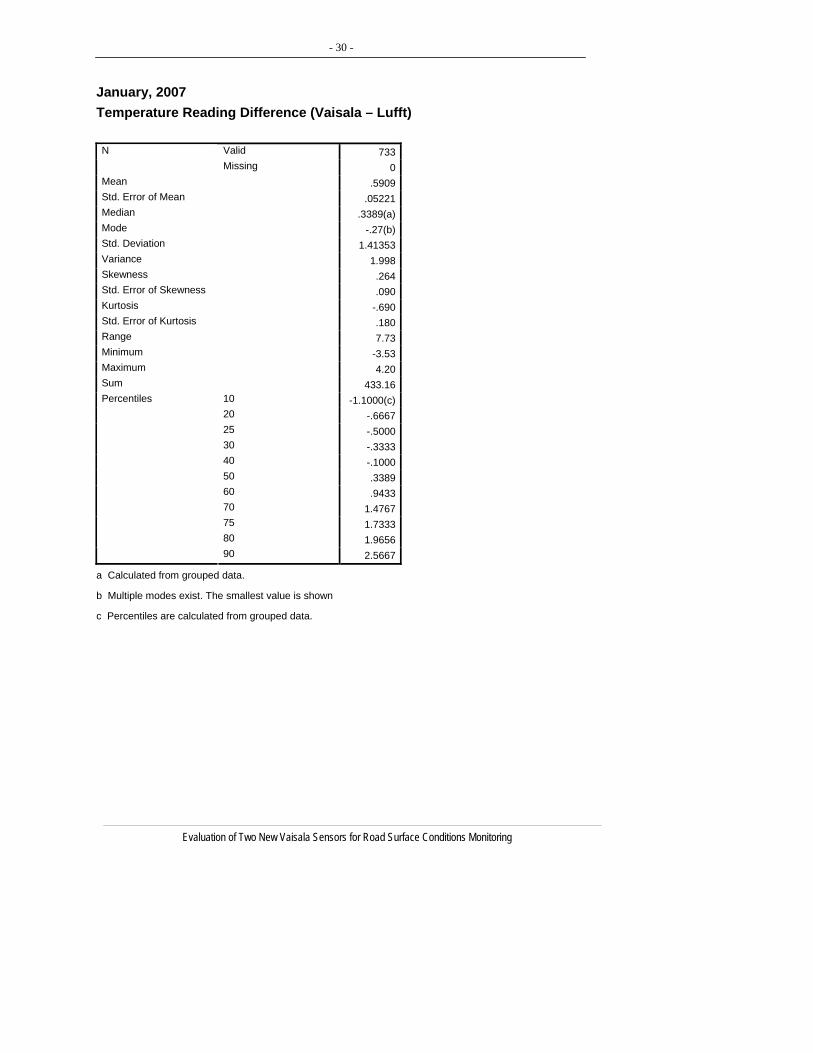
Fig. 4 shows the time series of temperatures measured by DST111 and the Lufft sensor over five days from Feb. 27 to Mar. 3 of 2007. It can be observed that while both sensors had captured the general trend of temperature variation, there were clearly systematic differences between the two readings. For example, the temperatures from the DST111 sensor were consistently lower than those from the in-situ sensor over noon periods with a maximum difference as high as 3 ºC. At other time periods of the day, the difference was much smaller. Two additional examples, shown in Fig. 5 and 6, further confirmed this systematic discrepancy between these two sensors. To statistically verify this observation, we conducted a pair-wise comparison between the temperatures measured by these two sensors for the months from Dec.15, 2006 to Mar.7, 2007. The detailed statistics are provided in Appendix D. It was found that the difference in the mean temperatures between these two sensors was statistically significant at a level of significance close to 5%. However, the mean differences were all less than 1ºC. The differences in temperature readings were also grouped by range of absolute temperatures and then evaluated statistically (Appendix E). Figure 7 shows the difference in temperature measured by these two sensors based on the temperature data of Dec.2006~Mar.2007. A clear systematic pattern in measurement discrepancy emerges. Compared to the Lufft in-situ sensor, DST111 gave significantly higher temperature readings under low temperatures and lower readings under higher temperatures. This difference decreased as the temperature increased. When the temperature was close to 0 ºC, the difference became insignificant. This pattern persisted in all four months. One week’s temperature data in winter of 2008 (Feb.1~Feb.7, 2008) is random selected, and the measured surface temperature difference shows similar pattern as the boxplot illustrated in Figure 8. While it is unknown which sensor actually gave the ground truth measurements, we provide two speculative explanations to the differences. The first is that the temperature readings from the in-situ sensor are those of the pavement surface layer or structure itself instead of the surface contaminants as measured by the DST111 sensor. Therefore, when there were contaminants on the pavement, DST111 and in-situ sensor could be measuring the temperature of different objects. Another explanation is that the DST111 sensor might be influenced by
Evaluation of Two New Vaisala Sensors for Road Surface Conditions Monitoring
- 7 -
Evaluation of Two New Vaisala Sensors for Road Surface Conditions Monitoring
level of solar radiation which may have caused the temperature being dependent on time of day. Although two sensors gave different ground temperature measurement values, the correlation between them were very high, which is shown in Figure 9.
-15
-10
-5
0
5
10
Time
15
Tem
pera
ture
LufftTemp.
VaisalaTemp.
Figure 4: Comparison of Temperature: Vaisala Sensors vs. Luft In-situ Sensors
-18
-16
-14
-12
-10
-8
-6
-4
-2
0Sfc Tmpfrom Lufft
Sfc TmpfromVaisala
Figure 5: Overestimation of Temperature as Compared to Lufft In-situ
Comment [l1]: Double check
please
- 8 -
Evaluation of Two New Vaisala Sensors for Road Surface Conditions Monitoring
Sensors (Feb.14, 2007)
-8
-7
-6
-5
-4
-3
-2
-1
0Sfc Tmpfrom LufftSfc Tmpfrom Vaisala
Figure 6: Underestimation of Temperature as Compared to Lufft In-situ Sensors (Mar.2, 2007)
-2.5
-2
-1.5
-1
-0.5
0
0.5
1
1.5
2
2.5
[-20,-15) [-15,-10) [-10,-5) [-5,0) [0,5) [5,10) [10,15)
T (C)
T(V
aisa
la) -
T (L
ufft)
Figure 7: Measurement Difference as a Function of Temperature
(winter 2006 ~ 2007)
- 9 -
tion of Two New Vaisala Sensors for Road Surface Conditions Monitoring Evalua
Figure 8: Measurement Difference as a Function of Temperature
(Feb.1~7, 2008)
Figure 9: Vaisala vs. RWIS Surface Temperature Readings
(Feb.1~7, 2008)

- 10 -
Evaluation of Two New Vaisala Sensors for Road Surface Conditions Monitoring
- 11 -
Test Result II: Road Surface State
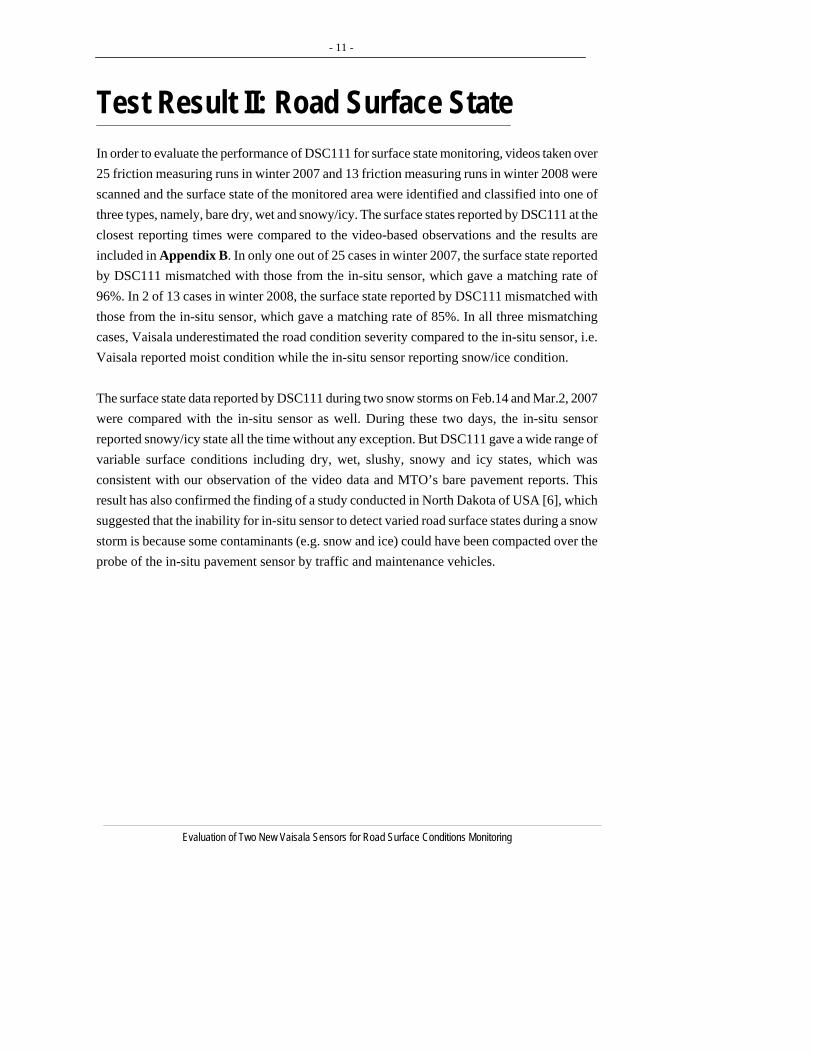
In order to evaluate the performance of DSC111 for surface state monitoring, videos taken over 25 friction measuring runs in winter 2007 and 13 friction measuring runs in winter 2008 were scanned and the surface state of the monitored area were identified and classified into one of three types, namely, bare dry, wet and snowy/icy. The surface states reported by DSC111 at the closest reporting times were compared to the video-based observations and the results are included in Appendix B. In only one out of 25 cases in winter 2007, the surface state reported by DSC111 mismatched with those from the in-situ sensor, which gave a matching rate of 96%. In 2 of 13 cases in winter 2008, the surface state reported by DSC111 mismatched with those from the in-situ sensor, which gave a matching rate of 85%. In all three mismatching cases, Vaisala underestimated the road condition severity compared to the in-situ sensor, i.e. Vaisala reported moist condition while the in-situ sensor reporting snow/ice condition. The surface state data reported by DSC111 during two snow storms on Feb.14 and Mar.2, 2007 were compared with the in-situ sensor as well. During these two days, the in-situ sensor reported snowy/icy state all the time without any exception. But DSC111 gave a wide range of variable surface conditions including dry, wet, slushy, snowy and icy states, which was consistent with our observation of the video data and MTO’s bare pavement reports. This result has also confirmed the finding of a study conducted in North Dakota of USA [6], which suggested that the inability for in-situ sensor to detect varied road surface states during a snow storm is because some contaminants (e.g. snow and ice) could have been compacted over the probe of the in-situ pavement sensor by traffic and maintenance vehicles.
Evaluation of Two New Vaisala Sensors for Road Surface Conditions Monitoring
- 12 -
Test Result III: Grip Level
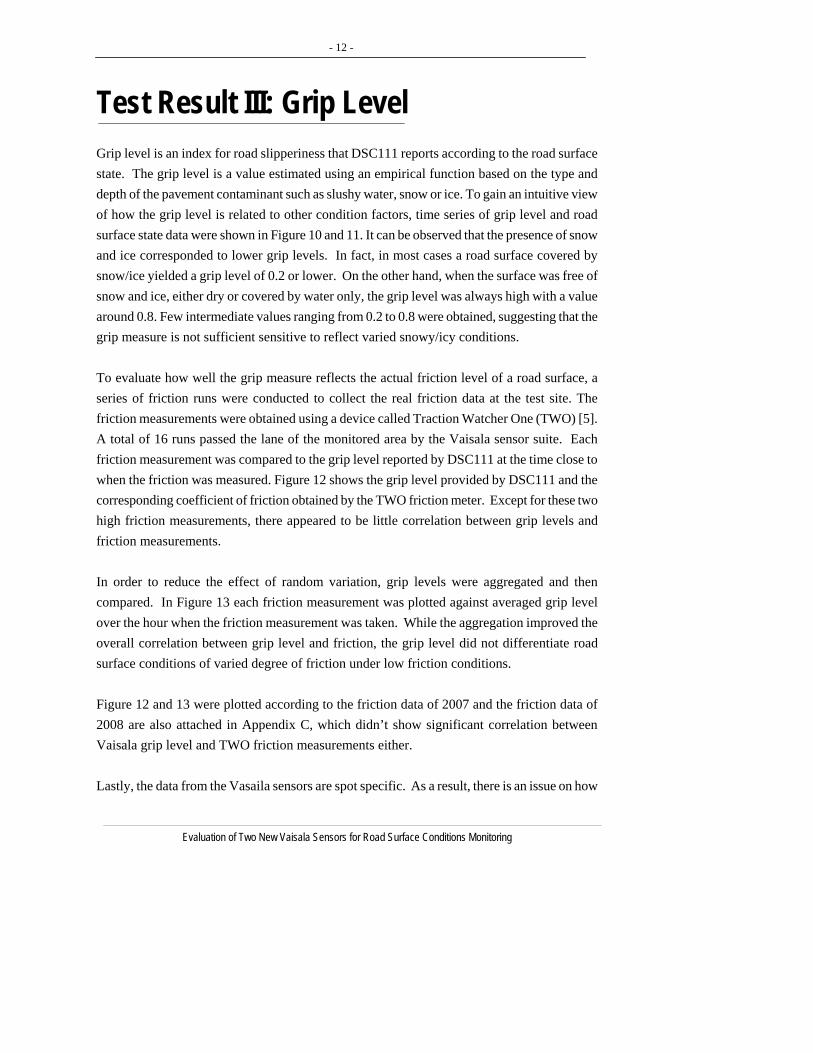
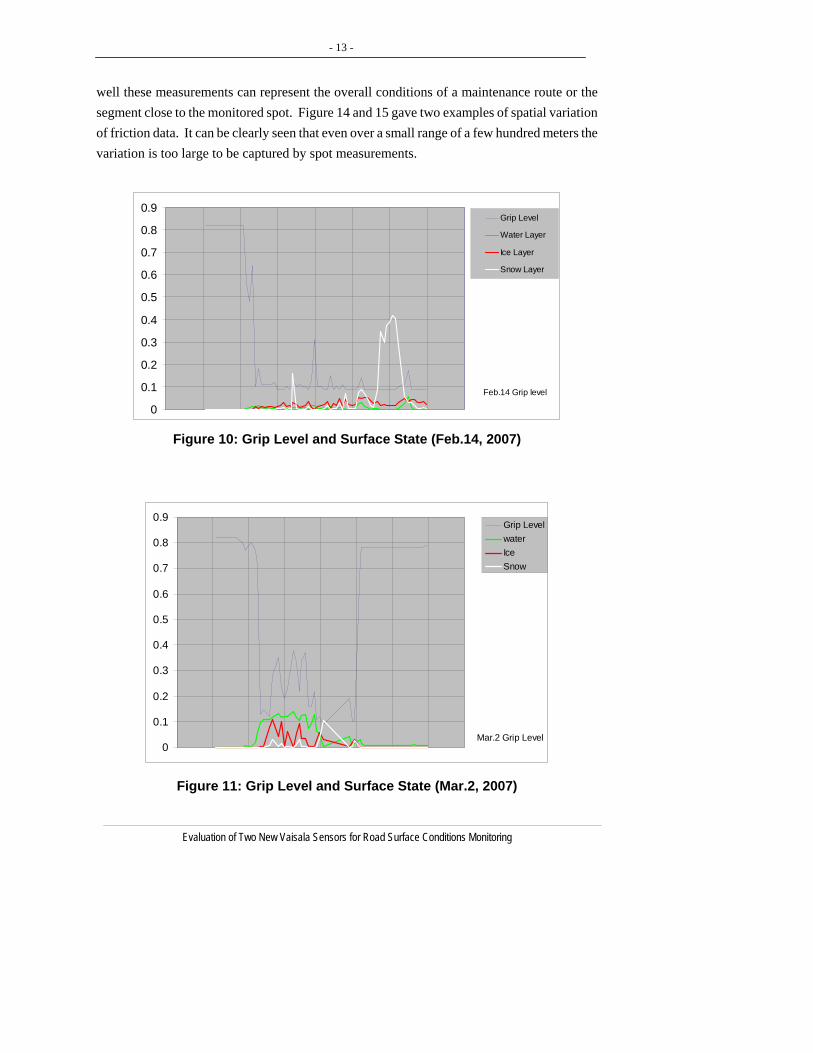
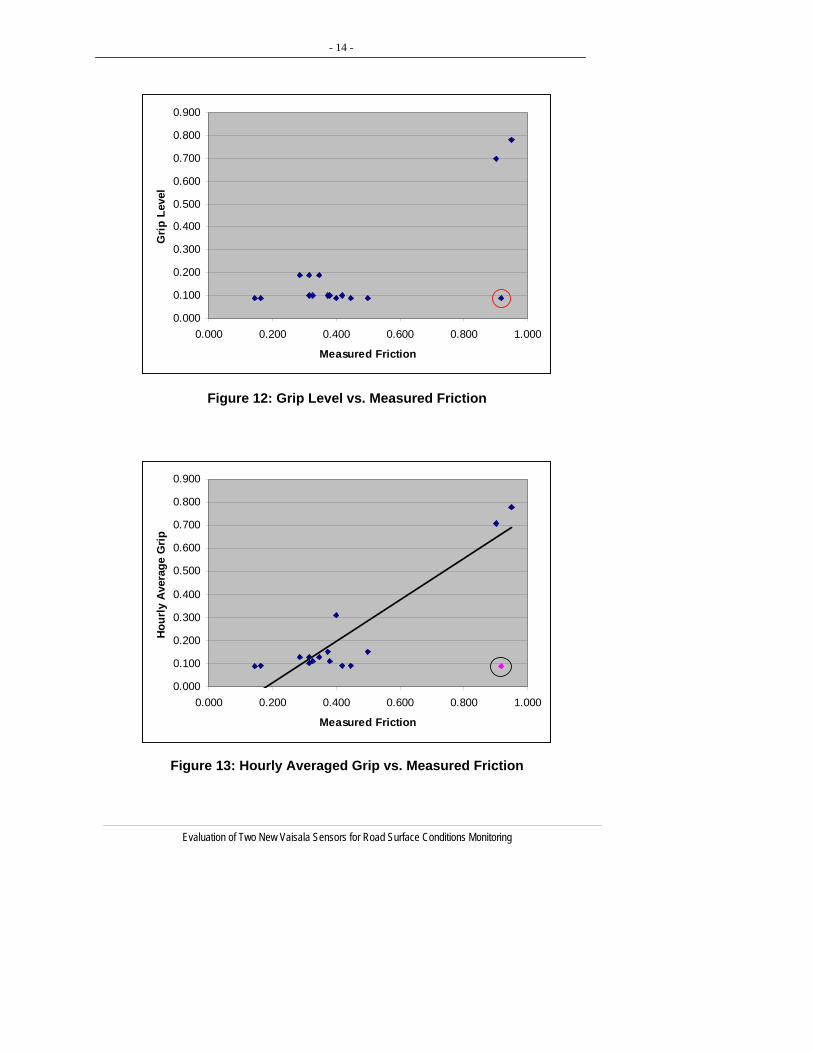
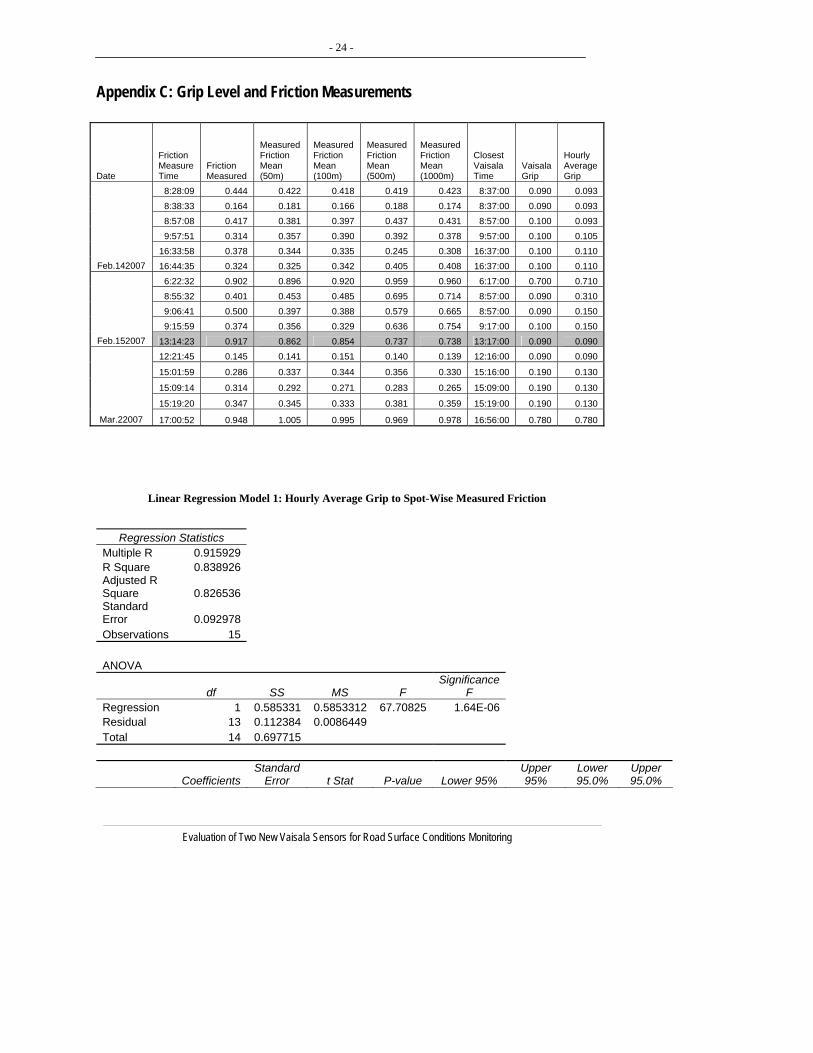
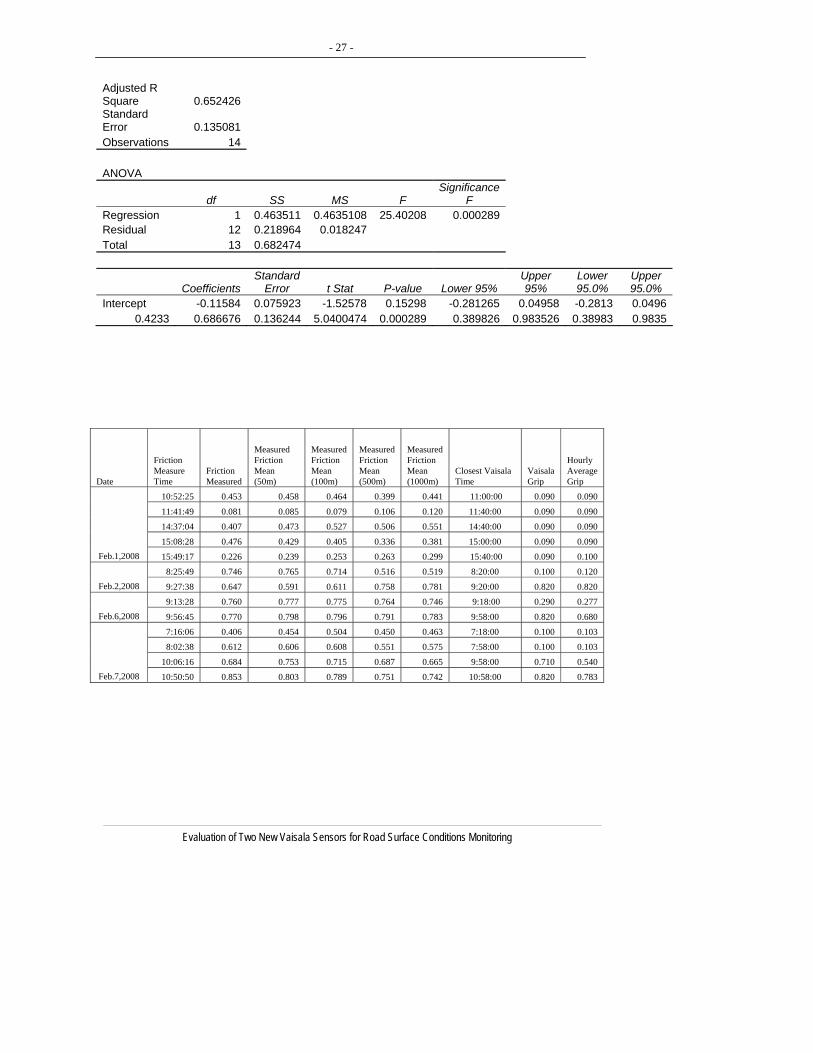
Grip level is an index for road slipperiness that DSC111 reports according to the road surface state. The grip level is a value estimated using an empirical function based on the type and depth of the pavement contaminant such as slushy water, snow or ice. To gain an intuitive view of how the grip level is related to other condition factors, time series of grip level and road surface state data were shown in Figure 10 and 11. It can be observed that the presence of snow and ice corresponded to lower grip levels. In fact, in most cases a road surface covered by snow/ice yielded a grip level of 0.2 or lower. On the other hand, when the surface was free of snow and ice, either dry or covered by water only, the grip level was always high with a value around 0.8. Few intermediate values ranging from 0.2 to 0.8 were obtained, suggesting that the grip measure is not sufficient sensitive to reflect varied snowy/icy conditions. To evaluate how well the grip measure reflects the actual friction level of a road surface, a series of friction runs were conducted to collect the real friction data at the test site. The friction measurements were obtained using a device called Traction Watcher One (TWO) [5]. A total of 16 runs passed the lane of the monitored area by the Vaisala sensor suite. Each friction measurement was compared to the grip level reported by DSC111 at the time close to when the friction was measured. Figure 12 shows the grip level provided by DSC111 and the corresponding coefficient of friction obtained by the TWO friction meter. Except for these two high friction measurements, there appeared to be little correlation between grip levels and friction measurements. In order to reduce the effect of random variation, grip levels were aggregated and then compared. In Figure 13 each friction measurement was plotted against averaged grip level over the hour when the friction measurement was taken. While the aggregation improved the overall correlation between grip level and friction, the grip level did not differentiate road surface conditions of varied degree of friction under low friction conditions. Figure 12 and 13 were plotted according to the friction data of 2007 and the friction data of 2008 are also attached in Appendix C, which didn’t show significant correlation between Vaisala grip level and TWO friction measurements either. Lastly, the data from the Vasaila sensors are spot specific. As a result, there is an issue on how
Evaluation of Two New Vaisala Sensors for Road Surface Conditions Monitoring
- 13 -
Evaluation of Two New Vaisala Sensors for Road Surface Conditions Monitoring
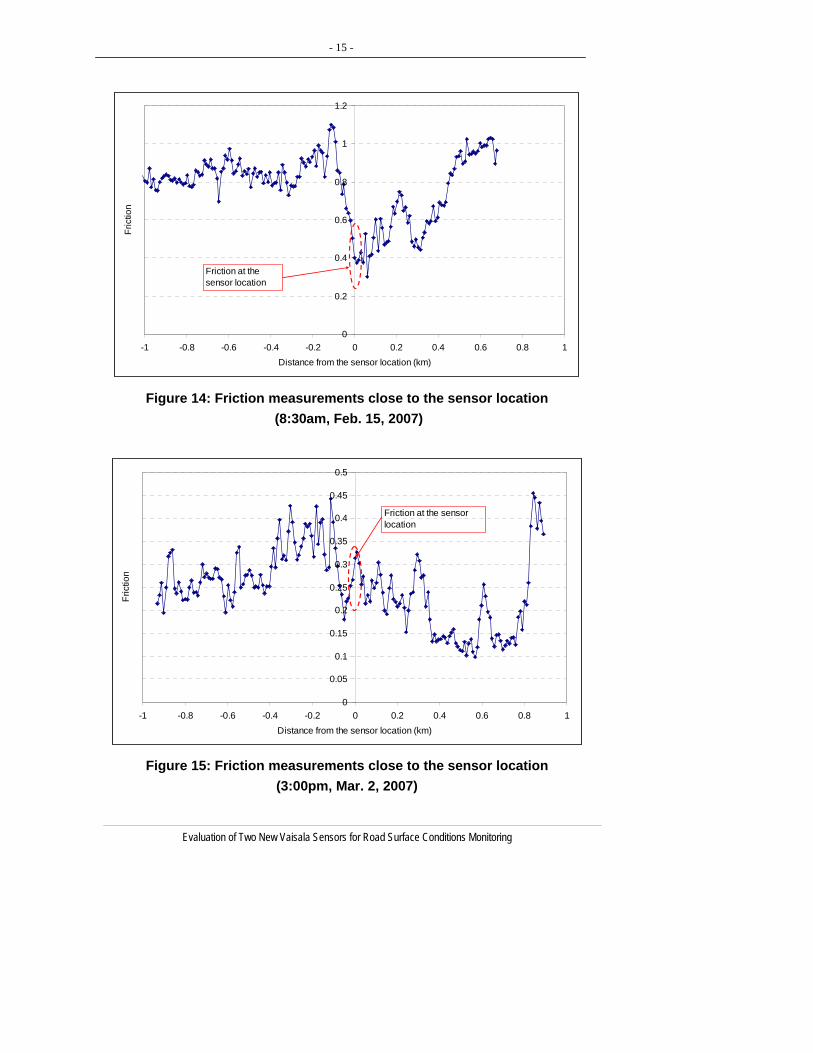
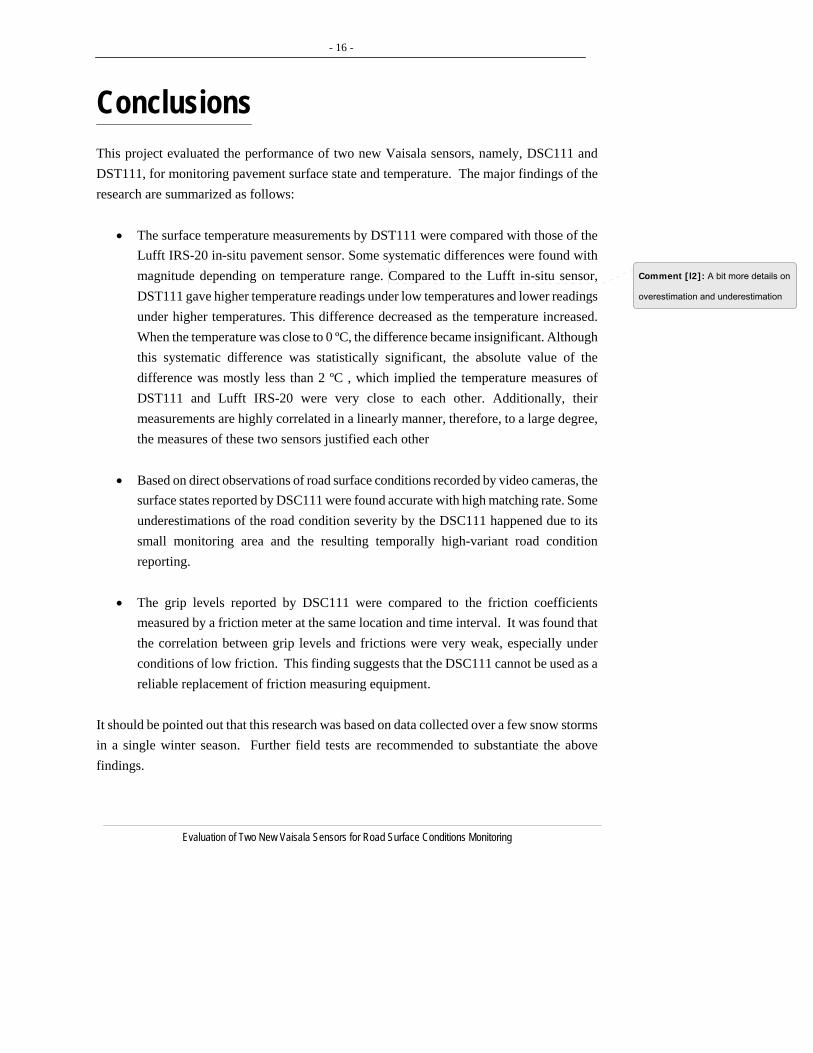
well these measurements can represent the overall conditions of a maintenance route or the segment close to the monitored spot. Figure 14 and 15 gave two examples of spatial variation of friction data. It can be clearly seen that even over a small range of a few hundred meters the variation is too large to be captured by spot measurements.
0
1
2
3
4
5
6
7
8
0.
0.
0.
0.
0.
0.
0.
0.
0.9Grip Level
Water Layer
Ice Layer
Snow Layer
Feb.14 Grip level
Figure 10: Grip Level and Surface State (Feb.14, 2007)
0
0.1
0.2
0.3
0.4
0.5
0.6
0.7
0.8
0.9Grip LevelwaterIceSnow
Mar.2 Grip Level
Figure 11: Grip Level and Surface State (Mar.2, 2007)
- 14 -
Evaluation of Two New Vaisala Sensors for Road Surface Conditions Monitoring
0.000
0.100
0.200
0.300
0.400
0.500
0.600
0.700
0.800
0.900
0.000 0.200 0.400 0.600 0.800 1.000
Measured Friction
Gri
p Le
vel
Figure 12: Grip Level vs. Measured Friction
0.000
0.100
0.200
0.300
0.400
0.500
0.600
0.700
0.800
0.900
0.000 0.200 0.400 0.600 0.800 1.000
Measured Friction
Hour
ly A
vera
ge G
rip
Figure 13: Hourly Averaged Grip vs. Measured Friction
- 15 -
Evaluation of Two New Vaisala Sensors for Road Surface Conditions Monitoring
0
0.2
0.4
0.6
0.8
1
1.2
-1 -0.8 -0.6 -0.4 -0.2 0 0.2 0.4 0.6 0.8 1Distance from the sensor location (km)
Fric
tion
Friction at the sensor location
Figure 14: Friction measurements close to the sensor location (8:30am, Feb. 15, 2007)
0
0.05
0.1
0.15
0.2
0.25
0.3
0.35
0.4
0.45
0.5
-1 -0.8 -0.6 -0.4 -0.2 0 0.2 0.4 0.6 0.8 1Distance from the sensor location (km)
Fric
tion
Friction at the sensor location
Figure 15: Friction measurements close to the sensor location (3:00pm, Mar. 2, 2007)
- 16 -
Conclusions
This project evaluated the performance of two new Vaisala sensors, namely, DSC111 and DST111, for monitoring pavement surface state and temperature. The major findings of the research are summarized as follows:
• The surface temperature measurements by DST111 were compared with those of the Lufft IRS-20 in-situ pavement sensor. Some systematic differences were found with magnitude depending on temperature range. Compared to the Lufft in-situ sensor, DST111 gave higher temperature readings under low temperatures and lower readings under higher temperatures. This difference decreased as the temperature increased. When the temperature was close to 0 ºC, the difference became insignificant. Although this systematic difference was statistically significant, the absolute value of the difference was mostly less than 2 ºC , which implied the temperature measures of DST111 and Lufft IRS-20 were very close to each other. Additionally, their measurements are highly correlated in a linearly manner, therefore, to a large degree, the measures of these two sensors justified each other
Comment [l2]: A bit more details on
overestimation and underestimation
• Based on direct observations of road surface conditions recorded by video cameras, the
surface states reported by DSC111 were found accurate with high matching rate. Some underestimations of the road condition severity by the DSC111 happened due to its small monitoring area and the resulting temporally high-variant road condition reporting.
• The grip levels reported by DSC111 were compared to the friction coefficients
measured by a friction meter at the same location and time interval. It was found that the correlation between grip levels and frictions were very weak, especially under conditions of low friction. This finding suggests that the DSC111 cannot be used as a reliable replacement of friction measuring equipment.
It should be pointed out that this research was based on data collected over a few snow storms in a single winter season. Further field tests are recommended to substantiate the above findings.
Evaluation of Two New Vaisala Sensors for Road Surface Conditions Monitoring
- 17 -
References [1] Yrjö Pilli-Sihvola etc. “New Approach to Road Weather Measuring Slipperiness.”
SIRWEC 2006. [2] Memos of telephone meetings and email contacts with Paul Bridge (Applied Meteorologist
of Vaisala), 2007. [3] Memos of telephone meetings and email contacts with Peter M Szilagyi (EDP of MTO
Eastern Region Operations, Ottawa Contracts Office), 2007. [4] Matthew Cloutier and Laura Donaldson, “Applicability of Winter Friction Measurements
in Ontario.” A project report of 2006-2007 Winter Maintenance Technology Program, 2007.
[5] Manual of Traction Watcher One, http://www.pon-cat.com/ [6] Jeff Tilley and Luke Johanneck, “Evaluation of Vaisala Spectro Pavement Sensor”,
Preliminary Report for Aurora Project 2006-04, August 20, 2007.
Evaluation of Two New Vaisala Sensors for Road Surface Conditions Monitoring
- 18 -
Evaluation of Two New Vaisala Sensors for Road Surface Conditions Monitoring
Appendix A: Specifications of Vaisala Sensors
- 19 -
Evaluation of Two New Vaisala Sensors for Road Surface Conditions Monitoring
- 20 -
Evaluation of Two New Vaisala Sensors for Road Surface Conditions Monitoring
- 21 -
Evaluation of Two New Vaisala Sensors for Road Surface Conditions Monitoring
- 22 -
Evaluation of Two New Vaisala Sensors for Road Surface Conditions Monitoring
Appendix B: Road Surface State Comparison
Vaisala time Vaisala Condition Video time
Video Condition
2/1/2007 12:05 0 2/1/2007 12:14 02/1/2007 12:25 0 2/1/2007 12:20 02/14/2007 8:37 2 2/14/2007 8:28 22/14/2007 8:37 2 2/14/2007 8:38 22/14/2007 8:57 2 2/14/2007 8:48 22/14/2007 8:57 2 2/14/2007 8:57 22/14/2007 9:17 2 2/14/2007 9:07 22/14/2007 9:57 2 2/14/2007 9:57 22/14/2007 9:57 2 2/14/2007 10:05 2
2/14/2007 11:57 1 2/14/2007 12:02 22/14/2007 12:57 2 2/14/2007 12:51 22/14/2007 16:37 2 2/14/2007 16:33 22/14/2007 16:37 2 2/14/2007 16:44 2
2/15/2007 8:57 2 2/15/2007 8:55 22/15/2007 8:57 2 2/15/2007 9:06 22/15/2007 9:17 2 2/15/2007 9:16 2
2/15/2007 13:17 2 2/15/2007 13:14 22/22/2007 6:17 0 2/22/2007 6:27 02/22/2007 6:17 0 2/22/2007 6:33 02/22/2007 6:37 0 2/22/2007 6:40 03/2/2007 12:16 2 3/2/2007 12:21 23/2/2007 15:16 2 3/2/2007 15:02 23/2/2007 15:16 2 3/2/2007 15:09 23/2/2007 15:16 2 3/2/2007 15:19 23/2/2007 16:56 1 3/2/2007 17:00 1
degree of agreement 0.96
condition bare dry or damp 0wet with obvious water layer 1snow or ice 2
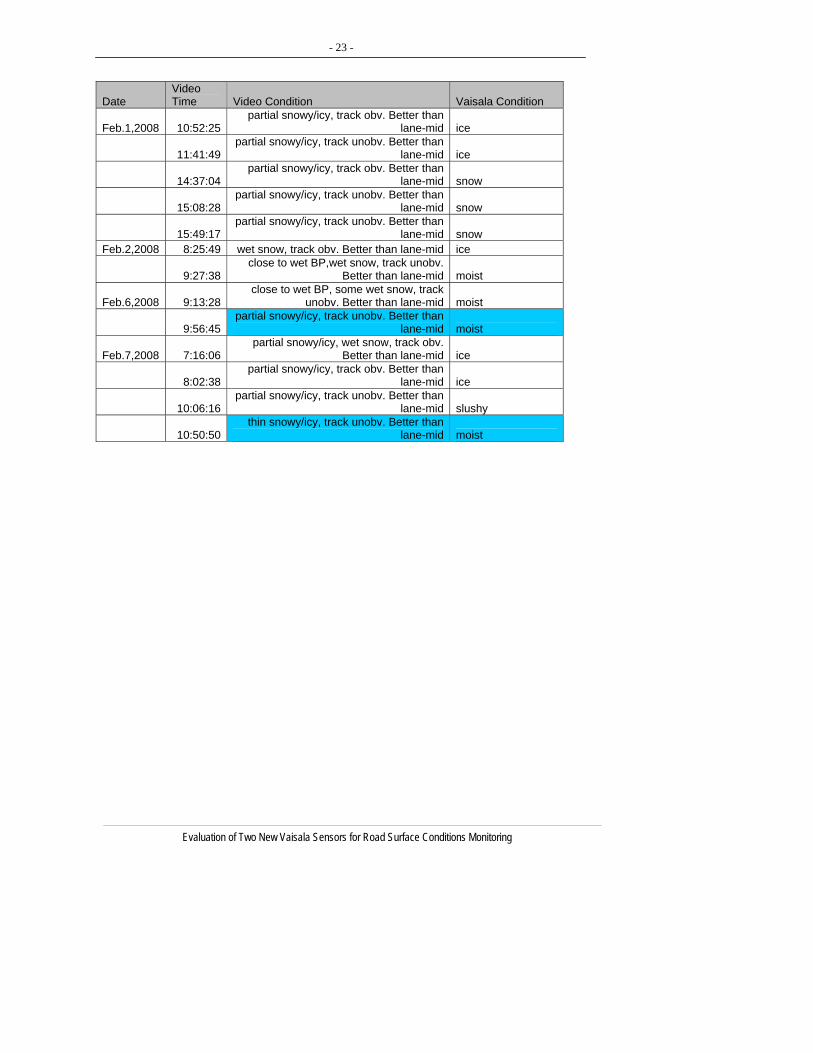
- 23 -
Evaluation of Two New Vaisala Sensors for Road Surface Conditions Monitoring
Date Video Time Video Condition Vaisala Condition
Feb.1,2008 10:52:25 partial snowy/icy, track obv. Better than
lane-mid ice
11:41:49 partial snowy/icy, track unobv. Better than
lane-mid ice
14:37:04 partial snowy/icy, track obv. Better than
lane-mid snow
15:08:28 partial snowy/icy, track unobv. Better than
lane-mid snow
15:49:17 partial snowy/icy, track unobv. Better than
lane-mid snow Feb.2,2008 8:25:49 wet snow, track obv. Better than lane-mid ice
9:27:38 close to wet BP,wet snow, track unobv.
Better than lane-mid moist
Feb.6,2008 9:13:28 close to wet BP, s
unobv. Better than lane-midome wet snow, track
moist
9:56:45 partial snowy/icy, track unobv. Better than
lane-mid moist
Feb.7,2008 7:16:06 partial snowy/icy, wet snow, t
Better than lane-midrack obv.
ice
8:02:38 partial snowy/icy,
lane-midtrack obv. Better than
ice
10:06:16 partial snowy/icy, track unobv. B
lane-midetter than
slushy
10:50:50 thin snowy/icy, track unobv. Better than
lane-mid moist
- 24 -
Evaluation of Two New Vaisala Sensors for Road Surface Conditions Monitoring
Appendix C: Grip Level and Friction Measurements
Date
Friction Measure Time
Friction Measured
Measured Friction Mean (50m)
Measured Friction Mean (100m)
Measured Friction Mean (500m)
Measured Friction Mean (1000m)
Closest Vaisala Time
Vaisala Grip
Hourly Average Grip
8:28:09 0.444 0.422 0.418 0.419 0.423 8:37:00 0.090 0.093
8:38:33 0.164 0.181 0.166 0.188 0.174 8:37:00 0.090 0.093 8:57:08 0.417 0.381 0.397 0.437 0.431 8:57:00 0.100 0.093
9:57:51 0.314 0.357 0.390 0.392 0.378 9:57:00 0.100 0.105 16:33:58 0.378 0.344 0.335 0.245 0.308 16:37:00 0.100 0.110
Feb.142007 16:44:35 0.324 0.325 0.342 0.405 0.408 16:37:00 0.100 0.110
6:22:32 0.902 0.896 0.920 0.959 0.960 6:17:00 0.700 0.710 8:55:32 0.401 0.453 0.485 0.695 0.714 8:57:00 0.090 0.310
9:06:41 0.500 0.397 0.388 0.579 0.665 8:57:00 0.090 0.150 9:15:59 0.374 0.356 0.329 0.636 0.754 9:17:00 0.100 0.150
Feb.152007 13:14:23 0.917 0.862 0.854 0.737 0.738 13:17:00 0.090 0.090 12:21:45 0.145 0.141 0.151 0.140 0.139 12:16:00 0.090 0.090
15:01:59 0.286 0.337 0.344 0.356 0.330 15:16:00 0.190 0.130
15:09:14 0.314 0.292 0.271 0.283 0.265 15:09:00 0.190 0.130
15:19:20 0.347 0.345 0.333 0.381 0.359 15:19:00 0.190 0.130
Mar.22007 17:00:52 0.948 1.005 0.995 0.969 0.978 16:56:00 0.780 0.780
Linear Regression Model 1: Hourly Average Grip to Spot-Wise Measured Friction
Regression Statistics Multiple R 0.915929 R Square 0.838926 Adjusted R Square 0.826536 Standard Error 0.092978 Observations 15 ANOVA
df SS MS F Significance
F Regression 1 0.585331 0 6.5853312 7.70825 1.64E-06 Residual 1 0.
3 0.112384 0086449 Total 14 0.697715
oefficients Error t Stat -value 95% Upper 95%
wer .0%
Upper .0% C
Standard P Lower
Lo95 95
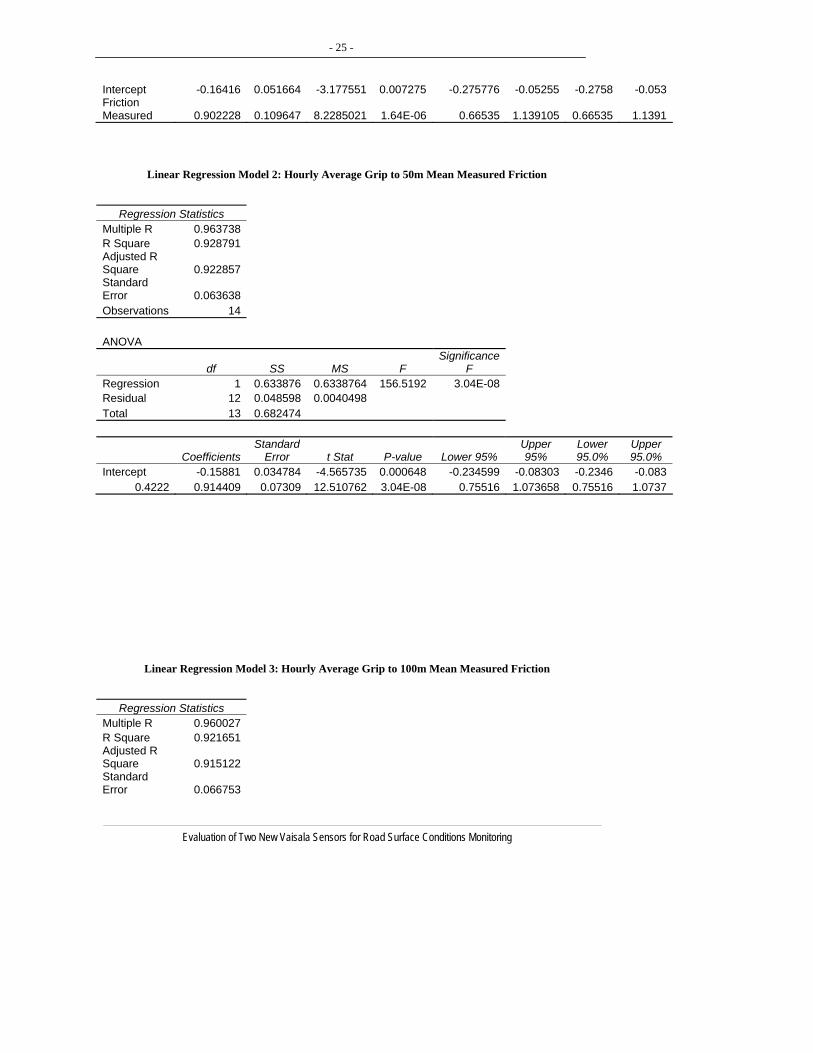
- 25 -
Evaluation of Two New Vaisala Sensors for Road Surface Conditions Monitoring
Intercept -0.16416 0 -3.177551 0.007275 -0.275776 -0 5Friction
1.64E-0
.051664 .0525 -0.2758 -0.053
Measured 0.902228 0.109647 8.2285021 6 0.66535 1.139105 0.66535 1.1391
Linear Regression Model 2: Hourly Average Grip to 50m Mean Measured Friction
Regression Statistics
Multiple R 0.963738 R S 1
ns 14
quare 0.92879 Adjusted R Square 0.922857 Standard Error 0.063638 Observatio ANOVA
df SS MS F ignificance
F S
Regression 1 0.633876 0.6338764 156.5192 3.04E-08Resid l 12 0.0 8 0.0 98
13
ua 4859 0404 Total
0.682474
Coefficie t Stat -value ower 95% Upper 95%
wer .0%
Upper .0% nts
Standard Error P L
Lo95 95
Intercept -0.15881 .565735 .000648 -0.234599 0.08303 .2346 -0.083 0.034784 -4 0 - -00.4222 0.914409 2.510762 .04E-08 0.755160.07309 1 3 1.073658 0.75516 1.0737
Linear Regression Model 3: Hourly Average Grip to 100m Mean Measured Friction
Regression Statistics
Multiple R 0.960027 R Squa
justedquare 0.915122
Sta
re 0.921651 R Ad
Sndard
Error 0.066753
- 26 -
Evaluation of Two New Vaisala Sensors for Road Surface Conditions Monitoring
Observations
14 ANOVA
df SS MS F ignificance
F S
Regression 1 0.629003 .6290032 41.1608 5.4E-080 1 ResidualTotal
12 .053471 .004455913 .682474
0 0 0
CoefficienStan rd
Lower Upper 95%
Lower .0%
Upper .0% ts
daError t Stat P-value 95% 95 95
Intercept -0.15383 0.036227 0.001135 -0.23276 -0.07489 -0.2328 -0.075-4.246140.418 0.8972 11.88111 5.4E-08 0.732668 .061734 .73267 1.061701 0.075515 1 1 0
inear Re o ly Average Grip Mean d
Regre Stati
L gression M del 4: Hour to 500m Measure Friction
ssion stics Multiple R 0.873816 R Square 0.763554
justed R quare 0.74385
Standarrror 0.1
ervations 14
AdS
d 15963 E
Obs
ANOVA
df SS MS F ignificance
F S
Regression .521106 .5211061 8.75158 4.42E-051 0 0 3 Residual 12 0.161368 .0134474
.682474 0
Total 13 0
Coefficients tandard Error t Stat -value
Upper 95%
wer .0%
Upper .0%
SP Lower 95%
Lo95 95
Interc t -0 457 0.0 1 -2. 09 0.0 4 .01E-05 0.2892 4E-05ep .14 6637 1782 5005 -0.289182 4 -0.4188 0. 557 0.1 1 6 0. 907 .036206 .49891 1.0362767 2330 .2250765 4.42E-05 498 1 0
Linear Regression y verage Grip to 1000m Mean Measured riction
Regression
Model 5: Hourl A F
Statistics Multip R le 0.824113 R Square 0.679162
- 27 -
Evaluation of Two New Vaisala Sensors for Road Surface Conditions Monitoring
Adjusted R Squar
tandard rror 0.135081
ervations 14
e 0.652426 SEObs
ANOVA
SS MS F Significance
F df Regression .463511 .4635108 5.40208 0.0002891 0 0 2 Residual 12 0.218964 0.018247
.682474
Total 13 0
Cotandard Error t Stat -value 95%
Upper 95%
wer .0%
Upper .0% efficients
SP Lower
Lo95 95
Intercept -0.115 .075923 -1.52578 0.15298 -0.281265 0.04958 .2813 0.049684 0 -00.4233 0.686676 .136244 .0400474 .000289 0.389826 .983526 .38983 0.98350 5 0 0 0
Date
FrictionMeasure Time Measured (50m)
MeaFriM(1
Measuctioan 0m
re
m) la
Time
HAGrip
Friction
Measured Friction Mean
sured ction
ean FriMe
00m) (50
red Measun Friction
Mean ) (1000
d
Closest Vaisa Vaisala Grip
ourly verage
10:52:2 0.464 0.399 441 0.095 0.453 0.458 0. 11:00:00 0 0.090
11:41:49 0.081 0.085 0.079 0.106 0.120 11:40:00 0.090 0.090
14:37:04 0.407 0.473 0.527 0.506 0.551 14:40:00 0.090 0.090
15:08:28 0.476 0.429 0.405 0.336 0.381 15:00:00 0.090 0.090 Feb.1,2008 15:49:17 0.226 0.239 0.253 0.263 0.299 15:40:00 0.090 0.100
8:25:49 0.746 0.765 0.714 0.516 0.519 8:20:00 0.100 0.120 Feb.2,2008 9:27:38 0.647 0.591 0.611 0.758 0.781 9:20:00 0.820 0.820
9:13:28 0.760 0.777 0.775 0.764 0.746 9:18:00 0.290 0.277 Feb.6,2008 9:56:45 0.770 9:58:00 0.820 0.680 0.798 0.796 0.791 0.783
7:16:06 0.406 4 7:18:00 0.100 0.45 0.504 0.450 0.463 0.103
8:02:38 .606 08 51 75 0.612 0 0.6 0.5 0.5 7:58:00 0.100 0.103
10:06:16 .753 5 7 0 0.684 0 0.71 0.68 0.665 9:58:00 0.71 0.540 Feb.7,2008 10:50:50 0.853 0.803 0.789 0.751 0.742 10:58:00 0.820 0.783
- 28 -
Evaluation of Two New Vaisala Sensors for Road Surface Conditions Monitoring
Appendix D per e Re Di nc tist
er Temperature Reading Difference (Vaisala – Lufft)
: Tem atur ading ffere e Sta ics
Decemb , 2006
Valid 387N Missing 0
Mean -.2888Std. Error of Mean .04777Median -.3000Mode -.70Std. Deviation .93974Variance .883Skewness -.649Std. Error of Skewness .124Kurtosis 3.599Std. Error of Kurtosis .247Range 7.97Minimum -5.83Maximum 2.13Sum -111.75
25 -.766750 -.3000
Percentiles
75 .2000
- 29 -
4.00
Evaluation of Two New Vaisala Sensors for Road Surface Conditions Monitoring
2.000.00-2.00-6.00 -4.00
100
80
60
0
40
20
Freq
uenc
y
diffVL
Mean = -0.2888Std. Dev. = 0.93974N = 387
Histogram
One-Sample Test
Test Value = 0 95% Confidence Interval
of the Difference Mean
t df Sig. (2-tailed) Difference Lower Upper diffVL -6.045 386 .000 -.28876 -.3827 -.1948
- 30 -
Evaluation of Two New Vaisala Sensors for Road Surface Conditions Monitoring
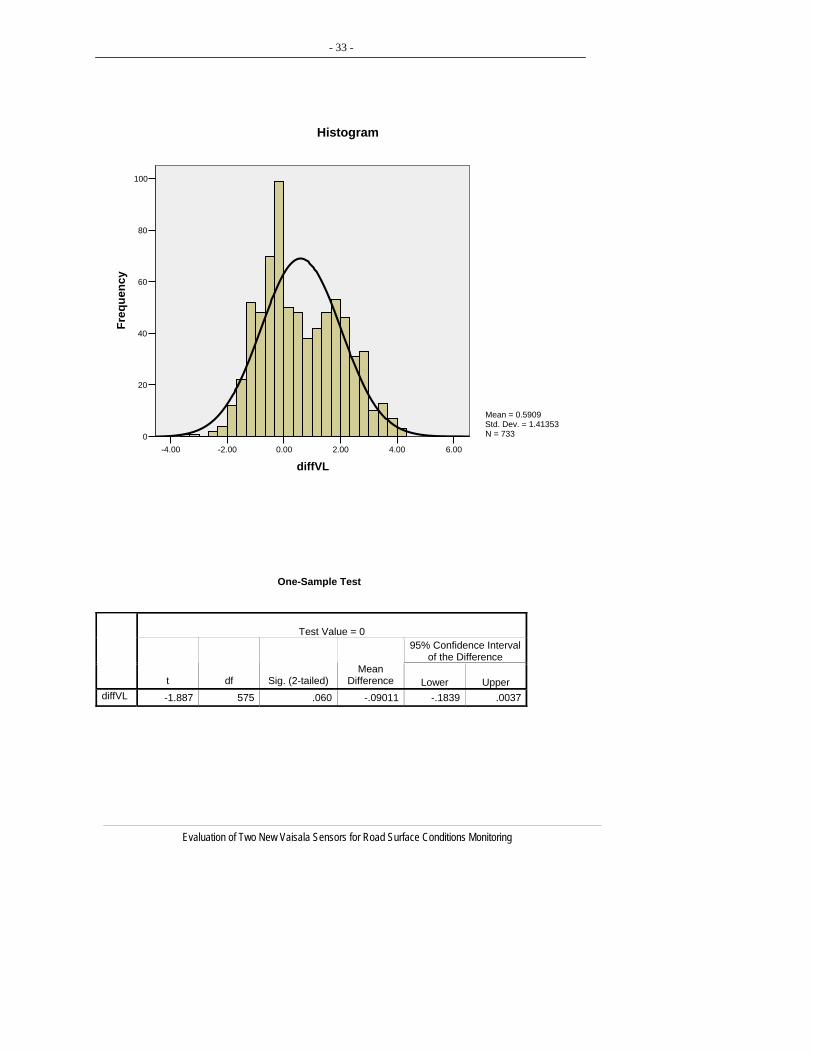
January, 2007 Temperature Reading Difference (Vaisala – Lufft)
Valid 733N Missing 0
Mean .5909Std. Error of Mean .05221Median .3389(a)Mode -.27(b)Std. Deviation 1.41353Variance 1.998Skewness .264Std. Error of Skewness .090Kurtosis -.690Std. Error of Kurtosis .180Range 7.73Minimum -3.53Maximum 4.20Sum 433.16
10 -1.1000(c)20 -.666725 -.500030 -.333340 -.100050 .338960 .943370 1.476775 1.733380 1.9656
Percentiles
90 2.5667
a Calculated from grouped data.
Multiple modes exist. The smallest value is shown
c Percentiles are calculated from grouped data.
b
- 31 -
4.00
Evaluation of Two New Vaisala Sensors for Road Surface Conditions Monitoring
2.000.00-2.00-4-6.00 .00
70
0
60
50
40
30
20
10
Freq
uenc
y
diffVL
Mean = -0.0901Std. Dev. = 1.14628N = 576
Histogram
Test
One-Sample
Test Value = 0 95% Confidence Interval
of the Difference Mean
t df Sig. (2-tailed) Difference Lower Upper diffVL -1.887 575 .060 -.09011 -.1839 .0037
- 32 -
Evaluation of Two New Vaisala Sensors for Road Surface Conditions Monitoring
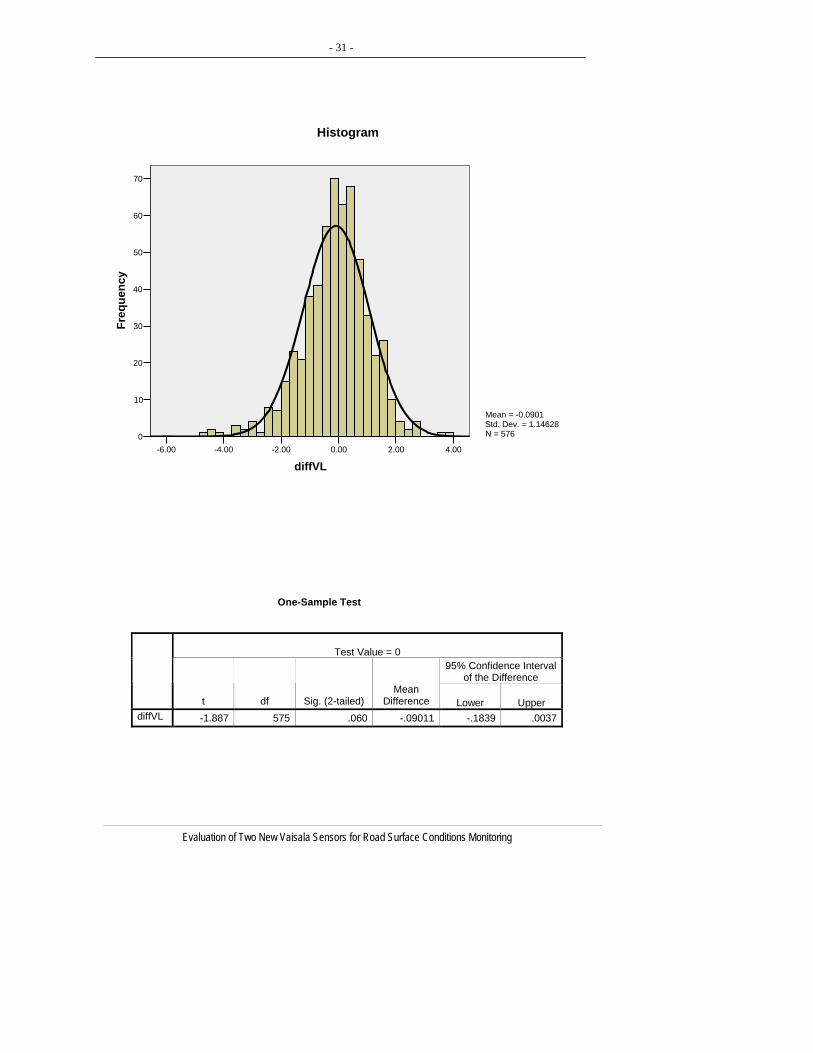
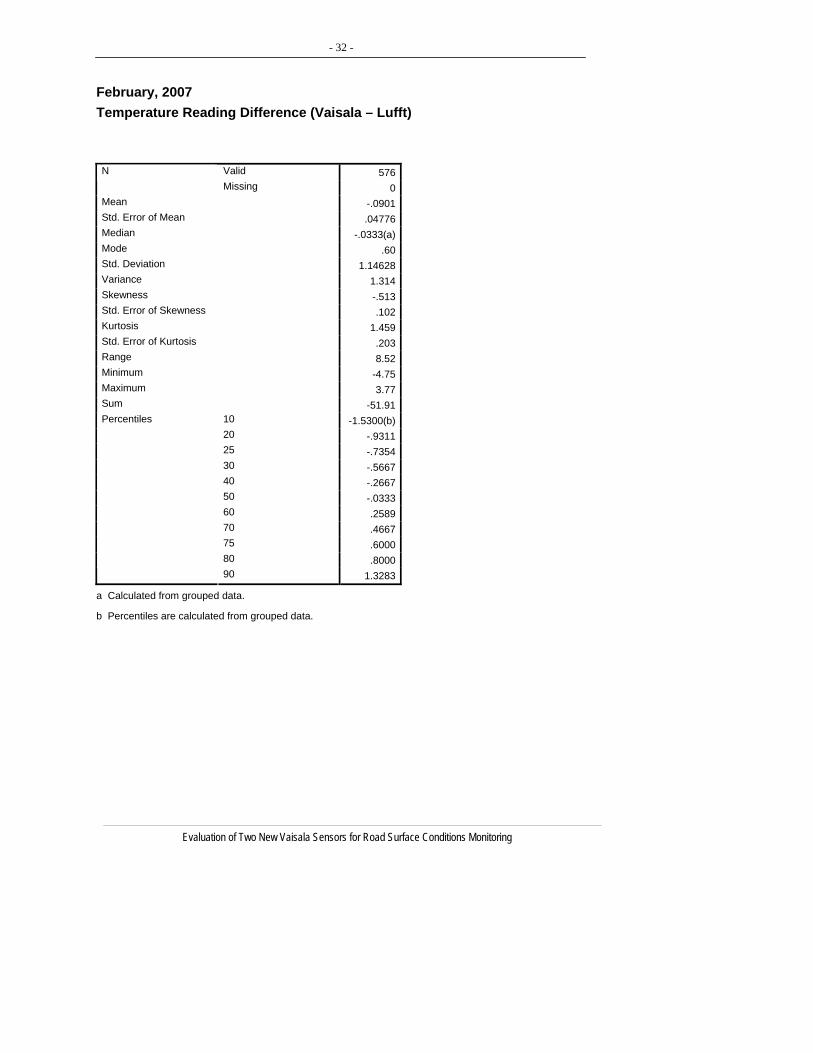
February, 2007 Temperature Reading Difference (Vaisala – Lufft)
Valid 576N Missing 0
Mean -.0901Std. Error of Mean .04776Median -.0333(a)Mode .60Std. Deviation 1.14628Variance 1.314Skewness -.513Std. Error of Skewness .102Kurtosis 1.459Std. Error of Kurtosis .203Range 8.52Minimum -4.75Maximum 3.77Sum -51.91
10 -1.5300(b)20 -.931125 -.735430 -.566740 -.266750 -.033360 .258970 .466775 .600080 .8000
Percentiles
90 1.3283
a Calculated from grouped data.
b Percentiles are calculated from grouped data.
- 33 -
6.00
Evaluation of Two New Vaisala Sensors for Road Surface Conditions Monitoring
4.002.000.00--4.00 2.00
100
0
80
60
40
20
Freq
uenc
y
diffVL
Mean = 0.5909Std. Dev. = 1.41353N = 733
Histogram
One-Sample Test
Test Value = 0 95% Confidence Interval
of the Difference Mean
t df Sig. (2-tailed) Difference Lower Upper diffVL -1.887 575 .060 -.09011 -.1839 .0037
- 34 -
Evaluation of Two New Vaisala Sensors for Road Surface Conditions Monitoring
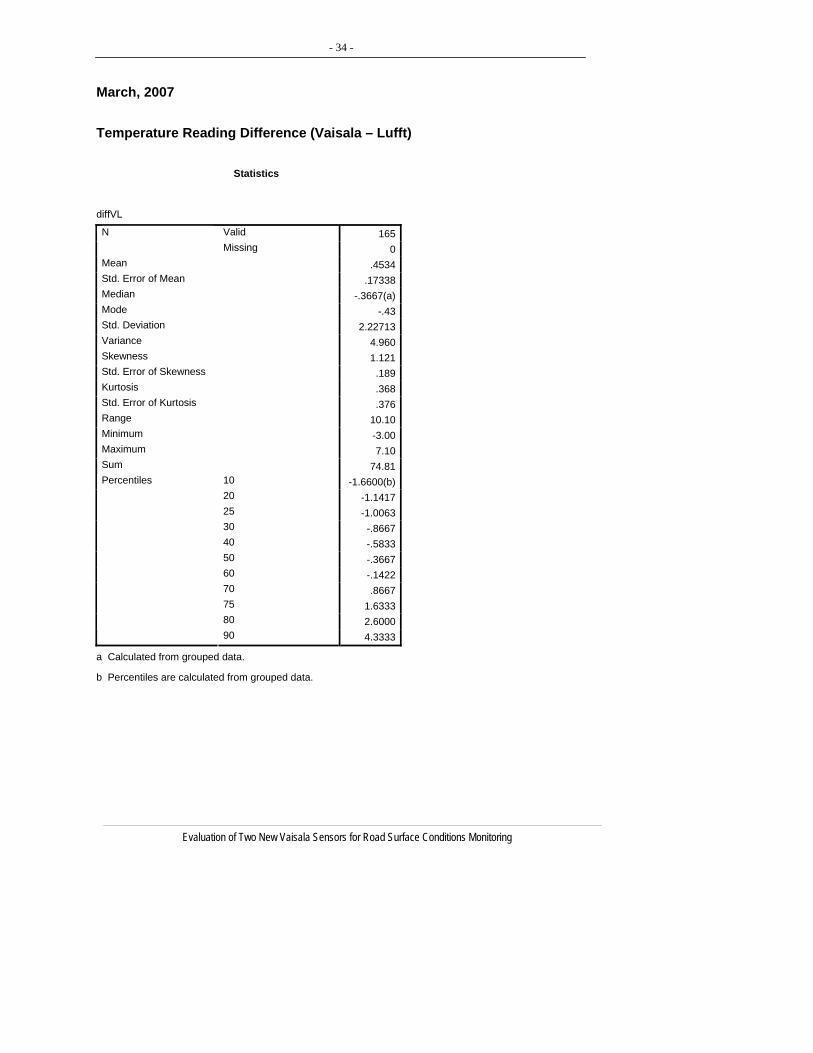
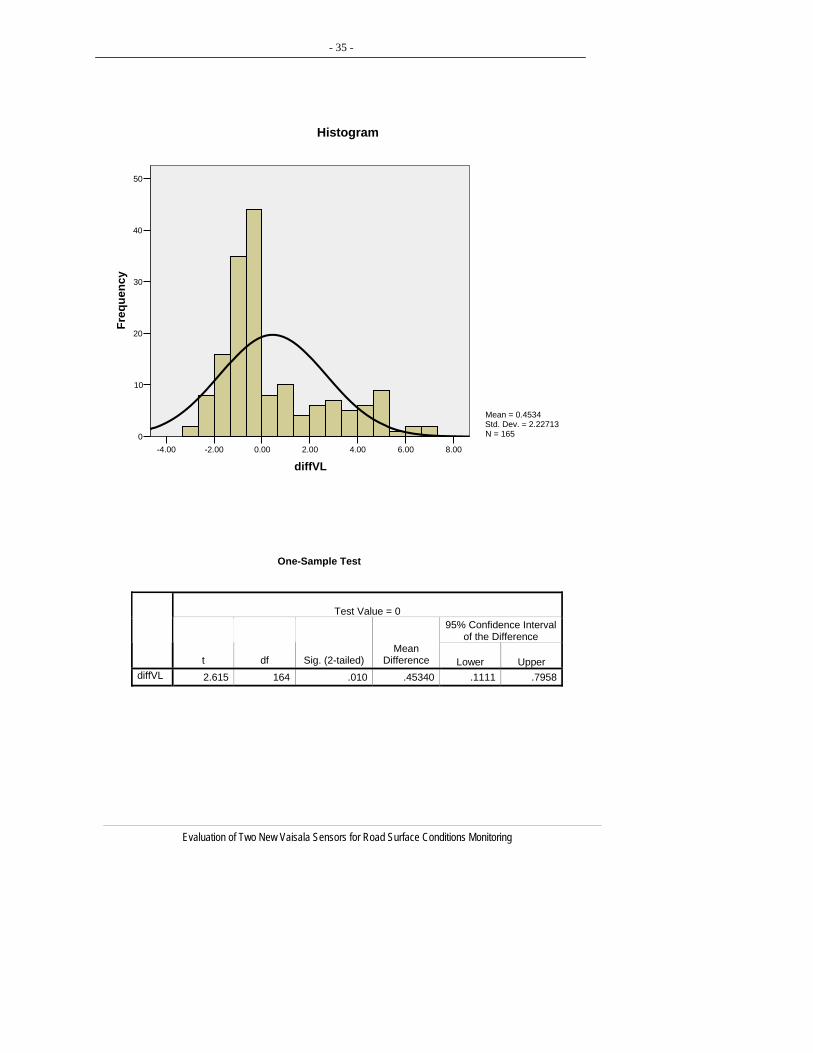
March, 2007 Temperature Reading Difference (Vaisala – Lufft) Statistics
diffVL
Valid 165N Missing 0
Mean .4534Std. Error of Mean .17338Median -.3667(a)Mode -.43Std. Deviation 2.22713Variance 4.960Skewness 1.121Std. Error of Skewness .189Kurtosis .368Std. Error of Kurtosis .376Range 10.10Minimum -3.00Maximum 7.10Sum 74.81
10 -1.6600(b)20 -1.141725 -1.006330 -.866740 -.583350 -.366760 -.142270 .866775 1.633380 2.6000
Percentiles
90 4.3333
a Calculated from grouped data.
b Percentiles are calculated from gro
uped data.
- 35 -
8.006.004.002.000.00-2.00-4.00
diffVL
Histogram
50
40
30
20
10
0
Freq
uenc
y
Mean = 0.4534Std. Dev. = 2.22713N = 165
One-Sample Test
Test V alue = 095% Confidence Interval
Evaluation of Two New Vaisala Sensors for Road Surface Conditions Monitoring
of the Difference
t Mean
df Sig. (2-tailed) Difference Lower Upper diffVL 2.615 164 .010 .45340 .1111 .7958
- 36 -
Evaluation of Two New Vaisala Sensors for Road Surface Conditions Monitoring
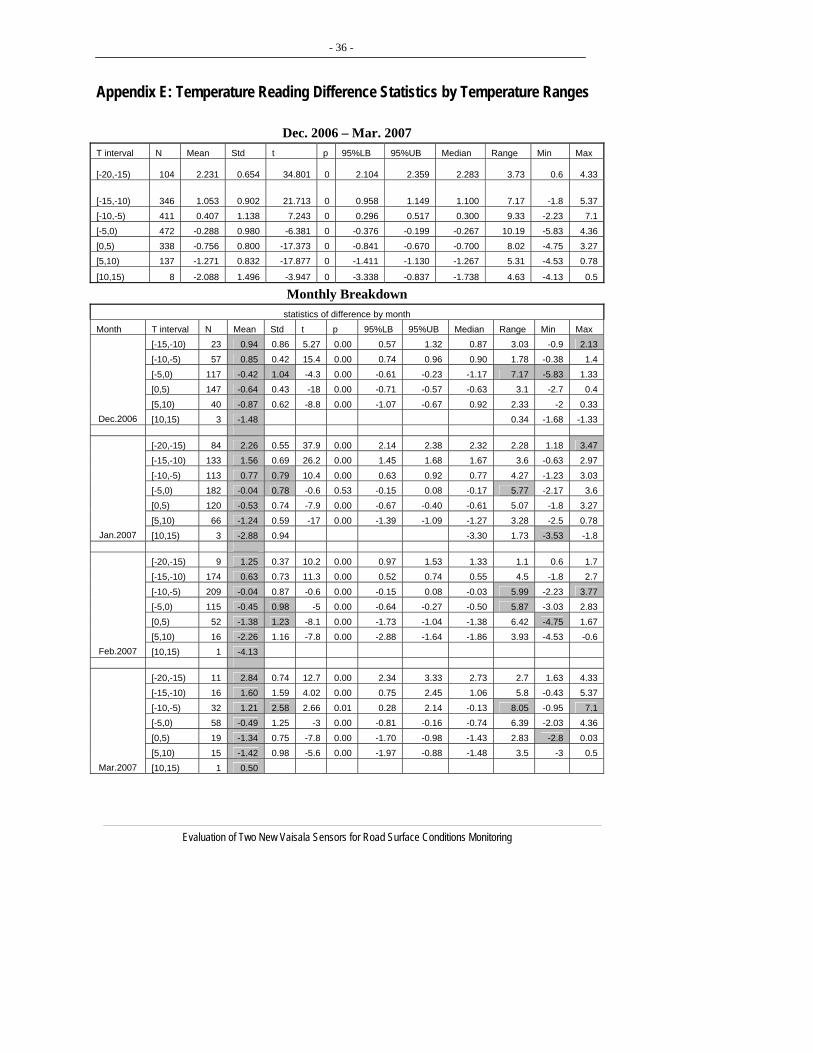
Appendix E: Temperature Reading Difference Statistics by Temperature Ranges
Dec. 2006 – Mar. 2007 T interval N Mean Std t p 95%LB 95%UB Median Range Min Max
[-20,-15) 104 2.231 0.654 34.801 0 2.104 2.359 2.283 3.73 0.6 4.33
[-15,-10) 346 1.053 0.902 21.713 0 0.958 1.149 1.100 7.17 -1.8 5.37 [-10,-5) 411 0.407 1.138 7.243 0 0.296 0.517 0.300 9.33 -2.23 7.1
[-5,0) 472 -0.288 0.980 -6.381 0 -0.376 -0.199 -0.267 10.19 -5.83 4.36 [0,5) 338 -0.756 0.800 -17.373 0 -0.841 -0.670 -0.700 8.02 -4.75 3.27 [5,10) 137 -1.271 0.832 -17.877 0 -1.411 -1.130 -1.267 5.31 -4.53 0.78
[10,15) 8 -2.088 1.496 -3.947 0 -3.338 -0.837 -1.738 4.63 -4.13 0.5
Monthly Breakdown statistics of difference by month
Month T interval N Mean Std t p 95%LB 95%UB Median Range Min Max [-15,-10) 23 0.94 0.86 5.27 0.00 0.57 1.32 0.87 3.03 -0.9 2.13
[-10,-5) 57 0.85 0.42 15.4 0.00 0.74 0.96 0.90 1.78 -0.38 1.4 [-5,0) 117 -0.42 1.04 -4.3 0.00 -0.61 -0.23 -1.17 7.17 -5.83 1.33 [0,5) 147 -0.64 0.43 -18 0.00 -0.71 -0.57 -0.63 3.1 -2.7 0.4
[5,10) 40 -0.87 0.62 -8.8 0.00 -1.07 -0.67 0.92 2.33 -2 0.33 Dec.2006 [10,15) 3 -1.48 0.34 -1.68 -1.33
[-20,-15) 84 2.26 0.55 37.9 0.00 2.14 2.38 2.32 2.28 1.18 3.47 [-15,-10) 133 1.56 0.69 26.2 0.00 1.45 1.68 1.67 3.6 -0.63 2.97
[-10,-5) 113 0.77 0.79 10.4 0.00 0.63 0.92 0.77 4.27 -1.23 3.03 [-5,0) 182 -0.04 0.78 -0.6 0.53 -0.15 0.08 -0.17 5.77 -2.17 3.6 [0,5) 120 -0.53 0.74 -7.9 0.00 -0.67 -0.40 -0.61 5.07 -1.8 3.27
[5,10) 66 -1.24 0.59 -17 0.00 -1.39 -1.09 -1.27 3.28 -2.5 0.78 Jan.2007 [10,15) 3 -2.88 0.94 -3.30 1.73 -3.53 -1.8
[-20,-15) 9 1.25 0.37 10.2 0.00 0.97 1.53 1.33 1.1 0.6 1.7 [-15,-10) 174 0.63 0.73 11.3 0.00 0.52 0.74 0.55 4.5 -1.8 2.7
[-10,-5) 209 -0.04 0.87 -0.6 0.00 -0.15 0.08 -0.03 5.99 -2.23 3.77 [-5,0) 115 -0.45 0.98 -5 -0.27 -0.50 0.00 -0.64 5.87 -3.03 2.83
[0,5) 52 -1.38 1.23 -8.1 0.00 -1.73 -1.04 -1.38 6.42 -4.75 1.67 [5,10) 16 -2.26 1.16 -7.8 0.00 -2.88 -1.64 -0.6 -1.86 3.93 -4.53
Feb.2007 [10,15) 1 -4.13
[-20,-15) 11 2.84 0.74 12.7 0.0 2.34 3.33 2.7 4.33 0 2.73 1.63[-15,-10) 16 1.60 1.59 4.02 0.00 0.75 2.45 1.06 5.8 -0.43 5.37
[-10,-5) 32 1.21 2.58 2.66 0.01 0.28 2.14 -0.13 8.05 -0.95 7.1 [-5,0) 58 -0.49 1.25 -3 0.00 -0.81 -0.16 -0.74 6.39 -2.03 4.36
[0,5) 19 -1.34 0.75 -7.8 0.00 -1.70 -0.98 -1.43 2.83 -2.8 0.03 [5,10) 15 -1.42 0.98 -5.6 0.00 -1.97 -0.88 -1.48 3.5 -3 0.5
Mar.2007 [10,15) 1 0.50