executive summary for 2015 -...
TRANSCRIPT

1
EXECUTIVE SUMMARY for 2015
IARTR – THE ITALIAN ASSISTED REPRODUCTIVE TECHNOLOGY REGISTER
MONITORING THE ACTIVITY AND
OUTCOMES OF ITALIAN ART
CENTERS IN 2015.

2
INDEX
SUMMARY OF OUTPUTS GENERATED FROM IARTR, 2015 ............................................................................. 4
THE ITALIAN ASSISTED REPRODUCTION TECHNOLOGY REGISTER (IARTR) ............................ 5
HOW DOES IARTR WORK? ...................................................................................................................... 6
THE IARTR WEB-SITE ................................................................................................................................ 7
1. ACCESS AND UTILIZATION OF ART SERVICES IN ITALY, 2015 ................................ 8
1.1.ACCESS TO ART SERVICE ........................................................................................................................ 9
1.2.UTILIZATION OF ART SERVICES ............................................................................................................ 11
2. EFFICACY OF ART 2015 AND ................................................................................................ 14
TIME TRENDS 2005-2015 ............................................................................................................. 14
2.2. ART, NON-DONOR CYCLES. ................................................................................................................... 15
2.2.1. What are the steps for an ART treatment using fresh cycles? ...................................................... 15
2.2.2. What are the percentages of initiated cycles, retrievals and transfers that result in
pregnancies for fresh cycles? ......................................................................................................... 16
2.2.3. What is the percentage of thawing cycles and transfers that result in pregnancies for
FER and FOR techniques? ............................................................................................................. 17
2.2.4. What is the “Cumulative Pregnancy Rate”? ............................................................................... 18
2.2.5. What is the gender distribution of infertility factors among ART users? ..................................... 19
2.2.6. Is the use of ART increasing? ....................................................................................................... 20
2.2.7. Did the use of different ART procedures change over time? ........................................................ 21
2.2.8. Did the use of FER procedures differ in Italy compared to other European countries
over time? ....................................................................................................................................... 22
2.2.9. Has the age of ART female patients changed over time? ............................................................. 23
2.2.10. Has the number of embryos transferred changed in fresh cycles?............................................. 25
2.2.11. Did pregnancy rates per transfer changed over time among different ART
procedures ? ................................................................................................................................... 26
2.2.12. Did cumulative pregnancy rates per initiated cycle changed over time? .................................. 27
2.2.13. Did pregnancy rates per retrieval change over time among different female age
groups? ........................................................................................................................................... 28
2.2.14. Does the risk of pregnancy loss differ among women of different age groups? ........................ 29

3
2.3. ART DONOR CYCLES. ............................................................................................................................ 30
2.3.1. Which gametes were used in ART donor cycles in 2015? ............................................................ 30
2.3.2. What is the age of recipient female patients in ART donor cycles in 2015? ................................ 31
2.3.3. What is the percentage of initiated cycles and transfer that result in pregnancies in
ART donor cycles in 2015? ............................................................................................................. 32
3. INDICATORS OF ART SAFETY ............................................................................................. 33
3.1.1. Did the percentages of singletons, twins and triplets- or- more deliveries for fresh
cycles change over time? ................................................................................................................ 34
3.1.2. Did the percentages of preterm live babies change over time? ................................................... 35
3.1.3. Did the percentage of underweight live babies change over time? .............................................. 36
4. IUI PROCEDURES .................................................................................................................... 37
4.1.ACCESS TO IUI SERVICE ......................................................................................................................... 38
4.2. EFFICACY AND SAFETY OF IUI AND TRENDS ......................................................................................... 40
4.2.1. Is the use of IUI-H increasing? .................................................................................................... 40
4.2.2. Do percentages of IUI-H cycles resulting in pregnancy, differ among women of
different age groups? ...................................................................................................................... 41
4.2.3. Did the percentages of singletons, twins and triplets- or- more deliveries change
over time for intrauterine insemination cycles? ............................................................................. 42
4.3. IUI DONOR CYCLES................................................................................................................................ 43
4.3.1. What is the outcome in IUI donor cycles in 2015? ...................................................................... 43
APPENDIX. SUMMARY TABLE OF ACTIVITY AND OUTCOMES OF ART
PROCEDURES, YEARS 2010 – 2015 ....................................................................................... 44
SUMMARY TABLE OF ACTIVITY AND OUTCOMES OF ALL PROCEDURES, 2010 – 2015 ................................. 45
SUMMARY TABLE OF ACTIVITY AND OUTCOMES OF PROCEDURES WITH GAMETE/EMBRYO DONATION,
2014-2015 .............................................................................................................................................. 47
Downloadable at: http://www.iss.it/rpma

4
Summary of outputs generated from IARTR, 2015
Non-donor Procedures Gametes/embryo donation
IVF ICSI FER FOR Semen
Donation Egg
Donation Cryopreserved
Embryos
N° of patients 45,689 10,557 1,418 494 1,220 369
N° Initiated cycles 7,985 47,344 12,903 1,529 559 1,308 420
N° Aspirations 7,107 43,107 - -
N° Transfers 5,765 32,210 11,849 1,221 437 1,206 409
with 1 embryo 1,551 9,372 6,957 381 121 276 165
with 2 embryos 2,866 15,477 4,193 638 233 708 230
with 3 embryos 1,200 6,785 653 197 83 222 14
with 4 o + embryos 148 576 46 5 - - -
N° Pregnancies 1,638 8,443 3,379 254 164 381 132
Pregnancy per Initiated cycles/thawings (%)
20.5 17.8 26.2 16.6 29.3 29.1 31.4
Pregnancy per Transfer (%) 28.4 26.2 28.5 20.8 37.5 31.6 32.3
Pregnancies lost to follow-up (%)
9.4 13.8 5.6 5.9 9.8 22.0 4.5
N° Pregancy losses 360 1,903 787 69 30 67 33
Pregnancy loss (%) 24.3 26.2 24.7 28.9 20.3 22.6 33.3
N° Deliveries 1,124 5,374 2,403 170 118 230 93
Twin deliveries (%) 17.5 17.2 8.7 12.4 20,3 21,7 17,2
Triplets or more deliveries (%) 0.6 0.9 0.2 0.6 - 0,9 -
N° Live born babies 1,332 6,363 2,609 193 142 281 109

5
THE ITALIAN ASSISTED REPRODUCTION TECHNOLOGY
REGISTER (IARTR)
The Assisted Reproductive Technology National Register has been established at the Istituto
Superiore di Sanità (National Institute of Health), National Centre for Epidemiology Surveillance
and Health Promotion, by a Decree of the Ministry of Health issued on the 7 of October 2005 (G.U.
n. 282 del 3 December 2005) in implementation of article n° 11 paragraph 1 of Law 40/2004 (G.U.
n.45 del 24 February 2004).
The Register collects descriptive, technical, structural and organizational information of ART
centers authorized to conduct ART, and anonymous, aggregate data sets on all the ART treatments,
plus information on the infertile couples, on embryos created and on children born after ART.
The main objectives of the Register are:
ASSESS and REGISTER all the centres performing ART treatments and IUI procedures in
the country and the number of embryos created and cryopreserved;
COLLECT and EVALUATE data regarding centres characteristics and addresses, type of
service offered (public, private or private covered by the National Health service), the different
techniques performed, activity, availability, efficacy and safety of techniques application;
PROMOTE research and study on couple infertility causes, long-term evaluation of well-
being of the children born after ART procedures; research on gametes characteristics new
cryopreservation protocols; monitoring time trends in ART applications in order to compare
different attitudes with other countries.
The Register prepares an annual epidemiological/statistical report on the ART centres’ activity for
the Minister of Health in order to illustrate to the Parliament the situation in the ART field with a
particular epidemiological overview.
The IARTR is linked to the European IVF Monitoring (EIM) Consortium which collects data on
ART from about 39 European countries. In turn, the EIM sends data to the World Register
ICMART (International Committee Monitoring Assisted Reproductive Technologies). The activity
of IARTR is audited by Prof. Karl-Gösta Nygren, Associate Professor of Obstetrics and
Gynecology at the "Karoliniska Institutet - Department of Medical Epidemiology and Biostatistics"
Stockholm - Past Chairman of ICMART and Past Chairman of EIM at ESHRE.
6
HOW DOES IARTR WORK?
The staff is coordinated by Dr. Giulia Scaravelli, MD-Gynaecologist. In the staff there are a variety
of skills: statistics, epidemiology, gynaecology, biology, sociology and informatics.
Data on efficacy, safety and outcomes of reproductive techniques including -IUI are collected on a
web-site on a reserved area with a username and a password. Data collection, it is based on
summary data sent from each centre according to a national law on privacy protection (Dlg
196/2003).
The data collection it is organized in two different times frames:
The first phase of the collection is related to the activity conducted and the results obtained
in 2015 and it was carried out from May to June 2016;
The second phase of the collection is related to the outcomes of pregnancies obtained from
ART treatments started in 2015 and it was carried out October to December 2016.
Data collection is made on number of cycles performed for each technique, number of patients
treated, kind of infertility diagnosed, complications during treatments and results, pregnancies
outcomes and babies born.

7
THE IARTR WEB-SITE
WWW.ISS.IT/RPMA
The Register web-site has the goal to collect and disseminate data and information related to -IUI
and ART procedures.
There are different levels of interest in the web-site, that give:
A service for the citizens: they can consult the list of all the authorized centres by different
regions and have information about the techniques they perform, and the availability of the
service. They can find on the home page all the information regarding ART and -IUI
techniques and their application in Italy. They can find also the links to patient associations,
scientific reproductive societies, government institutions, national health service, European
and international registries on ART; moreover there is a lot of information to better
understand problems related to infertility reasons, news on reproductive and infertility
issues, and a steady overview on Italian and European legislation on the reproductive field
A service for all the centres: they can fill the forms on their activity each year and they have
access to their local authority and to the national Register staff.
A service for all 20 Italian Regions: They can see all the data relating the centres operating
on their territory and they can monitor and elaborate data on their specific activity
The Registry's website was visited last year by approximately 140.000 users, with a daily
average of about 380 hits, and is the second most visited site in the National Institute of Health
Portal

8
1. ACCESS AND UTILIZATION OF ART
SERVICES IN ITALY, 2015

9
1.1.Access to ART service
In Figure 1 the regional distribution of ART centers is represented.
The largest number of ART centers is concentrated in Northern Italy (79 centers, 39.1% of the total)
and in the Southern area (76 centers, 37.6% of the total), irrespective of the amount of their activity.
Figure 1: Regional distribution of the ART active centers, 2015. Total = 202 centers

10
Table 1 shows the geographical distribution of ART centers according to the type of services
offered. Overall, the number of centers active in 2015 was 202, 93 of which (46%) operating within
the National Health Service (public and private), and 109 (54%) which provided only private
service.
The majority of ART centers providing public service was concentrated in the North of Italy, i.e. in
the North West 76.9%, while in the Centre and in the South there were mainly private facilities
(55.3% and 69.7%, respectively).
Table 1: ART centers distribution by region and type of service, 2015.
Region and Geographical Area Total
Type of Service
Public Private covered by
NHS Private
N % N % N %
Piemonte 10 3 30.0 1 10.0 6 60.0
Valle d'Aosta 1 1 100 0 - 0 -
Lombardia 26 13 50.0 10 38.5 3 11.5
Liguria 2 2 100 0 - 0 -
North-West 39 19 48.7 11 28.2 9 23.1
A.P. Bolzano 2 1 50.0 0 - 1 50.0
A.P. Trento 1 1 100 0 - 0 -
Veneto 20 8 40.0 0 - 12 60.0
Friuli Venezia Giulia 3 2 66.7 1 33.3 0 -
Emilia Romagna 14 6 42.9 0 - 8 57.1
North-East 40 18 45.0 1 2.5 21 52.5
Toscana 14 4 28.6 6 42.9 4 28.6
Umbria 2 1 50.0 0 - 1 50.0
Marche 3 2 66.7 0 - 1 33.3
Lazio 28 6 21.4 2 7.1 20 71.4
Central 47 13 27.7 8 17.0 26 55.3
Abruzzo 4 2 50.0 0 - 2 50.0
Molise 1 0 - 0 - 1 100
Campania 27 7 25.9 0 - 20 74.1
Puglia 12 3 25.0 0 - 9 75.0
Basilicata 1 1 100 0 - 0 -
Calabria 4 0 - 0 - 4 100
Sicilia 24 7 29.2 0 - 17 70.8
Sardegna 3 3 100 0 - 0 -
South and Islands 76 23 30.3 0 - 53 69.7
Italy 202 73 36.1 20 9.9 109 54.0

11
1.2.Utilization of ART services
In Table 2 time-trends of ART initiated cycles per million inhabitants and per million women of
reproductive age (between 15 and 45 years) are shown, in comparison with the same indicators in
Europe. In Italy, both the indicators were constantly growing, with an increase of 539 cycles
(+ 84.7%) and of 3,658 cycles (+ 136.4%), respectively.
The latest European data available refers to the activity of year 2013 (article in press). The number
of started cycles per million inhabitants (calculated only for the 18 countries that have reported data
of 100% of the centers) was 1,175 cycles vs. 1,070 in Italy.
Table 2: Number of initiated ART cycle per million inhabitants and per million women of reproductive age (15-45 years) annually in Italy (2005-2015) and in
Europe (2005-2013).
Years
ART Cycles/million population
ART cycles/million women (15 - 45 years)
Italy Europea Italy Europe
a
2005 636 1,115 2,683 4,008
2006 692 850 3,328 3,503
2007 736 886 3,569 4,320
2008 800 947 3,905 4,661
2009 865 1,067 4,265 5,455
2010 973 1,221 4,863 6,258
2011 1,063 1,269 5,392 6,556
2012 1,078 1,252 5,562 6,519
2013 1,070 1,175 5,601 6,210
2014 1,102 - 5,855 -
2015 1,175 - 6,341 -
a: Data for Europe refers only to those country where data coverage was 100% in every year. b: In 2005 ART cycles are related to the number of women aged between 15 and 49 years.
12
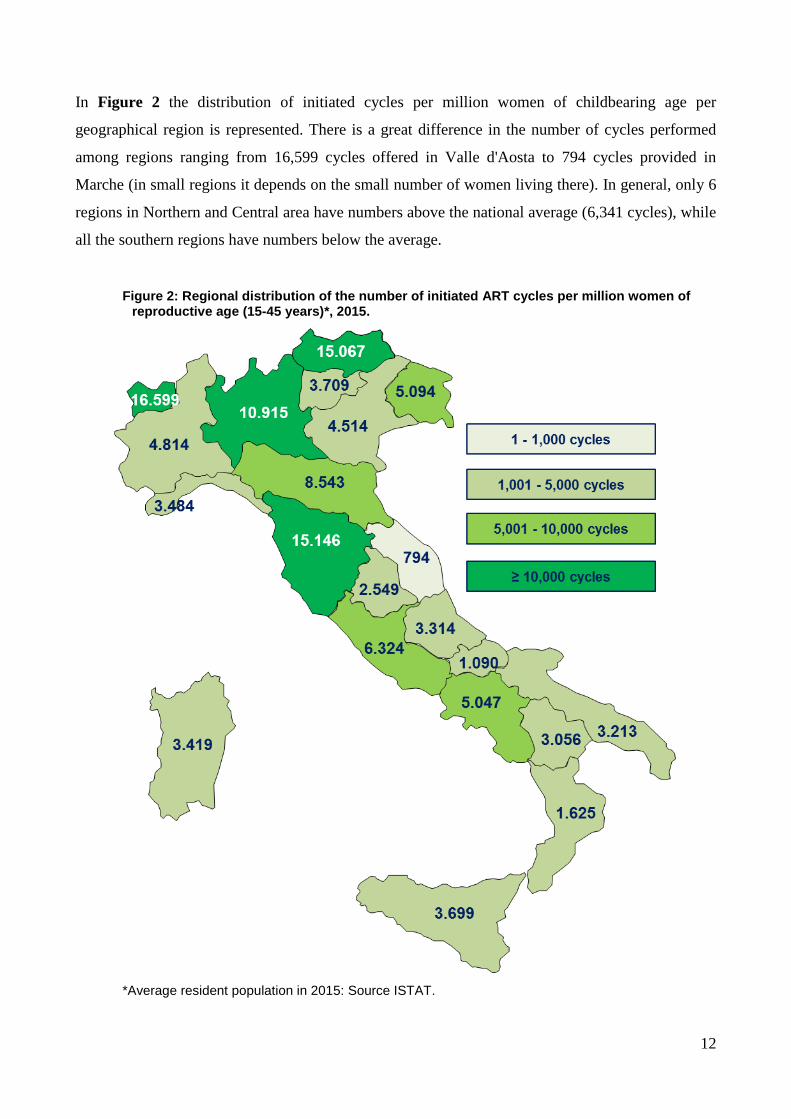
In Figure 2 the distribution of initiated cycles per million women of childbearing age per
geographical region is represented. There is a great difference in the number of cycles performed
among regions ranging from 16,599 cycles offered in Valle d'Aosta to 794 cycles provided in
Marche (in small regions it depends on the small number of women living there). In general, only 6
regions in Northern and Central area have numbers above the national average (6,341 cycles), while
all the southern regions have numbers below the average.
Figure 2: Regional distribution of the number of initiated ART cycles per million women of
reproductive age (15-45 years)*, 2015.
*Average resident population in 2015: Source ISTAT.

13
Figure 3 shows the percentages of live-born babies conceived by ART compared with the national
total number of children born in Italy. From 2005 to 2015 the percentage of infants born with ART
procedures increased 3 times.
Since its establishment, IARTR collected data on 116,771 infants, of which 94,070 from ART and
22,701 from IUI cycles. For the analysis of these data some caution may be required because of the
proportion of pregnancies lost to follow-up, that however changed to the better: from 41% in 2005
and 21.5% in 2006 to 11.1% in 2015.
Figure 3: Time-trends of the percentage of babies born live after ART and after ART & IUI in relation to the annual national number of children born in Italy, 2005-2015.

14
2. EFFICACY OF ART 2015 AND
TIME TRENDS 2005-2015

15
2.2. ART, non-donor cycles.
2.2.1. What are the steps for an ART treatment using fresh cycles?
An ART cycle using fresh gametes:
Is started when a woman begins taking fertility drugs to stimulate the ovaries to produce eggs or
having her ovaries monitored for follicle production, if no drugs are given. (initiated cycle)
It continues, if the egg follicles are produced, by a surgical procedure to retrieve the eggs
contained in the ovaries (retrieval)
After eggs collection, the sperm fertilize eggs in a dish with In Vitro Fertilization or with ICSI.
(fertilization)
If fertilization results, the embryo developed is transferred to the woman’s womb (transfer)
The embryo implant into the woman’s womb (implantation)
If implantation is successful, a clinical pregnancy occurs (clinical pregnancy)
If the pregnancy progresses, a live birth delivery occurs, when at least one live born baby results
from a delivery (live birth delivery). A birth of twins, triplets or more are counted as one live
birth
In Figure 4 outcomes resulting from various steps of fresh cycles performed in 2015 are shown.
Of 55,329 fresh cycles, 90.8% resulted in an egg retrievals, 68.6% in an embryo transfers, 18.2% in
a pregnancy and 11,7% in a live birth delivery.
Figure 4: Outcomes of ART using fresh cycles by stage of the treatment cycle, 2015.

16
2.2.2. What are the percentages of initiated cycles, retrievals and transfers that
result in pregnancies for fresh cycles?
When an ART treatment or procedure is applied using either not cryopreserved oocytes or embryos,
it can be defined “fresh cycle”, that includes:
In vitro fertilization (IVF): an ART procedure that involves extracorporeal fertilization;
Intra Cytoplasmic Sperm Injection (ICSI): a procedure in which a single spermatozoon
is injected into the oocyte cytoplasm.
(source: ICMART and WHO revised glossary on ART terminology, 2009)
Pregnancy rates per initiated cycle, per retrieval and per transfer are shown in Figure 5 (IVF and
ICSI 2015). Overall, the rates after IVF were significantly higher than following ICSI.
It should be noted that in most cases patients who underwent IVF may have had a better prognosis.
Figure 5: Pregnancy rates per initiated cycle, per retrieval and per transfer using IVF or ICSI
procedures, 2015.

17
2.2.3. What is the percentage of thawing cycles and transfers that result in
pregnancies for FER and FOR techniques?
An ART treatment in which are used cryopreserved oocytes or embryos, it can be defined
“frozen/thawing cycle”, that includes:
Frozen/thawed Embryo Replacement (FER): ART procedure in which cycle monitoring
is carried out with the intention of transferring a frozen/thawed embryo or embryos;
Frozen/thawed Oocyte Replacement (FOR): ART procedure in which cycle is carried out
with the intention of fertilizing thawed oocytes and performing embryo transfer.
(source: ICMART and WHO revised glossary on ART terminology, 2009)
In Figure 6 the pregnancy rate per thawing and per transfer using FER or FOR are shown. FER
rates were significantly higher than FOR ones.
Figure 6: Pregnancy rates per thawing cycle and per transfer using FER and FOR procedures, 2014.

18
2.2.4. What is the “Cumulative Pregnancy Rate”?
The cumulative pregnancy rate is the overall chance of obtain a pregnancy from all fresh and frozen
embryo transfers from one retrieval of eggs. To calculate the cumulative pregnancy rate (CPR),
individual instead of summary data collection would be needed. Unfortunately, IARTR as well as
other Registries around the world collects information only in aggregated form. To overcome these
limitations and calculate CPR using aggregated data, the number of pregnancy obtained either from
fresh and frozen cycles were divided by the number of initiated cycles, per year. CPR may provide a
broader view of pregnancies that are achieved in Italy, in a year of activity. Moreover, the
comparison of pregnancy rates from fresh cycles vs. cumulative pregnancy rates may show the
estimated added value of embryo and oocyte cryopreservation.
In Figure 7 pregnancy rate per fresh cycle and cumulative pregnancy rate by woman age groups are
shown. Overall, embryo and oocyte cryopreservation increased the chances of achieving a
pregnancy per initiated cycle, of about 36%.
Figure 7: Pregnancy rates per initiated cycle for fresh and Cumulative pregnancy rates per initiated cycle, by female patients age groups, 2015.

19
2.2.5. What is the gender distribution of infertility factors among ART users?
Figure 8 shows major causes of infertility among patients who had ART using fresh cycles in 2015.
Diagnoses range from one infertility factor in the patient or partner to multiple infertility factors in
either one or both members of the couple
- Female factor: Tubal factor - fallopian tubes are blocked or damaged, could prevent sperm from getting to the egg and
eggs from getting to the uterus
Ovulatory dysfunction - ovaries are not producing eggs normally. The ovaries develop many small
cysts instead of ripening and maturing one egg in each cycle.
Endometriosis - the presence of tissue similar to the uterine lining in abnormal locations. This
condition can affect both fertilization of the egg and embryo implantation.
Diminished ovarian reserve - the ability of the ovary to produce eggs is reduced. Reasons include
congenital, medical, or surgical causes or advanced age.
Multiple abortions - when there were two or more miscarriages without any full-term pregnancy.
Multiple factor, female - more than one female’s cause of infertility.
- Male factor - Low or no sperm counts, poor sperm motility , and abnormally-shaped sperm can all cause
infertility.
- Male and female factors - one or more female’s and male’s causes of infertility.
Genetic factor - Due to chromosomal abnormalities (numerical and/or structural) or to genetic
alterations. They can be both male and female factors
- Unexplained cause - no cause of infertility is found in either woman or man.
In Figure 8: Time-trends of gender distributions of infertility causes among patients who had ART
using fresh cycle, 2015.Total couples treated: 45,689

20
2.2.6. Is the use of ART increasing?
Figure 9 shows the number of cycle, retrievals, transfers performed, pregnancies obtained and
infants born using fresh cycles from 2005 to 2015.
The numbers of initiated cycles and pregnancies obtained increased by 67% and 62%, respectively,
over time. In details, from 33,203 cycles and 6,235 pregnancies in 2005 to 55,329 cycles and 10,081
pregnancies in 2015.
The number of infants born after fresh ART cycles in 2015 was 128% higher than in 2005.
However, data on infants must be considered with some caution because of pregnancy lost to
follow-up that varied from 40% in 2005 to 11.1% in 2014.
Figure 9: Time-trends of initiated cycles, retrievals, transfers, pregnancies and deliveries obtained from fresh cycles, 2005–2015.

21
2.2.7. Did the use of different ART procedures change over time?
Intra-cytoplasmic sperm injection (ICSI) was originally developed to improve fertilization rates in
couples with severe male factor infertility indication. Today, this procedure is widely used even
without a reported diagnosis of male factor infertility.
Figure 10 shows percentage of initiated cycles with fresh cycles (performed using ICSI and IVF
procedures), and thawing with FER and FOR from 2005 through 2015.
The number of ICSI cycles increased from 24,209 in 2005 to 47,344 in 2015, while IVF cycles
decreased from 8,994 to 7,985. Also FER thawing increased from 1,338 to 12,903, while FOR
procedures decreased from 2,711 to 1,529.
Figure 10: Time-trends of ART procedures, 2005-2015.

22
2.2.8. Did the use of FER procedures differ in Italy compared to other European
countries over time?
In 2004 the Italian Parliament approved a law (40/2004) regulating ART in which embryo
cryopreservation was banned. In 2009 Italian Constitutional Court removed some limitations set
out in the law, including the practice of embryo freezing, now permitted under specific
conditions. For this reason the use of FER has declined consistently after 2004 and resumed
steadily after 2009. As it shown in Figure 11 percentage of FER cycles performed increased
from 3.6% in 2005 to 18.5% in 2015. In comparison with some of the largest European
countries, Italy showed the lowest number of FER cycles performed
Figure 11: Time- trends of percentages of FER thawing on total ART initiated cycles in Europe, 2005-
2015.

23
2.2.9. Has the age of ART female patients changed over time?
Figure 12 shows the distribution of fresh cycles by women age groups, from 2005 to 2015.
For women older than 40 the percentage of fresh cycles performed increased from 20.7% in 2005 to
33.7% in 2015, whilst the percentage of fresh cycles performed in women ≤34 years old decreased
from 39.3% in 2005 to 27.8% in 2015. Overall, the mean age of women who had fresh cycles
increase from 35.3 to 36.7 years over time.
Figure 12: Time-trends of fresh initiated cycles distributions by age classes of female patients, 2005-2015.
Figures 13 and 14 (on the next page) show the distributions of the initiated cycles (thawing) with
embryo (FER) and oocyte (FOR) frozen/thawing techniques according to the age groups of the
patients at the time of freezing, from 2009 (when IARTR start of collecting this data) to 2015
For cycles started with FER (Figure 13) is observed a slight decrease in the mean age of patients
from 35.4 in 2014 to 35.2 years in 2015. Patients with less than 35 years increased (+ 2.2%), while
the percentage of patients between 35 and 39 years (-0.7%) and those in patients over 40 years (-
1.5%) decreased. Regarding the cycles started with FOR (Figure 14), there is an increase of
patients over 40 years (+ 1.2%) compared to 2014. The percentage of patients between 35 and 39
years (-0.8%) and those with less than 35 years (-0.3%) slightly decreased. The average age grew
slightly to 35.2 years.

24
Figure 13: Time-trends of FER thawing cycles distributions by age classes of female patients, 2009-
2015.
Figure 14: Trends of FOR thawing cycles distributions by age classes of female patients, 2009-2015.

25
2.2.10. Has the number of embryos transferred changed in fresh cycles?
Figure 15 shows trends with the number of embryos transferred in fresh cycles.
From 2005 to 2015 the transfer with one and two embryos increased from 18.7% and 30.9% to
28.8% and 48.3%, respectively. On the other hand transfers with 3 embryos dramatically decreased
from 50.4%, first to 38.1% in 2010 to reach the 21% in 2015. As it shown in the figure, this trend
begin from the end of 2009 when law 40/2004 was changed, and the limit to transfer maximum
three embryos removed. Values of transfers with four or more embryos were quite stable during
time, from 2.6% in 2009 to 1.9% in 2015. The average number of embryos transferred decreased
from 2.3 embryos per transfer in 2005 to less than 2 in 2015.
Figure 15: Time-trends of transfer by number of embryos transferred, 2005-2015.
*year of the Constitutional Court sentence 151/2009.

26
2.2.11. Did pregnancy rates per transfer changed over time among different
ART procedures ?
Figure 16 shows pregnancy rates per transfer in order to compare cycles with fresh oocytes vs.
those using frozen embryos (FER) or frozen oocytes (FOR).
Overall, FER cycles showed the best pregnancy rates increasing highly from 16.3% in 2005 to
28.5% in 2015, those with fresh oocytes slightly increased from 24.3% to 26.5%, and those with
frozen oocytes from 11.4% to 20.8%.
Figure 16:Time-tTrends of pregnancy rate per transfer for fresh, thawed embryos (FER) and thawed/warmed oocytes cycles (FOR), 2005-2015.

27
2.2.12. Did cumulative pregnancy rates per initiated cycle changed over time?
Figure 17 compares the percentage of pregnancies obtained on fresh initiated cycles with the
Cumulative Pregnancy Rate over time. As described in chapter 2.2.4, CPR is presented as the sum
of pregnancies obtained from fresh cycles and with frozen/thawing cycles (FER and FOR) as
nominator and the number of initiated cycles with fresh techniques of the same year as
denominator. CPR gives an estimate of the likelihood of obtain a pregnancy for a woman
undergoing an ART cycle, also having the opportunity to perform oocyte and/or embryo thawing
cycles. Moreover, the comparison of pregnancy rate from fresh cycles vs. CPR may show the
estimated added value of embryo and oocyte cryopreservation. As the Figure 14B show this value
is constantly growing from +7.2% in 2005 to a 36.2% in 2015
Figure 17: Time-trends of pregnancy rate per initiated cycle for fresh and cumulative pregnancy rate per initiated cycle, 2005-2015.

28
2.2.13. Did pregnancy rates per retrieval change over time among different
female age groups?
Figure 18 shows pregnancy rates per retrieval according to women age groups, after fresh cycles.
From 2005 to 2015 pregnancy rates per retrieval decreased from 28.2% to 27.5% for women aged
less than 34, while they increased from 19.8% to 21.8% for women aged 35-39, from 11.0% to
13.0% for women aged over 40-42 and from 5.3% to 7.4% in women aged more than 42 years.
Figure 18:Time-trends of pregnancy rates per retrievals with fresh cycles by age groups of female patients, 2005-2015.

29
2.2.14. Does the risk of pregnancy loss differ among women of different age
groups?
Increasing female age also increases the risk of negative pregnancy outcomes (spontaneous or
therapeutic abortions and ectopic pregnancies). As it is shown in Figure 19 rates in older age
groups were much higher. Rates decreased over time from 65.2% to 53.5% for women older than
43 years old and from 42.5% to 39.6% for women aged 40-42. Rates for the age classes younger
than 40 were quite stable from 2009 to 2014.
Figure 19: Time-trends of percentages of total pregnancy loss using ART cycles by female age groups, 2009-2015.

30
2.3. ART donor cycles.
In April 2014 Italian Constitutional Court removed the prohibition, set out in the law, regarding the
practice of ART techniques using donor gametes, now permitted under specific conditions.
For more detailed data on activity and outcomes regarding ART donor cycles, please check on
Summary table for 2015 (on page 42).
2.3.1. Which gametes were used in ART donor cycles in 2015?
Figure 20 shows the distribution of types of ART cycles using donor gametes applied in Italy in
2015. In about 57% of ART donor cycles, fresh or frozen eggs were used. In almost 24% of cycles
there was a sperm donation. More than 18% of cycles were performed using cryopreserved embryos
obtained from donation of a gamete.
Figure 20: Distribution of all ART cycles using donor gametes or cryopreserved embryos after
donation, 2015. Total cycles = 2.287.

31
2.3.2. What is the age of recipient female patients in ART donor cycles in 2015?
Figure 21 shows the distribution of transfers performed according to the recipient female age group
at the start of a cycle performed with a gamete donation. The different distribution by age
depending on the different types of gametes and embryos used reflects the indication of the
treatment of the technique itself.
Figure 21: Distribution of transfers cycles using donor gametes or cryopreserved embryos after
donation by recipient female age groups, 2015.

32
2.3.3. What is the percentage of initiated cycles and transfer that result in
pregnancies in ART donor cycles in 2015?
In Figure 22 the pregnancy rate per initiated cycle and per transfer in ART donor techniques are
shown. Highest rates are obtained in ART donor cycles with the utilization of fresh egg.
Figure 22: Distribution of pregnancy rate per initiated cycle and per transfer using donor gametes or
cryopreserved embryos after donation, 2015.

33
3. INDICATORS OF ART SAFETY

34
3.1.1. Did the percentages of singletons, twins and triplets- or- more deliveries
for fresh cycles change over time?
Figure 23 shows trends for singleton and triplet deliveries in fresh cycles.
From 2005 to 2015 twin delivery rates decreased from 21.6% to 17.3% while numbers of triplets
and more deliveries decreased from 2.7% to 0.8%, similar to the 0.6% average value in Europe, as
reported in 2012 EIM data. We must remember that from 2004 till 2009 the Law obliged to transfer
at once, all the embryos created for a maximum of 3.
Figure 23: Time-trends of multiplicity of deliveries from fresh cycles, 2005-2015.

35
3.1.2. Did the percentages of preterm live babies change over time?
Figure 24 shows trends of ART preterm live born babies that are highly correlated with the
multiplicity of deliveries.
The percentage of preterm live babies in singleton deliveries are quite stable during all the period.
Otherwise in twins and triplets deliveries there is a variability from year to year, but overall the
trend is downwards for twins, from 49% in 2005 to 44.6% in 2015 and upwards for triplets from
82.7% in 2005 to 93.3% in 2015.
Figure 24. Time-trends of percentage of preterm ART live born babies (<37 week of gestation) by
multiplicity of deliveries, 2005-2015.

36
3.1.3. Did the percentage of underweight live babies change over time?
Figure 25 shows the trends of ART live born babies underweight that are highly correlated with the
multiplicity of deliveries as already described in respect to prematurity.
In babies born underweight, the percentage in singleton deliveries are quite stable during all the
period. Overall the trend is also quite stable for both twins and triplets and more deliveries, from
52.2% in 2005 to 51.7% in 2014 and from 90% in 2005 to 93.3% in 2015 respectively.
Figure 25. Time-trends of percentage of ART live born babies underweight (<2,500 gr) by multiplicity
of deliveries, 2005-2015.

37
4. IUI PROCEDURES

38
4.1.Access to IUI service
In Figure 26 the regional distribution of centers performing IUI are represented.
The largest number of the centers is concentrated in Norther Italy (172, 47% of the total) and then
in the South (123 centers, 33.6% of the total), irrespective of the amount of activity they have
carried out.
Figure 26: Regional distribution of IUI + ART active centers, 2015. Total = 366

39
As shown in Table 3, in 2015 there were 366 centers that have performed IUI of which only 138
operating within the National Health System (public and private 37.7%) and 228 providing private
service (62.3%).
Most of public centers that performs IUI in Italy were in North: 68 out of 114 centers (59.6%).
Table 3: IUI centers distribution by region and type of service, 2015.
Region and Geographical Area Total
Type of Service
Public Private covered by
NHS Private
N % N % N %
Piemonte 27 11 40,7 1 3,7 15 55,6
Valle d'Aosta 1 1 100 0 - 0 -
Lombardia 64 20 31,3 11 17,2 33 51,6
Liguria 9 4 44,4 0 - 5 55,6
Northwest 101 36 35,6 12 11,9 53 52,5
P.A. Bolzano 5 4 80,0 0 - 1 20,0
P.A. Trento 1 1 100 0 - 0 -
Veneto 38 14 36,8 2 5,3 22 57,9
Friuli Venezia Giulia 5 3 60,0 1 20,0 1 20,0
Emilia Romagna 22 10 45,5 0 - 12 54,5
Northeast 71 32 45,1 3 4,2 36 50,7
Toscana 22 7 31,8 6 27,3 9 40,9
Umbria 2 1 50,0 0 - 1 50,0
Marche 5 2 40,0 0 - 3 60,0
Lazio 42 7 16,7 3 7,1 32 76,2
Central 71 17 23,9 9 12,7 45 63,4
Abruzzo 5 3 60,0 0 - 2 40,0
Molise 2 0 - 0 - 2 100
Campania 44 9 20,5 0 - 35 79,5
Puglia 14 3 21,4 0 - 11 78,6
Basilicata 2 2 100 0 - 0 -
Calabria 9 1 11,1 0 - 8 88,9
Sicilia 44 8 18,2 0 - 36 81,8
Sardegna 3 3 100 0 - 0 -
South and Islands 123 29 23,6 0 - 94 76,4
Italy 366 114 31,1 24 6,6 228 62,3
40
4.2. Efficacy and safety of IUI and trends
4.2.1. Is the use of IUI-H increasing?
Intrauterine insemination (IUI) is a medical procedure in which a sperm sample is deposited directly
into the women’s uterus to achieve a fertilization and then a pregnancy. It can be performed using
husband semen (IUI-Homologous) or with the semen of an anonymous donor (IUI-Donor).
As described for ART techniques using donor gametes (on page 27) the IUI-D procedures was
permitted only after the sentence of the Italian Constitutional Court in April 2014. For the activity
of IUI-D in 2015, please check on Summary table for 2015 (on page 42) for more detailed data.
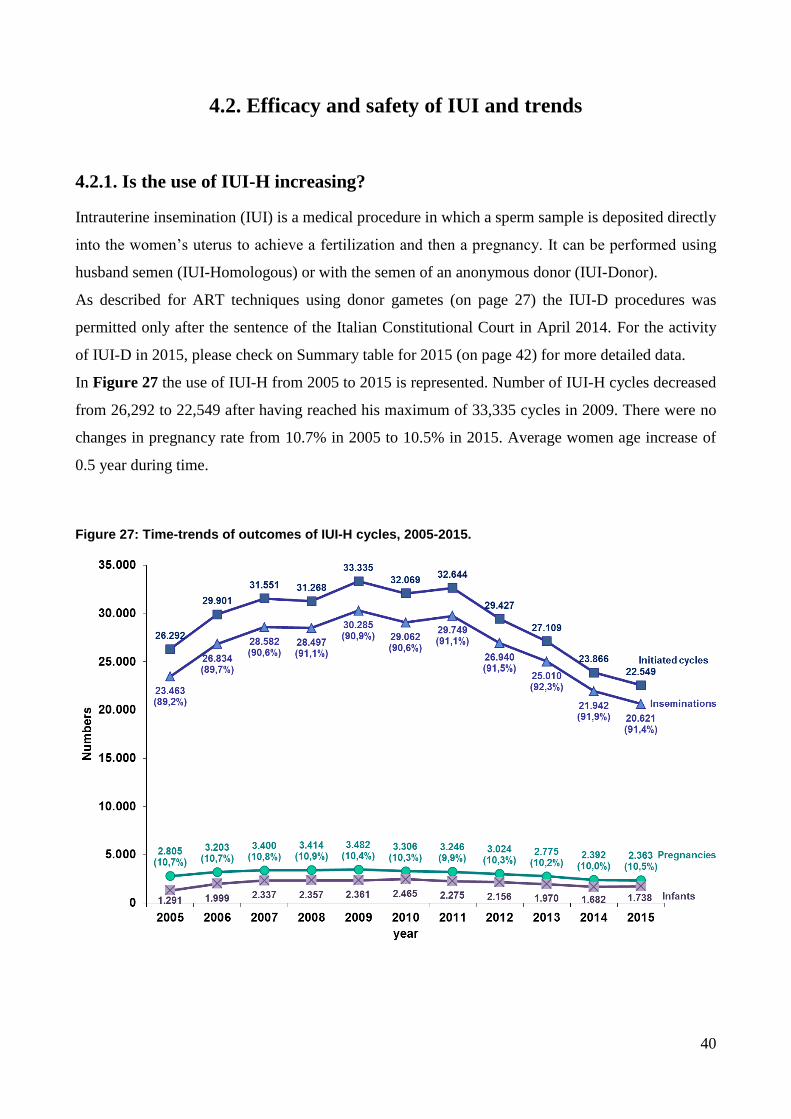
In Figure 27 the use of IUI-H from 2005 to 2015 is represented. Number of IUI-H cycles decreased
from 26,292 to 22,549 after having reached his maximum of 33,335 cycles in 2009. There were no
changes in pregnancy rate from 10.7% in 2005 to 10.5% in 2015. Average women age increase of
0.5 year during time.
Figure 27: Time-trends of outcomes of IUI-H cycles, 2005-2015.

41
4.2.2. Do percentages of IUI-H cycles resulting in pregnancy, differ among
women of different age groups?
Figure 28 shows percentages of initiated cycles and insemination for IUI-H that resulted in
pregnancies among women of different age groups.
The probability to obtain a pregnancy and to reach a delivery in an IUI-H treatment is highly related
to the age of women. Numbers in older women are very small: in over 43 it is 3.4% for pregnancy
and 1.2% for delivery.
Figure 28: Pregnancy rates and delivery rates per insemination for H-IUI cycles by age groups of
female patients, 2015.
42
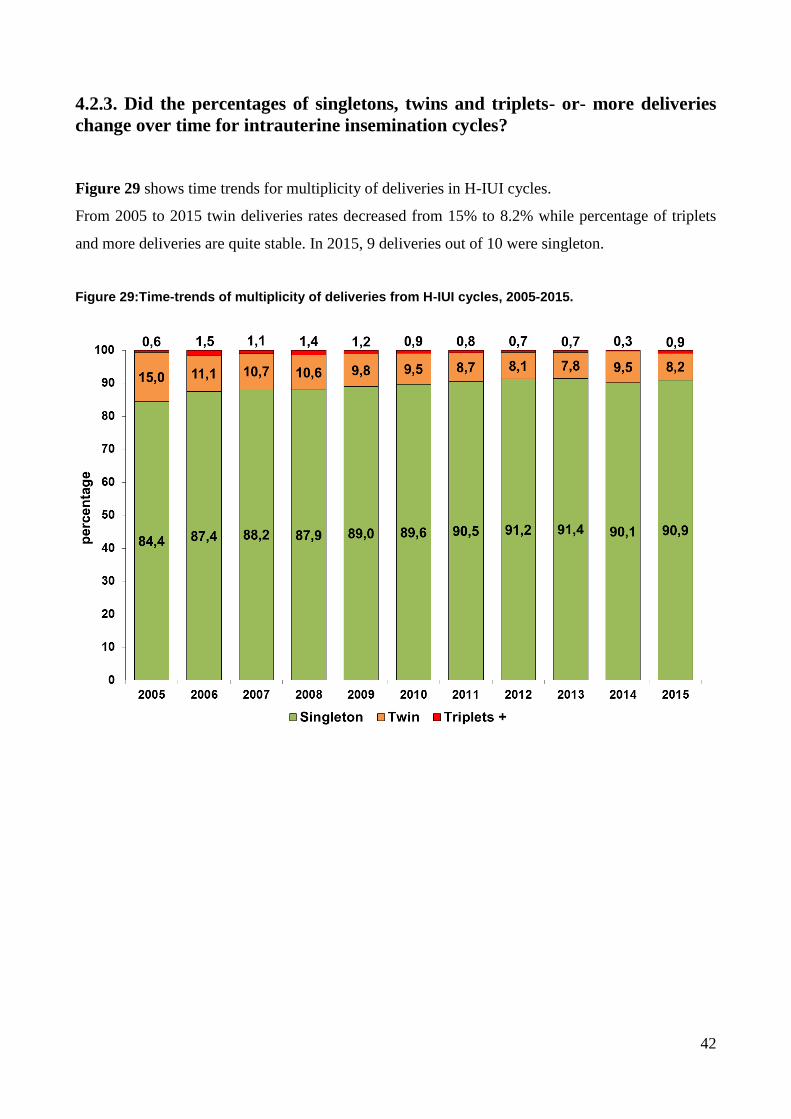
4.2.3. Did the percentages of singletons, twins and triplets- or- more deliveries
change over time for intrauterine insemination cycles?
Figure 29 shows time trends for multiplicity of deliveries in H-IUI cycles.
From 2005 to 2015 twin deliveries rates decreased from 15% to 8.2% while percentage of triplets
and more deliveries are quite stable. In 2015, 9 deliveries out of 10 were singleton.
Figure 29:Time-trends of multiplicity of deliveries from H-IUI cycles, 2005-2015.

43
4.3. IUI donor cycles.
4.3.1. What is the outcome in IUI donor cycles in 2015?
In total, 20.1% of the 513 initiated cycles using donor sperm in IUI cycle started in 2015 resulted in
a clinical pregnancy and 11.9% has resulted in a delivery. However most of these cycles (about
80%) did not produce a pregnancy while a small proportion (2.1%) resulted in a pregnancy loss (i.e.
ectopic pregnancy or miscarriage or therapeutic abortion).
Figure 30: Outcome of D-IUI cycles, 2015 (513 initiated cycles)

44
APPENDIX. SUMMARY TABLE OF ACTIVITY
AND OUTCOMES OF ART PROCEDURES,
YEARS 2010 – 2015

45
Summary table of activity and outcomes of all
procedures, 2010 – 2015
2010 2011 2012 2013 2014* 2015*
N° Clinics 357 354 355 369 362 366
% of clinics reporting data to ISS 100 100 100 100 100 100
ALL PROCEDURES (H-IUI, D-IUI, ART-Non donor and ART-Donor)
N° Patients 69,797 73,570 72,543 71,741 70,826 74,292
N° Initiated cycles 90,944 96,427 93,634 91,556 90,957 95,110
N° Live born 12,506 11,933 11,974 12,187 12,720 12,836
H-IUI and D-IUI activity
N° Patients 19,707 20,012 18,085 17,218 14,967 14,545
N° Initiated cycles 32,069 32,644 29,427 27,109 23,903 23,062
N° Pregnancies 3,306 3,246 3,024 2,775 2,399 2,466
% Pregnancy Rate per cycle 10.3 9.9 10.3 10.2 10.0 10.7
% Pregnancies lost to follow-up 15.5 18.1 17.1 16.8 18.2 16.8
N° Deliveries 2,220 2,062 1,974 1,810 1,530 1,649
N° Live born 2,465 2,275 2,156 1,970 1,683 1,807
ART activity (Fresh-non donor, Thawing-non donor, donor)
N° Patients 50,090 53,558 54,458 54,523 55,859 59,747
N° Initiated cycles 58,875 63,783 64,207 64,447 67,054 72,048
N° Pregnancies 11,968 12,221 12,646 12,775 13,642 14,391
Cumulative Pregnancy Rate per couple treated with fresh cycle
27.0 26.3 27.2 27.5 29.7 31.5
% Pregnancies lost to follow-up 10.2 12.2 13.2 10.3 10.8 11.3
N° Deliveries 8,167 8,003 8,127 8,495 9,252 9,512
N° Live born 10,041 9,658 9,818 10,217 11,037 11,029
INDICATORS OF THE AVALIABILITY OF SERVICES
ART Initiated cycles per 1 million women aged 15 and 45
4,809 5,293 5,562 5,601 5,860 6,341
ART Initiated cycles per 1 million inhabitants
973 1,050 1,078 1,070 1,103 1,175

46
2010 2011 2012 2013 2014* 2015*
ONLY FRESH CYCLES (Non Donor)
N° Patients 44,365 46,491 46,491 46,433 45,985 45,689
N° Initiated cycles 52,676 56,092 55,505 55,050 55,705 55,329
Average age calculated 36.34 36.48 36.50 36.55 36.68 36.68
N° Pregnancies 10,988 10,959 11,077 10,712 10,834 10,081
% Pregnancies rate per cycles 20.9 19.5 20.0 19.5 19.4 18.2
% Pregnancies rate per aspirations 23.2 21.6 22.1 21.3 21.3 20.1
% Pregnancies rate per transfers 27.2 25.9 26.5 26.3 27.2 26.5
% Twin Pregnancies 20.2 18.8 18.9 19.4 19.5 17.0
% Triplet or more Pregnancies 2.3 1.8 1.8 1.6 1.4 0.9
% Pregnancies lost to follow-up 10.8 12.7 13.9 10.9 11.9 13.1
N° Deliveries 7,512 7,193 7,116 7,125 7,277 6,498
N° Live born 9,286 8,734 8,680 8,677 8,848 7,695
ONLY THAWING CYCLES (Non Donor)
N° Patients 5,725 7,067 7,967 8,090 9,669 11,975
N° Initiated cycles 6,199 7,691 8,702 9,397 11,140 14,432
N° Pregnancies 980 1,262 1,569 2,063 2,721 3,633
% Pregnancies lost to follow-up 4.3 7.8 8.0 6.9 5.7 5.6
N° Deliveries 655 810 1,011 1,370 1,926 2,573
N° Live born 755 924 1,138 1,540 2,128 2,802

47
Summary table of activity and outcomes of procedures with
gamete/embryo donation, 2014-2015
Donor activity
2014 2015
ART-Donor activity
N° clinics reporting data (with at least 1 patients treated)
17 69
N° Patients 205 2,083
N° Initiated cycles 209 2,287
N° Pregnancies 87 677
% Pregnancies lost to follow-up 26.4 15.7
N° Deliveries 49 441
N° Live born 61 532
IUI-D activity (sperm donation)
N° clinics reporting data (with at least 1 patients treated)
13 52
N° Patients 32 379
N° Initiated cycles 37 513
N° Pregnancies 7 103
% Pregnancies rate per cycles 18.9 20.1
N° lost to follow-up pregnancies 6 31
N° Deliveries 1 61
N° Live born 1 69