experiences tracking agile projects: an empirical study · danilo sato, dairton bassi, mariana...
TRANSCRIPT
Experiences Tracking AgileProjects: an Empirical Study
Danilo Sato, Dairton Bassi, Mariana Bravo, Alfredo Goldman& Fabio Kon
Department of Computer ScienceUniversity of São Paulo
Rua do Matão, 1010Phone: +55 (11) 30916134 (FAX)
Zip 05508-090 - São Paulo - SP - BRAZIL{dtsato | dairton | marivb | gold | kon}@ime.usp.br
AbstractIn this article, we gather results from several projects
we conducted recently that use some kind of agile method.We analyze both academic and governmental software de-velopment projects, some of them using agile methodssince the beginning and others in which agile methodswere introduced afterwards. Our main goals are to clas-sify the different projects, and to analyze the collecteddata and discover which metrics are best suited to sup-port tracking an agile project.
We use both quantitative and qualitative methods, ob-taining data from the source code, from the code repos-itory, and from the feedback received from surveys andinterviews held with the team members. We use variouskinds of metrics such as lines of code, number of tests, cy-clomatic complexity, number of commits, as well as com-binations of these.
In this article, we describe in detail the projects, themetrics, the obtained results, and their analysis from ourmain goals standpoint, providing guidelines for the use ofmetrics to track an agile software development project.
Keywords: Agile Methods, Extreme Programming,Software Engineering, Tracking
1. INTRODUCTIONAgile Methods are becoming more popular since Ex-
treme Programming was introduced by Kent Beck in1999 [3]. Agile Methods propose a new way of look-ing into software development, focusing the attention onthe interactions between people collaborating to achievehigh productivity, delivering high-quality software. Theapproach to obtain these results is based on a set of simplepractices that provide enough feedback to enable the team
to know where they are and to find the best way to movetowards an environment of continuous improvement.
One of the practices that enable the creation of suchenvironment is calledtracking. Kent Beck describes therole of a tracker in an XP team as someone responsiblefor frequently gathering metrics with data provided fromthe team members and for making sure that the team isaware of what was actually measured [3, 4]. These met-rics should be used as guidelines for improvement and topoint out, to the team, any current problems. It is notan easy task to decide which information to collect andpresent to the team and how to present it. Moreover, someof the development problems are not easily recognizablefrom quantitative data alone.
We have been experimenting with various trackingmethods since early 2002 obtaining good results in differ-ent kinds of projects. In this article, we describe an empir-ical case study we conducted on seven of these projects,gathering and analyzing data from both academic and in-dustrial environments.
We use both quantitative and qualitative metrics, col-lecting data from different sources, such as the sourcecode, the code repository, and subjective feedback re-ceived from surveys and interviews held with team mem-bers. The qualitative metrics were gathered at the end ofthe first semester of 2006, while the quantitative metricswere retroactively collected from the source code reposi-tory and from the XPlanner agile management tool. Dueto the empirical and observational nature of our study weclassify it asparallel/simultaneous[39] as both types ofmetrics were gathered at the same time.
In this study, we are not comparing agile and non-agileprojects. Our main goals are:
• to classify the projects according to the XP Evalua-
Danilo Sato, Dairton Bassi, Mariana Bravo,Alfredo Goldman and Fabio Kon
Experiences Tracking Agile Projects: anEmpirical Study
tion Framework (described in Section 3), and
• to analyze the collected data and discover whichmetrics are best suited to support tracking an agileproject.
The remainder of this article is organized as follows.Section 2 provides an overview of Agile Methods fo-cusing on Extreme Programming and presenting our ap-proach. Section 3 describes seven software developmentprojects analyzed in this article. Section 4 presents themethods that we used to collect data and the metrics cho-sen to be analyzed. Section 5 analyzes our empirical re-sults and provide some new metrics to support thetrackerof an agile project. Finally, we conclude in Section 6 pro-viding guidelines for future work.
2. AGILE M ETHODSIn the last few years, Agile Methods for software de-
velopment have gained importance in many segments ofthe software industry. Like conventional methods, thegoal of Agile Methods is to build high quality softwarethat meets users needs. The main difference betweenthem lies in the means to achieve this goal, that is, in theprinciples used.
In software development, requirements for a projectoften change while implementation is still in progress.Kajko-Mattson et al. shows that the percentage of soft-ware lifecycle cost due to maintenance ranges between 40and 90% [23]. Many companies and development teamsconsider changes undesirable because they break previousplans. However, requirements are likely to change as thecustomer sees the system after it is deployed and it is notfeasible to make an initial plan that foresees such changeswithout having to spend too much time and money.
With Agile Methods, more value is given to practicalaspects. Detailed plans are made only for the current de-velopment stage, and draft plans are created for the nextphases in such a way that they can be adapted to changeswhen the time comes to detail and execute them. TheManifesto for Agile Software Development [5] definesthe essential principles of Agile Methods and highlightsthe differences between agile and conventional methodsby valuing:
• Individuals and interactions over processes andtools.
• Working software over comprehensive documenta-tion.
• Customer collaborationover contract negotiation.
• Responding to changeover following a plan.
These characteristics bring dynamism to develop-ment, motivation to the team, and more comprehensiveinformation about the real situation of the project for thecustomer. Some conventional methods claim to be pre-dictive. In contrast, Agile Methods are adaptive. This ap-proach is fundamental for the success of most projects be-cause requirements change as the customer needs change.
There are several Agile Methods based on the prin-ciples proposed by the Agile Manifesto, including: Ex-treme Programming (XP) [3, 4], Scrum [35], CrystalMethods [11], Lean Software Development [33], Fea-ture Driven Development (FDD) [32], Adaptive Soft-ware Development [20], and Dynamic System Develop-ment Method (DSDM) [37]. They are used in small,medium, and large companies, universities, and govern-mental agencies to build different types of software andhave produced excellent results extensively described inthe literature [8, 15, 27, 28, 31].
2.1. EXTREME PROGRAMMING
The most well-known Agile Method is Extreme Pro-gramming (XP) [3, 4]. It was developed by Kent Beckafter many years of experience in software development.He defined a set of values and practices that improve theproductivity of a software development team and the qual-ity of their work.
XP is based in five main values: Communication,Simplicity, Courage, Feedback, and Respect. XP valuesare translated to the team as a set of practices that shouldbe followed during development. The practices proposedinitially [3] are briefly described below.
Planning Game: In the beginning of the project, cus-tomers write story cards that describe the requirements.During the Planning Game, programmers and customerscollaborate to select a subset of the most valuable stories:programmers provide estimates for each story while cus-tomers define the business value of each story. The deci-sions made at this stage are just an initial plan. Changesare welcome to be incorporated into the plan as the iter-ation and release progresses. The Planning Game hap-pens at two levels: in the beginning of a release and in thebeginning of each iteration. A release is composed of aseries of iterations. At the end of each iteration a subsetof the release stories should be implemented, producing adeployable candidate version of the system.
Small Releases: The team must implement and de-liver small pieces of working software frequently. The setof story cards selected during the Planning Game shouldcontain just enough functionality, so that the customer pri-orities as well as the developers estimates are respected.The iteration length should be constant throughout theproject, lasting one to three weeks. This is the heart beatof the project and provides constant feedback to the cus-tomer and to the team. Programmers should not try to
46
Danilo Sato, Dairton Bassi, Mariana Bravo,Alfredo Goldman and Fabio Kon
Experiences Tracking Agile Projects: anEmpirical Study
anticipate requirements, i.e., they should never add un-necessary flexibility to complete their current task. XPcoaches often say: “do the simplest thing that could pos-sibly work”.
Simple Design: Simplicity is a key concept that al-lows a system to respond to changes. To minimize thecost of design changes one should always implement thesimplest – but not the most simplistic – design, with onlythe minimum level of complexity and flexibility needed tomeet the current business needs. As development is incre-mental, new functionalities will be added later so improv-ing the design through refactoring is always necessary.
Pair Programming: Developers work in pairs to per-form their programming tasks. This promotes collectiveand collaborative work, brings the team together, and im-proves communication and code quality. Pairs shouldswitch frequently, even several times a day. Generally,the selection of pairs depends on the task, the availabilityof programmers, and the expertise of each one. The goalis to spread the knowledge of the whole system to all teammembers.
Testing: The software is constantly verified by a set ofautomated tests written by programmers and customers.The development team writes unit tests for all systemcomponents and runs them many times a day to assurethat recently-added functionalities do not break existingcode. Customers write acceptance tests to assure the sys-tem does exactly what they want. These tests are executedwhenever a new functionality is finished and determinewhen a story card is completed. They can be written bya programmer pairing with the customer if he lacks thetechnical knowledge to do it.
Refactoring: Refactoring is a systematic techniquefor restructuring existing source code, altering its inter-nal structure without changing its external behavior [14].Among the most common refactorings we can mentionthe removal of duplicated code, the simplification of asoftware architecture, and the renaming of elements suchas classes, methods, and variables to make the code easierto understand. The goals are always to make the sourcecode more readable, simpler, cleaner, and more preparedto accommodate changes.
Continuous Integration: The source code must bekept in a shared repository and every time a task is com-pleted, the new code must be built, tested, and, if cor-rect, integrated into the repository. Developers upload anddownload code from the repository several times a day soall team members work with an up to date, synchronizedversion of all of the code.
Collective Code Ownership: There is no concept ofindividual ownership of code. The code base is owned bythe entire team and anyone may make changes anywhere.If a pair of programmers identify a good opportunity tosimplify any piece of code or remove duplication, they
should do it immediately without having to ask permis-sion for the original writer. With Collective Code Own-ership the team members have a broad view of the entiresystem, making small and large refactorings easier.
Sustainable Pace: The working rhythm should notaffect the participant’s health or their personal lives. Dur-ing planning, the amount of hours dedicated to the projectmust be defined realistically. It is acceptable for the teamto work overtime in rare occasions. But an extensive andrecurrent overload of work will reduce code quality andlead to great losses in the long run.
On-site Customer: The team must be composed ofa variety of people with a broad knowledge and experi-ence across the necessary skills for the project to succeed.This must include a business representative – called thecustomer– who understands the business needs and hasenough knowledge about the real users of the system. Thecustomer is responsible for writing stories, setting pri-orities, and answering any doubts that the programmersmight have.
Metaphor: All members of the project, including pro-grammers and customers, should find a common languageto talk about the system. This language should be equallyunderstood by technical people and business people. Thiscan be achieved by adopting a metaphor that relates sys-tem abstractions to real-world objects in a certain domain.This may be the most difficult practice to introduce inan inexperienced team because it is directly related tocommunication and to how comprehensive people will bewhen they share their ideas and wishes.
Coding Standards: Before starting to code, all pro-grammers must agree upon a set of standards to be usedwhen writing source code. It makes the source easierto understand, improves communication, and facilitatesrefactoring.
After some time, practitioners realized that applyingall the practices “by the book” without considering theprinciples and values behind them was not always an ef-fective approach. After all, Agile Methods should beadaptive rather than prescriptive. This observation led tothe creation of a new practice, called“Fix XP when itbreaks”, meaning that each team has to consider the ag-ile principles and values and adapt the practices for theirspecific environment. Thus, XP practices should not beseen as dogmas, but rather as guidelines for organizingthe behavior of a team and a basis for continuous reflec-tion.
There are also two special roles in an XP team,that can be reassigned to different developers during thecourse of the project:
• Coach: Usually the most experienced programmer,who is responsible for verifying whether the teammembers are following the proposed practices and
47

Danilo Sato, Dairton Bassi, Mariana Bravo,Alfredo Goldman and Fabio Kon
Experiences Tracking Agile Projects: anEmpirical Study
ensuring that the methodology is being followed.
• Tracker : Jeffries [21] describe the role of atrackeras the developer responsible for providing informa-tion about the project progress through the use ofappropriate metrics. Thetracker is responsible forcreating charts and posters to show points of im-provement, regularly spreading this information inthe walls, what Cockburn callsinformation radia-tors [10].
2.2. EXTREME PROGRAMMING - SECOND EDITION
In 2004, Kent Beck published with his wife, CynthiaAndres, the second edition of the book that first intro-duced XP [4] five years before. The book was restruc-tured in a more inclusive way, focusing on the importanceof the XP values. While the first edition was focusedon ‘what’ XP was, the second edition talks a lot moreabout the ‘why’ of XP, introducing principles that helpstranslate values into practices, tailoring the process to aproject’s specific needs. The fourteen principles proposedin the second edition are: humanity, economics, mutualbenefit, self-similarity, improvement, diversity, reflection,flow, opportunity, redundancy, failure, quality, baby steps,and accepted responsibility.
As discussed in Section 2.1, teams that started imple-menting XP usually ended up using new or changing theoriginal practices. In the second edition of the book, KentBeck breaks down the 12 original practices into two cat-egories:primary practicesare useful independent of thecontext of the project, whilecorollary practicesare likelyto be difficult without previous experience with thepri-mary practices. The full description of each practice andprinciple is out of the scope of this article, but the nextparagraph provides a list of the new practices and Table 1compares the original practices with their new correspon-dent.
The thirteenprimary practicesare: Sit Together,Whole Team, Informative Workspace, EnergizedWork , Pair Programming, Stories, Weekly Cycle,Quarterly Cycle, Slack, Ten-Minute Build , Contin-uous Integration, Test-First Programming, and In-cremental Design. The elevencorollary practicesare:Real Customer Involvement, Incremental Deploy-ment, Team Continuity, Shrinking Teams, Root-CauseAnalysis, Shared Code, Code and Tests, Single CodeBase, Daily Deployment, Negotiated Scope Contract,andPay-Per-Use.
1The following practices did not change and were not includedin the ta-ble: Pair Programming, Continuous Integration, andTest-First Pro-gramming
Comparison table between XP practices1
First Edition Second EditionPlanning Game Stories, Weekly Cycle,
Quarterly Cycle, and SlackSmall Releases Weekly Cycle, Incremental
Deployment, Daily Deploy-ment
Simple Design Incremental DesignRefactoring Incremental DesignCollective Code Ownership Shared Code, Single Code
BaseSustainable Pace Energized Work, SlackOn-site Customer Whole Team, Real Customer
InvolvementMetaphor (Incremental Design)Coding Standards (Shared Code)
Table 1. Comparison between XP practices from the first and secondedition
2.3. OUR APPROACH
Our approach is mostly based on XP practices. Inmost of the projects described in Section 3, we used allXP practices. The last practice,“Fix XP when it breaks”was necessary in a few cases, requiring small adaptationsto maintain all values balanced. To attain higher levelsof communication and feedback, we used frequently twoother well known agile practices:Stand-Up Meetingsand Retrospectives(also known asReflection Work-shops). The former consists of a daily, informal and shortmeeting at the beginning of the work day when each de-veloper comments on three topics: what he did yesterday,what he intends to do today, and any problems that hemight be facing (that will be discussed later). In theseshort meetings, all participants stand up to ensure it doesnot take too long.
Retrospectives are meetings held at the end of each it-eration where the development method is evaluated, theteam highlights lessons learned from the experience, andplan for changes in the next development cycle [24].Kerth, on his prime directive of retrospectives says [24]:
“Regardless of what we discover, we under-stand and truly believe that everyone did thebest job they could, given what they knew atthe time, their skills and abilities, the resourcesavailable, and the situation at hand.”
There are many formats for Reflection Workshops, butthe most usual is a meeting where the entire team dis-cusses about “what worked well?”, “what we should dodifferently?”, and “what puzzles us?”. Normally, at theend of a workshop the team builds up a series of actions in
48
Danilo Sato, Dairton Bassi, Mariana Bravo,Alfredo Goldman and Fabio Kon
Experiences Tracking Agile Projects: anEmpirical Study
each of those categories which they will prioritize and se-lect from to implement in the next iteration. These actionsare captured in a poster, which is posted in the workspace.
The projects described in this article were often com-posed of inexperienced teams on Agile Methods andsometimes they even did not have enough previousknowledge about the technologies, frameworks, and toolsused to build the system. In this sense, they representalmost a worst-case scenario for deploying agile meth-ods. An extreme difference between the team membersexpertise could harm their productivity [40]. In our ap-proach, in order to reduce large technical differences, weintroduced an extra phase at the beginning of the project:Training . During this phase, we tried to equalize theteam members expertise by providing training classes forspecific technologies, tools, frameworks, and agile prac-tices that would be used during the implementation. Thetraining was structured in classes that took about 10 to 20hours, composed of presentations followed by practicalexercises. It was not intended to be complete or to coveradvanced topics, but to create a minimum common tech-nical ground for the whole team from which they couldimprove.
3. PROJECTS
In this article, we analyze seven software developmentprojects. Five of them were conducted in the academiain a full-semester course on Extreme Programming [16],and two of them were conducted in a governmental insti-tution, the São Paulo State Legislative Body (ALESP).In this section, we describe the characteristics of eachproject with details about the environment, the team, aswell as context and technological factors.
3.1. FORMAT OF PRESENTATION
All of the projects, except for the last one, werefaithful to most XP practices, so we describe them interms of the Extreme Programming Evaluation Frame-work (XP-EF) and its subcategories [41, 42]. The frame-work records the context of the case study, the extent towhich the XP practices were adopted, and the result ofthis adoption. The XP-EF is composed of three parts:XP Context Factors (XP-cf), XP Adherence Metrics (XP-am), and XP Outcome Measures (XP-om).
XP-cf and XP-om are described in this section. XP-am were qualitatively collected by a subjective survey,constructed based in [25], and described in detail in Ap-pendix A.
Some of the XP-cf are common between all projectsand they will be described in Section 3.3. Factors thatdiffer will be presented for each project in the followingformat:
• Project Name
• Description: a brief description of the goals of theproject.
• Software Classification: as prescribed byJones [22].
• Information Table : a table describing the sociolog-ical and project-specific factors. Information aboutthe team size, education, and experience level wasgathered from the survey results (Appendix A). Do-main and language expertise was subjectively evalu-ated by the authors. Quantitative data such as num-ber of delivered user stories and thousands lines ofexecutable code (KLOEC) were collected respec-tively from XPlanner and from the code repository(metrics are described in detail in Section 4).
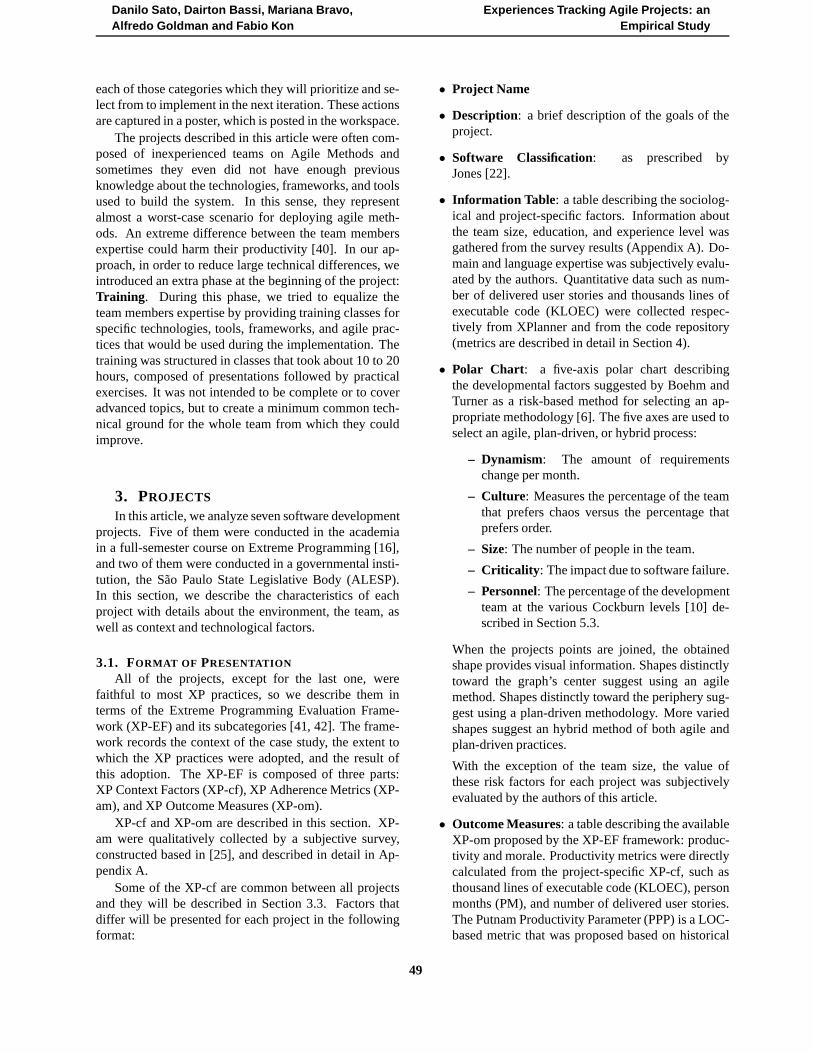
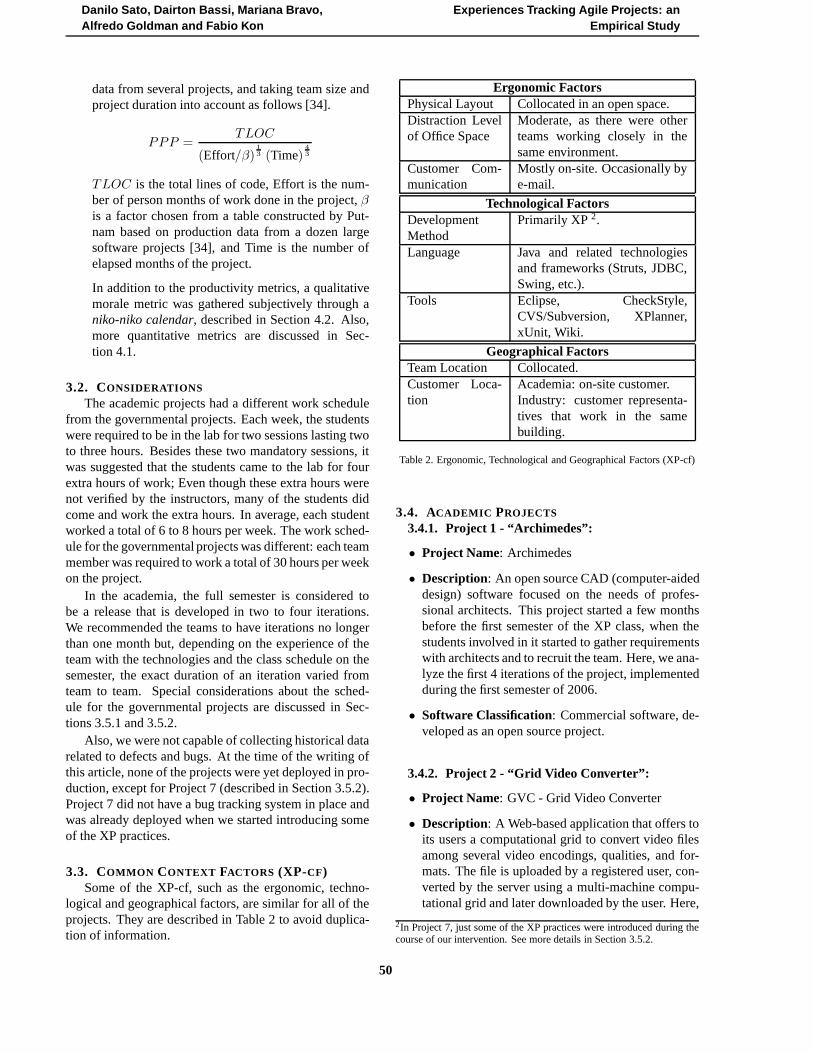
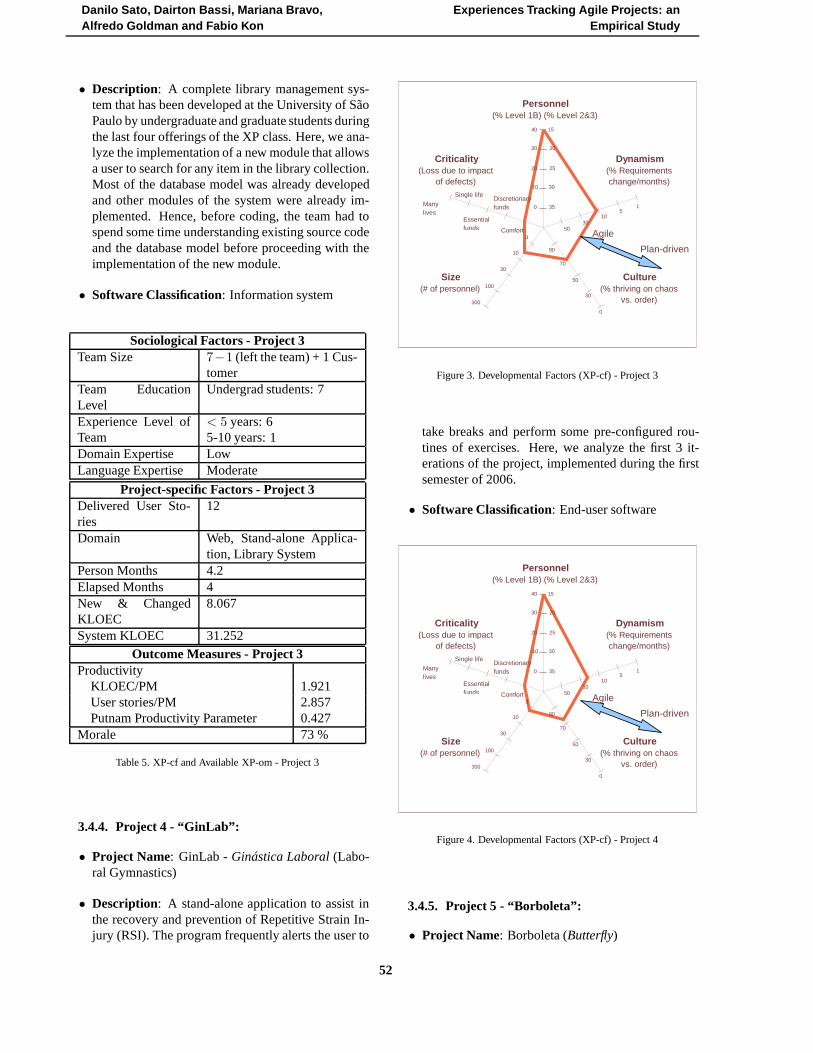
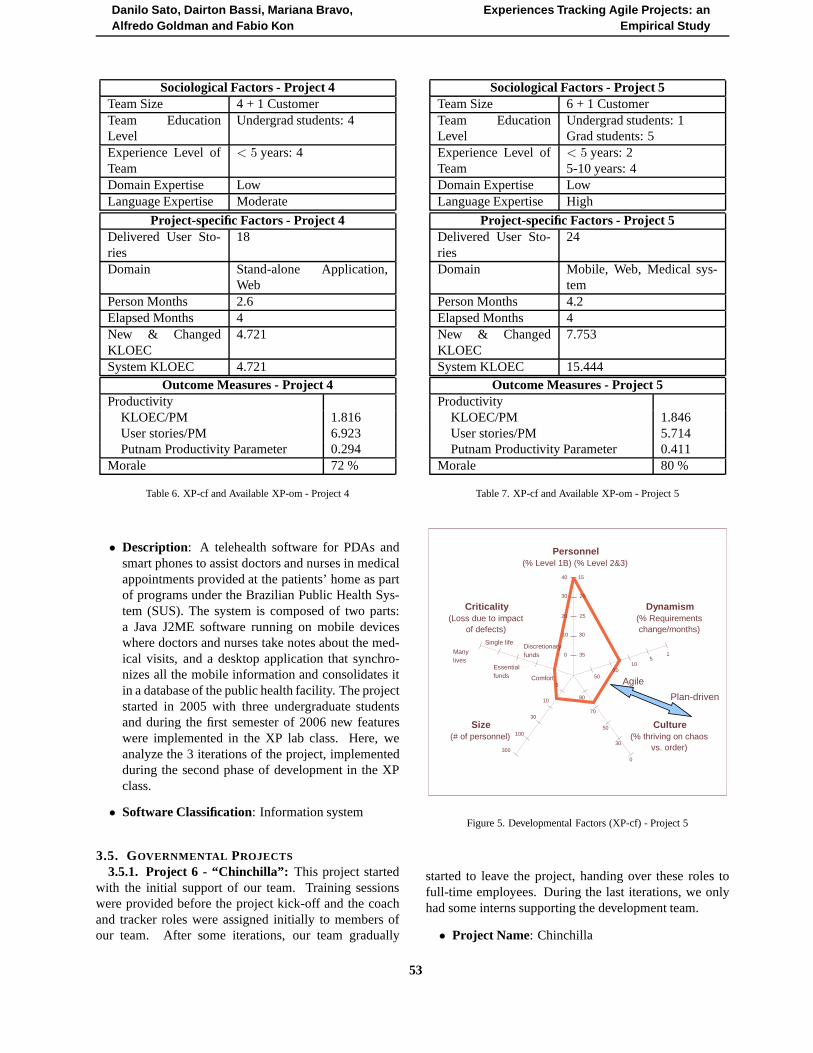
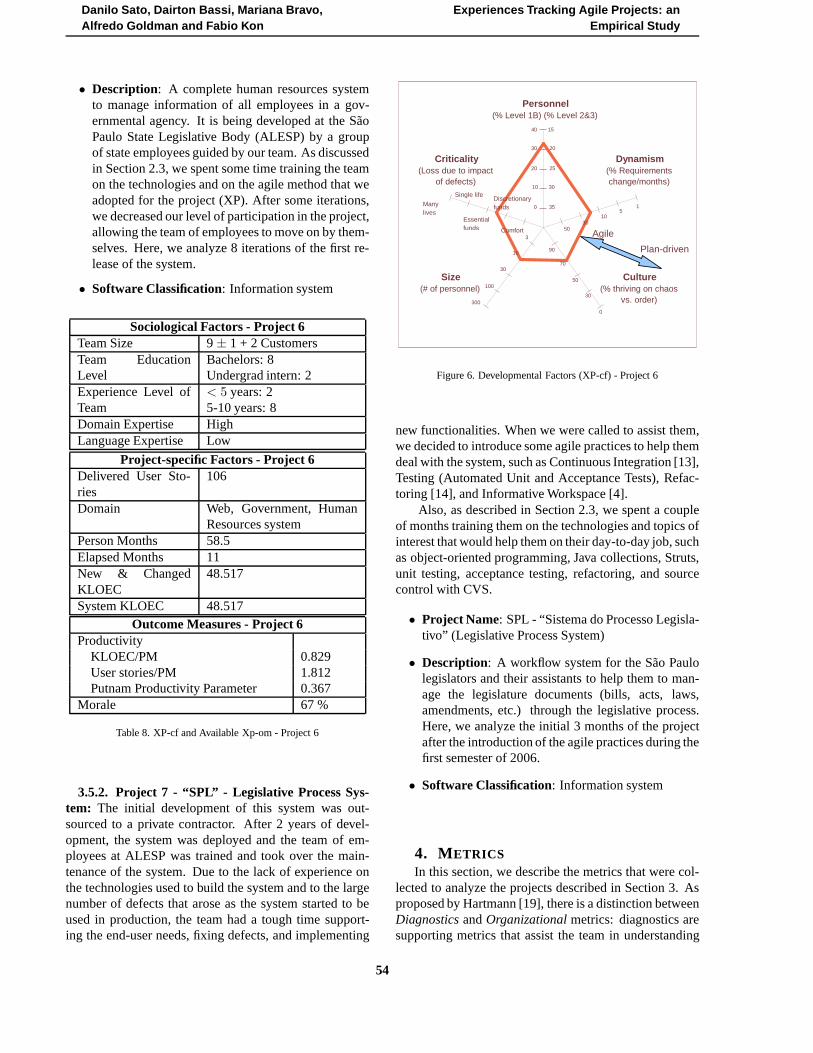
• Polar Chart : a five-axis polar chart describingthe developmental factors suggested by Boehm andTurner as a risk-based method for selecting an ap-propriate methodology [6]. The five axes are used toselect an agile, plan-driven, or hybrid process:
– Dynamism: The amount of requirementschange per month.
– Culture: Measures the percentage of the teamthat prefers chaos versus the percentage thatprefers order.
– Size: The number of people in the team.
– Criticality : The impact due to software failure.
– Personnel: The percentage of the developmentteam at the various Cockburn levels [10] de-scribed in Section 5.3.
When the projects points are joined, the obtainedshape provides visual information. Shapes distinctlytoward the graph’s center suggest using an agilemethod. Shapes distinctly toward the periphery sug-gest using a plan-driven methodology. More variedshapes suggest an hybrid method of both agile andplan-driven practices.
With the exception of the team size, the value ofthese risk factors for each project was subjectivelyevaluated by the authors of this article.
• Outcome Measures: a table describing the availableXP-om proposed by the XP-EF framework: produc-tivity and morale. Productivity metrics were directlycalculated from the project-specific XP-cf, such asthousand lines of executable code (KLOEC), personmonths (PM), and number of delivered user stories.The Putnam Productivity Parameter (PPP) is a LOC-based metric that was proposed based on historical
49
Danilo Sato, Dairton Bassi, Mariana Bravo,Alfredo Goldman and Fabio Kon
Experiences Tracking Agile Projects: anEmpirical Study
data from several projects, and taking team size andproject duration into account as follows [34].
PPP =TLOC
(Effort/β)1
3 (Time)4
3
TLOC is the total lines of code, Effort is the num-ber of person months of work done in the project,βis a factor chosen from a table constructed by Put-nam based on production data from a dozen largesoftware projects [34], and Time is the number ofelapsed months of the project.
In addition to the productivity metrics, a qualitativemorale metric was gathered subjectively through aniko-niko calendar, described in Section 4.2. Also,more quantitative metrics are discussed in Sec-tion 4.1.
3.2. CONSIDERATIONS
The academic projects had a different work schedulefrom the governmental projects. Each week, the studentswere required to be in the lab for two sessions lasting twoto three hours. Besides these two mandatory sessions, itwas suggested that the students came to the lab for fourextra hours of work; Even though these extra hours werenot verified by the instructors, many of the students didcome and work the extra hours. In average, each studentworked a total of 6 to 8 hours per week. The work sched-ule for the governmental projects was different: each teammember was required to work a total of 30 hours per weekon the project.
In the academia, the full semester is considered tobe a release that is developed in two to four iterations.We recommended the teams to have iterations no longerthan one month but, depending on the experience of theteam with the technologies and the class schedule on thesemester, the exact duration of an iteration varied fromteam to team. Special considerations about the sched-ule for the governmental projects are discussed in Sec-tions 3.5.1 and 3.5.2.
Also, we were not capable of collecting historical datarelated to defects and bugs. At the time of the writing ofthis article, none of the projects were yet deployed in pro-duction, except for Project 7 (described in Section 3.5.2).Project 7 did not have a bug tracking system in place andwas already deployed when we started introducing someof the XP practices.
3.3. COMMON CONTEXT FACTORS (XP-CF)Some of the XP-cf, such as the ergonomic, techno-
logical and geographical factors, are similar for all of theprojects. They are described in Table 2 to avoid duplica-tion of information.
Ergonomic FactorsPhysical Layout Collocated in an open space.Distraction Levelof Office Space
Moderate, as there were otherteams working closely in thesame environment.
Customer Com-munication
Mostly on-site. Occasionally bye-mail.
Technological FactorsDevelopmentMethod
Primarily XP2.
Language Java and related technologiesand frameworks (Struts, JDBC,Swing, etc.).
Tools Eclipse, CheckStyle,CVS/Subversion, XPlanner,xUnit, Wiki.
Geographical FactorsTeam Location Collocated.Customer Loca-tion
Academia: on-site customer.Industry: customer representa-tives that work in the samebuilding.
Table 2. Ergonomic, Technological and Geographical Factors (XP-cf)
3.4. ACADEMIC PROJECTS
3.4.1. Project 1 - “Archimedes”:
• Project Name: Archimedes
• Description: An open source CAD (computer-aideddesign) software focused on the needs of profes-sional architects. This project started a few monthsbefore the first semester of the XP class, when thestudents involved in it started to gather requirementswith architects and to recruit the team. Here, we ana-lyze the first 4 iterations of the project, implementedduring the first semester of 2006.
• Software Classification: Commercial software, de-veloped as an open source project.
3.4.2. Project 2 - “Grid Video Converter”:
• Project Name: GVC - Grid Video Converter
• Description: A Web-based application that offers toits users a computational grid to convert video filesamong several video encodings, qualities, and for-mats. The file is uploaded by a registered user, con-verted by the server using a multi-machine compu-tational grid and later downloaded by the user. Here,
2In Project 7, just some of the XP practices were introduced during thecourse of our intervention. See more details in Section 3.5.2.
50

Danilo Sato, Dairton Bassi, Mariana Bravo,Alfredo Goldman and Fabio Kon
Experiences Tracking Agile Projects: anEmpirical Study
Sociological Factors - Project 1Team Size 8 + 2 CustomersTeam EducationLevel
Undergrad students: 8
Experience Level ofTeam
< 5 years: 8
Domain Expertise LowLanguage Expertise High
Project-specific Factors - Project 1Delivered User Sto-ries
64
Domain Stand-alone Application,CAD
Person Months 6.4Elapsed Months 4New & ChangedKLOEC
18.832
System KLOEC 18.832Outcome Measures - Project 1
ProductivityKLOEC/PM 2.943User stories/PM 10Putnam Productivity Parameter 0.902
Morale 97 %
Table 3. XP-cf and Available XP-om - Project 1
Criticality(Loss due to impact
of defects)
Personnel(% Level 1B) (% Level 2&3)
Dynamism(% Requirements change/months)
Culture(% thriving on chaos
vs. order)
Size(# of personnel)
40 15
30 20
20 25
10 30
0 35
5030
105
1
90
70
50
30
0
3
10
30
100
300
Comfort
Discretionary funds
Essential funds
Single life
Many lives
Plan-driven
Agile
Figure 1. Developmental Factors (XP-cf) - Project 1
we analyze the first 3 iterations of the project, imple-mented during the first semester of 2006.
• Software Classification: End-user software
Sociological Factors - Project 2Team Size 6 (1 replaced mid-term) + 1
CustomerTeam EducationLevel
Undergrad students: 2Grad students: 4
Experience Level ofTeam
< 5 years: 45-10 years: 2
Domain Expertise LowLanguage Expertise High
Project-specific Factors - Project 2Delivered User Sto-ries
16
Domain Web, Grid Computing,Video Conversion
Person Months 4.2Elapsed Months 4New & ChangedKLOEC
2.535
System KLOEC 2.535Outcome Measures - Project 2
ProductivityKLOEC/PM 0.604User stories/PM 3.810Putnam Productivity Parameter 0.134
Morale 64 %
Table 4. XP-cf and Available XP-om - Project 2
Criticality(Loss due to impact
of defects)
Personnel(% Level 1B) (% Level 2&3)
Dynamism(% Requirements change/months)
Culture(% thriving on chaos
vs. order)
Size(# of personnel)
40 15
30 20
20 25
10 30
0 35
5030
105
1
90
70
50
30
0
3
10
30
100
300
Comfort
Discretionary funds
Essential funds
Single life
Many lives
Plan-driven
Agile
Figure 2. Developmental Factors (XP-cf) - Project 2
3.4.3. Project 3 - “Colméia”:
• Project Name: Colméia (Beehive)
51
Danilo Sato, Dairton Bassi, Mariana Bravo,Alfredo Goldman and Fabio Kon
Experiences Tracking Agile Projects: anEmpirical Study
• Description: A complete library management sys-tem that has been developed at the University of SãoPaulo by undergraduate and graduate students duringthe last four offerings of the XP class. Here, we ana-lyze the implementation of a new module that allowsa user to search for any item in the library collection.Most of the database model was already developedand other modules of the system were already im-plemented. Hence, before coding, the team had tospend some time understanding existing source codeand the database model before proceeding with theimplementation of the new module.
• Software Classification: Information system
Sociological Factors - Project 3Team Size 7−1 (left the team) + 1 Cus-
tomerTeam EducationLevel
Undergrad students: 7
Experience Level ofTeam
< 5 years: 65-10 years: 1
Domain Expertise LowLanguage Expertise Moderate
Project-specific Factors - Project 3Delivered User Sto-ries
12
Domain Web, Stand-alone Applica-tion, Library System
Person Months 4.2Elapsed Months 4New & ChangedKLOEC
8.067
System KLOEC 31.252Outcome Measures - Project 3
ProductivityKLOEC/PM 1.921User stories/PM 2.857Putnam Productivity Parameter 0.427
Morale 73 %
Table 5. XP-cf and Available XP-om - Project 3
3.4.4. Project 4 - “GinLab”:
• Project Name: GinLab -Ginástica Laboral(Labo-ral Gymnastics)
• Description: A stand-alone application to assist inthe recovery and prevention of Repetitive Strain In-jury (RSI). The program frequently alerts the user to
Criticality(Loss due to impact
of defects)
Personnel(% Level 1B) (% Level 2&3)
Dynamism(% Requirements change/months)
Culture(% thriving on chaos
vs. order)
Size(# of personnel)
40 15
30 20
20 25
10 30
0 35
5030
105
1
90
70
50
30
0
3
10
30
100
300
Comfort
Discretionary funds
Essential funds
Single life
Many lives
Plan-driven
Agile
Figure 3. Developmental Factors (XP-cf) - Project 3
take breaks and perform some pre-configured rou-tines of exercises. Here, we analyze the first 3 it-erations of the project, implemented during the firstsemester of 2006.
• Software Classification: End-user software
Criticality(Loss due to impact
of defects)
Personnel(% Level 1B) (% Level 2&3)
Dynamism(% Requirements change/months)
Culture(% thriving on chaos
vs. order)
Size(# of personnel)
40 15
30 20
20 25
10 30
0 35
5030
105
1
90
70
50
30
0
3
10
30
100
300
Comfort
Discretionary funds
Essential funds
Single life
Many lives
Plan-driven
Agile
Figure 4. Developmental Factors (XP-cf) - Project 4
3.4.5. Project 5 - “Borboleta”:
• Project Name: Borboleta (Butterfly)
52
Danilo Sato, Dairton Bassi, Mariana Bravo,Alfredo Goldman and Fabio Kon
Experiences Tracking Agile Projects: anEmpirical Study
Sociological Factors - Project 4Team Size 4 + 1 CustomerTeam EducationLevel
Undergrad students: 4
Experience Level ofTeam
< 5 years: 4
Domain Expertise LowLanguage Expertise Moderate
Project-specific Factors - Project 4Delivered User Sto-ries
18
Domain Stand-alone Application,Web
Person Months 2.6Elapsed Months 4New & ChangedKLOEC
4.721
System KLOEC 4.721Outcome Measures - Project 4
ProductivityKLOEC/PM 1.816User stories/PM 6.923Putnam Productivity Parameter 0.294
Morale 72 %
Table 6. XP-cf and Available XP-om - Project 4
• Description: A telehealth software for PDAs andsmart phones to assist doctors and nurses in medicalappointments provided at the patients’ home as partof programs under the Brazilian Public Health Sys-tem (SUS). The system is composed of two parts:a Java J2ME software running on mobile deviceswhere doctors and nurses take notes about the med-ical visits, and a desktop application that synchro-nizes all the mobile information and consolidates itin a database of the public health facility. The projectstarted in 2005 with three undergraduate studentsand during the first semester of 2006 new featureswere implemented in the XP lab class. Here, weanalyze the 3 iterations of the project, implementedduring the second phase of development in the XPclass.
• Software Classification: Information system
3.5. GOVERNMENTAL PROJECTS
3.5.1. Project 6 - “Chinchilla”: This project startedwith the initial support of our team. Training sessionswere provided before the project kick-off and the coachand tracker roles were assigned initially to members ofour team. After some iterations, our team gradually
Sociological Factors - Project 5Team Size 6 + 1 CustomerTeam EducationLevel
Undergrad students: 1Grad students: 5
Experience Level ofTeam
< 5 years: 25-10 years: 4
Domain Expertise LowLanguage Expertise High
Project-specific Factors - Project 5Delivered User Sto-ries
24
Domain Mobile, Web, Medical sys-tem
Person Months 4.2Elapsed Months 4New & ChangedKLOEC
7.753
System KLOEC 15.444Outcome Measures - Project 5
ProductivityKLOEC/PM 1.846User stories/PM 5.714Putnam Productivity Parameter 0.411
Morale 80 %
Table 7. XP-cf and Available XP-om - Project 5
Criticality(Loss due to impact
of defects)
Personnel(% Level 1B) (% Level 2&3)
Dynamism(% Requirements change/months)
Culture(% thriving on chaos
vs. order)
Size(# of personnel)
40 15
30 20
20 25
10 30
0 35
5030
105
1
90
70
50
30
0
3
10
30
100
300
Comfort
Discretionary funds
Essential funds
Single life
Many lives
Plan-driven
Agile
Figure 5. Developmental Factors (XP-cf) - Project 5
started to leave the project, handing over these roles tofull-time employees. During the last iterations, we onlyhad some interns supporting the development team.
• Project Name: Chinchilla
53
Danilo Sato, Dairton Bassi, Mariana Bravo,Alfredo Goldman and Fabio Kon
Experiences Tracking Agile Projects: anEmpirical Study
• Description: A complete human resources systemto manage information of all employees in a gov-ernmental agency. It is being developed at the SãoPaulo State Legislative Body (ALESP) by a groupof state employees guided by our team. As discussedin Section 2.3, we spent some time training the teamon the technologies and on the agile method that weadopted for the project (XP). After some iterations,we decreased our level of participation in the project,allowing the team of employees to move on by them-selves. Here, we analyze 8 iterations of the first re-lease of the system.
• Software Classification: Information system
Sociological Factors - Project 6Team Size 9± 1 + 2 CustomersTeam EducationLevel
Bachelors: 8Undergrad intern: 2
Experience Level ofTeam
< 5 years: 25-10 years: 8
Domain Expertise HighLanguage Expertise Low
Project-specific Factors - Project 6Delivered User Sto-ries
106
Domain Web, Government, HumanResources system
Person Months 58.5Elapsed Months 11New & ChangedKLOEC
48.517
System KLOEC 48.517Outcome Measures - Project 6
ProductivityKLOEC/PM 0.829User stories/PM 1.812Putnam Productivity Parameter 0.367
Morale 67 %
Table 8. XP-cf and Available Xp-om - Project 6
3.5.2. Project 7 - “SPL” - Legislative Process Sys-tem: The initial development of this system was out-sourced to a private contractor. After 2 years of devel-opment, the system was deployed and the team of em-ployees at ALESP was trained and took over the main-tenance of the system. Due to the lack of experience onthe technologies used to build the system and to the largenumber of defects that arose as the system started to beused in production, the team had a tough time support-ing the end-user needs, fixing defects, and implementing
Criticality(Loss due to impact
of defects)
Personnel(% Level 1B) (% Level 2&3)
Dynamism(% Requirements change/months)
Culture(% thriving on chaos
vs. order)
Size(# of personnel)
40 15
30 20
20 25
10 30
0 35
5030
105
1
90
70
50
30
0
3
10
30
100
300
Comfort
Discretionary funds
Essential funds
Single life
Many lives
Plan-driven
Agile
Figure 6. Developmental Factors (XP-cf) - Project 6
new functionalities. When we were called to assist them,we decided to introduce some agile practices to help themdeal with the system, such as Continuous Integration [13],Testing (Automated Unit and Acceptance Tests), Refac-toring [14], and Informative Workspace [4].
Also, as described in Section 2.3, we spent a coupleof months training them on the technologies and topics ofinterest that would help them on their day-to-day job, suchas object-oriented programming, Java collections, Struts,unit testing, acceptance testing, refactoring, and sourcecontrol with CVS.
• Project Name: SPL - “Sistema do Processo Legisla-tivo” (Legislative Process System)
• Description: A workflow system for the São Paulolegislators and their assistants to help them to man-age the legislature documents (bills, acts, laws,amendments, etc.) through the legislative process.Here, we analyze the initial 3 months of the projectafter the introduction of the agile practices during thefirst semester of 2006.
• Software Classification: Information system
4. METRICSIn this section, we describe the metrics that were col-
lected to analyze the projects described in Section 3. Asproposed by Hartmann [19], there is a distinction betweenDiagnosticsandOrganizationalmetrics: diagnostics aresupporting metrics that assist the team in understanding
54

Danilo Sato, Dairton Bassi, Mariana Bravo,Alfredo Goldman and Fabio Kon
Experiences Tracking Agile Projects: anEmpirical Study
Sociological Factors - Project 7Team Size 5 full-time employees + 3
part-time consultants + 5Customers
Team EducationLevel
Undergrad students: 1Bachelors: 7
Experience Level ofTeam
< 5 years: 15-10 years: 7
Domain Expertise HighLanguage Expertise Low
Project-specific Factors - Project 7Delivered User Sto-ries
None
Domain Web, WorkflowPerson Months 15Elapsed Months 4New & ChangedKLOEC
6.819
System KLOEC 177.016Outcome Measures - Project 7
ProductivityKLOEC/PM 0.455User stories/PM N/APutnam Productivity Parameter 0.236
Morale N/A
Table 9. XP-cf and Available XP-om - Project 7
Criticality(Loss due to impact
of defects)
Personnel(% Level 1B) (% Level 2&3)
Dynamism(% Requirements change/months)
Culture(% thriving on chaos
vs. order)
Size(# of personnel)
40 15
30 20
20 25
10 30
0 35
5030
105
1
90
70
50
30
0
3
10
30
100
300
Comfort
Discretionary funds
Essential funds
Single life
Many lives
Plan-driven
Agile
Figure 7. Developmental Factors (XP-cf) - Project 7
and improving the process that produces business value;organizational metrics are those that measure the amountof business value delivered to the customer. Goldratt
warns us that teams will behave according to how theyare being measured [17], so it is important that the teamunderstand the purpose of the metrics.
In this article, we are interested in analyzing andproposing diagnostics metrics that can be used to supportthe tracker of an agile team. The purpose of such diag-nostic metrics is to support the team’s improvement. Toavoid the problem stated by Goldratt, the team must un-derstand that these metrics are volatile, therefore as soonas a metric is not serving its purpose, it should be dis-carded.
The next sections describe the quantitative and quali-tative metrics gathered in this study.
4.1. QUANTITATIVE M ETRICS
Our quantitative metrics were directly gathered fromthe source code, from the source control repository andfrom XPlanner [30], a light-weight Web tool for planningand tracking XP projects. The metrics were collected atthe end of the last iteration, but historical data from alliterations could be retrieved from the above-mentionedtools. The quantitative metrics are described below.
• Total Lines of Code (TLOC): Counts the total num-ber of non-blank, non-comment lines of productioncode in the system.
• Total Lines of Test Code (TLOTC): Counts the to-tal number of test points in the system, as defined byDubinsky [12]. One test point is defined as one stepin an automatic acceptance testing scenario or as onenon-blank, non-comment line of unit test code.
• McCabe’s Cyclomatic Complexity (v(G)): Mea-sures the amount of decision logic in a single soft-ware module [29]. Control flow graphs describe thelogic structure of software modules and consists ofnodes and edges. The nodes represent computationalstatements or expressions, and the edges representtransfer of control between nodes. Cyclomatic Com-plexity is defined for each module (in our case study,a module is a method) to bee − n + 2, wheree andn are the number of edges and nodes in the controlflow graph, respectively.
• Weighted Methods per Class (WMC): Measuresthe complexity of classes in an object-oriented sys-tem. It is defined as the weighted sum of all methodsdefined in a class [9]. In this study, we are usingMcCabe’s Cyclomatic Complexity as the weightingfactor for WMC, so WMC can be calculated as
∑ci,
whereci is McCabe’s Cyclomatic Complexity of theclass’ith method.
• Class Size: Counts the total number of non-blank,non-comment lines of a class in the system.
55
Danilo Sato, Dairton Bassi, Mariana Bravo,Alfredo Goldman and Fabio Kon
Experiences Tracking Agile Projects: anEmpirical Study
• Number of Commits: Counts the total number ofindividual commits to the source control repository.
• Number of Lines Changed: Counts the total num-ber of lines (not only source code) added, removed,and updated in the source control repository.
• Number of Delivered Stories: Counts the totalnumber of stories implemented in an iteration andapproved by the customer.
4.2. QUALITATIVE M ETRICS
The qualitative metrics were collected at the end ofthe last iteration of the first semester of 2006, so histori-cal data for all iterations is not available. The qualitativemetrics are described below.
• Interviews: We conducted semi-structured inter-views, with a mixture of open-ended and specificquestions [36] to give us a broader view and under-standing of what was happening with each project.The open-ended questions in the interview derivedfrom the answers to the following specific questions:
– Which XP practice(s) you found to be morevaluable to software development?
– Which XP practice(s) you found to be moredifficult to apply?
– Were thetracker and thecoachhelpful to theteam?
– Would you apply XP in other projects?
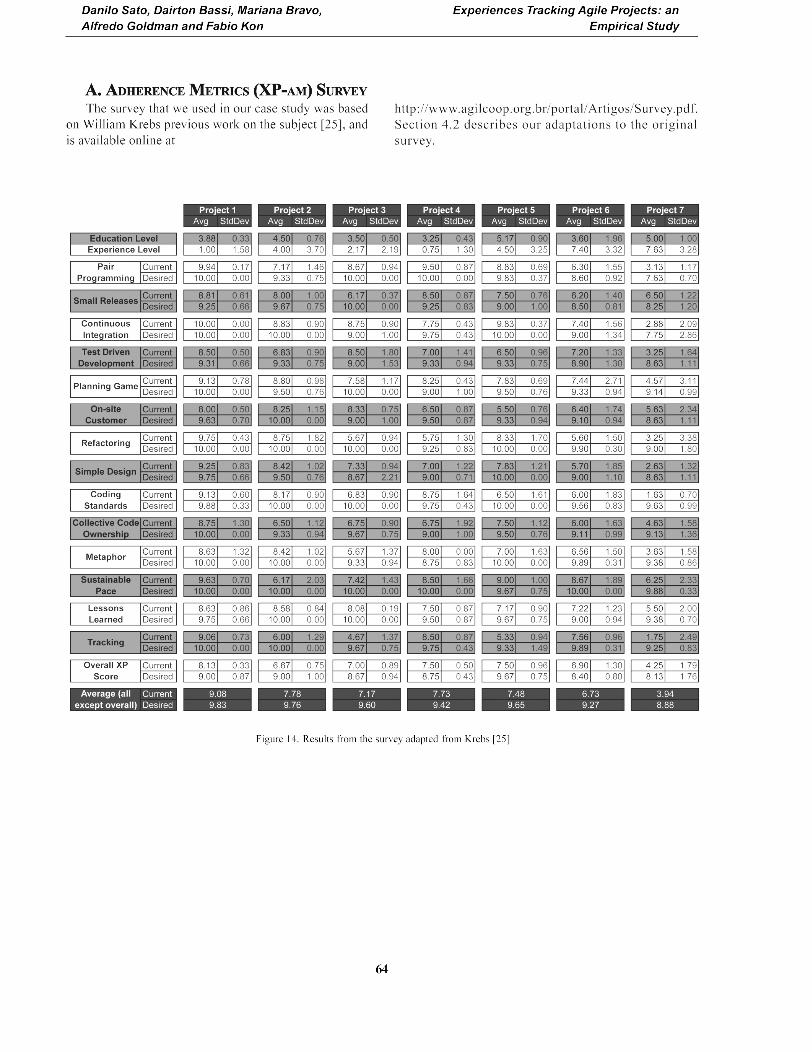
• Surveys: We used a survey developed by WilliamKrebs [25], extending it to include additional in-formation about the team education and experiencelevel, the extent to which each XP practice was be-ing used (see Appendix A), and a general score (ina 0-10 scale) abouttrackingquality. For each ques-tion, each team member had to provide the “current”and “desired” level of their team in relation to thatpractice.
• Team Morale: Throughout the last iteration, we alsocollected information about the team morale by ask-ing team members to update aniko-niko calendar[1]in a weekly basis. At the end of each work day, teammembers would paste a sticker in the calendar, witha color that would indicate his mood (pleasant, or-dinary, or unpleasant). This was used to gather theXP-om for each project.
5. ANALYSIS AND RESULTSIn this section, we analyze some relationships among
the metrics described in Section 4 and discuss how they
can assist in managing and tracking an agile project. Re-calling one of our main goals in this article, this sectionwill provide the “Diagnostics” metrics that we found suit-able to support tracking an agile project and to supportprocess and team improvement.
5.1. ANALYSIS OF ADHERENCE M ETRICS SURVEY
By analyzing the survey results in Figure 14, we no-ticed that the average of the desired scores was higherthan the actual scores for all practices in every project.That means that the teams wanted to improve on everyXP practice. The survey was answered by 48 individualsand only one answer had a lower desired score than theactual score for one practice (Simple Design).
We also had a result similar to that reported by Krebsin his study that proposed the original survey [25]: the av-erage desired score for each practice was higher than theirdesired overall score for XP. That, according to Krebs, in-dicates the team’s enthusiasm for practical techniques andless understanding of the values and principles underlyingthe XP “label”. Pair Programming on Project 7 was an ex-ception to this behavior, indicating their resistance againstthis practice. Project 5 also had a lower desired score forsome practices than their desired overall score for XP. Inthis case they have set a higher expectation on the processrather than the practices, having the highest desired over-all score for XP among all projects (9.67). Project 5 isalso the only project with an overall desired score for XPhigher than the actual average of desired scores for all XPpractices.
Finally, another information that can be extractedfrom the survey’s result is the difference between the ac-tual and desired scores for each practice. We can noticethat the practices on Project 1 were going well, with amaximum difference of 1.37 on the Metaphor practice.Project 7, on the other hand, was starting to adopt someof the agile practices, showing a much larger gap on mostof the practices. We can see differences of 8.00 and 7.50for the Coding Standards and Tracking practices, respec-tively. These differences can inform the team about themost important points of improvement, showing whichpractices deserve more attention on the next iterations.
5.2. RETROSPECTIVES AS A TRACKING TOOL
In our survey to collect the XP-am, we included aquestion abouttracking(shown in Table 10) in addition tothe already existing questions about lessons learned (Ret-rospectives) [25]. As shown in Table 10, the developeris expected to give a score between 0 and 10 to the cur-rent and the desired level oftracking using six samplesentences as a guideline of how well the practice is beingimplemented and followed by the team. The developerchooses the sentence that most resembles what the teamdoes (and should do) and gives the score.
56

Danilo Sato, Dairton Bassi, Mariana Bravo,Alfredo Goldman and Fabio Kon
Experiences Tracking Agile Projects: anEmpirical Study
Tracking Current:_________ Desired:_________There are big visible charts spread over the wall thathelps us understand the project pace.10 We have several charts that are updated daily andwe remove the ones that are not being used anymore. Thecharts helps us understand and improve our process.8 We have some interesting charts on the wall that areupdated weekly.6 The information in the wall is updated at the end ofeach release.4 The charts are outdated and no one cares about themanymore. We have to work to finish on schedule.2 I do not know why we have those charts on the wall.They do not seem to be related to my work. I think noone would notice if they were removed.0 We do not have any charts on the wall. We think it isbetter to store important information on documents andfiles in our central repository.
Table 10. Question added to the survey adapted from [25]
By analyzing the answers to the question describedin Table 10 (provided in Appendix A), we noticed thattrackingwas not working well for all of the teams: whileprojects 1, 4, and 6 had an average rate of9.06, 8.50, and7.56, projects 2, 3, 5, and 7 had an average rate of6.00,4.67, 5.33, and1.75 respectively. That behavior was con-firmed by the interviews with the team members of eachproject. In spite of that fact, it was an unanimous opin-ion that the Retrospective was a very valuable practiceto support the team in understanding and improving theirprocess. The results from the Retrospectives were postedin the workspace and worked as an important guidelineto drive the team in the right direction. Even the teamsthat were not doing well ontrackingwere keen to followup with the improvements proposed by the Retrospectiveposters. We conclude that the Retrospective is an addi-tional practice to supporttracking. It helps the teams tounderstand the project pace and improve the process andtheir performance on the next iterations.
5.3. PERSONNEL L EVEL AND AGILITY
The developmental factors described in Section 3.1and presented in Section 3 are proposed by Boehmand Turner as a risk-based method to classify projectsbetween plan-driven and agile-inclined projects [6, 7].When the polygon formed by the project data is distinctlytoward the center of the graph, an agile method is sug-gested as the preferred approach for that project. Shapesdistinctly toward the periphery suggest that a plan-drivenmethod would be preferred.
One of the proposed risk factors is the personnel level
of experience with agility and adaptability. This repre-sents the percentage of the development team that fallsat the various Cockburn levels described in Table 11.These levels consider the developer’s experience in tai-loring the method to fit new situations. By analyzingour project graphs (Figures 1, 2, 3, 4, 5, 6, and 7), wecan observe that the experience on tailoring the processfor all projects is similarly low. The top vertex of thepolygon in all graphs are toward the periphery. AlthoughBoehm and Turner suggest that you should consider thefive risk factors when choosing between an agile and plan-driven approach, we noticed that the similarity betweenthe projects’ personnel level did not accurately repre-sented the environment differences between the academicand governmental projects.
Level Team member characteristics3 Able to revise a method, breaking its rules to fit
an unprecedented new situation.2 Able to tailor a method to fit a precedented new
situation.1A With training, able to perform discretionary
method steps such as sizing stories to fit incre-ments, composing patterns, compound refac-toring, or complex COTS integration. With ex-perience, can become Level 2.
1B With training, able to perform proceduralmethod steps such as coding a simple method,simple refactoring, following coding standardsand configuration management procedures, orrunning tests. With experience, can mastersome Level 1A skills.
-1 May have technical skills but unable or unwill-ing to collaborate or follow shared methods.
Table 11. Personnel levels proposed by Cockburn [10]
Having people experienced in Agile Methods and intailoring the process is an important risk factor, but theywill not usually be available in a large number. As de-scribed in Section 2.3, our approach starts with trainingsessions led by an experienced coach. Most of our 5-yearexperience with XP involved inexperienced teams on Ag-ile Methods. We did not find that a low percentage ofLevel 2 and 3 personnel affected the adoption of an AgileMethod provided that there are a few people with a goodknowledge of the method and a good coach.
From our experience, we also noticed that it is usuallyeasier to teach agile practices to inexperienced program-mers. More mature, experienced programmers sometimestend to resist against agile practices such as Test-FirstProgramming, Collective Code Ownership, and Pair Pro-gramming because they have to change dramatically their
57
Danilo Sato, Dairton Bassi, Mariana Bravo,Alfredo Goldman and Fabio Kon
Experiences Tracking Agile Projects: anEmpirical Study
work style.Finally, we noticed that there is another personnel fac-
tor related to the successful adoption of an Agile Method:the coach’s influence. After our team started to leaveProject 6, the coach role was reassigned to a full-time em-ployee. His knowledge of the practices and influence onthe team was not the same as ours. Some of the prac-tices started to be left aside, as we will further discuss inSection 5.5.
There are more personnel factors that can influencethe decision between an agile and plan-driven approach.Further investigation should be conducted to understandhow the cultural changes imposed by an agile approachcan influence the personnel of a team, and how thesechanges can be evaluated when analyzing the risk factorsthat influence the adoption of an Agile Method.
5.4. OBJECT-ORIENTED DESIGN M ETRICS IN AG-ILE PROJECTS
Chidamber and Kemerer proposed a suite of object-oriented design metrics, claiming that their measures canaid developers in understanding design complexity, in de-tecting design flaws, and in predicting certain quality out-comes such as software defects, testing, and maintenanceeffort [9]. Basili et al. were able to further validate thesemetrics, determining that the metrics were statistically in-dependent and therefore did not provide redundant infor-mation [2]. It was also determined that the classes witha higher WMC were more prone to faults. An empiricalstudy conducted by Subramanyam and Krishnan gathereddata from industry projects developed in C++ and Java,and determined that larger class size and higher WMCare related to defects detected during acceptance testingand those reported by customers [38]. Li and Henry alsoanalyzed the object-oriented metrics in two commercialsystems, determining that five of six metrics (except Cou-pling Between Objects [9]) helped predict maintenanceeffort [26].
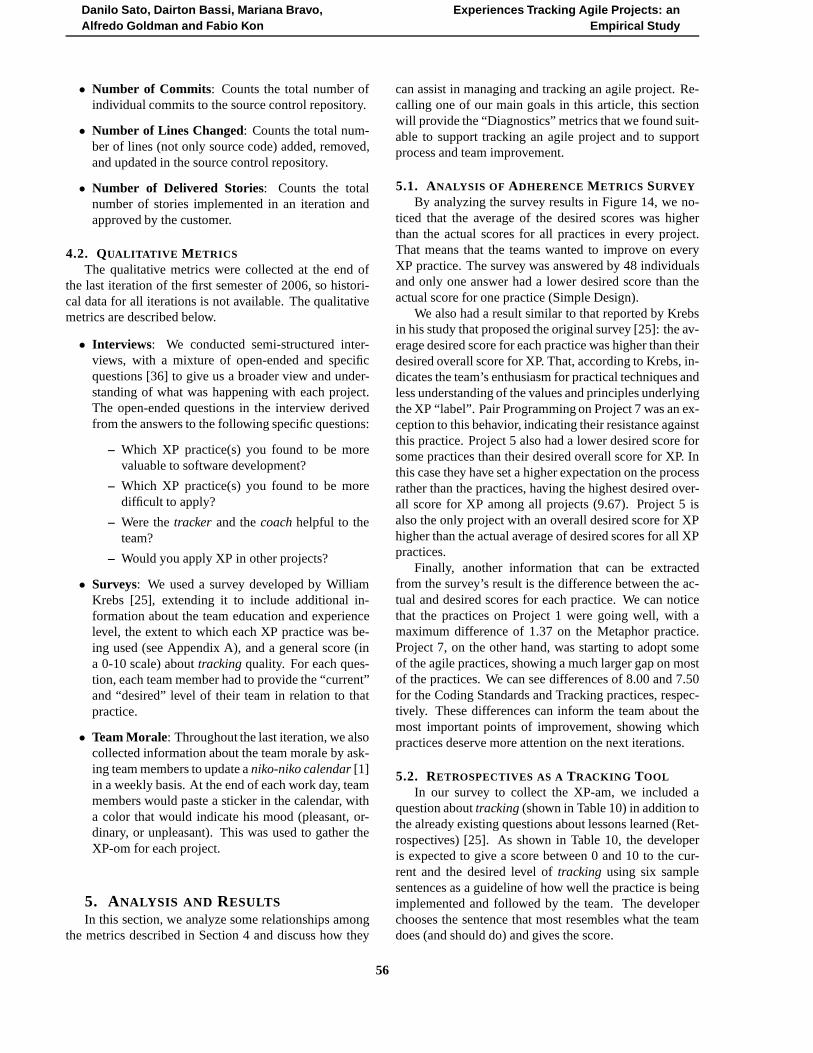
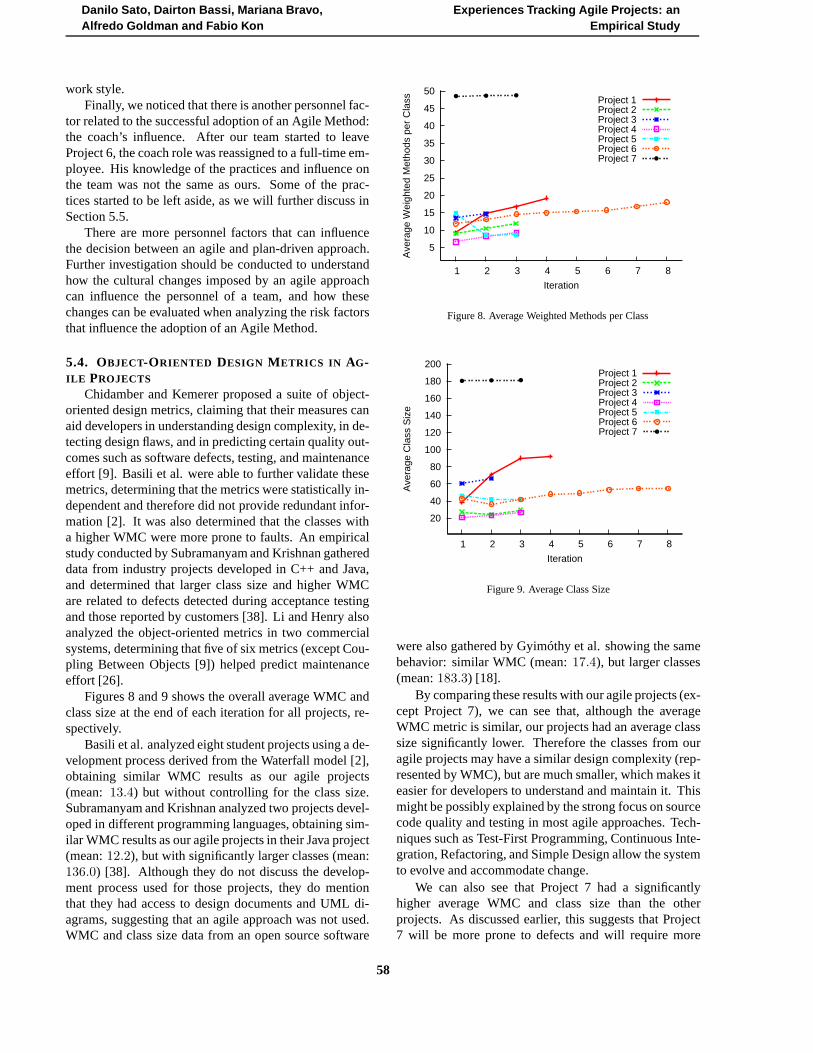
Figures 8 and 9 shows the overall average WMC andclass size at the end of each iteration for all projects, re-spectively.
Basili et al. analyzed eight student projects using a de-velopment process derived from the Waterfall model [2],obtaining similar WMC results as our agile projects(mean: 13.4) but without controlling for the class size.Subramanyam and Krishnan analyzed two projects devel-oped in different programming languages, obtaining sim-ilar WMC results as our agile projects in their Java project(mean:12.2), but with significantly larger classes (mean:136.0) [38]. Although they do not discuss the develop-ment process used for those projects, they do mentionthat they had access to design documents and UML di-agrams, suggesting that an agile approach was not used.WMC and class size data from an open source software
5
10
15
20
25
30
35
40
45
50
1 2 3 4 5 6 7 8
Ave
rage
Wei
ghte
d M
etho
ds p
er C
lass
Iteration
Project 1Project 2Project 3Project 4Project 5Project 6Project 7
Figure 8. Average Weighted Methods per Class
20
40
60
80
100
120
140
160
180
200
1 2 3 4 5 6 7 8
Ave
rage
Cla
ss S
ize
Iteration
Project 1Project 2Project 3Project 4Project 5Project 6Project 7
Figure 9. Average Class Size
were also gathered by Gyimóthy et al. showing the samebehavior: similar WMC (mean:17.4), but larger classes(mean:183.3) [18].
By comparing these results with our agile projects (ex-cept Project 7), we can see that, although the averageWMC metric is similar, our projects had an average classsize significantly lower. Therefore the classes from ouragile projects may have a similar design complexity (rep-resented by WMC), but are much smaller, which makes iteasier for developers to understand and maintain it. Thismight be possibly explained by the strong focus on sourcecode quality and testing in most agile approaches. Tech-niques such as Test-First Programming, Continuous Inte-gration, Refactoring, and Simple Design allow the systemto evolve and accommodate change.
We can also see that Project 7 had a significantlyhigher average WMC and class size than the otherprojects. As discussed earlier, this suggests that Project7 will be more prone to defects and will require more
58

Danilo Sato, Dairton Bassi, Mariana Bravo,Alfredo Goldman and Fabio Kon
Experiences Tracking Agile Projects: anEmpirical Study
testing and maintenance effort. As discussed in Sec-tion 3.5.2, this was the only project in which some ag-ile practices were later introduced during the maintenancephase. Also, by comparing WMC and class size fromProject 7 with the results from other studies, we can seethat it has a similar class size average (mean≈ 180),but a significantly higher design complexity (mean WMC≈ 48). Many other factors prior to our intervention mayhave affected these metrics, but WMC and class size canbe suitable metrics to be used when we later introducemore agile practices related to testing, Refactoring andSimple Design.
5.5. MEASURING CONTINUOUS I NTEGRATION
Continuous Integration is one of the most importantXP practices to allow a team to deliver and deploy work-ing software at the end of each release [13]. It is a tech-nique that reduces the risk of large integrations at the endof a development cycle by providing an automated buildof the entire system, frequent execution of the test suite,and the means for the entire team to understand what ishappening with the system in a frequent basis.
By reflecting on data retrieved from the code repos-itory, we propose a metric to analyze and diagnose howwell Continuous Integration is going in a project. Thismetric can support thetracker to understand and improvethe adoption of this practice in an agile team. We definethe Integration FactorIFi for iterationi as follows:
IFi =LAi + LRi + LUi
TCi
where:
LAi = total number of lines added in iterationiLRi = total number of lines removed in iterationiLUi = total number of lines updated in iterationiTCi = total number of commits in iterationi
If the team is properly doing Continuous Integration,the Integration Factor should be low, indicating that thereare few line changes per commit.TCi can be retrieved byanalyzing the repository history log andLAi, LRi, andLUi can be obtained from the file diffs retrieved from therepository. Figure 10 shows the value of the IntegrationFactor for each iteration of all projects:
Again, we can observe that Project 7 team memberswere used to wait longer before committing their changesto the repository. This behavior started to change after weintroduced them to Continuous Integration, which can beseen in the graph as a rapidly decreasing line. We also ob-serve a growing trend in the Integration Factor for Project6. As our team gradually left the lead of Project 6 and letthe state employees run the process, they kept some of theXP practices but were less rigorous with others, such as
0
50
100
150
200
250
300
350
1 2 3 4 5 6 7 8Inte
grat
ion
Fac
tor
(Lin
e C
hang
es /
Com
mit)
Iteration
Project 1Project 2Project 3Project 4Project 5Project 6Project 7
Figure 10. Integration Factor
Continuous Integration. This shows that it is hard to sus-tain changes imposed by some of the agile practices. Asopposed to what common sense would suggest, runningand maintaining an agile method such as XP requires dis-cipline.
To validate the suitability of this metric we calculatedthe Spearman’s rank correlation between the IntegrationFactor and the team’s average evaluation of ContinuousIntegration. A negative correlation of−0.57 was deter-mined, but it was not statistically significant at a 95%confidence level (p-value= 0.1, N = 7). We believethat this is due to the small sample size, because the sur-vey was only conducted at the end of the semester (lastiteration).
5.6. MEASURING THE TEAM ’ S ADOPTION OF
TESTING PRACTICES
Quality is one of the most important XP principles.Quality is not considered to be a control variable duringXP planning [4]. Many XP practices provide the means tobuild and maintain the quality of a system, such as Test-First Programming, Continuous Integration, Refactoring,and Simple Design. In particular, XP suggests that bothunit and acceptance tests should be automated to be fre-quently executed and to provide constant feedback aboutthe system quality.
By analyzing data retrieved from the source code, wepropose a metric to analyze and diagnose how well theTesting practices are going in a project. We define the TestFactorTi for iterationi as the ratio between the numberof lines of test code and the number of lines of productioncode:
Ti =TLOTCi
TLOCi
59

Danilo Sato, Dairton Bassi, Mariana Bravo,Alfredo Goldman and Fabio Kon
Experiences Tracking Agile Projects: anEmpirical Study
where:
TLOTCi = total lines of test code in iterationiTLOCi = total lines of production code in iterationi
Figure 11 shows the value of the Test Factor for eachiteration of all projects:
-0.2
0
0.2
0.4
0.6
0.8
1
1.2
1.4
1 2 3 4 5 6 7 8
Tes
t Fac
tor
(TLO
TC
/TLO
C)
Iteration
Project 1Project 2Project 3Project 4Project 5Project 6Project 7
Figure 11. Test Factor
We observe that some projects may have more linesof test code than production code (Ti > 1). We can alsoobserve iterations where testing was left aside, causingthe Test Factor to drop and showing that more productioncode was developed without tests. We can also observea low Test Factor for Projects 5 and 7 in which devel-opment started prior to the adoption of an agile method.The flat format of the graph for those projects reflects thedifficulty of adopting testing practices in a legacy systemwhere most of the production code was developed withoutand automated test suite.
Although the developers started to write automatedtests for the legacy code, the systems had approximately10, 000 and170, 000 lines of code to be covered by auto-mated tests. A great effort is still necessary to improve thetest coverage for these projects. Figures 12 and 13 showsthe evolution of the total lines of production and test code,iteration by iteration. An automated test suite is a highlyeffective means to build and maintain software with highquality, so it is important to develop a testing culture fromthe beginning of a project.
To validate the suitability of this metric we calculatedthe Spearman’s rank correlation between the Test Factorand the team’s average evaluation of the Testing practiceat the end of the last iteration. A positive correlation of0.72 was determined with statistical significance at a 95%confidence level (p-value= 0.03382, N = 7).
1
10
100
1000
10000
100000
1e+06
0 1 2 3 4 5 6 7 8
Tot
al L
ines
of P
rodu
ctio
n C
ode
(log
scal
e)
Iteration
Project 1Project 2Project 3Project 4Project 5Project 6Project 7
Figure 12. Total Lines of Production Code
1
10
100
1000
10000
100000
1e+06
0 1 2 3 4 5 6 7 8
Tot
al L
ines
of T
est C
ode
(log
scal
e)
Iteration
Project 1Project 2Project 3Project 4Project 5Project 6Project 7
Figure 13. Total Lines of Test Code
6. CONCLUSIONS AND FUTURE WORKIn our empirical case study, we analyzed seven
projects from both academic and governmental environ-ments from the point of view of tracking an agile process.The projects were conducted by experienced coaches andwere mostly composed of team members without pre-vious experience with Agile Methods. We classifiedthe projects using the XP-EF framework, contributing tobuild up the weight of empirical evidence about XP andAgile Methods.
Also, we collected several metrics that were analyzedto understand their suitability to support diagnosing andtracking an agile project. Some of our findings in analyz-ing those metrics were:
• All projects had a higher desired score for everypractice, showing their willingness to improve in allXP practices. The difference between actual and de-sired scores can point the team to the most important
60
Danilo Sato, Dairton Bassi, Mariana Bravo,Alfredo Goldman and Fabio Kon
Experiences Tracking Agile Projects: anEmpirical Study
points of improvement.
• Retrospectives and their posters are complementarytools to tracking, helping the team to understand theproject pace. Even the teams that were not capableof tracking properly, could carry out good retrospec-tives and benefit from them.
• A low percentage of Level 2 and 3 personnel, ca-pable of tailoring the method to fit new situations,did not affect the successful adoption of an agileapproach in our projects. There are other person-nel factors that can influence the adoption of an ag-ile approach, such as the team experience and thecoach’s influence. Further investigation should beconducted to understand how the cultural changesimposed by an agile approach can influence the per-sonnel of a team, and how these changes can be con-sidered when classifying projects between an agileand plan-driven approach.
• Project 7 had a considerably larger average forWMC and class size, suggesting that it would bemore prone do faults (defects) and would requiremore maintenance and testing effort.
• The adoption of an agile approach resulted in classeswith an average WMC similar to the average WMCof classes from projects using different developmentprocesses. However, the average class size was sig-nificantly lower, which makes it less error prone andeasier for developers to understand and maintain.
• We propose a new metric to diagnose how well test-ing is going in a project. The Spearman’s rankcorrelation between our proposed Test Factor andthe team’s evaluation of Testing adoption was0.72,which is statistically significant at a 95% confidencelevel (p-value= 0.03382, N = 7).
• We propose a new metric to diagnose how well Con-tinuous Integration is going in a project. The Spear-man’s rank correlation between our proposed Inte-gration Factor and the team’s evaluation of Con-tinuous Integration adoption was−0.57 but notstatistically significant at a 95% confidence level(p-value= 0.1, N = 7) because of the small samplesize.
In future work, we plan to continue gathering moredata and more metrics to build a larger history for agileprojects. We are particularly interested in measuring de-fects and bugs after the projects are deployed in produc-tion, trying to correlate the level of XP adherence to thequality of the system as perceived by the final users. Itwould also be interesting to gather more data from agile
and non-agile projects to statistically confirm the suitabil-ity of the proposed metrics, and to propose new metricsto aid thetracker in diagnosing the adoption of differentagile practices. Finally, it would be interesting to com-pare similar projects adopting agile and non-agile meth-ods with respect to the speed and quality of the producedsoftware.
REFERENCES[1] Sakata Akinori. Niko-niko calendar web-
site. http://www.geocities.jp/nikonikocalendar/index_en.html,Jul. 2006.
[2] Victor R. Basili, Lionel C. Briand, and Walcélio L.Melo. A validation of object-oriented design metricsas quality indicators.IEEE Transactions on Soft-ware Engineering, 22(10):751–761, 1996.
[3] Kent Beck. Extreme Programming Explained: Em-brace Change. Addison-Wesley, 1st edition, 1999.
[4] Kent Beck and Cynthia Andres. Extreme Pro-gramming Explained: Embrace Change. Addison-Wesley, 2nd edition, 2004.
[5] Kent Beck et al. Manifesto for agile software devel-opment.http://agilemanifesto.org, Jul.2006.
[6] Barry Boehm and Richard Turner. BalancingAgility and Discipline: A Guide for the Perplexed.Addison-Wesley, 2003.
[7] Barry Boehm and Richard Turner. Using risk to bal-ance agile and plan-driven methods. InIEEE Com-puter, volume 36, pages 57–66, 2003.
[8] Piergiuliano Bossi. Extreme Programming applied:a case in the private banking domain. InProceedingsof OOP, Munich, 2003.
[9] S.R. Chidamber and C.F. Kemerer. A metrics suitefor object oriented design.IEEE Transactions onSoftware Engineering, 20(6):476–493, 1994.
[10] Alistair Cockburn. Agile Software Development.Addison-Wesley, 2002.
[11] Alistair Cockburn. Crystal Clear: A Human-Powered Methodology for Small Teams. Addison-Wesley Professional, 2004.
[12] Yael Dubinsky, David Talby, Orit Hazzan, and ArieKeren. Agile metrics at the israeli air force. InAgile2005 Conference, pages 12–19, 2005.
61
Danilo Sato, Dairton Bassi, Mariana Bravo,Alfredo Goldman and Fabio Kon
Experiences Tracking Agile Projects: anEmpirical Study
[13] Martin Fowler. Continuous integration.http://martinfowler.com/articles/continuousIntegration.html, Jul. 2006.
[14] Martin Fowler, Kent Beck, John Brant, WilliamOpdyke, and Don Roberts.Refactoring: Improv-ing the Design of Existing Code. Addison-Wesley,1999.
[15] Alexandre Freire da Silva, Fabio Kon, and CiceroTorteli. XP south of the equator: An experienceimplementing XP in Brazil. InProceedings of the6th International Conference on Extreme Program-ming and Agile Processes in Software Engineering(XP’2005), pages 10–18, 2005.
[16] Alfredo Goldman, Fabio Kon, Paulo J. S. Silva, andJoe Yoder. Being extreme in the classroom: Expe-riences teaching XP.Journal of the Brazilian Com-puter Society, 10(2):1–17, 2004.
[17] Eliyahu M. Goldratt.The Haystack Syndrome: Sift-ing Information Out of the Data Ocean. North RiverPress, 1991.
[18] Tibor Gyimóthy, Rudolf Ferenc, and István Siket.Empirical validation of object-oriented metrics onopen source software for fault prediction.IEEETransactions on Software Engineering, 31(10):897–910, 2005.
[19] Deborah Hartmann and Robin Dymond. Appropri-ate agile measurements: Using metrics and diagnos-tics to deliver business value. InAgile 2006 Confer-ence, pages 126–131, 2006.
[20] Jim Highsmith. Messy, exciting, and anxiety-ridden: Adaptive software development. InAmer-ican Programmer, volume 10, 1997.
[21] Ronald E. Jeffries, Ann Anderson, and ChetHendrickson. Extreme Programming Installed.Addison-Wesley, 2000.
[22] Capers Jones.Software Assessments, Benchmarks,and Best Practices. Addison Wesley, 2000.
[23] Mira Kajko-Mattsson, Ulf Westblom, StefanForssander, Gunnar Andersson, Mats Medin, SariEbarasi, Tord Fahlgren, Sven-Erik Johansson, Ste-fan Törnquist, and Margareta Holmgren. Taxonomyof problem management activities. InProceedingsof the Fifth European Conference on SoftwareMaintenance and Reengineering, pages 1–10, 2001.
[24] Norman L. Kerth.Project Retrospectives: A Hand-book for Team Reviews. Dorset House PublishingCompany, 2001.
[25] William Krebs. Turning the knobs: A coaching pat-tern for XP through agile metrics.XP/Agile Uni-verse 2002, LNCS 2418:60–69, 2002.
[26] Wei Li and Sallie Henry. Object oriented metricsthat predict maintainability. J. Systems and Soft-ware, 23:111–122, 1993.
[27] Kim Man Lui and Keith C.C. Chan. Test drivendevelopment and software process improvement inchina. InProceedings of the 5th International Con-ference on Extreme Programming and Agile Pro-cesses in Software Engineering (XP 2004), volume3092 ofLecture Notes on Computer Science, pages219–222, 2004.
[28] C. Mann and F. Maurer. A case study on the impactof scrum on overtime and customer satisfaction. InAgile 2005 Conference, pages 70–79, 2005.
[29] Thomas J. McCabe and Arthur H. Watson. Softwarecomplexity.Crosstalk: Journal of Defense SoftwareEngineering, 7:5–9, 1994.
[30] Jacques Morel et al. Xplanner website.http://www.xplanner.org, Jul. 2006.
[31] Roger A. Müller. Extreme programming in a uni-versity project. InProceedings of the 5th Inter-national Conference on Extreme Programming andAgile Processes in Software Engineering (XP 2004),volume 3092 ofLecture Notes on Computer Sci-ence, pages 312–315, 2004.
[32] Stephen R Palmer and John M. Felsing.A Practi-cal Guide to Feature Driven Development. PrenticeHall, 2002.
[33] Mary Poppendieck and Tom Poppendieck.LeanSoftware Development: An Agile Toolkit for Soft-ware Development Managers. Addison-Wesley,2003.
[34] Lawrence H. Putnam and Ware Meyers.MeasuresFor Excellence: Reliable Software On Time, WithinBudget. Yourdon Press Computing Series, 1992.
[35] Ken Schwaber and Mike Beedle.Agile Software De-velopment with Scrum. Alan R. Apt, 2001.
[36] Carolyn B. Seaman. Qualitative methods in empiri-cal studies of software engineering.IEEE Transac-tions on Software Engineering, 25:557–572, 1999.
[37] Jennifer Stapleton.DSDM: A framework for busi-ness centered development. Addison-Wesley Pro-fessional, 1997.
62
Danilo Sato, Dairton Bassi, Mariana Bravo,Alfredo Goldman and Fabio Kon
Experiences Tracking Agile Projects: anEmpirical Study
[38] Ramanath Subramanyam and M.S. Krishnan. Em-pirical analysis of CK metrics for object-orienteddesign complexity: Implications for software de-fects. IEEE Transactions on Software Engineering,29(4):297–310, 2003.
[39] Abbas Tashakkori and Charles Teddlie.MixedMethodology: Combining Qualitative and Quanti-tative Approaches. Sage Publications, 1998.
[40] Laurie Williams. Pair Programming Illuminated.Addison-Wesley Professional, 2002.
[41] Laurie Williams, William Krebs, Lucas Layman,and Annie I. Antón. Toward a framework for evalu-ating Extreme Programming. In8th InternationalConference on Empirical Assessment in SoftwareEngineering (EASE ’04), pages 11–20, 2004.
[42] Laurie Williams, Lucas Layman, and WilliamKrebs. Extreme Programming evaluation frame-work for object-oriented languages – version 1.4.Technical report, North Carolina State UniversityDepartment of Computer Science, 2004.
63