experimental and theoretical electron density distribution of
TRANSCRIPT

Carbohydrate Research 345 (2010) 1469–1481
Contents lists available at ScienceDirect
Carbohydrate Research
journal homepage: www.elsevier .com/locate /carres
Experimental and theoretical electron density distributionof a,a-trehalose dihydrate
Edwin D. Stevens a,*, Michael K. Dowd b, Glenn P. Johnson b, Alfred D. French b,*
a Department of Chemistry, University of New Orleans, New Orleans, LA 70148, USAb Southern Regional Research Center, ARS, USDA, New Orleans, LA 70124, USA
a r t i c l e i n f o a b s t r a c t
Article history:Received 16 January 2010Received in revised form 10 March 2010Accepted 14 March 2010Available online 17 March 2010
Keywords:CarbohydrateCrystal structureDisaccharideEnergyGradient vector fieldMycose
0008-6215/$ - see front matter � 2010 Elsevier Ltd. Adoi:10.1016/j.carres.2010.03.017
* Corresponding authors. Tel.: +1 504 280 6856; fatel.: +1 504 286 4410; fax: +1 504 286 4217 (A.D.F.).
E-mail addresses: [email protected] (E.D. Stevens),French).
a,a-Trehalose is of interest because of its cryoprotective and antidessicant properties, and because it pos-sesses various technical anomalies such as 13C NMR spectra that give misleading indications of intramolec-ular structural symmetry. It is a non-reducing disaccharide, with the glycosidic oxygen atom shared by theanomeric carbon atoms of the two glucose rings, and is therefore subject to a proposed ‘overlapping’ exo-anomeric effect. We report here a study of the electron density of trehalose with X-ray diffraction and quan-tum mechanics calculations, similar to a recent study of sucrose, also a non-reducing molecule. In particularwe studied the electron density around the glycosidic linkage and the hydrogen bonding with both defor-mation density and Atoms in Molecules (AIM) analyses. A total of 129,952 single crystal X-ray intensitymeasurements were collected on a,a-trehalose dihydrate to a resolution of sin h/k = 1.18 Å�1 at 100 Kand refined with an aspherical multipole model to a final agreement factor of R1 = 0.0160. Wavefunctionswere calculated at three levels of theory. Redistribution of electron density due to anomeric effects wasreduced in trehalose, compared to sucrose. Five new C–H� � �O hydrogen bonds were confirmed with bondcritical points and bond paths from AIM analyses, as were the previously proposed O–H� � �O hydrogenbonds.
� 2010 Elsevier Ltd. All rights reserved.
1. Introduction
According to the 1912 Handbook of Sugar Analysis,1 trehalose(a-D-glucopyranosyl-(1,1)-a-D-glucopyranose) was discovered byWiggers in fungi that grow on rye and other grasses. Also calledmycose or mushroom sugar, it constitutes 10–25% of the dryweight of mushrooms. Its more common name arises from itsprevalence in trehala manna, a secretion from beetles in Syriaand Iran. Not found in most higher plants, trehalose is present insubstantial quantity in the desert resurrection plant, Selaginellalepidophylla. It is now well known as a protectant against frostand dehydration and is commonly used in the laboratory for thepreservation of biomolecules,2,3 but proposed mechanisms of pro-tection are controversial.4 Trehalose also can prevent oxidation offatty acids in food and human skin.5 Three isomers of 1,1-linkedglucopyranosyl residues exist: a,a-trehalose, a,b-trehalose, andb,b-trehalose, with a,a-trehalose being so much more prevalentthat it is often simply called trehalose.
Trehalose is also of continuing interest because of unexpectedtechnical aspects. For example, the CP/MAS (cross polarization,
ll rights reserved.
x: +1 504 280 6860 (E.D.S.);
[email protected] (A.D.
magic angle spinning) NMR spectra of the dihydrate and anhy-drous forms contradict the crystallographic findings in that thetwo glycosidic linkage torsion angles / (O5–C1–O1–C10) and /0
(O50–C10–O1–C1) of the anhydrous form are nearly identical, butit still gives two well-resolved peaks for C1 and C10.6 On the otherhand, trehalose dihydrate, which has distinctly different linkagetorsion angles, gives a CP/MAS spectrum with only a single C1peak. Molecular modeling studies have been controversial as well,with some empirical force field studies suggesting that the pre-ferred conformation of the isolated (gas-phase) trehalose moleculeis not consistent with the exo-anomeric effect.7,8 The idea was thataqueous solution disrupted a strong intramolecular hydrogen bondthat stabilized the proposed gas-phase form, allowing other factorsto stabilize the solution phase form from which the various crystalsgrew. Subsequent quantum mechanical (QM) studies showed thatthis non-exo-anomeric form, with / and /0 = 180� was not the moststable form in the gas phase, but forms other than those seen incrystals were favored at some levels of theory.9 Other modelingstudies predicted the crystal structure conformations.10–12
In 1972, results were published from four determinations ofthe crystal structure of the dihydrate, all in good agreement.13,14
In 2008, the structure was determined again with modernmethods, at room temperature, as part of a study of hydrates.15
In addition, around 40 linkage geometries exist in crystalstructures of related molecules. All these linkages conform to

1470 E. D. Stevens et al. / Carbohydrate Research 345 (2010) 1469–1481
the exo-anomeric effect, that is, the values of / and /0 are in therange of 45.1–91.4�. None has intramolecular, inter-residue O–H� � �O hydrogen bonds that were predicted by some modelingmethods.
Besides providing information based on atom positions, high-resolution single-crystal X-ray diffraction measurements can beused to map the electron density distribution in crystalline sol-ids.16,17 The electron density distribution provides detailed three-dimensional information on the electronic structure of molecularsolids, and careful comparisons between experimental and theo-retical results indicate that experimental results are comparablein accuracy to large basis set ab initio theoretical calculations.18,19
Electron densities are often interpreted in terms of the ‘deforma-tion density’. It is obtained by subtracting the electron density ofa ‘promolecule’ that is composed of independent, overlapped,spherical atoms from the electron density determined by a multi-pole refinement of the X-ray data.16,17
Both experimental and theoretical electron densities can also beanalyzed using Atoms in Molecules (AIM) concepts developed byBader.20 AIM analyses initially focus on determining the criticalpoints in the electron density. They are found at nuclear centers,at the saddle point along the ridge of electron density connectingbonded atoms, at the centers of rings of bonded atoms, and inthe centers of cages of bonded atoms. The magnitude of the elec-tron density at the bond critical points (BCPs), q(rb), correlates withbond order. Also of interest is the Laplacian of the electron density,r2q(rb), at the BCP. Covalent bonds have large negative values ofr2q(rb), while hydrogen bonds and other closed shell interactionstypically have smaller positive r2q(rb) values.
Recently, a charge-density (electron-density) analysis of su-crose was published21 based on low-temperature X-ray diffractionmeasurements and on QM calculations. The experimental electrondensity was interpreted with deformation density methods, andAIM theory was applied to both the X-ray experiments and the the-oretical calculations. The crystal structure of sucrose has beendetermined even more often than that of trehalose, including onestudy by neutron diffraction. Despite the well-established struc-ture, new information emerged from the charge density study ofsucrose. One of the most intriguing results was the experimentalenergies of the different hydrogen bonds. Other results includedthe various electron density parameters, charges for the individualatoms, and the range of atomic volumes.
Other relevant previous experimental electron density deter-minations of b-DL-arabinose22 and 1,4-dioxane and trans-2,5-di-chloro-1,4-dioxane23 focused on the deformation densities of C–O covalent bonds and oxygen lone pairs associated with the ano-meric effect. Our similar efforts were undertaken to gain theinformation given above for trehalose. Trehalose, like sucrose, isa non-reducing disaccharide and its two monosaccharide residueshave head-to-head bonding and could be expected to have over-lapping24 exo-anomeric effects (in Ref. 24, the long C–O–C–O–C–O–C sequences were excluded in their survey because it was as-sumed that these extended sequences might perturb the statisticsof the more ordinary C–O–C–O–C sequences). Unlike the fairly la-bile sucrose molecule, the glycosidic linkage in trehalose is quitestable.25,26 The delocalization, as proposed in QM interpretationsof the general anomeric effect, of the lone pairs of electrons onthe shared glycosidic oxygen atom should be observable in thesecharge density studies.
The present redetermination of trehalose is considerably moreaccurate and a re-examination of the hydrogen bonding is war-ranted, as well as reporting of the C–H� � �O hydrogen bonds thatwere not considered previously. Compared to the sucrose study,the AIM analysis of the QM results has been expanded to includeintermolecular interactions.
2. Experimental measurements and theoretical calculations
2.1. Data collection and conventional refinement
Single crystals of a,a-trehalose dihydrate were obtained byrecrystallization from an aqueous solution. A colorless crystal withdimensions 0.60 � 0.50 � 0.45 mm3 was mounted on a BrukerSMART 1K CCD three-circle diffractometer. The sample was cooledto 100(2) K with a stream of cold N2 gas. The X-ray incident beamwas generated with a standard focus Mo target X-ray tube, graph-ite monochromator and 0.8 mm collimator, providing illuminationthat was uniform within ±5% throughout the sample volume.
X-ray intensities were measured with x scans at 0.30� incre-ments over a range of 180� at a crystal-to-detector distance of3.50 cm. A total of 11 scans were collected, six scans at 60 s perframe with the detector at 2h = 35� and / = 0�, 20�, 90�, 110�,180�, and 270�, and five scans at 120 s per frame with the detectorat 2h = 80� and / = 45�, 135�, 165�, 225�, and 315�. Since the N2
stream was coaxial with the x scan axis, and the v angle was fixedat 54.74�, the crystal mount remained at a fixed angle with respectto the cold stream throughout all the scans. Raw intensities wereintegrated with SAINT
27 and an empirical absorption correctionwas applied with SADABS.27 The ratio of the minimum to the maxi-mum transmission factors used in the absorption correction was0.985. The structure was solved and refined with a spherical atommodel with SHELXTL (Table 1).28 Results were also analyzed withPLATON.29
2.2. Multipole refinement
To obtain the experimental electron density distribution for thedihydrate, the diffraction data were refined with the Hansen–Cop-pens multipole deformation density model30 as implemented inXD2006.31 In this model, the density of each atom is represented byspherical core and valence densities calculated from Hartree–Fockatomic wavefunctions and an aspherical density contribution con-sisting of an expansion in Slater-type radial functions and sphericalharmonic angular functions (Eq. 1):
qatomðrÞ ¼ qcoreðrÞ þ Pvalencej3qvalenceðjrÞþ Rlj03Rlðj0rÞRmPl;mYl;mðh;/Þ ð1Þ
The spherical core density contribution, qcore(r), is fixed, while thevalence density contribution, qvalence(r), may be modified by therefinement of a valence population parameter, Pvalence, and anexpansion/contraction parameter, j. The aspherical density contri-butions are modified by refinement of a multipole populationparameter, Pl,m, for each density deformation function in the expan-sion up to the hexadecapolar (l = 4) level, and by refinement of asecond expansion/contraction parameter, j0. Thus, in addition tothe three positional parameters and six anisotropic thermal dis-placement parameters for each atom, the multipole model intro-duces up to an additional 27 parameters to describe the electrondistribution of each atom.
To reduce the number of variables, some parameters are con-strained during the refinement, for example, for chemically equiv-alent atoms21 or to impose symmetry on the density based on thelocal chemical environment.32 For trehalose, no chemical con-straints were imposed on the model. However, initial non-crystal-lographic site constraints were imposed. For example, for thehydroxyl O atoms, the local coordinate system and refined defor-mation parameters were chosen to impose a mirror plane symme-try in the plane defined by the O atom and the C and H atomsbonded to it. For the other oxygen atoms (including the two wateroxygen atoms), two mirror planes were imposed: one in the plane

Table 1Crystal data and refinement details for a,a-trehalose dehydrate
Crystal information and data collectionEmpirical formula C12H26O13
Formula weight 378.33Temperature 100(2) KWavelength, Mo Ka (Å) 0.71073Crystal system, space group orthorhombic, P212121
Unit cell dimensionsa (Å) 7.5609(2)b (Å) 12.2002(3)c (Å) 17.8482(4)a (�) 90b (�) 90c (�) 90
Volume (Å3)/Z 1646.40(7)/4Dcalcd (Mg/m3) 1.526Absorption coefficient (mm�1) 0.140Crystal size (mm3) 0.45 � 0.50 � 0.60(sin h/k)max (Å�1) 1.18Reflections collected 129,952Independent reflections (all data)
[Rint]10,816 [0.0277]
Redundancy 12.0Completeness to (sin h/k)max (%) 97.2Absorption correction empirical (tmin = 0.915,
tmax = 0.929)Spherical atom refinementRefinement method full-matrix least-squares on F2
Data/restraints/parameters 10,816/0/331Goodness-of-fit on F2 0.915Final R indices [I > 2r(I)] R1 = 0.0255, wR2 = 0.0603R indices (all data) R1 = 0.0351, wR2 = 0.0615Absolute structure parameter �0.06(14)Extinction coefficient 0.0357(11)Largest difference in peak and hole
(e �3)0.331 and �0.226
Multipole atom refinementRefinement method full-matrix least-squares on FNumber of data/parameters 10,816/671Number included [I > 2r(I)] 8638R1 [I > 2r(I)] 0.0160R1(all data) 0.0216wRF 0.0098Goodness-of-fit on F 1.154Nref/Nv 12.87
R1 = R||Fo| � |Fc||/R|Fo|.wR2 = [Rw(|Fo|2 � |Fc|2)2/Rw|Fo|4]1/2.wRF = [Rw(|Fo| � |Fc|)2/Rw|Fo|2]1/2.Goodness-of-fit = [Rw(|Fo|2 � |Fc|2)2/(Nref � Nv)]1/2.
E. D. Stevens et al. / Carbohydrate Research 345 (2010) 1469–1481 1471
of the oxygen and the two atoms bonded to it, and one in the per-pendicular plane bisecting the two covalent bonds. For the C2, C3,C4, C20, C30, and C40 atoms, a mirror plane was imposed on thedeformation density functions of the carbon atom in a plane pass-ing through the bonded H atom and the hydroxyl O atom. For C6and C60, a mirror plane was imposed in a plane defined by thebonded C and O atoms.
For hydrogen atoms, the positional parameters are strongly cor-related with the dipole density deformation directed along thecovalent bond, and simultaneous refinement cannot reliably deter-mine both parameters. Likewise, the H atom temperature factorsare correlated with the monopole and quadrapole deformationparameters. For trehalose, the hydrogen atom positions weredetermined by extending the H atom along the C–H or O–H bonddirections, as determined by the spherical atom refinement, toyield a C–H bond distance of 1.092 Å, a hydroxyl O–H bond dis-tance of 0.967 Å, and a water O–H bond distance of 0.960 Å, typicalof values found in neutron diffraction experiments. Refinementwas begun with hydrogen isotropic thermal parameters set atthe values determined in the spherical atom refinement, and shiftswere constrained to be equal to 150% of the shifts of the equivalent
isotropic thermal parameter of the C or O atoms to which theywere attached. With the hydrogen positional and thermal parame-ters thus constrained, only the valence monopole and the single di-pole and quadrapole deformation parameters directed along thecovalent bond axis were refined. After each cycle of refinement,the hydrogen atom positions were reset to maintain the specifiedbond lengths.
Six sets of j and j0 values were assigned: one set for the oxygenatoms of the hydroxyl groups, one set for the water oxygen atoms,one set for the other oxygen atoms, one set for the carbon atoms,one set for the hydrogen atoms bonded to carbon, and one setfor the hydrogen atoms bonded to oxygen. The small extinctioncoefficient from the spherical atom refinement was included as afixed value in the multipole refinement.
To test the validity of the deformation density model used inthe multipole refinement and the success of the deconvolution ofthe electron density and thermal motion, residual density mapscorresponding to the difference between the observed densityand the density calculated on the basis of the multipole modelwere calculated by Fourier summation (Eq. 2):
Dqresidual ¼ qobs � qmodel
¼ ð1=VÞRhkl½jFobsj � jFmodelj�e2piðhxþkyþlzÞ ð2Þ
Where significant features were observed in the residual density,site symmetry constraints on the deformation parameters were re-laxed and refinement continued until no areas remained with resid-ual density features greater than three times the estimatedstandard deviation in the residual density (estimated r(Dq) =0.051 e �3).
A further confirmation of the validity of the deformation densitymodel is provided by the rigid bond test.33 Anisotropic thermalatomic displacement parameters that have been successfullydeconvoluted from the molecular electron density distributionshould show equal mean square amplitudes of vibration alongthe bond direction for covalently bonded pairs of atoms. For themultipole refinement of trehalose, the average difference in meansquare amplitudes for bonds involving C and O atoms is only3 � 10�4 Å2, with the largest value 9 � 10�4 Å2 for the C6–O6 bond.
A plot of the static deformation density was calculated by tak-ing the difference between the sum of the atomic densities givenby Eq. 1, qmultipole model = Rqatom, and the sum of isolated, neutralatomic densities, qIAM = Rqspherical atom, the independent atommodel (IAM),
Dqdeformation density ¼ qmultipole model � qIAM ð3Þ
Topological properties of the experimental electron density dis-tribution based on AIM theory20 were calculated with the XDPROP
and TOPXD modules of XD2006.31 The estimated standard deviationsin the properties are calculated based on the uncertainties of themultipole population parameters obtained by least-squares refine-ment of the X-ray data.
2.3. Theoretical calculations
Electronic structure theory calculations were carried out withGAUSSIAN 0334 at three levels of theory: B3LYP/6-31+G(d,p), B3LYP/6-311++G(3df,3pd), and MP2(6-31+G(d,p). The wavefunctions werecalculated based on the coordinates of one asymmetric unit (one tre-halose molecule and two hydrogen-bonded water molecules) fromthe crystal structure determination. The resulting wavefunctionswere then processed with AIMAll35 to obtain the electron densities,the gradient squared (the Laplacian) of the electron densities, andthe ellipticities at each of the bond- and ring-critical points. Alsomonitored were the positive curvature components of the Laplacian,

1472 E. D. Stevens et al. / Carbohydrate Research 345 (2010) 1469–1481
k3, the AIM charges and the atomic volumes for each atom.MORPHY98
36 was used to confirm the AIMAll values and moleculargraphs were drawn with AIM2000, designed by F. Biegler-König andJ. Schönbohn ([email protected]).
To investigate the binding of the two water molecules, wave-functions were also calculated for clusters in which the crystallineenvironments of the water molecules were simulated by reducingthe surrounding trehalose molecules to methanol or other smallmolecules. This avoided having two (O7w) or three (O8w) full tre-halose molecules in the calculation, which would have made theAIM calculations too time consuming. These fragments of the tre-halose molecules retained their original coordinates except forthe hydrogen atoms that were added to provide chemically com-plete structures. If an oxygen atom, for example, the O1 or O5atom, was bonded to a carbon atom that was in turn bonded tothe donor or acceptor oxygen, both oxygen atoms were retained.The AIM analyses of these fragments interacting with wateryielded spurious bond paths and BCPs among the fragments. Thosebond paths and critical points were deleted.
Finally, to simulate the intermolecular hydrogen bond interac-tions between trehalose molecules in the X-ray structure, the the-oretical calculations (only at the B3LYP/6-311++G(3df,3pd) level)were carried out with glucose molecules included to simulate thecrystalline environment.
3. Results
3.1. Structure, electron density distribution, and topologicalanalysis
An ORTEP37 representation of the asymmetric unit of a,a-treha-lose dihydrate showing the thermal ellipsoids corresponding to the100 K atomic displacement parameters and the atom numberingscheme is plotted in Figure 1. At higher temperatures, the thermaldisplacement parameters are expected to be directly proportionalto absolute temperature. However, the average ratio of the equiv-alent isotropic displacement parameters of the oxygen and carbonatoms of trehalose at 100 K divided by the equivalent parametersof the corresponding atoms of sucrose at 20 K is only 2.2(4), lessthan expected from the 5:1 ratio of the temperatures. This may re-flect the effects of zero point motion of the lowest quantum vibra-
Figure 1. ORTEP37 representation of the molecular structure of a,a-trehalose dihydrate swith arbitrary radii.
tional states at very low temperatures, and stronger hydrogenbonding including the water molecules found in trehalose.
The molecular structure of trehalose at 100 K is not substan-tially different from the previous structure determinations.13–15
Atomic thermal displacement parameters are smaller, and atomsare slightly shifted because of the lower experimental tempera-ture. The lower standard deviations in the structural parametersreflect the significantly higher resolution of the data collected inthe current study.
Glucopyranosyl ring conformations are characterized by theirCremer–Pople puckering parameters38 and two variables of particu-lar interest to modeling 1,4-linked molecules.39 The unprimed ringhas puckering parameters of Q (amplitude) = 0.5705(3) Å, h =9.22(3)�, / = 97.18(17)�, and the primed ring has Q = 0.5377(3) Å,h = 4.16(3)�, and / = 63.2(4)�, all values typical of 4C1 conformations.The O1� � �O4 distance is 4.2124 Å and the O1� � �O40 distance is4.3267 Å. The average O1� � �O4 distance of 2582 glucose rings inthe Cambridge Structural Database40 is 4.356 Å, with a range of3.88–4.84 Å. The O1–C1� � �C4–O4 virtual torsion angles are�13.54� and �6.01� for the unprimed and primed rings, respec-tively. The latter value is very close to the average twist for glucoseresidues in non-macrocyclic molecules, whereas the former is closeto the most negative values found.39
Expectedly, deformation density maps show an increase in elec-tron density in all the covalent bonds relative to non-interacting,spherical atoms (Figs. 2 and 3). Additional increases in electrondensity are observed near the oxygen atoms corresponding tolone-pair charge concentrations. Unlike the experimental electrondeformation density of sucrose, in which significant differences inthe heights of the C–O deformation density peaks associated withthe anomeric effect were reported,21 the experimental deformationdensity of trehalose shows only slight differences in the C–O defor-mation density peaks. Also, differences similar to those observedbetween the lone-pair peaks in the experimental deformation den-sity of the endocyclic oxygen atom of b-DL-arabinose22 are not ob-served in the lone-pair peaks of trehalose.
In trehalose, BCPs are found in the experimental and theoreticaldensities (from the B3LYP/6-311++G(3df,3pd) wavefunction) for allcovalent and O–H hydrogen bonds, as well as for five previouslyunreported C–H� � �O hydrogen bonds (Tables 2 and 3). The lowerlevels of QM theory yielded similar results, but some variation
howing 50% thermal ellipsoids at 100 K. Hydrogen atoms are drawn as small spheres

Figure 2. Experimental static deformation density maps (a, c) and residual density maps (b, d) in the endocyclic C–O–C planes. Contours are plotted at 0.1 e Å�3 intervals withpositive contours represented by solid (blue) lines, negative contours by dashed (red) lines, and the zero contour by dotted (black) lines. (For interpretation of the referencesto colour in this figure legend, the reader is referred to the web version of this article.)
E. D. Stevens et al. / Carbohydrate Research 345 (2010) 1469–1481 1473
was seen for the closed shell interactions and not all levels of QMyielded the same weak interactions (Table S1). Laplacians andellipticities for both trehalose and sucrose are also given in Supple-mentary data (Table S2).
The total experimental electron densities at the BCPs are consis-tent for all the C–C bonds in trehalose (Table 2). The theoreticaldensities for the C–C bonds are also consistent, and in excellentagreement with the experimental results, as is the case for sucrose(Table 2). Consistent electron densities are also observed at theBCPs of the C–OH bonds in trehalose, but the theoretical densitiesare somewhat lower than the experimental values. Similar differ-ences in BCP densities are also observed for sucrose.21
For the trehalose anomeric sequence C5–O5–C1–O1–C10–O50–C50, a somewhat larger variation is observed in the experimentalelectron densities at the BCP, although this variation is less evidentin the bond peaks of the experimental deformation density. A sim-ilar pattern of variation is observed in the corresponding sucrosesequence C5–O5–C1–O1–C20–O20–C50, but the deviation from theaverage is larger than for trehalose. The theoretical calculations
of the electron density for both trehalose and sucrose at the bondcritical points show a similar pattern of variation of the C–O bondsof the anomeric sequence, but the theoretical values are againsomewhat lower than the experimental values.
The electron densities at the bond critical points for the O–Hand C–H covalent bonds are reasonably consistent, and there is areasonable agreement between the experimental and theoreticalvalues, and between the trehalose and sucrose results, given theinherent uncertainty associated with hydrogen parameters, theapproximate method for locating the H atom positions in the X-ray experiment, and the variable participation in, and strength of,hydrogen bonding interactions.
3.2. Hydrogen bonding
In addition to geometric criteria, topological analysis of the elec-tron density distribution provides additional parameters that char-acterize non-covalent interactions.41 All the O–H� � �O hydrogenbonds identified in previous studies are confirmed. In addition, a

Figure 3. Experimental static deformation density maps of the lone pair and hydrogen bond regions surrounding several oxygen atoms. Contours are plotted as in Figure 2,(a–c) are plotted in planes bisecting the C–O–C angles at O1 and O5 and the H–O–H angle at O7w, (d) is a plot of the deformation density in the plane of the O7w watermolecule.
1474 E. D. Stevens et al. / Carbohydrate Research 345 (2010) 1469–1481
number of weak C–H� � �O interactions, not previously recognized,have been identified based on interatomic distances and confirmedby the analysis of both the experimental and theoretical electrondensity distributions of trehalose dihydrate (Table 3). Geometricfeatures of these bonds are given as Supplementary data (TableS3). Each OH group acts as a hydrogen donor, as do each of the hydro-gen atoms of both water molecules. The oxygen atoms of each of thetrehalose OH groups also accept one O–H� � �O hydrogen atom, asdoes the O5 atom. The water oxygen O7 accepts one O–H� � �O hydro-gen bond (Fig. 5a), while the water oxygen O8 accepts 2 O–H� � �Ohydrogen bonds (Fig. 5b). The hydrogen bond distances, d(H� � �O),fall in the range 1.73–2.01 Å, the longest for the hydrogen bond toO5.
The experimental electron density gave BCPs for five C–H� � �Ohydrogen bonds in trehalose. Each of the water oxygen atoms(Fig. 5) accepts two C–H� � �O hydrogen bonds, and one intermolec-ular C–H� � �O hydrogen bond is formed between H610 and O50 on asymmetry-related molecule. The C–H� � �O hydrogen bond dis-tances, d(H� � �O), fall in the range 2.47–2.62 Å. Topological analysisof the electron density calculated from the theoretical B3LYP/6-
311++G(3df,3pd) wavefunction for the clusters of fragments thatsurround the two water molecules yields the same BCPs for theO–H� � �O and C–H� � �O interactions as found in the experimentaldata, plus an additional C–H� � �O interaction not observed in theexperimental density. It is between O8 and H50 of a symmetryrelated molecule. It is the longest and weakest of the C–H� � �Ointeractions, and corresponds to an electron density that is belowthe estimated uncertainty of the experimental density. Steinerand Saenger42 explored details of C–H� � �O hydrogen bonds in neu-tron diffraction studies. The extensive C–H� � �O bonding to water intrehalose is not unusual, but such interactions are not frequentlyreported. Another weak interaction in Table 3 that was not foundin the experimental density is between H50 and O2 within theasymmetric unit.
Examples of gradient trajectory plots of the hydrogen bondinteractions at O8w are given in Figure 4. No BCPs correspondingto intramolecular C–H� � �O interactions between axial sites, as sug-gested by Takahashi et al.,43,44 are observed in either the experi-mental or theoretical electron density distributions of trehalose.They had proposed such interactions, supported by Natural Bond

Table 2Experimentala and theoreticalb electron densities (q) at bond critical points (rb) and bond distances (d) for the covalent bonds of a,a-trehalose dihydrate and sucrosec
Bond q(rb) (e Å�3) d (Å)
Trehalose Sucrosec Trehalose Sucrosec
Exp. Theory Exp. Theory
O1–C1 1.97(1) 1.81 1.99(3) 1.76 1.4115(3) 1.4304(4)O1–C10 (O1–C20) 1.89(1) 1.72 1.85(3) 1.71 1.4212(3) 1.4388(4)O5–C1 1.95(1) 1.81 1.96(4) 1.80 1.4184(3) 1.4192(5)O50–C10 (O20–C20) 1.95(1) 1.84 2.05(3) 1.82 1.4050(3) 1.4146(5)O5–C5 1.80(1) 1.66 1.75(4) 1.63 1.4398(3) 1.4477(4)O50–C50 (O20–C50) 1.84(1) 1.68 1.71(4) 1.63 1.4342(3) 1.4543(5)O2–C2 1.80(1) 1.74 1.90(2) 1.69 1.4221(3) 1.4329(6)O20–C20 (O10–C10) 1.89(1) 1.76 1.84(2) 1.75 1.4219(3) 1.4344(5)O3–C3 1.88(1) 1.74 1.92(2) 1.71 1.4237(3) 1.4360(5)O30–C30 1.81(1) 1.75 1.95(2) 1.81 1.4265(4) 1.4131(4)O4–C4 1.87(1) 1.74 1.90(2) 1.75 1.4253(3) 1.4221(4)O40–C40 1.82(1) 1.73 1.95(2) 1.74 1.4310(4) 1.4272(4)O6–C6 1.81(1) 1.74 1.91(3) 1.72 1.4226(4) 1.4282(4)O60–C60 1.81(1) 1.71 1.84(2) 1.72 1.4235(4) 1.4349(4)C1–C2 1.77(1) 1.76 1.78(2) 1.71 1.5314(4) 1.5432(5)C10–C20 1.72(1) 1.74 1.82(3) 1.75 1.5365(4) 1.5310(5)C2–C3 1.69(1) 1.73 1.74(2) 1.72 1.5279(3) 1.5328(4)C20–C30 1.76(1) 1.75 1.77(2) 1.69 1.5241(3) 1.5492(4)C3–C4 1.77(1) 1.73 1.75(1) 1.72 1.5288(3) 1.5330(5)C30–C40 1.75(1) 1.74 1.75(2) 1.72 1.5270(3) 1.5320(5)C4–C5 1.71(1) 1.72 1.72(2) 1.71 1.5319(3) 1.5351(5)C40–C50 1.74(1) 1.72 1.80(2) 1.70 1.5296(3) 1.5372(4)C5–C6 1.79(1) 1.74 1.74(3) 1.72 1.5241(3) 1.5301(5)C5–C60 1.80(1) 1.77 1.76(3) 1.75 1.5167(3) 1.5217(5)O2–H(O2) 2.24(4) 2.45 2.17(6) 2.48 0.967 0.9718O20–H(O20) (O10–H(O10)) 2.27(4) 2.51 2.43(7) 2.47 0.967 0.9732O3–H(O3) 2.34(4) 2.49 2.17(6) 2.58 0.967 0.9584O30–H(O30) 2.29(4) 2.51 2.30(6) 2.51 0.967 0.9676O4–H(O4) 2.45(4) 2.48 2.39(7) 2.92 0.967 0.9112O40–H(O40) 2.39(4) 2.49 2.24(6) 2.46 0.967 0.9758O6–H(O6) 2.27(4) 2.51 2.39(7) 2.59 0.967 0.9550O60–H(O60) 2.21(3) 2.49 2.25(6) 2.48 0.967 0.9706O7w–H71 2.44(3) 2.47 0.960O7w–H72 2.55(3) 2.42 0.960O8w–H81 2.36(3) 2.43 0.960O8w–H82 2.35(3) 2.47 0.960C1–H1 1.91(1) 1.98 1.95(5) 1.97 1.092 1.1028C10–H10 (C10–H110) 1.87(1) 1.98 1.84(2) 1.93 1.092 1.0950C2–H2 1.85(1) 1.93 1.92(2) 1.92 1.092 1.1039C20–H20 (C10–H120) 1.85(1) 1.93 1.83(2) 1.96 1.092 1.0909C3–H3 1.90(1) 1.93 1.91(2) 1.95 1.092 1.0971C30–H30 1.77(1) 1.93 1.91(2) 1.93 1.092 1.1022C4–H4 1.84(1) 1.94 1.92(2) 1.93 1.092 1.1023C40–H40 1.83(1) 1.93 1.91(2) 1.95 1.092 1.0967C5–H5 1.84(1) 1.94 1.78(4) 1.92 1.092 1.1033C50–H50 1.83(1) 1.94 1.81(5) 1.92 1.092 1.1027C6–H61 1.79(1) 1.93 1.87(2) 2.01 1.092 1.0828C6–H62 1.83(1) 1.92 1.83(2) 1.97 1.092 1.0907C60–H610 1.75(1) 1.94 1.86(2) 1.97 1.092 1.0880C60–H620 1.74(1) 1.92 1.82(2) 1.95 1.092 1.0929C–Cave
d 1.75(4) 1.74(2) 1.76(3) 1.72(2)C–OHave
d 1.84(4) 1.74(1) 1.90(4) 1.74(4)C–OCave
d 1.90(7) 1.75(8) 1.89(14) 1.73(8)O–Have
d 2.35(10) 2.48(3) 2.29(10) 2.56(15)C–Have
d 1.83(5) 1.94(2) 1.87(5) 1.95(3)
a From the XDPROP module of XD2006.b From B3LYP (6-311++G(3df,3pd)) wavefunction and AIMAll.c From Ref. 21.d Standard deviations in the average values calculated from the distribution of the observed densities.
E. D. Stevens et al. / Carbohydrate Research 345 (2010) 1469–1481 1475
Order calculations, to help account for the anomeric and exo-ano-meric effects.
In previous experimental and theoretical studies45 including su-crose,21 good exponential correlations have been observed be-tween the donor–acceptor distance, d(H� � �A), and the topologicalproperties of the electron density including q(rb), r2q(rb), andespecially k3, the positive eigenvalue of the Hessian matrix of sec-ond derivatives of the electron density. A similar correlation is ob-served for the current study (Fig. 6). It is interesting that the weak
C–H� � �O interactions fit the same curve as the stronger O–H� � �Ointeractions.
Proposed density functionals46–48 relate the local kinetic en-ergy, the local potential energy, the total energy density, and fromthem the binding energy of a hydrogen bond or other closed shellinteraction, to the values of q(rb) and r2q(rb) at the BCP. Theserelationships were used to estimate the energies of the hydrogenbonds from the experimental electron density distribution of su-crose.21 For trehalose, the same procedure has been used with

Table 3Experimentala and theoreticalb electron densities (q), Laplacians (r2q), and positive curvature (k3) at the bond critical points (rb) and estimated bond dissociation energiesc forthe hydrogen bonds in a,a-trehalose dihydrate
Hydrogen bond d(H� � �A) (Å) q(rb) (e A�3) r2q (rb) (e Å�5) k3 (e Å�5) EHB (kJ mol�1)
Exp. Theory Exp. Theory Exp. Theory Exp. Theory Ref. 50d
O–H� � �OO2–H(O2)� � �O7w 1.76 0.21(2) 0.27 3.50(3) 2.63 6.03 5.96 39.1 44.0 44.9O3–H(O3)� � �O30e 1.81 0.20(1) 0.23 2.32(2) 2.60 4.83 5.23 31.9 38.2 37.2O4–H(O4)� � �O5f 2.01 0.09(1) 0.14 2.33(1) 1.97 3.33 3.31 16.2 21.3 18.3O6–H(O6)� � �O40g 1.79 0.24(2) 0.24 3.23(3) 2.77 5.84 5.63 43.7 42.0 40.7O7w–H71� � �O3h 1.84 0.13(1) 0.21 3.69(1) 1.83 5.15 4.85 27.2 31.9 33.2O7w–H72� � �O60 1.80 0.18(1) 0.25 3.33(3) 2.45 5.72 5.47 33.1 38.4 33.2O8w–H81� � �O2 1.80 0.22(1) 0.25 2.75(2) 2.49 5.62 5.43 37.6 37.8 39.3O8w–H82� � �O20 i 1.73 0.26(1) 0.28 3.64(2) 1.91 6.92 6.39 49.7 39.4 49.6O20–H(O20)� � �O8wj 1.85 0.26(1) 0.22 3.57(2) 1.50 4.65 4.92 49.3 32.4 32.3O30–H(O30)� � �O4h 1.90 0.14(1) 0.18 2.61(1) 2.21 4.16 4.13 23.7 18.9 27.0O40–H(O40)� � �O8w 1.89 0.18(1) 0.20 1.33(2) 2.21 3.80 4.36 24.0 28.3 27.6O60–H(O60)� � �O6k 1.75 0.29(1) 0.27 3.38(1) 2.86 6.51 6.11 55.1 47.2 46.7
C–H� � �OC6–H62� � �O7wl 2.58 0.02(1) 0.05 0.62(1) 0.35 0.78 0.94 3.3 3.9 2.4C10–H10 � � �O7wl 2.59 0.05(1) 0.05 0.51(1) 0.35 0.93 0.92 4.4 3.8 2.2C3–H3� � �O8wj 2.62 0.02(1) 0.04 0.47(1) 0.29 0.63 0.79 2.6 2.9 2.0C30–H30 � � �O8w 2.47 0.03(1) 0.07 1.06(1) 0.45 1.46 1.21 5.7 4.9 3.5C50–H50 � � �O8w 2.84 0.04 0.27 0.62 2.6 0.9C50–H50 � � �O2n 2.75 0.04 0.49 0.68 3.7 1.3C60–H610 � � �O50m 2.58 0.04(1) 0.06 1.03(1) 0.81 1.14 1.39 6.1 6.6 2.3
a From the XDPROP module of XD2006.b From B3LYP 6-311++G(3df,3pd) wavefunction with AIMAll.c Bond energy calculated with the functionals of Ref. 46.d Bond energy calculated from d(H� � �A) distance with the expression given in Ref. 50.e [x � 1/2, �y + 1/2, �z].f [�x + 1, y + 1/2, �z + 1/2].g [�x + 1/2, �y, z + 1/2].h [�x, y � 1/2, �z + 1/2].i [x � 1, y, z].j [x + 1/2, �y + 1/2, �z].k [�x + 1, y � 1/2, �z + 1/2].l [x + 1, y, z].
m [x � 1/2, �y � 1/2, �z].n Based on asymmetric unit, not an artificial cluster.
Figure 4. Gradient trajectory plots of the experimental electron density distribution near the O(8w) water molecule. Gradient trajectories (red lines) originate at atomiccenters and terminate at bond critical points (blue circles), ring critical points (green circles), or cage critical points (red circles). Bond paths corresponding to covalent bondsare indicated by solid (black) lines, and bond paths corresponding to hydrogen bonds are indicated by dashed (black) lines. Zero flux surfaces, which define the boundaries ofatomic basins, are also indicated by solid (black) lines. On the left are the gradient trajectories corresponding to the atoms involved in the O40–H(O40)� � �O8w and O2� � �H81–O8w hydrogen bonds. On the right are the gradient trajectories corresponding to the C30–H30 � � �O8w and C3–H3� � �O8w hydrogen bonds. (For interpretation of the referencesto colour in this figure legend, the reader is referred to the web version of this article.)
1476 E. D. Stevens et al. / Carbohydrate Research 345 (2010) 1469–1481

Figure 5. Molecular graph representations of hydrogen bonds to water molecules O7w (left) and O8w (right) modeled using fragments of the trehalose molecules. Smallspheres (red) are bond critical points, larger spheres are oxygen (red), carbon (black), and hydrogen (gray). Dashed lines (black) are hydrogen bonds and solid lines (pink) arecovalent bonds. All indicated bonds were found by AIM analysis of both the B3LYP/6-311++G(3df,3pd) calculations and the X-ray diffraction measurements. An additionalbond, from H50 to O7w, was found in the B3LYP/6-31+G(d,p) calculations but not confirmed with the larger basis set or the diffraction experiment. The drawing was madewith the aid of AIM2000. (For interpretation of the references to colour in this figure legend, the reader is referred to the web version of this article.)
Figure 6. Plot of the positive curvature (k3) of the electron density (e Å�5) at thebond critical points in the O–H� � �O and C–H� � �O hydrogen bonds of trehalose as afunction of the H� � �O donor–acceptor distances (Å).
E. D. Stevens et al. / Carbohydrate Research 345 (2010) 1469–1481 1477
both the experimental and theoretical electron density distribu-tions (Table 3). However, the bond energies obtained by thismethod for some of the O–H� � �O hydrogen bonds found in bothsucrose and trehalose are considerably higher (40–55 kJ mol�1)than values commonly accepted for such hydrogen bondinteractions.49
Since the topological properties of the electron density innon-covalent interactions depend exponentially on the d(H� � �A)donor–acceptor distance, it is not surprising that the energy calcu-lated from the topological properties would also show an exponen-tial dependence on the donor–acceptor distance. Such arelationship has been obtained by Espinosa et al.,50 based on a fitof the hydrogen bond energies calculated from the topologicalproperties from a large number of experimental studies. The bondenergy values calculated for trehalose from the Espinosa expres-sion50 are also listed in Table 3.
Our scan of inter-atomic geometries in the sucrose structurewith PLATON29 revealed ten potential C–H� � �O interactions, inaddition to the nine O–H� � �O bonds reported previously.21 The to-tal energy for all hydrogen bonds calculated from the Espinosaexpression, including the energies of the C–H� � �O interactionsbut excluding hydrogen bonds within the asymmetric unit, is213.6 kJ per sucrose molecule. The corresponding total energy fortrehalose dihydrate is 293.9 kJ, indicating substantially morehydrogen bonding in this crystal form of trehalose than in sucrose.
3.3. Atomic charges and volumes
In AIM theory, the electron density of a molecule is partitionedinto atoms by finding the surfaces between atoms where the elec-tron density is at a minimum. These surfaces, as well as the exte-rior surface of 0.001 e/a.u. (0.00675 e �3), encompass quiteirregular shapes that none-the-less logically and consistently de-fine the volumes of the individual atoms. In turn, this permitsthe assignment of electron density to a specific atom and hencedetermines the atomic charge. Irregular atom shapes are generallyobtained from the zero-flux surfaces (e.g., Fig. 4a and b). Because ofthe irregular shape, integrations of the volume can be difficult, andthese volumes and charges have not been shown to be useful ingeneral empirical force fields. Within a given molecule or a seriesof similar compounds, however, helpful information is provided.
AIM charges for the oxygen atoms and the hydroxyl hydrogenatoms are in a reasonable agreement for both experimental datasets and the theoretical values, as are the observed and theoreticalwater hydrogen atoms (Table 4). The O1, O5, and O50 atom chargesare among the smallest for oxygen atoms. The experimental treha-lose carbon charges are much lower than their theoretical counter-parts, but both show high relative positive charges for C1 and C10.The sucrose oxygen charges for the ring oxygen atoms were alsolowest, followed by an exo-cyclic O3 and then the glycosidic oxy-gen atom. Experimental charges on the methine hydrogens of tre-halose were all much larger than on the comparable atoms insucrose or the theoretical calculations. As shown in Table S1, thetheoretical charge and volume data are remarkably independentof level of QM theory.
For the experimental data, a primary test for the validity of theAIM calculations is to compare the sums of all the calculated

Table 4Net atomic charges (q) and theoretical and experimental integrated atomic volumes (V001 and V tot) in a,a-trehalose dihydrate
Atom Trehalosea,b (q, e) Vtot (Å3) V001 (Å3) Sucrosec (q, e) Vtot, (Å3) V001 (Å3)
Exp. Theory Exp. Exp. Theory Exp. Exp. Exp.
O1 �1.08 �1.10 11.33 9.61 11.94 �1.04 12.30 12.23O2 �1.07 �1.19 15.75 11.35 16.32 �1.13 16.86 15.54O20 (O10) �1.04 �1.08 16.82 11.01 17.80 �1.09 16.26 15.27O3 �1.06 �1.12 17.56 11.32 18.08 �1.03 18.23 16.17O30 �1.11 �1.09 20.08 12.02 17.97 �1.14 16.21 15.41O4 �1.16 �1.11 16.33 11.87 17.96 �1.07 16.98 15.65O40 �1.17 �1.15 16.61 11.79 17.83 �1.11 17.91 16.09O5 �1.02 �1.08 13.16 10.29 14.69 �0.98 11.85 11.69O50 (O20) �1.02 �1.11 12.97 10.19 14.36 �0.99 12.74 12.23O6 �1.14 �1.10 17.68 12.03 17.97 �1.16 15.73 15.49O60 �1.02 �1.12 18.20 11.38 16.86 �1.10 16.93 15.53C1 0.39 1.00 6.13 5.58 5.09 0.62 5.76 5.74C10 (C20) 0.49 1.01 6.17 5.59 5.20 0.72 4.86 4.86C2 0.06 0.55 6.81 6.26 5.89 0.53 5.75 5.75C20 (C10) 0.09 0.56 6.60 6.21 6.05 0.34 7.56 7.56C3 0.15 0.54 6.38 6.05 5.94 0.53 5.62 5.60C30 0.11 0.53 6.41 6.11 5.78 0.53 5.83 5.78C4 0.22 0.54 6.38 6.03 5.86 0.51 5.73 5.73C40 0.09 0.53 6.58 6.20 5.96 0.53 5.89 5.89C5 0.05 0.50 6.71 6.44 6.05 0.36 6.82 6.76C50 �0.01 0.49 6.69 6.39 5.86 0.33 6.70 6.69C6 �0.01 0.58 8.65 7.39 7.16 0.35 8.17 7.91C60 0.15 0.55 8.15 6.89 7.24 0.35 8.25 7.84H(O2) 0.68 0.64 1.49 1.14 1.71 0.67 1.67 1.66H(O20) (H(O10)) 0.68 0.56 1.77 1.42 3.48 0.51 2.28 2.19H(O3) 0.74 0.58 1.31 1.09 3.40 0.56 2.23 2.24H(O30) 0.62 0.57 2.00 1.63 3.37 0.69 1.40 1.40H(O4) 0.70 0.58 1.72 1.39 3.34 0.60 2.52 2.45H(O40) 0.69 0.61 1.51 1.20 1.98 0.64 1.60 1.58H(O6) 0.67 0.56 1.65 1.41 3.53 0.63 1.59 1.59H(O60) 0.63 0.58 1.85 1.67 3.35 0.55 2.29 2.17H1 0.29 0.03 4.99 2.88 6.60 0.15 4.55 4.47H10 (H110) 0.30 0.03 6.23 3.57 6.90 0.16 5.29 5.29H2 0.32 0.00 7.35 3.19 7.25 �0.02 7.19 5.82H20 (H120) 0.42 0.02 4.58 2.32 7.08 0.14 6.40 6.14H3 0.34 0.01 4.29 2.50 6.82 �0.04 6.22 5.99H30 0.21 0.01 5.74 3.73 6.01 �0.02 6.23 5.68H4 0.41 0.01 5.78 2.66 6.67 �0.02 5.99 5.29H40) 0.36 0.00 5.77 2.84 7.20 �0.03 6.18 5.45H5 0.25 0.02 6.01 3.26 6.92 0.22 6.92 5.69H50 0.24 0.00 5.70 1.59 5.56 0.17 6.40 5.35H61 0.30 0.03 5.65 3.07 6.98 0.16 7.92 5.98H610 0.22 0.04 6.68 4.46 6.74 0.15 5.41 5.37H62 0.32 -0.01 6.47 3.45 7.37 0.15 7.05 5.95H620 0.18 0.00 8.10 4.22 7.23 0.15 7.66 5.67O7w �1.07 �1.22 26.43 13.32 20.85O8w �1.03 �1.22 21.23 12.45 20.71H72 0.64 0.64 1.48 1.28 1.72H71 0.68 0.58 1.55 1.22 3.38H82 0.63 0.57 2.27 1.48 3.46H81 0.67 0.64 1.61 1.32 1.74Total �0.06 0.00 409.32 283.74 425.22 0.03 353.93 330.83
a From the TOPXD module of XD2006.b From B3LYP 6-311++G(3df,3pd) wave function and AIMAll.c From Ref. 21.
1478 E. D. Stevens et al. / Carbohydrate Research 345 (2010) 1469–1481
atomic volumes and charges. The volumes can be compared withthe unit cell volume, or, in this case, one-fourth of that volumewhich corresponds to the asymmetric unit, and the charges shouldadd to neutrality. The integrated atomic charges computed fromthe QM wavefunction should also add to zero for the asymmetricunit of trehalose, and they did. The experimental sums for treha-lose and sucrose were �0.06 and 0.03, respectively (Table 4). Thesum of the theoretical volumes, on the other hand, is not directlycomparable because our calculations did not consider the entiremolecular environment. From the unit cell dimensions, the volumeof the asymmetric unit is 411 Å3, and the integrated experimentalvolume is a close 409.31 Å3. The three levels of theory all yieldedresults within 0.5 Å3 of the B3LYP/6-311++G(3df,3pd) value of425.2 Å3. One would expect the value calculated for the isolated
asymmetric unit to be larger than when in the crystal environmentbecause the volumes of hydrogen atoms that are being donated inhydrogen bonds are smaller than those that are not involved.41 Ourunpublished B3LYP calculations on the methanol dimer indicate avolume decrease of about 1.5 Å3 for donated hydroxyl protons,compared to the hydroxyl proton on an isolated molecule. This re-duced volume is also seen for the theoretical volumes for HO2,HO40, H72, and H81 atoms that are involved with hydrogen bondsto or from the water molecules (Tables 4 and S1). The five intermo-lecular hydrogen bonds that are not part of the asymmetric unitwould account for about 7.5 Å3 of the 14.2 Å3 discrepancy betweenthe volumes from the isolated molecule and the asymmetric unit.
The smallest oxygen atom in trehalose is O1, followed by thering oxygen atoms, the hydroxyl oxygen atoms, and then the water
E. D. Stevens et al. / Carbohydrate Research 345 (2010) 1469–1481 1479
oxygen atoms. The smallest sucrose oxygen atom is O5, followedby the glycosidic O20 and the furanosyl ring oxygen atom, withthe hydroxyl oxygen atoms all larger. The trends in the trehalosedata were confirmed by the calculations. The carbon atoms had asmaller range of volumes, with the anomeric carbons C1 and C10
of the trehalose having the smallest values. The C6 and C60 carbonswere largest, with reasonable prediction of the trends by the calcu-lations. In sucrose, the anomeric centers were on a par with thethree primary alcohol carbons, C10, C6, and C60.
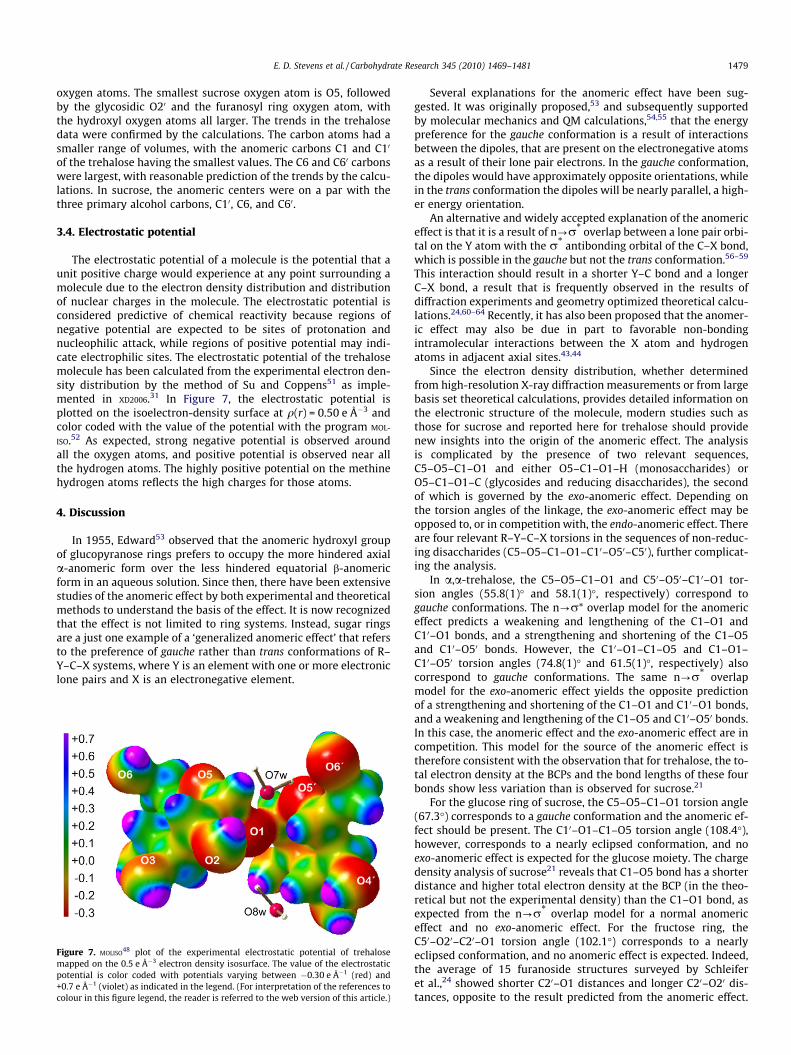
3.4. Electrostatic potential
The electrostatic potential of a molecule is the potential that aunit positive charge would experience at any point surrounding amolecule due to the electron density distribution and distributionof nuclear charges in the molecule. The electrostatic potential isconsidered predictive of chemical reactivity because regions ofnegative potential are expected to be sites of protonation andnucleophilic attack, while regions of positive potential may indi-cate electrophilic sites. The electrostatic potential of the trehalosemolecule has been calculated from the experimental electron den-sity distribution by the method of Su and Coppens51 as imple-mented in XD2006.31 In Figure 7, the electrostatic potential isplotted on the isoelectron-density surface at q(r) = 0.50 e �3 andcolor coded with the value of the potential with the program MOL-
ISO.52 As expected, strong negative potential is observed aroundall the oxygen atoms, and positive potential is observed near allthe hydrogen atoms. The highly positive potential on the methinehydrogen atoms reflects the high charges for those atoms.
4. Discussion
In 1955, Edward53 observed that the anomeric hydroxyl groupof glucopyranose rings prefers to occupy the more hindered axiala-anomeric form over the less hindered equatorial b-anomericform in an aqueous solution. Since then, there have been extensivestudies of the anomeric effect by both experimental and theoreticalmethods to understand the basis of the effect. It is now recognizedthat the effect is not limited to ring systems. Instead, sugar ringsare a just one example of a ‘generalized anomeric effect’ that refersto the preference of gauche rather than trans conformations of R–Y–C–X systems, where Y is an element with one or more electroniclone pairs and X is an electronegative element.
Figure 7. MOLISO48 plot of the experimental electrostatic potential of trehalose
mapped on the 0.5 e �3 electron density isosurface. The value of the electrostaticpotential is color coded with potentials varying between �0.30 e �1 (red) and+0.7 e �1 (violet) as indicated in the legend. (For interpretation of the references tocolour in this figure legend, the reader is referred to the web version of this article.)
Several explanations for the anomeric effect have been sug-gested. It was originally proposed,53 and subsequently supportedby molecular mechanics and QM calculations,54,55 that the energypreference for the gauche conformation is a result of interactionsbetween the dipoles, that are present on the electronegative atomsas a result of their lone pair electrons. In the gauche conformation,the dipoles would have approximately opposite orientations, whilein the trans conformation the dipoles will be nearly parallel, a high-er energy orientation.
An alternative and widely accepted explanation of the anomericeffect is that it is a result of n?r* overlap between a lone pair orbi-tal on the Y atom with the r* antibonding orbital of the C–X bond,which is possible in the gauche but not the trans conformation.56–59
This interaction should result in a shorter Y–C bond and a longerC–X bond, a result that is frequently observed in the results ofdiffraction experiments and geometry optimized theoretical calcu-lations.24,60–64 Recently, it has also been proposed that the anomer-ic effect may also be due in part to favorable non-bondingintramolecular interactions between the X atom and hydrogenatoms in adjacent axial sites.43,44
Since the electron density distribution, whether determinedfrom high-resolution X-ray diffraction measurements or from largebasis set theoretical calculations, provides detailed information onthe electronic structure of the molecule, modern studies such asthose for sucrose and reported here for trehalose should providenew insights into the origin of the anomeric effect. The analysisis complicated by the presence of two relevant sequences,C5–O5–C1–O1 and either O5–C1–O1–H (monosaccharides) orO5–C1–O1–C (glycosides and reducing disaccharides), the secondof which is governed by the exo-anomeric effect. Depending onthe torsion angles of the linkage, the exo-anomeric effect may beopposed to, or in competition with, the endo-anomeric effect. Thereare four relevant R–Y–C–X torsions in the sequences of non-reduc-ing disaccharides (C5–O5–C1–O1–C10–O50–C50), further complicat-ing the analysis.
In a,a-trehalose, the C5–O5–C1–O1 and C50–O50–C10–O1 tor-sion angles (55.8(1)� and 58.1(1)�, respectively) correspond togauche conformations. The n?r* overlap model for the anomericeffect predicts a weakening and lengthening of the C1–O1 andC10–O1 bonds, and a strengthening and shortening of the C1–O5and C10–O50 bonds. However, the C10–O1–C1–O5 and C1–O1–C10–O50 torsion angles (74.8(1)� and 61.5(1)�, respectively) alsocorrespond to gauche conformations. The same n?r* overlapmodel for the exo-anomeric effect yields the opposite predictionof a strengthening and shortening of the C1–O1 and C10–O1 bonds,and a weakening and lengthening of the C1–O5 and C10–O50 bonds.In this case, the anomeric effect and the exo-anomeric effect are incompetition. This model for the source of the anomeric effect istherefore consistent with the observation that for trehalose, the to-tal electron density at the BCPs and the bond lengths of these fourbonds show less variation than is observed for sucrose.21
For the glucose ring of sucrose, the C5–O5–C1–O1 torsion angle(67.3�) corresponds to a gauche conformation and the anomeric ef-fect should be present. The C10–O1–C1–O5 torsion angle (108.4�),however, corresponds to a nearly eclipsed conformation, and noexo-anomeric effect is expected for the glucose moiety. The chargedensity analysis of sucrose21 reveals that C1–O5 bond has a shorterdistance and higher total electron density at the BCP (in the theo-retical but not the experimental density) than the C1–O1 bond, asexpected from the n?r* overlap model for a normal anomericeffect and no exo-anomeric effect. For the fructose ring, theC50–O20–C20–O1 torsion angle (102.1�) corresponds to a nearlyeclipsed conformation, and no anomeric effect is expected. Indeed,the average of 15 furanoside structures surveyed by Schleiferet al.,24 showed shorter C20–O1 distances and longer C20–O20 dis-tances, opposite to the result predicted from the anomeric effect.

1480 E. D. Stevens et al. / Carbohydrate Research 345 (2010) 1469–1481
On the other hand, the C1–O1–C20–O20 torsion angle (�44.3�) mostclosely corresponds to a gauche conformation, and an exo-anomericeffect is expected. The n?r* overlap model for the exo-anomericeffect predicts a strengthening and shortening of the C20–O1 bond,and a weakening and lengthening of the C20–O20 bond. This predic-tion is opposite to what was found in the change density analysisof sucrose, where the C20–O1 bond is longer and has a lower elec-tron density at the BCP than the C20–O20 bond.
5. Conclusions
High resolution single crystal X-ray measurements of a,a-tre-halose dihydrate at 100 K and theoretical calculations with large-basis-set wavefunctions of the trehalose asymmetric unit andhydrogen bonded clusters have been successfully used to obtainthe electron density distribution and associated electronic proper-ties. The experimental and theoretical electron densities have beenanalyzed with Bader0s AIM theory to obtain properties that charac-terize the topology of the electron distribution such as BCPs, thedensity and Laplacian of the density at the BCPs, atomic chargesand atomic volumes. Overall, the values of the various parametersare in good agreement between theory and experiment, and be-tween the trehalose values and those obtained from the previousstudy of sucrose. The topological analysis provides clear evidenceof the presence in trehalose of C–H� � �O hydrogen bond interactionsin addition to previously noted O–H� � �O hydrogen bonds. The mag-nitudes of the total electron density at the BCPs in the C–O bondsalong with the associated bond distances have been used to inves-tigate the influence of the anomeric and exo-anomeric effects intrehalose and sucrose. In trehalose, there appears to be a competi-tion between the anomeric and exo-anomeric effects that results inreduced variation in the bond distances and electron densities atthe BCPs of the C–O bonds to the anomeric carbon atoms consis-tent with the predictions of the n?r* overlap model. The predic-tions of the model also agree with the results of the electrondensity analysis for the glucose ring but not for the fructose ringof sucrose.
Supplementary data
Crystallographic data for the structural analysis have beendeposited with the Cambridge Crystallographic Data Center, CCDCNo. 762205. Copies of this information may be obtained free ofcharge from the Director, Cambridge Crystallographic Data Center,12 Union Road, Cambridge, CB2 1EZ, UK (fax: +44-1223-336033,email: [email protected] or via: http://www.ccdc.cam.ac.uk).Supplementary data (Table S1) also include the AIM analysis resultsobtained from the B3LYP/6-31+G(d,p) and MP2(6-31+G(d,p) calcu-lations as well as a brief discussion. Table S2 compares the experi-mental and theoretical Laplacians, r2q(rb) (in e �5), andellipticities, e, for the covalent bonds in trehalose dihydrate andsucrose. Table S3 contains more complete hydrogen bondinggeometries. Supplementary data associated with this article can befound, in the online version, at doi:10.1016/j.carres.2010.03.017.
References
1. Browne, C. A. A Handbook of Sugar Analysis; John Wiley: New York, 1912(available from Google Books On-Line).
2. Crowe, J. H.; Crowe, L. M.; Chapman, D. Science 1984, 223, 701–703.3. Newman, Y. M.; Ring, S. G.; Colaco, C. Biotechnol. Genet. Eng. Rev. 1993, 11, 263–
294.4. Sola-Penna, M.; Meyer-Fernandes, J. R. Arch. Biochem. Biophys. 1998, 360, 10–
14.5. Higashiyama, T. Pure Appl. Chem. 2002, 74, 1263–1269.6. Jeffrey, G. A.; Nanni, R. Carbohydr. Res. 1985, 137, 21–30.7. Liu, Q.; Schmidt, R. K.; Teo, B.; Karplus, P. A.; Brady, J. W. J. Am. Chem. Soc. 1997,
119, 7851–7862.
8. Engelsen, S. B.; Pérez, S. J. Phys. Chem. B 2000, 104, 9301–9311.9. French, A. D.; Johnson, G. P.; Kelterer, A.-M.; Dowd, M. K.; Cramer, C. J. J. Phys.
Chem. A 2002, 106, 4988–4997.10. Dowd, M. K.; Reilly, P. J.; French, A. D. J. Comp. Chem. 1992, 13, 102–114.11. French, A. D.; Kelterer, A.-M.; Johnson, G. P.; Dowd, M. K.; Cramer, C. J. J. Mol.
Graph. Model. 2000, 18, 95–107.12. Lefort, R.; Bordat, P.; Cesaro, A.; Descamps, M. J. Chem. Phys. 2007, 126, 014511/
1–014511/9.13. Brown, G. M.; Rohrer, D. C.; Berking, B.; Beevers, C. A.; Gould, R. O.; Simpson, R.
Acta Crystallogr., Sect. B 1972, 28, 3145–3158.14. Taga, T.; Senma, M.; Osaki, K. Acta Crystallogr., Sect. B 1972, 28, 3258–3263.15. Nagase, H.; Ogawa, N.; Endo, T.; Shiro, M.; Ueda, H.; Sakurai, M. J. Phys. Chem. B
2008, 112, 9105–9111.16. Koritsánszky, T. S.; Coppens, P. Chem. Rev. 2001, 101, 1583–1627.17. Coppens, P. X-ray Charge Densities and Chemical Bonding, 1st ed.; Oxford
University Press: New York, 1997.18. Stevens, E. D.; Rys, J.; Coppens, P. J. Am. Chem. Soc. 1978, 100, 2324–2328.19. Stevens, E. D. Acta Crystallogr., Sect. B 1980, 36, 1876–1886.20. Bader, R. F. Atoms in Molecules: a Quantum Theory, 1st ed.; Clarendon Press:
Oxford, 1990.21. Jaradat, D. M. M.; Mebs, S.; Cheinska, L.; Luger, P. Carbohydr. Res. 2007, 342,
1480–1489.22. Longchambon, F.; Gillier-Pandraud, H.; Wiest, R.; Rees, B.; Mitschler, A.; Feld,
R.; Lehmann, M.; Becker, P. Acta Crystallogr., Sect. B 1985, 41, 47–56.23. Koritsánszky, T.; Strumpel, M. K.; Buschmann, J.; Luger, P.; Hansen, N. K.;
Pichon-Pesme, V. J. Am. Chem. Soc. 1991, 113, 9148–9154.24. Schleifer, L.; Senderowitz, H.; Aped, P.; Tartakovsky, E.; Fuchs, B. Carbohydr. Res.
1990, 206, 21–39.25. O’Brien, J. J. Food Sci. 1996, 61, 679–682.26. Wolfenden, R.; Yuan, Y. J. Am. Chem. Soc. 2008, 130, 7548–7549.27. SAINT, SADABS; Bruker-AXS, Madison, WI, USA, 1996.28. Sheldrick, G. M. Acta Crystallogr., Sect. A 2008, 64, 112–122.29. Spek, A. L. J. Appl. Crystallogr. 2003, 36, 7–13.30. Hansen, N. K.; Coppens, P. Acta Crystallogr., Sect. A 1978, 34, 909–921.31. Volkov, A.; Macchi, P.; Farrugia, L. J.; Gatti, C.; Mallinson, P.; Richter, T.;
Koritsanszky, T. XD2006-A Computer Program for Multipole Refinement,Topological Analysis of Charge Densities and Evaluation of IntermolecularEnergies from Experimental or Theoretical Structure Factors; Middle TennesseeState University, 2006.
32. Stevens, E. D. In Electron and Magnetization Densities in Molecules and Crystals;Becker, P., Ed.; Plenum: New York, 1980; pp 473–477.
33. Hirshfeld, F. L. Acta Crystallogr., Sect. A 1976, 32, 239–244.34. Frisch, M. J.; Trucks, G. W.; Schlegel, H. B.; Scuseria, G. E.; Robb, M. A.;
Cheeseman, J. R.; Montgomery, J. A., Jr.; Vreven, T.; Kudin, K. N.; Burant, J. C.;Millam, J. M.; Iyengar, S. S.; Tomasi, J.; Barone, V.; Mennucci, B.; Cossi, M.;Scalmani, G.; Rega, N.; Petersson, G. A.; Nakatsuji, H.; Hada, M.; Ehara, M.;Toyota, K.; Fukuda, R.; Hasegawa, J.; Ishida, M.; Nakajima, T.; Honda, Y.; Kitao,O.; Nakai, H.; Klene, M.; Li, X.; Knox, J. E.; Hratchian, H. P.; Cross, J. B.; Bakken,V.; Adamo, C.; Jaramillo, J.; Gomperts, R.; Stratmann, R. E.; Yazyev, O.; Austin, A.J.; Cammi, R.; Pomelli, C.; Ochterski, J. W.; Ayala, P. Y.; Morokuma, K.; Voth, G.A.; Salvador, P.; Dannenberg, J. J.; Zakrzewski, V. G.; Dapprich, S.; Daniels, A. D.;Strain, M. C.; Farkas, O.; Malick, D. K.; Rabuck, A. D.; Raghavachari, K.;Foresman, J. B.; Ortiz, J. V.; Cui, Q.; Baboul, A. G.; Clifford, S.; Cioslowski, J.;Stefanov, B. B.; Liu, G.; Liashenko, A.; Piskorz, P.; Komaromi, I.; Martin, R. L.;Fox, D. J.; Keith, T.; Al-Laham, M. A.; Peng, C. Y.; Nanayakkara, A.; Challacombe,M.; Gill, P. M. W.; Johnson, B.; Chen, W.; Wong, M. W.; Gonzalez, C.; Pople, J. A.;GAUSSIAN 03, Revision C.02, Wallingford, CT, 2004.
35. AIMAll (Version 08.11.06), Todd A. Keith, 2008 (aim.tkgristmill.com).36. MORPHY98, a Program Written by P. L. A. Popelier with a contribution from R. G.
A. Bone, UMIST, Manchester, 1998.37. Burnett, M. N.; Johnson, C. K. ORTEP-III, Oak Ridge Thermal Ellipsoid Plotting
Program for Crystal Structure Illustrations, ORNL-6895, Oak Ridge NationalLaboratory, 1996.
38. Cremer, D.; Pople, J. A. J. Am. Chem. Soc. 1995, 97, 1354–1358.39. French, A. D.; Johnson, G. P. Carbohydr. Res. 2007, 342, 1223–1237.40. Allen, F. H. Acta Crystallogr., Sect. B 2002, 58, 380–388.41. Koch, U.; Popelier, P. L. A. J. Chem. Phys. 1995, 99, 9747–9754.42. Steiner, T.; Saenger, W. J. Am. Chem. Soc. 1993, 115, 4540–4547.43. Takahashi, O.; Yamasaki, K.; Kohno, Y.; Ohtaki, R.; Ueda, K.; Suezawa, H.;
Umezawa, Y.; Nishio, M. Carbohydr. Res. 2007, 342, 1202–1209.44. Takahashi, O.; Yamasaki, K.; Kohno, Y.; Ueda, K.; Suezawa, H.; Nishio, M.
Carbohydr. Res. 2009, 344, 1225–1229.45. Espinosa, E.; Souhassou, M.; Lachekar, H.; Lecomte, C. Acta Crystallogr. Sect. B
1999, 55, 563–572.46. Abramov, Y. A. Acta Crystallogr., Sect. A 1997, 53, 264–272.47. Bader, R. F. W.; Essen, H. J. Chem. Phys. 1984, 80, 1943–1960.48. Cremer, D.; Kraka, E. Croat. Chem. Acta 1984, 56, 1259–1281.49. Jeffrey, G. A.; Saenger, W. Hydrogen Bonding in Biological Structures; Springer:
Berlin, 1991.50. Espinosa, E.; Molins, E.; Lecomte, C. Chem. Phys. Lett. 1998, 258, 170–173.51. Su, Z.; Coppens, P. Acta Crystallogr., Sect. A 1992, 48, 188–197.52. Hübschle, C. B.; Luger, P. J. Appl. Crystallogr. 2006, 39, 901–904.53. Edward, J. T. Chem. Ind. (London) 1955, 1102–1104.54. Box, V. G. S. Heterocycles 1998, 85, 2389–2417.55. Bitzer, R. S.; Barbosa, A. G. H.; da Silva, C. O.; Nascimento, M. A. C. Carbohydr.
Res. 2005, 340, 2171–2184.

E. D. Stevens et al. / Carbohydrate Research 345 (2010) 1469–1481 1481
56. Romers, C.; Altona, C.; Buys, H. R.; Havinga, E. Top. Stereochem. 1969, 4, 39–97.57. Random, L.; Hehre, W. J.; Pople, J. A. J. Am. Chem. Soc. 1972, 94, 2371–2381.58. David, S.; Eisenstein, O.; Henre, W. J.; Salem, L.; Hoffmann, R. J. Am. Chem. Soc.
1973, 95, 3806–3807.59. Wiberg, K. B.; Rablen, P. R. J. Am. Chem. Soc. 1993, 115, 614–625.60. Jeffrey, G. A.; Pople, J. A.; Radom, L. Carbohydr. Res. 1974, 38, 81–95.
61. Cossé-Barbi, A.; Dubois, J.-E. J. Am. Chem. Soc. 1987, 109, 1503–1511.62. Salzner, U.; Schleyer, P. V. R. J. Org. Chem. 1994, 59, 2138–2155.63. Súarez, D.; Sordo, T. L.; Sordo, J. A. J. Am. Chem. Soc. 1996, 118, 9850–
9854.64. Omoto, K.; Marusaki, K.; Hirao, H.; Imade, M.; Fujimoto, H. J. Phys. Chem. A
2000, 104, 6499–6504.