extended terminal subfluidization wash (etsw) · 2015-11-10 · extended terminal subfluidization...
TRANSCRIPT

Extended Terminal Subfluidization
Wash (ETSW)Applications and Lessons-Learned
Thomas Waters, P.E.United States Environmental Protection Agency
Office of Groundwater and Drinking Water
Standards and Risk Management Division
Technical Support Center
10/29/2015 1U.S. Environmental Protection Agency
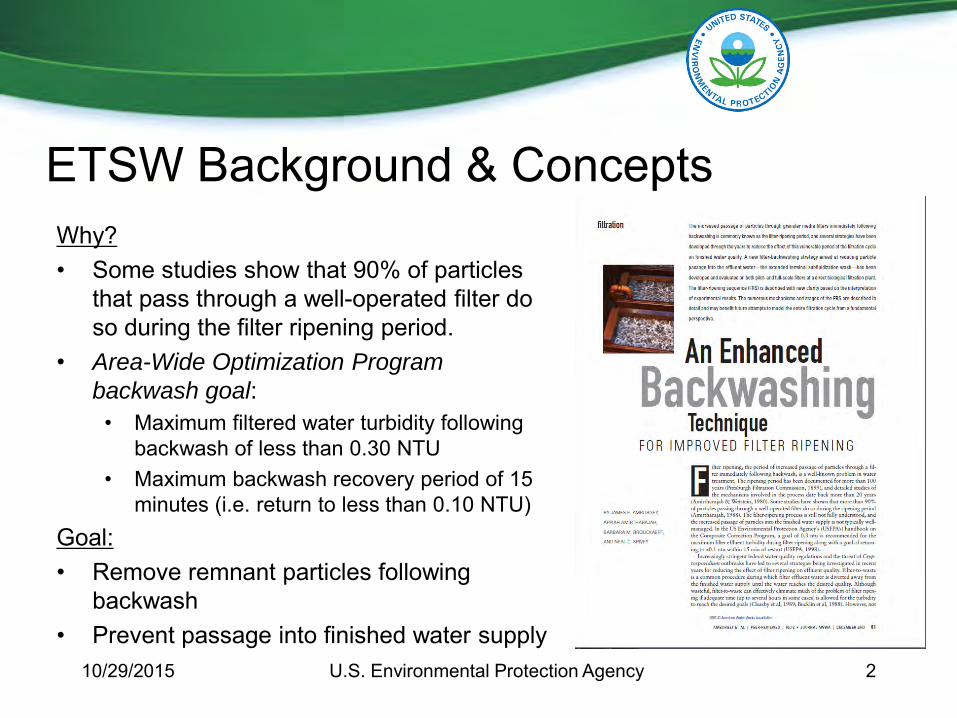
ETSW Background & ConceptsWhy?• Some studies show that 90% of particles
that pass through a well-operated filter do so during the filter ripening period.
• Area-Wide Optimization Program
backwash goal: • Maximum filtered water turbidity following
backwash of less than 0.30 NTU• Maximum backwash recovery period of 15
minutes (i.e. return to less than 0.10 NTU)Goal:• Remove remnant particles following
backwash• Prevent passage into finished water supply
10/29/2015 U.S. Environmental Protection Agency 2
ETSW Background & Concepts
How?• ETSW is an extension of the normal
backwash duration• Subfluidization flow rate• Duration sufficient to move one theoretical
filter volume through filter box
10/29/2015 U.S. Environmental Protection Agency 3
ETSW Background & ConceptsTheory:• Incremental decrease in backwash rate allows
bed to settle more slowly (fewer remnant particles dislodged)
• Media restratification – more smaller grains to the top of the bed, creating a lower porosity layer
• Most of the dislodged remnant particles removed from the filter at the low flow rate
10/29/2015 U.S. Environmental Protection Agency 4

ETSW Measurements & Calculations
Filter Media Volume (e.g., anthracite)
Filter Media Volume (e.g., sand)
Filter Underdrain
Filter volume above media & below BW troughVolume to remove remnant particles
At what flow rate?
3 to 6 gpm/ft2 (for minimal media expansion)
How long?
Time to replace ~ 1 bed volume of A + B + C
10/29/2015 U.S. Environmental Protection Agency 5
Alabama DEM Case StudyCourtesy of William McClimans, ADEM
10/29/2015 U.S. Environmental Protection Agency 6
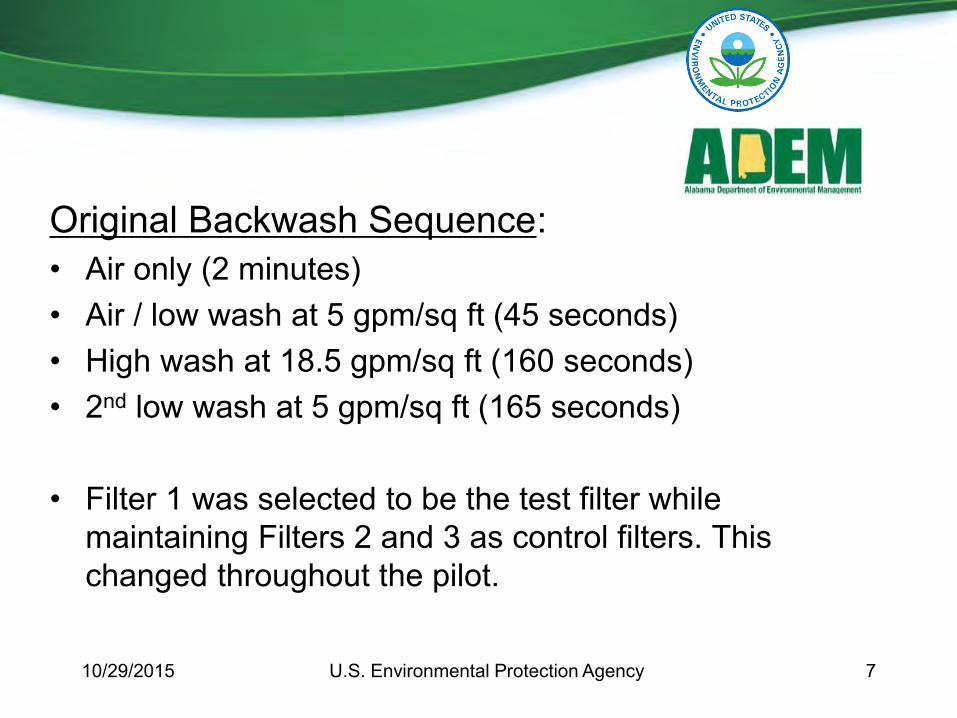
Original Backwash Sequence:• Air only (2 minutes)• Air / low wash at 5 gpm/sq ft (45 seconds)• High wash at 18.5 gpm/sq ft (160 seconds)• 2nd low wash at 5 gpm/sq ft (165 seconds)
• Filter 1 was selected to be the test filter while maintaining Filters 2 and 3 as control filters. This changed throughout the pilot.
10/29/2015 U.S. Environmental Protection Agency 7
10/29/2015 U.S. Environmental Protection Agency 8
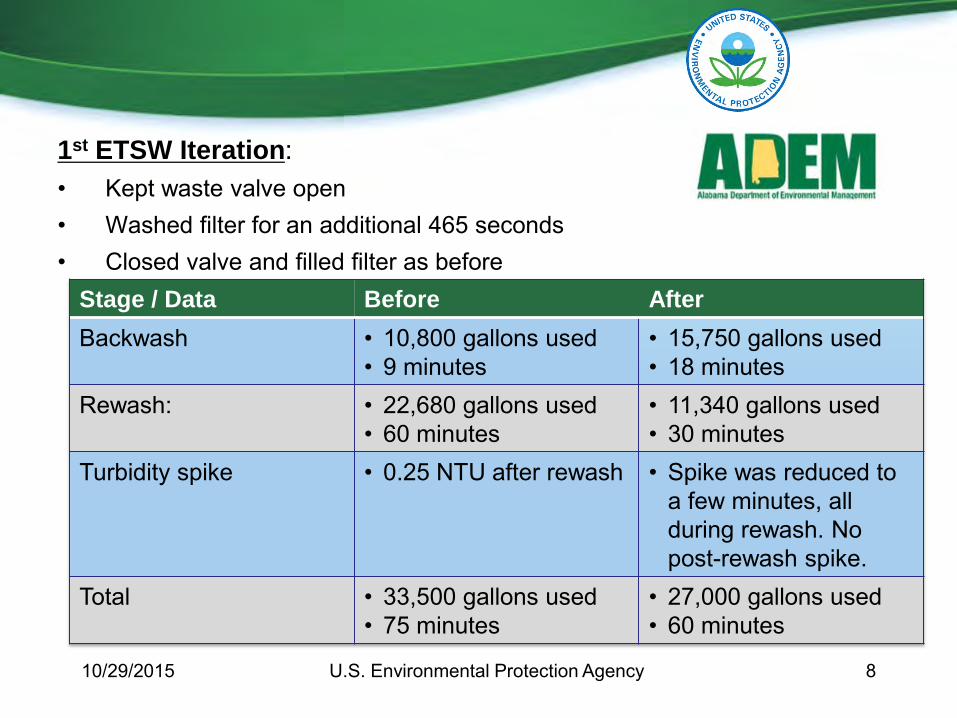
Stage / Data Before After
Backwash • 10,800 gallons used• 9 minutes
• 15,750 gallons used• 18 minutes
Rewash: • 22,680 gallons used• 60 minutes
• 11,340 gallons used• 30 minutes
Turbidity spike • 0.25 NTU after rewash • Spike was reduced toa few minutes, all during rewash. No post-rewash spike.
Total • 33,500 gallons used• 75 minutes
• 27,000 gallons used• 60 minutes
1st ETSW Iteration:• Kept waste valve open• Washed filter for an additional 465 seconds• Closed valve and filled filter as before

10/29/2015 U.S. Environmental Protection Agency 9
Stage / Data Before After
Backwash • 10,800 gallons used• 9 minutes
• 10,800 gallons used• 9 minutes
Rewash: • 22,680 gallons used• 60 minutes
• 15,120 gallons used• 60 minutes
Turbidity spike • 0.25 NTU after rewash • 0.45 NTU during rewash. No spike after rewash.
Total • 33,500 gallons used• 75 minutes
• 26,000 gallons used• 75 minutes
2nd ETSW Iteration:• Changed rewash rate on Filter #2 from 3 gpm/ft2 to
2 gpm/ft2 to match permitted filtration rate.• Filter #3 is now the control filter.

10/29/2015 U.S. Environmental Protection Agency 10
Stage / Data Before After
Backwash • 10,800 gallons used• 9 minutes
• 15,750 gallons used• 18 minutes
Rewash: • 22,680 gallons used• 60 minutes
• 3,200 gallons used• 13 minutes
Turbidity spike • 0.25 NTU after rewash • None – highest turbidity at start of rewash.
Total • 33,500 gallons used• 75 minutes
• 18,000 gallons used• 32 minutes
3rd ETSW Iteration:• Changed rewash rate on Filter #1 from 3 gpm/ft2 to
2 gpm/ft2 to match permitted filtration rate.• Filter #3 is now the control filter.
Summary:
• The WTP is saving approximately 15,000 gallons of water per backwash
• Filters returned to service in less than 15 minutes (0.10 NTU)
• ETSW can be fairly simple to implement, but filter backwash controllability needs to be assessed first.
• Potential ETSW benefits include improved filter performance, shorter FTW time, reduction or elimination of rewash turbidity spike, and water savings.
• Alabama has implemented ETSW at 15 water treatment plants, totaling approximately 600 MG/yr water savings.
Implementation issues:• Backwash pump must be capable of backwashing at low flow rates
• Must be able to adequately control flow rate
o Controllable valve
o Backwash flow meter
o Able to see valve setting
• Some WTPs may have design issues with full implementation of ETSW due to pipe sizes
10/29/2015 U.S. Environmental Protection Agency 11
Maryland Department of the
Environment Case StudyCourtesy of Zoë Goodson, MDE
10/29/2015 U.S. Environmental Protection Agency 12

ETSW trial at new plant design• Conventional plant, new in 2010
– 6 filters, use filter-to-waste • Some room for filter optimization, but pretty good
turbidity numbers from monthly operating reports– Most spikes do occur immediately after backwash
• Added ETSW step at 3 gpm/sq ft, 22 min for ETSW removal of 31,119 gallons (one filter bed volume)
10/29/2015 U.S. Environmental Protection Agency 13

0.01
0.1
1
10
100
1000
Jan-14 Feb-14Mar-14 Apr-14 May-14 Jun-14 Jul-14 Aug-14 Sep-14 Oct-14 Nov-14 Dec-14 Jan-15
Tu
rbid
ity (
NT
U)
Raw Max Settled Max Filtered Combined
10/29/2015 U.S. Environmental Protection Agency 14
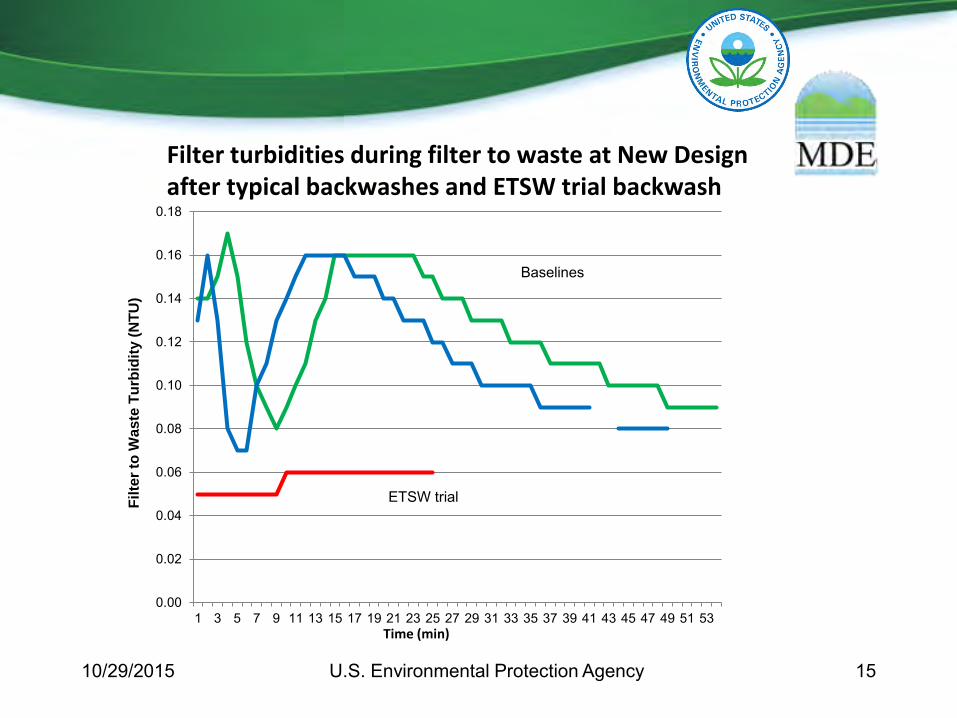
0.00
0.02
0.04
0.06
0.08
0.10
0.12
0.14
0.16
0.18
1 3 5 7 9 11 13 15 17 19 21 23 25 27 29 31 33 35 37 39 41 43 45 47 49 51 53
Baselines
ETSW trialFil
ter
to W
aste
Tu
rbid
ity (
NT
U)
Time (min)
Filter turbidities during filter to waste at New Designafter typical backwashes and ETSW trial backwash
10/29/2015 U.S. Environmental Protection Agency 15
Operator’s Response to ETSW:• Impressed at how much cleaner the filter got
during ETSW step compared to their typical step (low/high/low vs. low/high/ETSW)
• One operator said he had been skeptical as to how much difference there could be, but after trial “this will be our new normal”
10/29/2015 U.S. Environmental Protection Agency 16
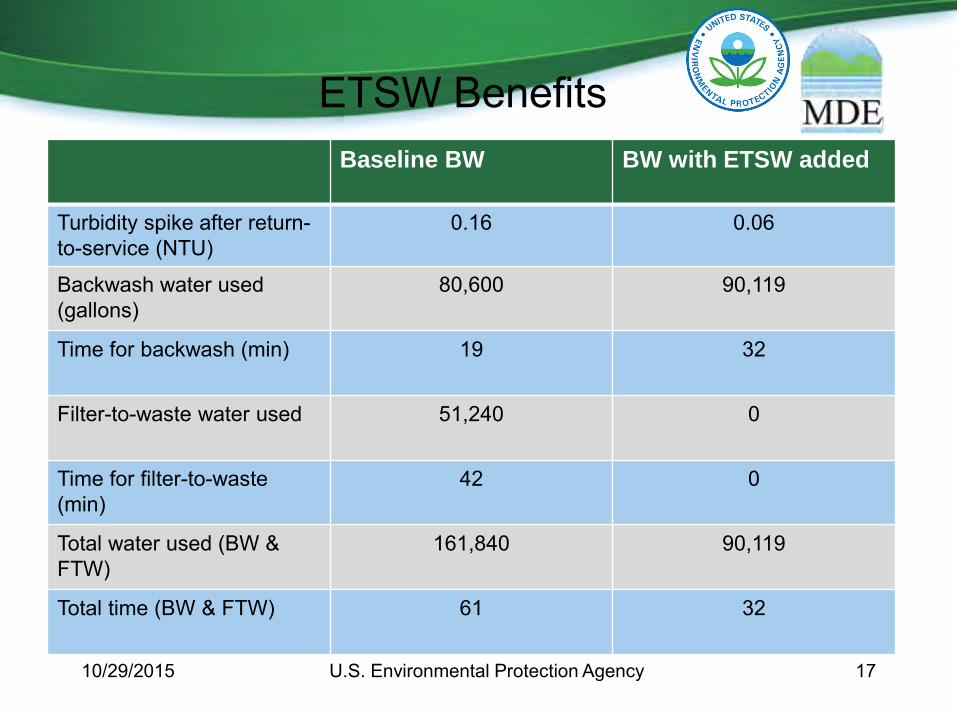
ETSW BenefitsBaseline BW BW with ETSW added
Turbidity spike after return-to-service (NTU)
0.16 0.06
Backwash water used (gallons)
80,600 90,119
Time for backwash (min) 19 32
Filter-to-waste water used 51,240 0
Time for filter-to-waste (min)
42 0
Total water used (BW & FTW)
161,840 90,119
Total time (BW & FTW) 61 32
10/29/2015 U.S. Environmental Protection Agency 17

Case StudyMandy Smith
Connecticut Department of Health
Sanitary Engineer 3
10/29/2015 U.S. Environmental Protection Agency 18
Drinking Water Section
CT DPH
ETSW TRIAL
2015
Technical Review and Field Assessment UnitDrinking Water Section
Connecticut Department of Public Health
Drinking Water Section
Bristol WTP
• 12 MGD Conventional Treatment
• 4 multimedia Filters @ 5 gpm/ft2
• No filter to waste practiced
• Raw water turbidity of 1.2-1.5 NTU
Drinking Water Section
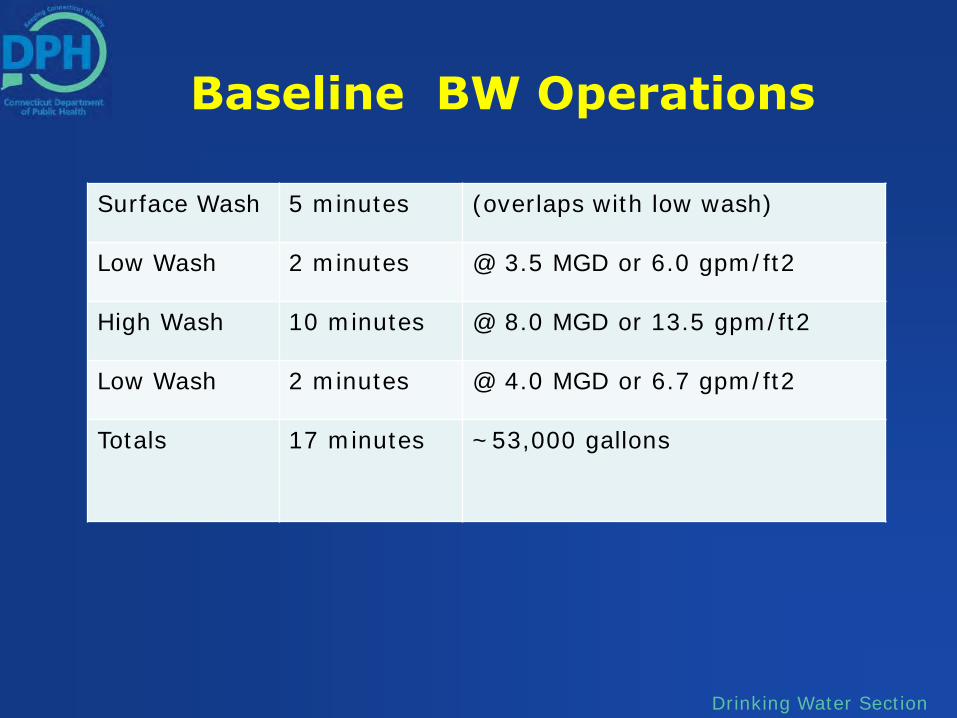
Baseline BW Operations
Surface Wash 5 minutes (overlaps with low wash)
Low Wash 2 minutes @ 3.5 MGD or 6.0 gpm/ft2
High Wash 10 minutes @ 8.0 MGD or 13.5 gpm/ft2
Low Wash 2 minutes @ 4.0 MGD or 6.7 gpm/ft2
Totals 17 minutes ~53,000 gallons
Drinking Water Section
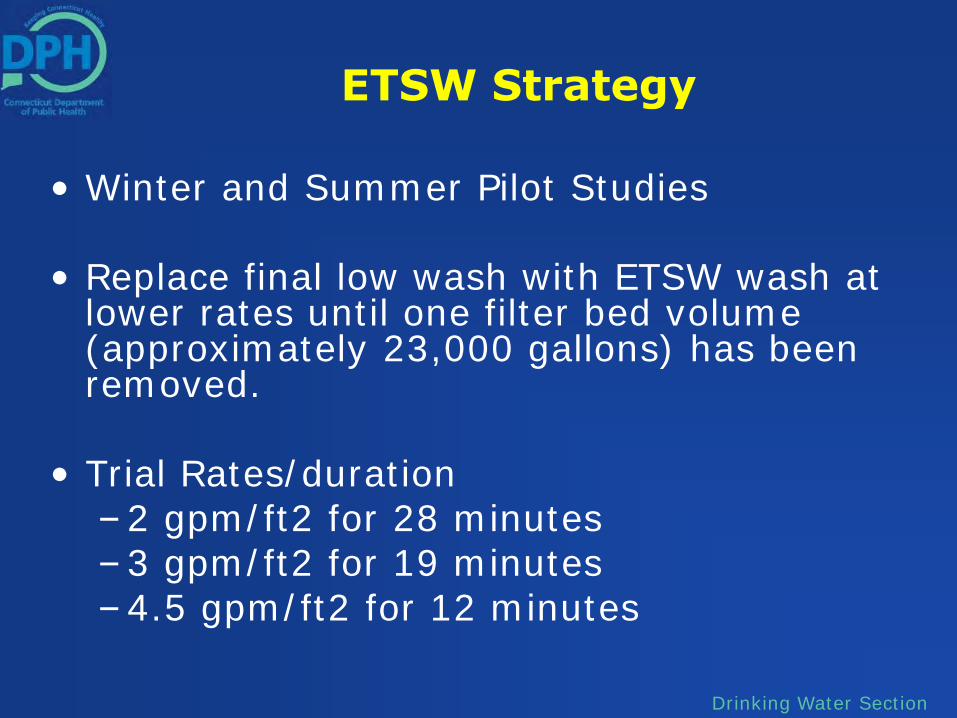
ETSW Strategy
• Winter and Summer Pilot Studies
• Replace final low wash with ETSW wash at lower rates until one filter bed volume (approximately 23,000 gallons) has been removed.
• Trial Rates/duration–2 gpm/ft2 for 28 minutes–3 gpm/ft2 for 19 minutes–4.5 gpm/ft2 for 12 minutes
Drinking Water Section
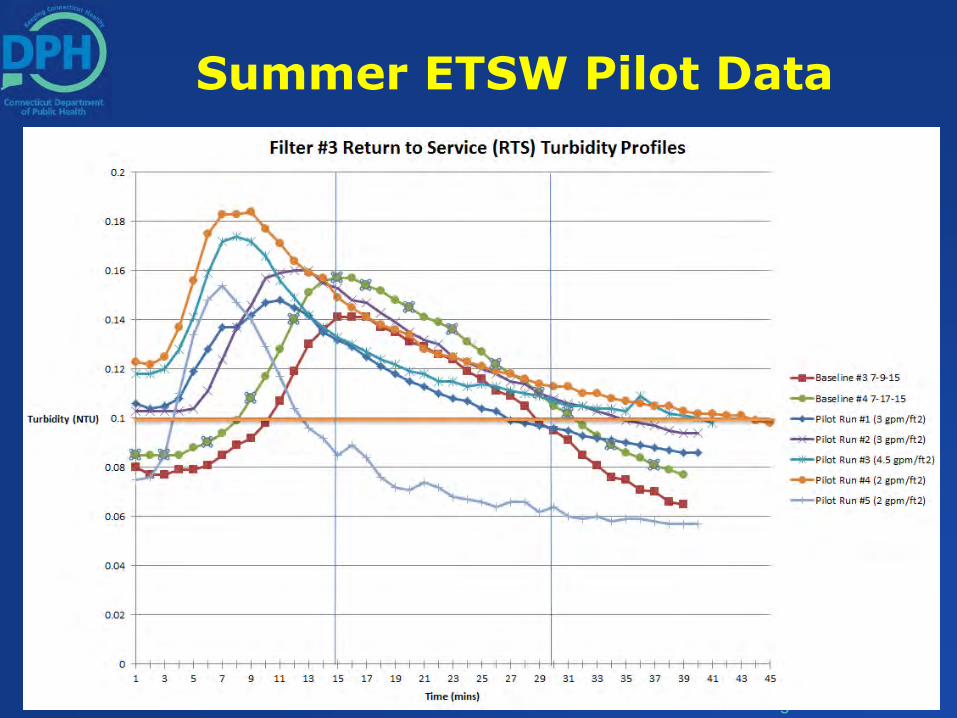
Summer ETSW Pilot Data
Drinking Water Section
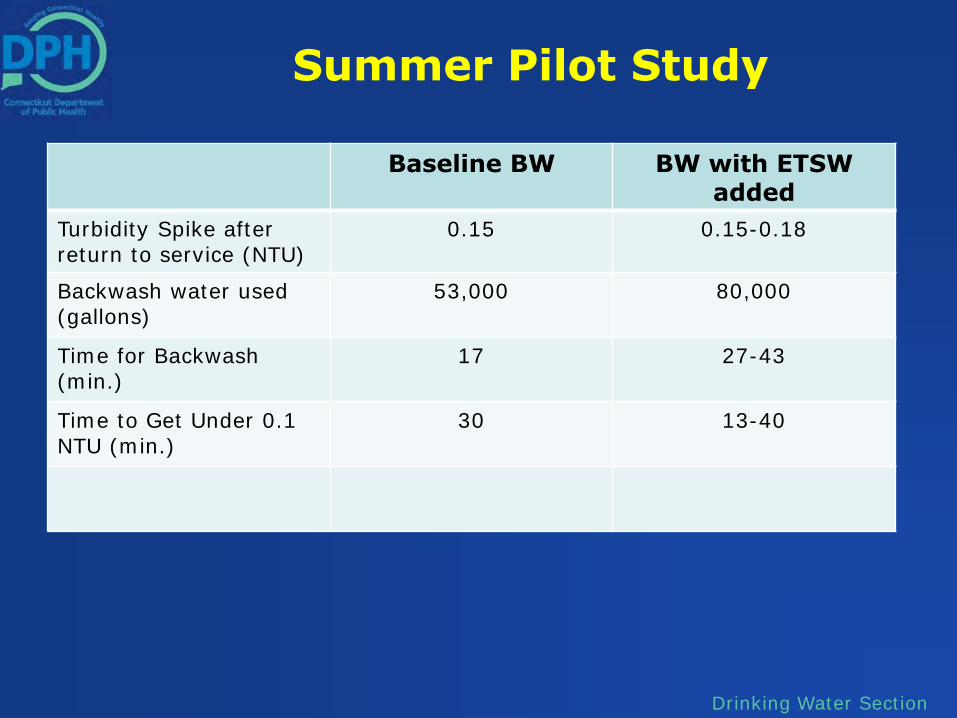
Summer Pilot Study
Baseline BW BW with ETSWadded
Turbidity Spike after return to service (NTU)
0.15 0.15-0.18
Backwash water used (gallons)
53,000 80,000
Time for Backwash (min.)
17 27-43
Time to Get Under 0.1 NTU (min.)
30 13-40

Drinking Water Section
Pilot Study Variables
• Pilot study was conducted operating bw in manual mode vs. by SCADA
• Spray down the walls at different point
• Average filter turbidities slowly rose during course of summer pilot study
• Alum dosage was changed prior to last pilot test run
Drinking Water Section
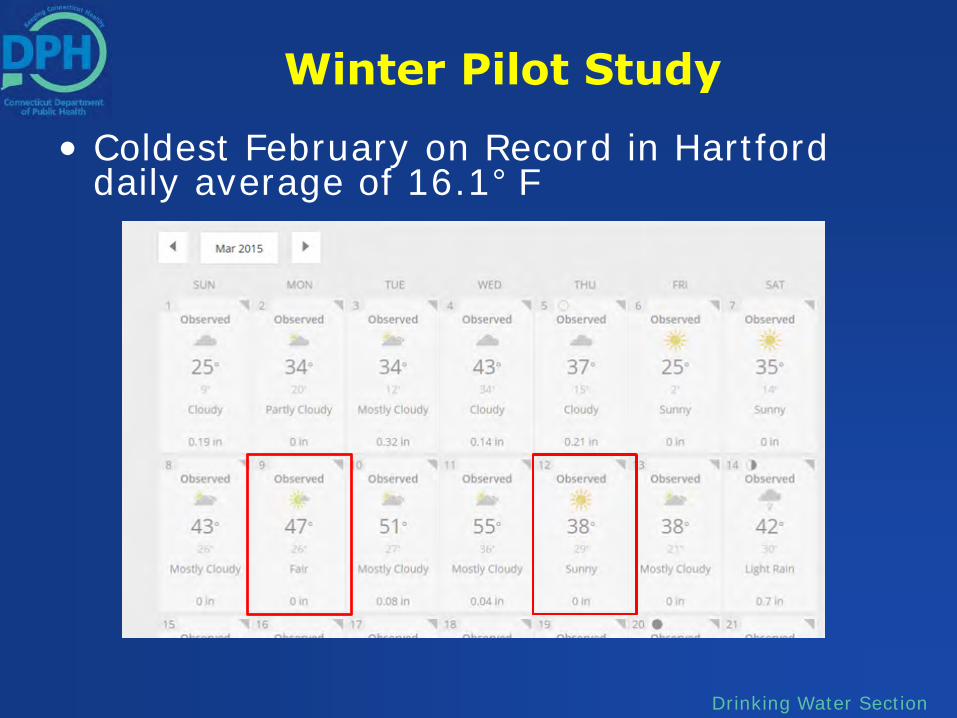
Winter Pilot Study
• Coldest February on Record in Hartford daily average of 16.1° F
Drinking Water Section
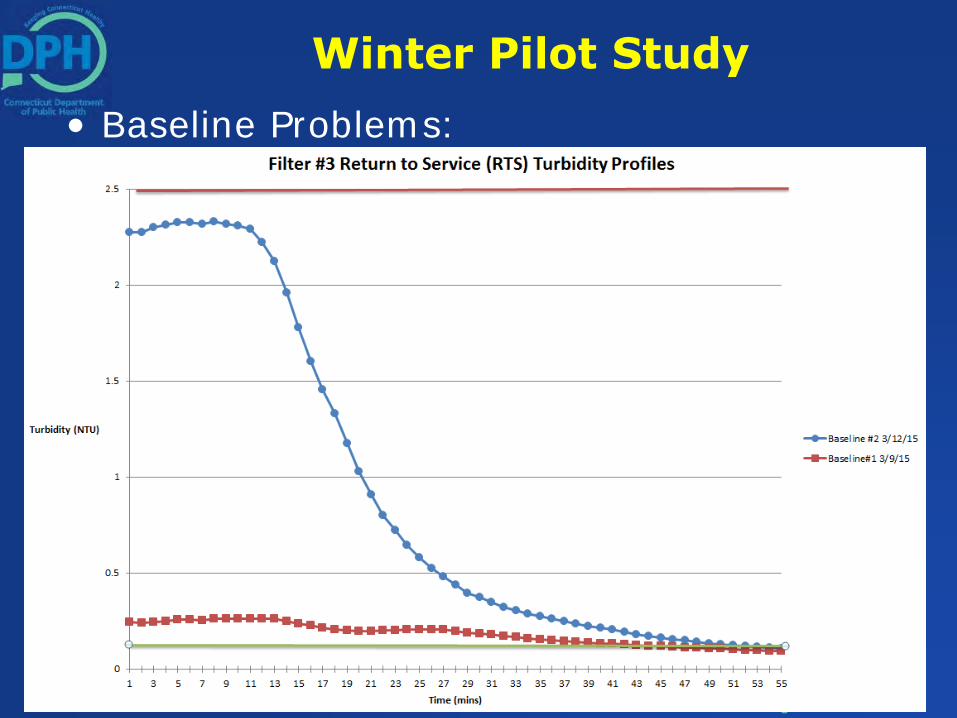
Winter Pilot Study
• Baseline Problems:

Drinking Water Section
Stop the Study!
• Take Filter #3 offline immediately
• Begin Troubleshooting:
• Filter #3 turbidimeter readings from pipe gallery did not match SCADA computer in control room – Data Capped at 1NTU
• Started to see elevated turbidities in other filters during BW
• Look at backwash pipe manifold and twin 100,000 gallon backwash tanks – what’s that noise?
Drinking Water Section
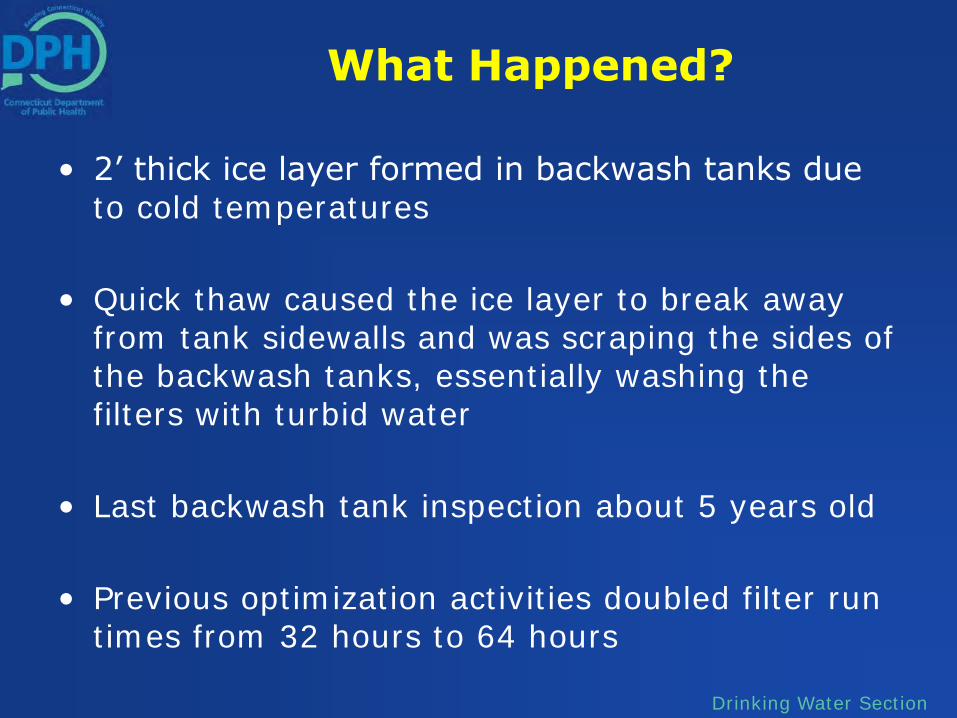
What Happened?
• 2’ thick ice layer formed in backwash tanks due to cold temperatures
• Quick thaw caused the ice layer to break away from tank sidewalls and was scraping the sides of the backwash tanks, essentially washing the filters with turbid water
• Last backwash tank inspection about 5 years old
• Previous optimization activities doubled filter run times from 32 hours to 64 hours
Drinking Water Section
Winter Follow Up
• Modified backwash protocol utilizing wet well supply until each backwash tank was isolated, drained, rid of ice and power washed
• Corrected SCADA data capping issue
• Warmer temps led into the Summer Pilot Study, will try to conduct Winter Pilot Study again this winter
• Also working on summer and winter backwash turbidity profile
Drinking Water Section
Lessons Learned
• This Pilot Study left us with more questions than answers
• Current low wash is already near the ETSW range
• As background turbidities rose, pilot runs were worse – coincidence?
• Conduct 2 trials at each rate good idea
• One study can lead to another!