using pbn for terminal and extended terminal … pbn for terminal and extended terminal operations...
TRANSCRIPT
Using PBN for Terminal and Extended Terminal Operations Navigation Performance Data Analysis and its Effect on Route Spacing
Dijana Trenevska EUROCONTROL
27 June 2017

2
Content
Background and Objective
Data filtering
Validation of methodology
Database size and fleet comparison
Navigation Performance distribution
Route configuration and Spacing examples
Conclusions

BACKGROUND AND OBJECTIVE
3

Background
Variety of navigation specification and procedures EUROCONTROL report 216, “Navigational Accuracy of Aircraft
Equipped with Advanced Navigation Systems – Final Report”, June 1988 – used for EURCONTROL Route spacing CRM studies
4

Navigation Data Collection
Data sources: LVNL – Amsterdam Schiphol Airport (EHAM) NATS – London Heathrow Airport (EGLL) DSNA – Paris Charles de Gaulle Airport (LFPG)
5
LVNL NATS DSNA
Duration April-Sept 2014
Jan-March 2014
Jan-Dec 2014
No. of SIDs 22 4 35
No. of STARs 9 0 2
No. of Approach Transitions 7 0 7

DATA FILTERING
6

7
Data filtering – Step 1 Determination of route segments for reference procedure

8
Data filtering – Step 2 Automatic filtering of the tracks for defined segments
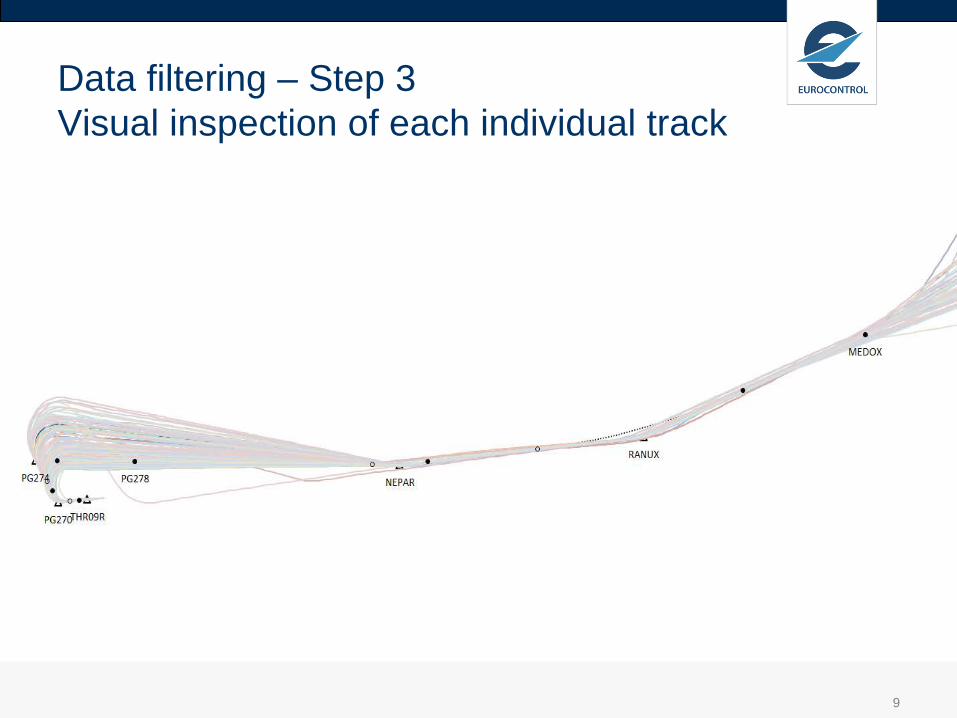
Data filtering – Step 3 Visual inspection of each individual track
9

Data filtering – Step 3 Visual inspection of each individual track
10

VALIDATION OF METHODOLOGY
11

Validation of method: 1 – cumulative distribution for each method
12

COMPUTATION OF CROSS TRACK DEVIATION
13

14
• Reference procedure • Start and end points of Fly-by turns (DO-236C) • Fly-by transition boundary (DO-236C) • Recorded Track (after filtering) • Circle fit in turns (to determine radius)
Computation of cross-track deviation Transition area definition

DATABASE SIZE AND FLEET COMPARISON
15

Database size
16
Number of tracks
Number of tracks after
filtering % Retained
LVNL SID 64 130 9 213 14.37 %
STAR 62 694 3 876 6.18 %
Transition 4 438 2 248 50.65 %
DSNA SID 209 422 14 716 7.03 %
STAR 73 771 2 978 4.04 %
Transition 151 636 47 726 31.47 %
NATS SID 12 605 7 237 57 %
TOTAL 578 696 88 099 15 %

Influence of Navigation Sensors
Mixture of navigation sensors (EHAM) With GNSS (89% tracks) Without GNSS (11% tracks)
17
Aircraft with GNSS 95% < 0,09NM straight 95% < 0,18NM turn
Aircraft without GNSS 95% < 0,15NM straight 95% < 0,27NM turn

NAVIGATION PERFORMANCE DISTRIBUTION
18

Navigation Performance Distribution
Cross track deviation influenced by:
Groundspeed Track angle change
Data of cross-track deviation was organized into the following
subsets of the combined LVNL-NATS-DSNA dataset:
1) straight segments, high groundspeed (>350kts) 2) straight segments, low groundspeed (<=350kts) 3) turns with 30-60° track change, high groundspeed (>350kts) 4) turns with 30-60° track change, low groundspeed (<=350kts) 5) turns with 90° track change, low groundspeed (<=300kts)
19

Navigation Performance Distribution Parameters
20
No. of data points
Cross-track deviations (NM) Mean 95% Min Max
Straight Segments Low Groundspeed (<=350kts) 1297549 0.00 0,06 -1.31 1.34
Straight Segments High Groundspeed (>350kts) 825264 0.00 0.11 -1.45 1.41
Mid Turn 30-60° Low Groundspeed (<=350kts) 267099 0.00 0,12 -0.92 1.17
Mid Turn 30-60° High Groundspeed (>350kts) 48672 0.04 0.23 -0.59 1.35
Mid Turn 90° Low Groundspeed (<300kts) 32579 -0.03 0.28 -1.53 1.42

Navigation Performance Distribution Mid turn 30°- 60° track change at low ground speed
21

Navigation Performance Distribution Mid turn 90° track change at low ground speed
22

Collision Risk Modelling
The computed navigation performance distributions were used in a Collision Risk Model (CRM) for the computation of route spacing and associated risks for a set of route configurations.
Reference documentation P.G. Reich, “Analysis of long range air traffic systems – separation
standards”, Journal of the Institute of Navigation, Vol. 19, Nos. 1, 2 and 3, 1966
Manual on the Airspace Planning Methodology for the Determination of Separation Minima, ICAO, Montreal, ICAO Doc 9689-AN/953, 1998
23

ROUTE CONFIGURATION AND SPACING EXAMPLES
24

Route configurations and spacing examples
25
Route Configuration Description Sample route spacings and risks based on the Collision Risk Model
1. Parallel tracks. Same direction Both aircraft in level flight.
Combined LVNL, NATS, and DSNA straight-segment data Applicable TLS: 4 x 10⁻⁹ fatal accidents per flight hour (f.a.f.h.)
Groundspeed 450kts
Spacing used in CRM: 3 NM (see Key Points 1, 2 and 3)
𝑁𝑁𝑎𝑎𝑎𝑎−𝑏𝑏𝑏𝑏𝑏𝑏𝑏𝑏 = 3.69 × 10⁻¹¹ (f.a.f.h.)
Groundspeed 220kts
Spacing used in CRM: 3 NM (see Key Points 1, 2 and 3)
𝑁𝑁𝑎𝑎𝑎𝑎−𝑏𝑏𝑏𝑏𝑏𝑏𝑏𝑏 = 1.07 × 10⁻¹¹ (f.a.f.h.)
2. Converging Tracks. Joining a parallel path with a 90° fly-by turn. Both aircraft in level flight.
Combined LVNL, NATS, and DSNA straight segment and 90 degree turn angle data Applicable TLS: 4 x 10⁻⁹ fatal accidents per flight hour (f.a.f.h.)
Groundspeed 220kts
Spacing used in CRM: 5 NM (see Key Points 1, 2 and 3)
𝑁𝑁𝑎𝑎𝑎𝑎−𝑏𝑏𝑏𝑏𝑏𝑏𝑏𝑏 = 3.78 × 10⁻¹⁰ (f.a.f.h.)
3. Converging tracks. Joining a parallel path with a 45° fly-by turn. Both aircraft in level flight.
Combined LVNL, NATS, and DSNA straight segment and 30 – 60 degree turn data Applicable TLS: 4 x 10⁻⁹ fatal accidents per flight hour (f.a.f.h.)
Groundspeed 450kts
Spacing used in CRM: 4 NM (see Key Points 1, 2 and 3)
𝑁𝑁𝑎𝑎𝑎𝑎−𝑏𝑏𝑏𝑏𝑏𝑏𝑏𝑏 = 2.34 × 10⁻¹⁰ (f.a.f.h.)
Groundspeed 220kts
Spacing used in CRM: 4 NM (see Key Points 1, 2 and 3)
𝑁𝑁𝑎𝑎𝑎𝑎−𝑏𝑏𝑏𝑏𝑏𝑏𝑏𝑏 = 6.68 × 10⁻¹¹ (f.a.f.h.)
? NM

Route configurations and spacing examples - Key points A limitation of using radar surveillance as a mitigation of risk is that
the spacing between two routes cannot be the same or less than the radar separation minima. → Minimum of 4-5 NM route spacing in an environment using 3 NM radar separation.
No published spacing results can be considered for direct application without performing local pre-implementation analysis.
The resolution of the radar display (a function of ATC sector size) is a determining human factor which forms part of the post-CRM implementation safety analysis to determine the acceptable (final) route spacing.
26

CONCLUSIONS
27

Conclusions
95% lateral navigation Total System Error for straight line segments is in the order of magnitude of 0.11 NM (for high groundspeed >350kts) and 0.06 NM (for low groundspeeds <350kts) from the route centerline
95% lateral navigation Total System Error for low groundspeed (<350kts) and with a track change of 90° is in the order of magnitude of 0.28 NM
Using a CRM with assumed risk of 10-10 fatal accidents per flight hour, yielded the following acceptable route spacing values: Parallel routes: route spacing of 3 NM Converging tracks using fly-by: route spacing of 4-5 NM Note: dependent on track change angle and groundspeed
28
29
Cross track deviation – LVNL data set

Cross track deviation – LVNL data set
30

31