ey global ipo trends - ernst & young · ey global ipo trends ... ahead of the us presidential...
TRANSCRIPT

EY Global IPO Trends2016 2Q

Amid ongoing economic and political uncertainty, the global IPO market will continue to be a stop-start affair in 2016. However, greater clarity regarding the economic and political landscape will emerge by the end of the year, allowing companies to re-invigorate their IPO strategies, while the recent growth in the availability of private capital will continue to support a pipeline of larger and more mature businesses.
Global IPO activity picked up in 2Q16 with a total of 246 IPOs raising US$29.6b. This represents a 29% rise in volume and a 120% increase in total capital raised compared with 1Q16, which had been by far the weakest first quarter since 2009. However, even after this quarter’s improvements, IPO activity at the mid-year point remains significantly lower than the same period last year. For the first six months of 2016 (2Q16 YTD), there were 437 IPOs raising a total of US$43.0b, a decrease of 38% and 61% respectively on the same period in 2015. Despite a slow 1Q16, global IPO activity in 2Q16 YTD still exceeded that of the first half of 2013 (which saw the lowest six-month activity since 2009).
In the first half of 2016, Asia-Pacific exchanges continue to lead global IPO activity, capturing 52% of global IPOs, followed by EMEIA and US exchanges which accounted for 36% and 10.3% of global deals, respectively. EMEIA exchanges led by capital raised with 44% of global proceeds, while Asia-Pacific and US exchanges captured 40% and 16% of global capital raised, respectively.
In the short term, global IPO activity is likely to continue to be impacted by concerns regarding the direction of interest rates, particularly in the US, the UK’s decision to leave the EU and the US presidential election in November. However, once these sources of volatility stabilize, the outlook should be a lot more positive, supported by healthy pipelines of IPO-ready companies in many key regions and across many sectors.
Predictions for the global IPO market based on activity in the first half of 2016
Politics partly prompt IPO pause Companies adapt their businesses to changing political regimes and regulatory environments, but it is the uncertainty ahead of potential change that often prompts businesses to delay significant plans, such as for a stock market listing.
The tone for both business and investor sentiment was set early in the year. The political uncertainty of a US presidential election year was compounded when the UK Government announced that a referendum on EU membership would be held on 23 June. This political uncertainty, combined with fears of a global economic slowdown, perceptions of high market valuations due to ultra-loose monetary policy and volatile capital market conditions all contributed to a muted first half of the year in the IPO market.
Unsurprisingly, the volume and pricing of IPOs in the UK market was significantly affected by the prospect of the EU referendum. Funds raised in the first half of 2016 fell by 50% compared with the same period of 2015, while the number of deals declined by 11%.
The result of the UK referendum, in favor of exiting the EU, is expected to prompt temporary weakness in UK equity markets and a significant depreciation of the British pound. In the short term, IPO activity can be expected to remain subdued, with listings focused on smaller companies with UK-generated revenues, which do not have to contend with international trade issues. Companies will also have to adapt to the probable change in the regulatory environment created by the exit from the EU. As equity markets stabilize, and looking ahead to 2017, IPO activity is expected to increase as companies that delayed a listing during 2016 may decide the time is right to enter the public market. The weaker pound may also improve overseas investors’ appetite for UK IPOs.
Ahead of the US presidential election, political uncertainty has also been a significant factor weighing on US IPO activity in the first half of the year. With the traditional summer lull in activity
Delayed but not derailed: global IPO market looks ahead to 2017
2 |
Impact of UKreferendum
Geopoliticaluncertainties
Elections
Oilprices
Economicgrowth
Short-termvolatility
Interestrate hikes
Currency Goldprice
2 |
IPO sentiment radar Potential impact
• Prepare for more narrow IPO windows
• Preserve optionality with early IPO readiness preparations
• Consider array of exit alternatives
• Need for flexibility in timing and pricing
Our radar contains a variety of market factors that may impact investor sentiment for IPOs. Pre-IPO companies should be aware of how these factors may affect their business and ultimately the timing and value of their transaction.

| 3
about to begin before the Independence Day holiday at the start of July and the prospect of the election campaign being in full swing once investors return after the holidays, the US IPO window will not be available at all times in the second half of 2016. For this reason we expect that a marked improvement in IPO activity will not be seen until next year, when there will be greater certainty regarding both the new president’s economic and political policy platform as well as the future path of US interest rates.
Toward a deeper capital market in Greater ChinaThe Greater China IPO market slowed in the first six months of 2016 as a result of market volatility, concerns about the slowdown in growth rate in mainland China and the possibility of renminbi (RMB) depreciation.
However, since the volatility at the beginning of the year, the market is now stabilizing and gaining momentum on the anticipation of the launch of the Shenzhen-Hong Kong Stock Connect. In addition, the regulators continue with measures to create a healthy and stable environment and build a multilayer capital market, laying a solid basis for IPO reform in the long run.
Return of PE and the megadeal lift spiritsFinancial sponsor involvement is a feature of a healthy IPO market in developed economies and 2Q16 saw participation of sponsors bounce back after a very muted first quarter. Globally, there were 63 financial sponsor-backed IPOs raising US$10.4b in 2Q16, accounting for 26% of global IPOs by number and 35% by capital raised. This is in contrast to 1Q16, when PE- and VC-backed participation in IPOs was 16% by deal number.
2Q16 also saw the return of the megadeal with six of the top ten IPOs in the quarter raising more than US$1b, with the largest IPO, Denmark’s state-owned DONG Energy, raising more than US$2.5b.
The average deal size rose on main markets in 2Q16 compared with 1Q16. However, average deal size for the first half of 2016 is lower than for the same period last year in all three regions, continuing a downward trend that started in 2013.
Dual-track is a firm part of company strategy Further recent examples of companies being acquired while also pursuing an IPO illustrate businesses’ desire to keep their strategic fundraising options open. Pursuing a multitrack approach is an important strategy as companies weigh private funding options against trade sale, merger, acquisition or traditional IPO as alternative options to fund growth and deliver return for shareholders. This change is likely to shift the balance in favor of a new kind of IPO, in which bigger, more stable businesses come to the public markets later in their life cycle, driven not so much by funding needs, but with a view to securing a higher brand profile and the opportunity to access new markets.
Improved certainty will drive pickup in IPOsRobust IPO preparations and the ability to flex with changing market conditions will be critical if companies are to successfully navigate the IPO windows in the second half of 2016. Looking ahead, investor appetite for well-valued businesses remains strong and IPO pipelines are healthy, which points to a pickup in IPO activity once the uncertainties of the second half of 2016 have been safely negotiated.
Global IPO and M&A by deal numbers
Note: 2Q16 M&A activity is based on announced M&A deals from April and May 2016, and 2Q16 IPO activity is based on priced IPOs from April and May 2016.
Global IPO and M&A by deal value
Note: 2Q16 M&A activity is based on announced M&A deals from April and May 2016, and 2Q16 IPO activity is based on priced IPOs from April and May 2016.
Page 1 2Q15 Global IPO update
Global IPO and M&A by deal numbers
0
100
200
300
400
500
600
-
2,000
4,000
6,000
8,000
10,000
12,000
1Q07
2Q07
3Q07
4Q07
1Q08
2Q08
3Q08
4Q08
1Q09
2Q09
3Q09
4Q09
1Q10
2Q10
3Q10
4Q10
1Q11
2Q11
3Q11
4Q11
1Q12
2Q12
3Q12
4Q12
1Q13
2Q13
3Q13
4Q13
1Q14
2Q14
3Q14
4Q14
1Q15
2Q15
3Q15
4Q15
1Q16
2Q16
Num
ber o
f IP
O d
eals
Num
ber o
f M&
A de
als
Number of M&A Number of IPOsNote: 2Q16 M&A activity is based on announced M&A deals from April and May 2016, and 2Q16 IPO activity is based on priced IPOs from April and May 2016.
Page 2 2Q15 Global IPO update
Global IPO and M&A by deal value
0
20
40
60
80
100
120
140
0
200
400
600
800
1,000
1,200
1,400
1,600
1Q07
2Q07
3Q07
4Q07
1Q08
2Q08
3Q08
4Q08
1Q09
2Q09
3Q09
4Q09
1Q10
2Q10
3Q10
4Q10
1Q11
2Q11
3Q11
4Q11
1Q12
2Q12
3Q12
4Q12
1Q13
2Q13
3Q13
4Q13
1Q14
2Q14
3Q14
4Q14
1Q15
2Q15
3Q15
4Q15
1Q16
2Q16
IPO
dea
l val
ue (U
S$b
)
M&
A de
al v
alue
(US
$b)
M&A deal value US$b IPO capital raised US$bNote: 2Q16 M&A activity is based on announced M&A deals from April and May 2016, and 2Q16 IPO activity is based on priced IPOs from April and May 2016.

4 |
Main Market and AIMUS$3.8b(34 deals)
LSE
NASDAQ OMX and First North3
US$4.8b(26 deals)
NASDAQOMX
Dev
elop
ed
Rap
id g
row
th
Rapid growth vs. developed
Three sectors trending
US$43.0bin capital raised
(61% decrease on 2Q15 YTD)
437(38% decrease on 2Q15 YTD)
Volume and value
deals globally
Asia-Pacific tops the leaderboard
Asia-Pacific
40%
Financial sponsor activity rose by 110% in 2Q16 compared to 1Q16
Global IPO highlights 2Q16 YTD(January–June 2016)1
The VIX® was around the 13% to 16% level in April and May, signaling lower volatility and higher investor confidence.
2Q16 IPO activity was affected by market volatility from 1Q16 and political uncertainty in the US and the UK.
Equity markets saw lower volatility in 2Q16
VIX
Asia-Pacific52%
Number of deals
NorthAmerica 11%
EMEIA 36%
Top three deals in 2Q16
Home
European exchanges ranked second by global funds raised.
Europe
39%
Commentary
Away
US exchanges ranked third by global funds raised.
US16%
Rapid-growth markets represent 53% of globalIPO volume in 2Q16 YTD.
Asia-Pacific led by global funds raised.
Top six exchanges by funds raised
New YorkUS$4.2b (13 deals)
NYSE
Main and GEMUS$5.6b(37 deals)
HKEx
Euronext and AlternextUS$3.2b(11 deals)
Euronext
NASDAQ US$2.5b(31 deals)
NASDAQ
There were 37 withdrawn or postponed deals in 2Q16, which was lower than the 43 deals in 2Q15.
Ninety-one percent of 2Q16 IPOs priced within or above expectations.2
Top six countries by deal volume4
87
MainlandChina
43 40
Japan US
34
UK
29 29
India Australia
Despite the substantial uplift in global IPO activity in the second quarter, there are still a large number of IPO-ready companies sheltering from continued volatility and waiting for much-needed clarity on the global economic and political landscape. In the meantime, activity is slow but improving. The ready supply of private capital from PE firms will continue to support this pipeline of larger, more mature businesses wait for the right time to come to market, particularly in the US.
Value of deals
AmericaNorth 16%
Asia-Pacific39.7%
Central andSouth America
.3%Central andSouth America
1%
EMEIA44%
US$1.2b
1. 2Q16 YTD (January-June 2016) IPO activity is based on priced IPOs as of 18 June and expected IPOs by end of June. 2. Focus on open-price IPOs with deal value above US$50m.3. NASDAQ OMX and First North include IPOs on the Copenhagen, Helsinki, Iceland and Stockholm markets.4. Based on the listed company domicile nation.
In 2Q16 YTD, PE and VC account for 21% of global IPOs (93 deals)34% by proceeds (US$14.5b)
21%of global
IPOs
US$2.6bDenmark US
MGM Growth Properties LLC
DONG Energy A/S
Cross-border listings were 6% of global IPOs during 2Q16 YTD as compared to 8% during 2Q15 YTD.
64 deals(US$3.3b)
Health care
Home and away
74 deals(US$5.6b)
Industrials Technology72 deals(US$2.8b)
US$1.2bUS
US Foods Holding Corp.

| 5
Main Market and AIMUS$3.8b(34 deals)
LSE
NASDAQ OMX and First North3
US$4.8b(26 deals)
NASDAQOMX
Dev
elop
ed
Rap
id g
row
th
Rapid growth vs. developed
Three sectors trending
US$43.0bin capital raised
(61% decrease on 2Q15 YTD)
437(38% decrease on 2Q15 YTD)
Volume and value
deals globally
Asia-Pacific tops the leaderboard
Asia-Pacific
40%
Financial sponsor activity rose by 110% in 2Q16 compared to 1Q16
Global IPO highlights 2Q16 YTD(January–June 2016)1
The VIX® was around the 13% to 16% level in April and May, signaling lower volatility and higher investor confidence.
2Q16 IPO activity was affected by market volatility from 1Q16 and political uncertainty in the US and the UK.
Equity markets saw lower volatility in 2Q16
VIX
Asia-Pacific52%
Number of deals
NorthAmerica 11%
EMEIA 36%
Top three deals in 2Q16
Home
European exchanges ranked second by global funds raised.
Europe
39%
Commentary
Away
US exchanges ranked third by global funds raised.
US16%
Rapid-growth markets represent 53% of globalIPO volume in 2Q16 YTD.
Asia-Pacific led by global funds raised.
Top six exchanges by funds raised
New YorkUS$4.2b (13 deals)
NYSE
Main and GEMUS$5.6b(37 deals)
HKEx
Euronext and AlternextUS$3.2b(11 deals)
Euronext
NASDAQ US$2.5b(31 deals)
NASDAQ
There were 37 withdrawn or postponed deals in 2Q16, which was lower than the 43 deals in 2Q15.
Ninety-one percent of 2Q16 IPOs priced within or above expectations.2
Top six countries by deal volume4
87
MainlandChina
43 40
Japan US
34
UK
29 29
India Australia
Despite the substantial uplift in global IPO activity in the second quarter, there are still a large number of IPO-ready companies sheltering from continued volatility and waiting for much-needed clarity on the global economic and political landscape. In the meantime, activity is slow but improving. The ready supply of private capital from PE firms will continue to support this pipeline of larger, more mature businesses wait for the right time to come to market, particularly in the US.
Value of deals
AmericaNorth 16%
Asia-Pacific39.7%
Central andSouth America
.3%Central andSouth America
1%
EMEIA44%
US$1.2b
1. 2Q16 YTD (January-June 2016) IPO activity is based on priced IPOs as of 18 June and expected IPOs by end of June. 2. Focus on open-price IPOs with deal value above US$50m.3. NASDAQ OMX and First North include IPOs on the Copenhagen, Helsinki, Iceland and Stockholm markets.4. Based on the listed company domicile nation.
In 2Q16 YTD, PE and VC account for 21% of global IPOs (93 deals)34% by proceeds (US$14.5b)
21%of global
IPOs
US$2.6bDenmark US
MGM Growth Properties LLC
DONG Energy A/S
Cross-border listings were 6% of global IPOs during 2Q16 YTD as compared to 8% during 2Q15 YTD.
64 deals(US$3.3b)
Health care
Home and away
74 deals(US$5.6b)
Industrials Technology72 deals(US$2.8b)
US$1.2bUS
US Foods Holding Corp.

6 |
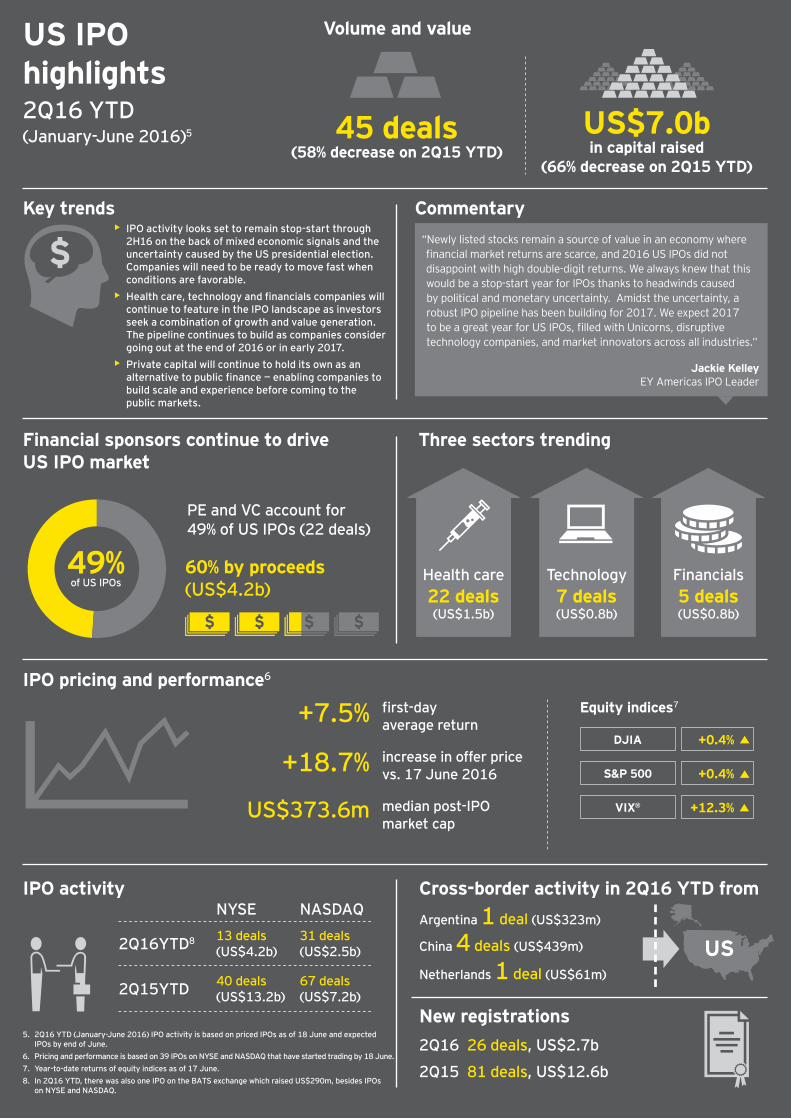
As we predicted in the 2016 1Q EY Global IPO Trends report, 2016 is proving to be very much a stop-start year for the US IPO market. At the half-year point, IPO activity on US exchanges stood at 45 IPOs, which raised US$7.0b. This was a decrease of 58% by volume and 66% by proceeds compared to the same period in 2015. But despite high levels of investor caution caused by a variety of factors, including presidential election uncertainty, timing of an interest rate rise by the Federal Reserve, market and oil price volatility and concerns over the strength of economic recovery, 2Q16 showed a marked improvement on the traditionally quiet first quarter. At 37 IPOs, the number of deals rose by 363% compared to 1Q16 and capital raised soared 755% to US$6.2b. While these numbers are relatively low compared to the equivalent period in 2015, they are a welcome sign that the IPO market is starting to thaw. The return of megadeals — IPOs raising more than US$1b — further underlines this trend.
• MGM Growth Properties LLC and US Food Holding Corp. both raised US$1.2b in 2Q16 and ranked second and third among the global top 10 deals in the quarter. These two deals represent the largest US-listed IPOs since last October, and are larger, individually, than the combined proceeds from all IPOs during 1Q16.
• NYSE ranked third among global exchanges accounting for 10% of global capital raised. NASDAQ was ranked sixth in terms of the number of IPOs.
• Health care was the dominant sector with 22 deals raising US$1.5b. Technology stocks, which were entirely absent in 1Q16, featured once again in 2Q16, contributing seven deals raising US$0.8b.
Investor appetite improving but IPO runways are short and windows are narrowIn 2Q16, 21 of the 31 IPOs (68%) that had been priced and started trading by 17 June, were priced within or above initial filing range. In a world where positive returns are becoming more scarce, newly listed stocks remain a source of value and US IPOs did not disappoint. IPOs on US exchanges in the first half of 2016 produced average first-day returns of 7.5% and current returns of around 18.7%, which greatly exceed the 2016 year-to-date returns of the Dow Jones Industrial Average and S&P 500 indices.
Although momentum is clearly building, and investor appetite remains strong for well-priced opportunities, 2016 has been a stop-start year characterized by short IPO runways. Market windows — when pricing has been attractive and volatility at acceptable levels — have been narrow, meaning only very well-prepared companies with the right team, right story and right price have been able to move fast enough to capitalize on investor interest.
As we move into the traditionally quiet third quarter and look further ahead toward the US presidential election, we anticipate the stop-start pattern will continue in the second half of 2016.
Next-gen IPOs will be bigger and better preparedOne of the factors putting a damper on US IPO activity has been the ongoing strength of the private capital market. In May 2016, PE firms had a record US$500b globally in dry powder available to fund deals; exceeding 2006-2007 levels, as PE firms have raised capital faster than they could deploy it. This abundance of private capital offers the next generation of would-be public companies the financial flexibility to tap the private market in the short term and defer the timing of their IPO until their companies mature and the IPO windows are more favorable, probably at some point in 2017, when the uncertainty surrounding the US presidential election has subsided and the economy may be on a more stable growth trajectory.
PE is also active on the sell-side and financial sponsor-backed IPOs continue to feature prominently in the US IPO landscape. Around half (49%) of the deals on US exchanges were financial-sponsored IPOs in the first half of 2016 and 8 of the top 10 US exchange IPOs were PE-backed.
Stop-start market will continue into second halfAs we look ahead to the second half of 2016, growth prospects for the US appear somewhat constrained in the near-term due to a strong US dollar, sluggish global demand and reduced oil and gas investments. However, we expect the growth prospective for the US economy to improve in the mid- to long-term amid strong underlying fundamentals — particularly a strong labor market and improving manufacturing activity. The markets anticipate the Federal Reserve will move cautiously to decide the timing of the next interest rate rise.
On the back of these mixed signals, IPO activity in the US will likely remain stop-start, but we are encouraged that the pipeline will continue to fill up, particularly as we move onto more certain ground following the US presidential election in November. An early sign of improvement to come is that technology IPOs are starting to make a comeback and are in the pipeline. This revival of companies looking to list from the technology sector is encouraging, with an estimate of 40 private tech companies looking to complete their IPO listings toward the end of 2016 and beyond.
US IPO activity shows marked improvement in 2Q16
| 7
US IPO highlights2Q16 YTD(January-June 2016)5
Key trends Commentary
Financial sponsors continue to drive US IPO market
PE and VC account for 49% of US IPOs (22 deals)
US
NYSE
2Q16YTD8 13 deals (US$4.2b)
31 deals (US$2.5b)
NASDAQ
2Q16 26 deals, US$2.7b
40 deals (US$13.2b)
67 deals (US$7.2b)2Q15YTD
2Q15 81 deals, US$12.6b
60% by proceeds (US$4.2b)
IPO pricing and performance6
IPO activity
China 4 deals (US$439m)
Argentina 1 deal (US$323m)
Netherlands 1 deal (US$61m)
Cross-border activity in 2Q16 YTD from
New registrations
Three sectors trending
Volume and value
45 deals(58% decrease on 2Q15 YTD)
US$7.0bin capital raised
(66% decrease on 2Q15 YTD)
Jackie KelleyEY Americas IPO Leader
5. 2Q16 YTD (January-June 2016) IPO activity is based on priced IPOs as of 18 June and expected IPOs by end of June.
6. Pricing and performance is based on 39 IPOs on NYSE and NASDAQ that have started trading by 18 June.7. Year-to-date returns of equity indices as of 17 June.8. In 2Q16 YTD, there was also one IPO on the BATS exchange which raised US$290m, besides IPOs
on NYSE and NASDAQ.
49%of US IPOs
“Newly listed stocks remain a source of value in an economy where financial market returns are scarce, and 2016 US IPOs did not disappoint with high double-digit returns. We always knew that this would be a stop-start year for IPOs thanks to headwinds caused by political and monetary uncertainty. Amidst the uncertainty, a robust IPO pipeline has been building for 2017. We expect 2017 to be a great year for US IPOs, filled with Unicorns, disruptive technology companies, and market innovators across all industries.”
• IPO activity looks set to remain stop-start through 2H16 on the back of mixed economic signals and the uncertainty caused by the US presidential election. Companies will need to be ready to move fast when conditions are favorable.
• Health care, technology and financials companies will continue to feature in the IPO landscape as investors seek a combination of growth and value generation. The pipeline continues to build as companies consider going out at the end of 2016 or in early 2017.
• Private capital will continue to hold its own as an alternative to public finance — enabling companies to build scale and experience before coming to the public markets.
S&P 500 +0.4%
DJIA +0.4%
Equity indices7first-day average return+7.5%increase in offer price vs. 17 June 2016+18.7%median post-IPO market cap
US$373.6m VIX® +12.3%
Financials5 deals (US$0.8b)
Technology7 deals(US$0.8b)
Health care22 deals (US$1.5b)

8 |
With 229 IPOs raising US$17.0b in the first half of the year, Asia-Pacific was the most active region by number of deals and ranked second behind EMEIA in terms of capital raised. Although this represents a decrease of 37% and 65% respectively on the same period in 2015, this is broadly in line with the global trend. Investor sentiment appears less cautious than in some other regions and with a healthy pipeline of companies ready to go public when the timing is right, the stage is set for an increase in IPOs on Asia-Pacific exchanges in the second half of the year. For the quarter, 2Q16 IPO proceeds rose to US$9.3b, and at 122 IPOs, the number of deals rose by 14% compared to the prior quarter.
• The 10 largest IPOs by proceeds in Asia-Pacific in 2Q16 YTD came from six different exchanges, showing breadth of listing destinations within the region.
• Six of the top ten busiest exchanges worldwide by volume in 2Q16 YTD came from the Asia-Pacific region.
• Industrials, technology and consumer products and services saw the highest number of IPOs in the first half of 2016.
ASEAN sees pickup in second quarterASEAN exchanges saw a muted start to 2016, with investors in “wait-and-see” mode in the face of uneven global economic data, lower corporate earnings, commodity price volatility, the uncertainty over the UK’s EU referendum and divergent interest rate policies. As a result, REITS and business trusts remain popular due to their liquidity and steady yields. For this same reason, debt issuance activity by corporates is also very much in vogue.
However, toward the end of the second quarter, IPO activity in ASEAN started to pick up, with higher average deal size. As the market has stabilized and executing a public listing becomes more manageable, there have been a number of IPOs of smaller entrepreneurial companies, which are easier to price and bring to market. Activity continues to be particularly robust in the technology space, fueling a flow of IPOs as entrepreneurs come to market to raise funds for expansion. Meanwhile, others are looking for alternative sources of funding (for example, private equity and crowdfunding) as they wait for IPO pricing to improve and for a more attractive time to come to market.
While there have been listings on the Thailand, Indonesia, Malaysia and Philippines stock exchanges in 2Q16, the most significant activity has been on the Singapore Main Market, which has seen two recent sizeable IPOs. In May, Frasers Logistics & Industrial Trust raised US$669m after pricing at the top of its indicative range in the city-state’s biggest new listing in three years, while earlier that month Manulife REIT raised US$470m. Elsewhere, in the region’s biggest IPO of the quarter, Singapore-based BOC Aviation Ltd. was listed on the Hong Kong Stock Exchange in a deal that raised US$1.1b.
Activity in Japan remains on course for another strong yearAt the half way point of the year, IPO activity in Japan remains on course to match the strong levels seen in 2015. In the first six months of 2016 there have been 43 IPOs on Japan’s Main Board, MOTHER and JASDAQ exchanges, raising US$1.7b in proceeds. This compares to US$1.5b raised in 46 deals in the same period
last year, and puts Japan third on the Asia-Pacific leader board behind Mainland China exchanges and the Hong Kong Main Market and Growth Enterprise Market (GEM), in terms of deal value.
The consumer products and services sector and the technology sector continue to be the most active by deal number, supported by the recovery in household consumption, while a small proportion of new listings are VC- or corporate venture-backed. The Nikkei Stock Average has been relatively stable, in contrast to the volatility in other markets, and this is helping to maintain positive investor sentiment; less than five companies have withdrawn or postponed their IPOs so far in 2016.
Looking ahead, a steady flow of Japanese IPOs is expected through the remainder of the year. This will include Line Corp., Japan’s most popular mobile-messaging service, which is aiming to go public in 3Q16. The company will dual-list on the Tokyo Stock Exchange and New York Stock Exchange at a total market valuation of around US$5.5b, putting it on track to be the one of the biggest IPO listings by proceeds globally this year.
Australia IPOs in line with 2015 There were 33 IPOs raising US$1.4b on the Australian Securities Exchange in the first half of 2016, compared to US$2.3b in proceeds through 33 new listings in the same period in 2015. Technology continues to be the most active sector with a healthy pipeline of pre-revenue businesses looking for IPO funding, and the second quarter also saw companies from the industrials, materials, health care and media and entertainment sectors going public.
There is some skepticism regarding companies looking to float where their investors have signalled that they will take the opportunity to exit at the IPO rather than staying committed to the listed company. However, the Australian IPO market remains the primary exit route for PE- and VC-backed entities. With many firms now in the investment phase of the cycle following a record number of financial sponsor-backed listings in 2014, we expect to see a higher number of PE- and VC-backed exits via IPO in a few years’ time.
Risk to IPOs as a preferred exit mechanism has been increasing with the significant global capital market volatility of early 2016 and the uncertain outlook for global GDP growth. As a result, an increasing number of investors and advisers are following a dual-track process to maximize opportunity and value. We expect this trend to continue for the remainder of the year. In a further development, we continue to see steady interest from foreign small- to mid-sized companies wanting to list on the ASX, which may lead to an increase in the number of inbound cross-border listings in the medium term.
Asia-Pacific set to be most active region in second half

| 9
TSETokyo11
US$1.7b(43 deals)
ASXAustralia
US$1.4b(33 deals)
SGXMain and Catalist
US$1.2b(7 deals)
229 deals(37% decrease on 2Q15 YTD)
Asia-Pacific IPO highlights2Q16 YTD(January–June 2016)9
Key trends
Top six exchanges by funds raised
Commentary
Cross-border IPOs
Six sectors trending
Volume and value
Shenzhen10
US$2.4b(35 deals)
SZSESSEShanghai
US$2.5b(28 deals)
“The outlook for the IPO market in Asia-Pacific is brightening following a period of uncertainty. Although a number of political and economic headwinds including the slowdown in China’s growth rate, fluctuating commodity prices and the possibility of a further interest rate rise in the US continue to weigh on investors, a sense of optimism is returning. This is translating into deals in mature markets such as Japan, Australia and South Korea, while new listings on emerging market exchanges are also on the rise.”
Ringo ChoiEY Asia-Pacific IPO Leader
9. 2Q16 YTD (January-June 2016) IPO activity is based on priced IPOs as of 18 June and expected IPOs by end of June.10. Shenzhen Stock Exchange includes IPO listings from the Main Board, SME Board and ChiNext.11. Tokyo Stock Exchange include IPO listings from the Main Board, MOTHERS and JASDAQ.12. Pricingandperformanceisbasedon205IPOsofAsia-Pacificexchangesthathavestartedtradingby17June.Dataasof18June.13.Year-to-datereturnsofequityindicesasof17June.
US$17.0bin capital raised
(65% decrease on 2Q15 YTD)
IPO pricing and performance12
• Asia-Pacificwasthemostactiveregionworldwidebynumberofdealsinthefirsthalf of 2016. The strong pipeline combined withimprovinginvestorsentimentsuggestsprospects for the second half of 2016 are strong.
• Greater China, Japan, Australia and South KoreaexchangessawthehighestnumberofIPO listings across the region.
• Signs are emerging that investor sentiment inASEANisstrengthening,withconfidencegrowingindevelopedmarketsinparticular.
GreaterChinaissuerssaw 2 deals eachonKOSDAQandNASDAQ,and1dealeachonASX,DeutscheBorse,NewYorkStockExchangeandAsia-PacificExchange.
Singaporeissuerssaw2 deals that raised US$1.2b on Hong Kong (HKEx) and 1 deal that raised US$1.4m on the First North market in Stockholm.
HongKongMainMarketsaw2 deals from Singapore that raised US$1.2b.
first-day average returns+22.4% increase in offer price vs.17June2016+106.8%median post-IPO market cap
US$111.3m
Technology44 deals(US$1.2b)
HANG SENG FTSE STRAITSTIMESSHANGHAI COMP
ASX 200NIKKEI 225
-7.8%-4.2%
-19.3%
-3.0%-18.0%
Equity indices13
Industrials50 deals(US$3.2b)
HKExMain and GEM
US$5.6b(37 deals)
Consumer products26 deals(US$1.9b)
Materials20 deals(US$1.0b)
Health care17 deals(US$0.6b)
Consumer staples
17 deals(US$1.1b)

10 |
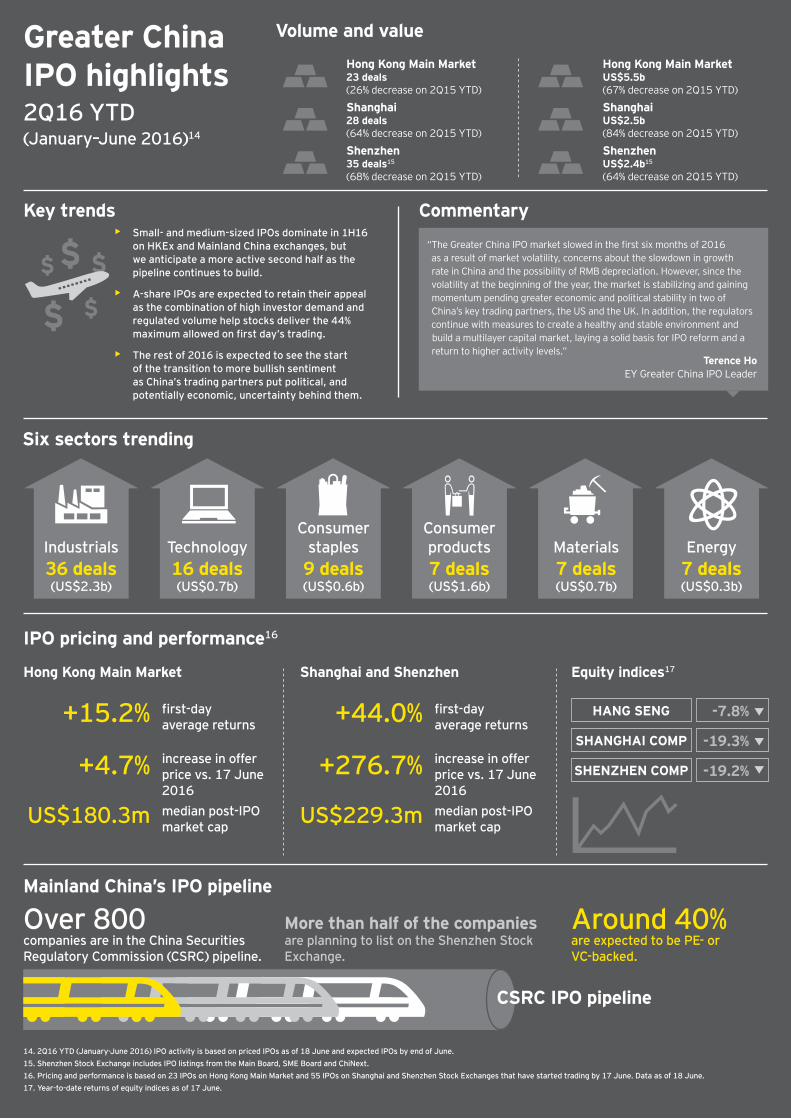
The IPO market in Greater China saw another slow quarter in 2Q16 with investors wary of the slowdown in growth rate on the Mainland and the possibility of a currency devaluation. As a result, the number of deals for the first six months of 2016 was 101 IPOs, down from 236 IPOs in 2Q15 YTD. Capital raised was also down, to US$10.5b from US$40.7b in the first half of 2015. However, the outlook for the second half of the year is more positive with a strong IPO pipeline in both mainland China and Hong Kong.
• The Hong Kong Main Board and GEM and the Shenzhen StockExchange were the two most active stock exchanges globally in 2Q16 YTD by number of deals; the Hong Kong Main Board led globally by capital raised.
• Hong Kong Main Board saw three of the top ten largest IPOs globally in 2Q16 YTD.
Momentum building in Hong KongThe Hong Kong IPO market has been relatively quiet this year due principally to uncertainty around another rise in US interest rates and concerns over the slowdown in growth rate in mainland China. In the first six months of 2016 there were 23 IPOs on the Hong Kong Main Board, raising US$5.5b in proceeds, a drop of 26% and 67%, respectively on the same period last year.
Industrials, technology and consumer products were the most active sectors, driven by a number of IPOs of smaller companies that mainly listed on the junior market GEM. However, in terms of funds raised, financials dwarfed other industries with Mainland China banks eager to get listed to access the capital needed to fuel their growth. Often, the route to an A-share IPO takes a relatively longer time, leading many Mainland city banks to look at Hong Kong instead. Two of the three largest deals in Asia in the first half of 2016 are examples of this sector: China Zheshang Bank Co., Ltd. and Bank of Tianjin Co., Ltd., which both listed on the Hong Kong Main Board in March, raising US$1.9b and US$989m, respectively.
Splitting these two deals on the leader board, BOC Aviation Ltd., Asia’s largest aircraft lessor by fleet value, raised US$1.1b in June and is the region’s second largest IPO so far this year. With aircraft leasing companies benefiting from strong economic activity and promising growth prospects, another company, CDB Leasing, is also preparing for an IPO in Hong Kong during the second half of the year.
After the market volatility at the beginning of 2016, investor sentiment is recovering. As of 17 June, the Hang Seng Index had climbed around 10% since its low point in February. We have seen valuations rising: in 2Q16, 41% of IPOs priced in the upper range, up from 32% in 1Q16. In another positive signal, the IPO for apparel label producer Hang Sang (Siu Po) International Holding Company Limited was oversubscribed by more than 2,000 times, ranking it third by highest multiples of oversubscription since 2014.
Stability is the watchword in Mainland ChinaThe pace of IPO activity in Mainland China continues to be determined by the regulator as the Chinese Government seeks to control the flow of new listings in order to maintain stability in
the capital markets. Mainland China exchanges raised US$4.9b through 63 IPOs in 2Q16 YTD, compared to 187 new listings with total proceeds of US$23.8b in 2Q15 YTD.
As in Hong Kong, the Mainland China market this year has been dominated by small and medium-sized IPOs with 67% of IPOs raising less than US$75m. Year-on-year, the average funds raised have declined from US$127m in the first half of 2015 to US$78m in the first half of 2016. The largest IPO of the year so far is Shandong Linglong Tyre Co., Ltd., which is expected to raise US$399m on the Shanghai Stock Exchange at the end of June and First Capital Securities, which raised US$359m on the Shenzhen Stock Exchange in May, followed by China Nuclear Engineering Corp., Ltd., the country’s leading nuclear project builder, which raised US$278m from its long-awaited IPO in Shanghai at the start of June.
By sector, industrials led the way on Mainland exchanges, both in terms of volume and value. The sector was ahead of consumer staples and energy by deal number. However, across the market, investor sentiment for A-share IPOs remains overwhelmingly positive as they continue to make healthy returns. In 2Q16, every IPO rose by the 44% maximum permitted on the first day of trading.
A two-speed outlookThere are now more than 800 companies ready to go public in China, so with the pipeline building there is no shortage of potential IPOs. However, in the short term, the regulator will continue to keep a close eye on market conditions and modulate new listings accordingly.
Further ahead, the launch of the Shenzhen-Hong Kong (SZ-HK) Stock Connect scheme later this year will allow investors on both sides to conduct cross-border trading up to a certain monetary cap per day and is expected to attract a greater amount of foreign capital and a wider range of investment opportunities.
Meanwhile, mainland China’s shift toward a registration system for IPOs is likely still some way off as regulators take time to study its details before its launch. In the meantime, the emphasis of market reform is shifting to risk prevention and multilevel capital market building. In a move designed to better allocate regulatory resources to support start-up companies, the over-the-counter National Equities Exchange and Quotations (launched in late 2012) has been officially divided into two distinct levels: the “innovation level” and the “basic level.”
In contrast, the Hong Kong IPO market is expected to heat up through the remainder of 2016. There is a strong pipeline of companies waiting for the right window to open. This is expected to include a number of large listings.
Activity in Greater China lags, but a pickup is expected
Greater ChinaIPO highlights2Q16 YTD(January–June 2016)14
Key trends
HANG SENG
SHANGHAI COMP
SHENZHEN COMP
Commentary
Over 800companies are in the China SecuritiesRegulatory Commission (CSRC) pipeline.
More than half of the companiesare planning to list on the Shenzhen StockExchange.
Around 40%are expected to be PE- orVC-backed.
Mainland China’s IPO pipeline
Volume and value
Hong Kong Main Market23 deals(26% decrease on 2Q15 YTD)
Hong Kong Main MarketUS$5.5b(67% decrease on 2Q15 YTD)
Shanghai28 deals(64% decrease on 2Q15 YTD)
ShanghaiUS$2.5b(84% decrease on 2Q15 YTD)
Shenzhen35 deals15
(68% decrease on 2Q15 YTD)
ShenzhenUS$2.4b15
(64% decrease on 2Q15 YTD)
“The Greater China IPO market slowed in the first six months of 2016as a result of market volatility, concerns about the slowdown in growthrate in China and the possibility of RMB depreciation. However, since thevolatility at the beginning of the year, the market is stabilizing and gainingmomentum pending greater economic and political stability in two ofChina’s key trading partners, the US and the UK. In addition, the regulatorscontinue with measures to create a healthy and stable environment andbuild a multilayer capital market, laying a solid basis for IPO reform and areturn to higher activity levels.”
Terence HoEY Greater China IPO Leader
14. 2Q16 YTD (January-June 2016) IPO activity is based on priced IPOs as of 18 June and expected IPOs by end of June.15. Shenzhen Stock Exchange includes IPO listings from the Main Board, SME Board and ChiNext.16. Pricing and performance is based on 23 IPOs on Hong Kong Main Market and 55 IPOs on Shanghai and Shenzhen Stock Exchanges that have started trading by 17 June. Data as of 18 June.17. Year-to-date returns of equity indices as of 17 June.
Six sectors trending
-7.8%
-19.3%
-19.2%
CSRC IPO pipeline
first-dayaverage returns+15.2% first-day
average returns+44.0%increase in offerprice vs. 17 June2016
+4.7% increase in offerprice vs. 17 June2016
+276.7%
IPO pricing and performance16
Hong Kong Main Market Shanghai and Shenzhen Equity indices17
• Small- and medium-sized IPOs dominate in 1H16on HKEx and Mainland China exchanges, butwe anticipate a more active second half as thepipeline continues to build.
• A-share IPOs are expected to retain their appealas the combination of high investor demand andregulated volume help stocks deliver the 44%maximum allowed on first day’s trading.
• The rest of 2016 is expected to see the startof the transition to more bullish sentimentas China’s trading partners put political, andpotentially economic, uncertainty behind them.
median post-IPOmarket capUS$180.3m median post-IPO
market capUS$229.3m
Industrials36 deals(US$2.3b)
Consumerproducts7 deals(US$1.6b)
Energy7 deals(US$0.3b)
Technology16 deals(US$0.7b)
Consumerstaples9 deals(US$0.6b)
Materials7 deals(US$0.7b)
| 11
Greater China IPO highlights2Q16 YTD(January–June 2016)14
Key trends
HANG SENG
SHANGHAI COMP
SHENZHEN COMP
Commentary
Over 800companies are in the China Securities Regulatory Commission (CSRC) pipeline.
More than half of the companiesare planning to list on the Shenzhen Stock Exchange.
Around 40%are expected to be PE- or VC-backed.
Mainland China’s IPO pipeline
Volume and value
Hong Kong Main Market 23 deals (26% decrease on 2Q15 YTD)
Hong Kong Main Market US$5.5b (67% decrease on 2Q15 YTD)
Shanghai28 deals(64% decrease on 2Q15 YTD)
ShanghaiUS$2.5b(84% decrease on 2Q15 YTD)
Shenzhen35 deals15
(68% decrease on 2Q15 YTD)
ShenzhenUS$2.4b15
(64% decrease on 2Q15 YTD)
“The Greater China IPO market slowed in the first six months of 2016 as a result of market volatility, concerns about the slowdown in growth rate in China and the possibility of RMB depreciation. However, since the volatility at the beginning of the year, the market is stabilizing and gaining momentum pending greater economic and political stability in two of China’s key trading partners, the US and the UK. In addition, the regulators continue with measures to create a healthy and stable environment and build a multilayer capital market, laying a solid basis for IPO reform and a return to higher activity levels.”
Terence HoEY Greater China IPO Leader
14. 2Q16 YTD (January-June 2016) IPO activity is based on priced IPOs as of 18 June and expected IPOs by end of June. 15. Shenzhen Stock Exchange includes IPO listings from the Main Board, SME Board and ChiNext.16. Pricing and performance is based on 23 IPOs on Hong Kong Main Market and 55 IPOs on Shanghai and Shenzhen Stock Exchanges that have started trading by 17 June. Data as of 18 June.17. Year-to-date returns of equity indices as of 17 June.
Six sectors trending
-7.8%
-19.3%
-19.2%
CSRC IPO pipeline
first-day average returns +15.2% first-day
average returns +44.0%increase in offer price vs. 17 June 2016
+4.7% increase in offer price vs. 17 June 2016
+276.7%
IPO pricing and performance16
Hong Kong Main Market Shanghai and Shenzhen Equity indices17
• Small- and medium-sized IPOs dominate in 1H16on HKEx and Mainland China exchanges, but we anticipate a more active second half as thepipeline continues to build.
• A-share IPOs are expected to retain their appealas the combination of high investor demand and regulated volume help stocks deliver the 44%maximum allowed on first day’s trading.
• The rest of 2016 is expected to see the start of the transition to more bullish sentiment as China’s trading partners put political, and potentially economic, uncertainty behind them.
median post-IPO market capUS$180.3m median post-IPO
market capUS$229.3m
Industrials36 deals(US$2.3b)
Consumer products7 deals(US$1.6b)
Energy7 deals(US$0.3b)
Technology16 deals(US$0.7b)
Consumer staples9 deals(US$0.6b)
Materials7 deals(US$0.7b)

12 |
EMEIA exchanges performed well in 2Q16, despite the uncertainty from the UK referendum. EMEIA led global IPO activity by proceeds and ranked second by deal number, behind Asia-Pacific. Supportive monetary policy and an improving economy has led to a pickup in IPO activity on 2Q16 compared to 1Q16. Activity is expected to remain strong in the second half of 2016.
Due to the more volatile market environment so far in 2016, average deal size on EMEIA main markets decreased from US$88m in 2015 to US$71m for the first half of 2016. Issuer size remained stable, as shown by the US$288.5m median post-IPO market cap in the first half of 2016 compared with US$303.9m in 2015. Moreover, market sentiment and post-IPO performance have improved, with IPOs in 2Q16 having slightly higher first-day average returns than those from 1Q16. In fact, to date, first-day average IPO returns in 2016 have been higher than the returns of broad equity indices in various EMEIA markets.
• There were 85 IPOs in EMEIA in 2Q16, raising a total of US$14.0b, an increase of 187% in proceeds and 21% in deal numbers compared with 1Q16.
• With 18 IPOs each in 2Q16, London Stock Exchange and NASDAQ OMX were the most active exchanges by deal volume. By proceeds, NASDAQ OMX, Euronext and Borsa Italiana were the top three exchanges by capital raised in 2Q16.
• EMEIA hosted six of the quarter’s top ten listings globally by proceeds, spread across five different exchanges and 11 of the quarter’s top 20 global IPO listings.
Return of the big hittersAfter just one US$1b+ deal globally in the first quarter of the year, the second quarter saw a return to larger deal activity, particularly across EMEIA. Three of the quarter’s six US$1b+ deals were listed on EMEIA exchanges (NASDAQ OMX Copenhagen, Euronext Amsterdam and Borsa Italiana) accounting for combined proceeds of US$4.9b. Furthermore, 8 of the 14 US$500m+ deals for the quarter were also from EMEIA.
Sponsor-backed IPO activity reboundedFinancial sponsor-backed IPO activity in EMEIA rose significantly in 2Q16 compared to a muted first quarter, with 21 IPOs raising US$4.7b altogether in 2Q16. PE and VC-backed participation in IPOs also rose from 9% in 1Q16 to 25% of EMEIA IPOs in 2Q16. IPO remains a popular exit route for PE firms compared to selling their stake to other PE and strategic buyers. The proportion of EMEIA exits via IPO in the first half of 2016 is only slightly lower than in the last two years, whereas the proportion is notably lower for Americas and Asia-Pacific exits.
UK’s referendum has mixed impact The UK referendum on European Union (EU) membership has had a mixed impact on the European IPO market throughout 2Q16. Uncertainty surrounding the result has subdued activity in the UK, with the London exchanges recording just 18 IPOs raising a total of US$1.1b, little improved from 16 IPOs raising US$2.7b in 1Q16, which is traditionally the quietest quarter of the year.
However, Europe-wide volatility has been relatively low, with the VDAX and VSTOXX volatility indices sitting around the low 20s for the majority of 2Q16. Only in mid-June did volatility peak to the high 30s on the back of fresh polls suggesting a British swing in favor of an exit from the EU. This demonstrates that for the most part, at least ahead of the vote, European markets have been insulated from the UK referendum, as investors remained happy to support European listings with no strong connection to the UK and its associated political uncertainty.
Furthermore, some analysts have suggested that this has actually improved the prospects of other European exchanges that have seen a pickup in activity. Beyond the usual hubs of UK and France, healthy IPO activity has spread across the continent with stock exchanges in Denmark, the Netherlands, Italy, Czech Republic and Spain all hosting listings in the global top 10 by proceeds.
Sweden and India regional winnersEven with this uncertainty around the EU referendum, the UK remained one of the most active markets in EMEIA for 2Q16. The NASDAQ OMX also performed strongly with 18 IPOs in the quarter, including 5 listings on the Stockholm Main Market and 9 on the First North junior market.
India’s Bombay Main Market and SME Board saw 11 IPOs in 2Q16 and had a strong quarter by proceeds, making it the only market globally to see a year-on-year improvement. Capital raised was 116% higher compared to 2Q15 due to higher average deal size, while deal number declined by 15%. There were the same number of Main Market IPOs, and slightly fewer IPOs on the SME Board in 2Q16 than 2Q15. Activity has been supported by planned economic reform initiatives, a fast-growing economy and an overall attractive economic climate, which has encouraged listings as well as wider corporate activity.
Outlook broadly positive European IPO levels are set to continue to increase as the European Central Bank (ECB) stimulus package continues to support economic activity. However, this could be moderated by political issues such as sovereign debt, regional elections and the ongoing migration challenge that continue to inject uncertainty into European markets.
The outlook for the Middle East and North Africa remains subdued as regional conflict and economic slowdowns in member countries of the Gulf Cooperation Council continue. However, stabilizing oil prices and greater political stability in recent months should lead to a more favorable environment toward the end of the year and into 2017.
The outlook for India IPO activity and investor sentiment is also positive due to stronger economic and regulatory reforms. Increased IPO activity is expected in sectors such as financial services, IT, life science and automotive. Divestments are also likely to be another contributing factor to a strong IPO market with the Indian Government looking to list a number of profitable public sector units spanning a range of sectors from energy to financial services.
EMEIA exchanges lead by proceeds
EMEIA IPO highlights2Q16 YTD(January–June 2016)18
Key trends
Investorconfidence
Top five exchanges by funds raised
Commentary
Financial sponsor activity rose by 250% in 2Q16 compared to 1Q16
Cross-border IPOs
Three sectors trending
Volume and value
Main markets:77 deals(36% decrease on 2Q15 YTD)
Main markets:proceeds US$17.3b(53% decrease on 2Q15 YTD)
Junior markets:78 deals(20% decrease on 2Q15 YTD)
Junior markets:proceeds US$1.6b(14% increase on 2Q15 YTD)
LSEMain Market and AIM
US$3.8b(34 deals)
Borsa ItalianaBorsa Italiana and AIM
US$1.6b(7 deals)
BMEBolsa de Madrid
and MaB
US$1.5b(5 deals)
EuronextEuronext and Alternext
US$3.2b(11 deals)
NASDAQ OMXNASDAQ OMX and
First North
US$4.8b(26 deals)
“Despite the IPO market clearly being affected by uncertainty surrounding the UK’s EU referendum, EMEIA has performed strongly, especially when compared to other regions. While deal sizes are still lower than average, IPOs in the region are offering investors relatively healthy returns when compared to other indices. In addition, the strong rebound in financial sponsor-backed IPOs this quarter is a sign of increasing confidence. In this context, we are still positive about the second half of the year as IPO-ready companies continue to take opportunities to come to market across the region. However, prolonged uncertainty in the UK following the EU referendum will clearly have an impact.”
Dr. Martin SteinbachEY EMEIA IPO Leader
18. 2Q16 YTD (January–June 2016) IPO activity is based on priced IPOs as of 18 June and expected IPOs by end of June.
19. Pricing and performance is based on 69 IPOs on main markets and 72 IPOs on junior markets that have started trading by 17 June. Data as of 18 June.
20. Year-to-date returns of equity indices as of 17 June.
Equity indices20
IPO pricing and performance
FTSE 100
DAX
CAC 40
MICEX
BSE SENS
JSE All share +2.6%
+2.6%
-10.3%
-10.3%
+6.6%
-4.0%
VSTOXX®
In 2Q16 YTD, PE/VC accounted for 17% of EMEIA IPOs (27 deals)
34% by proceeds (US$6.4b)
• In 2Q16 YTD, IPOs on EMEIA main markets recorded strong results, with 70% of IPOs pricing within or above their initial pricing range and average first-day returns at +6%.
• Health care led by deal number with 16% of EMEIA IPOs, followed by industrials and technology, each representing 14% of deals.
• Financial sponsors continue to support deal activity, accounting for 17% of deals and 34% of proceeds in the first six months of 2016.
17%of EMEIA
IPOs
first-day average return+6.0% first-day
average return+13.2%increase in offer price vs. 17 June 2016+9.8% increase in offer price
vs. 17 June 2016+16.1%median post-IPO market cap
US$288.5m median post-IPO market cap
US$20.3m
Main markets19 Junior markets19
Health care25 deals(US$1.2b)
Industrials22 deals(US$2.2b)
Technology21 deals(US$0.8b)
+71.5%
EMEIA issuers conducted 9 cross-border deals: 5 deals by EMEIA issuers were listed on NASDAQ OMX First North — Stockholm (three from Denmark, one each from Malta and Switzerland). 1 deal each by EMEIA issuers were listed on NASDAQ, Euronext (Paris), London (AIM) and Australia (ASX).

| 13
EMEIA exchanges lead by proceeds
EMEIA IPO highlights2Q16 YTD(January–June 2016)18
Key trends
Investorconfidence
Top five exchanges by funds raised
Commentary
Financial sponsor activity rose by 250% in 2Q16 compared to 1Q16
Cross-border IPOs
Three sectors trending
Volume and value
Main markets:77 deals(36% decrease on 2Q15 YTD)
Main markets:proceeds US$17.3b(53% decrease on 2Q15 YTD)
Junior markets:78 deals(20% decrease on 2Q15 YTD)
Junior markets:proceeds US$1.6b(14% increase on 2Q15 YTD)
LSEMain Market and AIM
US$3.8b(34 deals)
Borsa ItalianaBorsa Italiana and AIM
US$1.6b(7 deals)
BMEBolsa de Madrid
and MaB
US$1.5b(5 deals)
EuronextEuronext and Alternext
US$3.2b(11 deals)
NASDAQ OMXNASDAQ OMX and
First North
US$4.8b(26 deals)
“Despite the IPO market clearly being affected by uncertainty surrounding the UK’s EU referendum, EMEIA has performed strongly, especially when compared to other regions. While deal sizes are still lower than average, IPOs in the region are offering investors relatively healthy returns when compared to other indices. In addition, the strong rebound in financial sponsor-backed IPOs this quarter is a sign of increasing confidence. In this context, we are still positive about the second half of the year as IPO-ready companies continue to take opportunities to come to market across the region. However, prolonged uncertainty in the UK following the EU referendum will clearly have an impact.”
Dr. Martin SteinbachEY EMEIA IPO Leader
18. 2Q16 YTD (January–June 2016) IPO activity is based on priced IPOs as of 18 June and expected IPOs by end of June.
19. Pricing and performance is based on 69 IPOs on main markets and 72 IPOs on junior markets that have started trading by 17 June. Data as of 18 June.
20. Year-to-date returns of equity indices as of 17 June.
Equity indices20
IPO pricing and performance
FTSE 100
DAX
CAC 40
MICEX
BSE SENS
JSE All share +2.6%
+2.6%
-10.3%
-10.3%
+6.6%
-4.0%
VSTOXX®
In 2Q16 YTD, PE/VC accounted for 17% of EMEIA IPOs (27 deals)
34% by proceeds (US$6.4b)
• In 2Q16 YTD, IPOs on EMEIA main markets recorded strong results, with 70% of IPOs pricing within or above their initial pricing range and average first-day returns at +6%.
• Health care led by deal number with 16% of EMEIA IPOs, followed by industrials and technology, each representing 14% of deals.
• Financial sponsors continue to support deal activity, accounting for 17% of deals and 34% of proceeds in the first six months of 2016.
17%of EMEIA
IPOs
first-day average return+6.0% first-day
average return+13.2%increase in offer price vs. 17 June 2016+9.8% increase in offer price
vs. 17 June 2016+16.1%median post-IPO market cap
US$288.5m median post-IPO market cap
US$20.3m
Main markets19 Junior markets19
Health care25 deals(US$1.2b)
Industrials22 deals(US$2.2b)
Technology21 deals(US$0.8b)
+71.5%
EMEIA issuers conducted 9 cross-border deals: 5 deals by EMEIA issuers were listed on NASDAQ OMX First North — Stockholm (three from Denmark, one each from Malta and Switzerland). 1 deal each by EMEIA issuers were listed on NASDAQ, Euronext (Paris), London (AIM) and Australia (ASX).

14 |
Following a slow start to the year in the UK, 2Q16 has continued at a sluggish pace with just 18 IPOs — four IPOs on London Main Market and 14 IPOs on AIM — raising a combined total of US$1.1b. Compared with 2Q15, deal numbers in 2Q16 were the same, but capital raised fell by 65%. This subdued performance reflects the broader global trend, but UK IPO activity has also been significantly affected by uncertainty in the lead-up to the referendum where the UK decided to leave the EU.
• In the first half of the year, there was a total of 34 IPOs on the London Main Market and AIM, raising US$3.8b, down from 38 new listings with proceeds of US$7.5b in 2Q15 YTD.
• Companies that have come to market in the first half of 2016 have performed well. Newly listed stocks on the London Main Market are currently trading on average 22% above offer price, with only 4 out of 11 stocks trading below their offer price. Meanwhile, new listings on London AIM are currently trading on average 16% above their offer price, with 3 out of 23 stocks trading below their offer price.
• Three of the eighteen IPOs in London in 2Q16 were cross-border, including Italian firm Directa Plus srl — the strongest performer of the quarter — currently trading at 80% above list price.
London waits for political uncertainty to be resolvedSince February, when the UK Government set the date for the EU referendum, there has been a notable reduction in the number of IPOs. Companies chose to postpone their flotation plans until the referendum result was known to ensure they had greater clarity about the future.
Despite the uncertainty, investor appetite for IPOs remains and those companies that have listed have generally performed well. This indicates that the specific characteristics of individual businesses are still driving their success, rather than general investor sentiment. Therefore, a London IPO remains a viable option for well-priced companies with a skilled management team and a compelling equity story.
Materials, automotive and retail continue to make headwayThe limited activity in 2Q16 was reflected by the absence of larger deals — just five IPOs in the quarter raised more than US$100m — with no one sector standing out. The largest new listing was Forterra plc, a construction materials producer, which raised US$184m in April buoyed by the recent expansion in the UK housebuilding market. The PE-backed firm has become the second largest brick manufacturer listed on the Main Market after Ibstock, which debuted in London in 4Q15.
Similarly, the resurgence in the UK car industry led to the flotation of car retailer Motorpoint Group plc, the second largest IPO this quarter, which raised US$144m in May. Motorpoint has made the most of the growth in the sector, which has also seen the entrance to the London Main Market last year by three other businesses in the industry: online car marketplace Autotrader Group, British Car Auctions owner BCA Marketplace plc and car dealer Marshall Motor Holdings.
The third largest IPO in 2Q16 was PE-backed entertainment magazine publisher Time Out Group Ltd., which raised US$131m on London AIM at the start of June. The other two IPOs that raised more than US$100m were both retail companies, accounting for 20% of proceeds raised in 2Q16, and indicating the enduring strength of this sector on the London markets, even in a quiet quarter. With more companies in the pipeline, we expect the sector will continue to contribute strongly to IPO activity through the remainder of the year.
PE remains a key driverAlthough only four PE-backed companies entered the London market in 2Q16, all were in the top six listings by proceeds and together they accounted for 49% of capital raised in the UK during the quarter. In fact, for the first half of 2016, PE-backed IPOs accounted for 21% of IPOs in the UK and 54% of IPO proceeds.
Looking ahead to the second half of the year and into 2017, we expect PE to remain a key driver of IPO activity. PE-backed businesses wishing to exit are likely to act quickly to take advantage of any positive change in investor confidence in the markets, following the resolution of uncertainty surrounding the EU referendum.
Referendum result to shape outlook for remainder of the yearThe result of the EU referendum will determine the level of IPO activity for the remainder of the year.
The UK’s decision to exit the EU is likely to result in a temporary weakening of UK equity markets and a significant depreciation of the pound. In the short-term, IPO activity may remain subdued, with listings focused on smaller companies with UK-generated revenues, which do not have to contend with international trade issues. Companies will also have to adapt to the probable change in the regulatory environment created by the exit from the EU. As equity markets stabilize, and looking ahead to 2017, IPO activity is expected to increase as companies that delayed a listing during 2016 may decide the time is right to enter the public market. The weaker pound may also improve overseas investors’ appetite for UK IPOs.
Political uncertainty takes a toll on UK IPO market

| 15
Political uncertainty takes a toll on UK IPO market
UK IPO highlights2Q16 YTD(January–June 2016)21
Key trends Commentary
Financial sponsors continue to drive UK IPO market
Top three IPOs in 2Q16 by capital raised
Italy, US and Malaysia had one deal each, raising US$39m altogether on London AIM.
Israel and Philippines had one deal each, raising US$8.1m altogether on London Main Market.
Cross-border activity in 2Q16 YTD24
Three sectors trending
“The slow start to 2016 in the UK continued through the second quarter with total capital raised down 50% compared to this point last year. Despite the lower level of activity, we have seen well-valued businesses choosing to list and delivering strong after-market performance. This demonstrates that investor confidence remains for the ‘right’ deals. Although the UK market has been constrained by political uncertainty, sentiment is strong within the investment community and the market should recover quickly and strongly once the uncertainty has subsided.”
Scott McCubbinEY UK and Ireland IPO Leader
Volume and value
London Main Market11 deals(39% decrease on 2Q15 YTD)
London Main MarketUS$2.7b(60% decrease on 2Q15 YTD)
London AIM23 deals(15% increase on 2Q15 YTD)
London AIMUS$1.1b(68% increase on 2Q15 YTD)
Forterra plc Motorpoint Group plc
Time Out Group Ltd.
raised
US$184m(UK, Materials)
raised
US$144m(UK, Retail)
raised
US$131m(UK, Media and entertainment)
IPO pricing and performance
PE and VC accounted for 21% of UK IPOs (7 deals)
54% of proceeds (US$2.0b)
• IPO activity should pick up in 2017 following the resolution of political uncertainty due to the EU referendum.
• Investor appetite remains keen for IPOs of companies that are well run and well managed with a strong growth story.
• Many companies are choosing to remain private for longer than in recent years, giving businesses longer to mature before attempting an IPO.
FTSE 100
FTSE 350
FTSE AIM ALL SHARE
-4.0%
-4.4%
-2.9%
London Main Market22 Alternative Investment Market22 Equity indices23
first-day average return+4.4%increase in offer price vs. 17 June 2016+22.0%median post-IPO market capUS$516.3m
first-day average return+11.0%increase in offer price vs. 17 June 2016+16.0%median post-IPO market capUS$69.0m
21. 2Q16 YTD (January–June 2016) IPO activity is based on priced IPOs as of 18 June and expected IPOs by end of June.
22. Pricing and performance is based on 11 IPOs on London Main Market and 22 IPOs on AIM that have started trading by 17 June. Data as of 18 June.
23. Year-to-date returns of equity indices as of 17 June 2016.24. There were five cross-border IPOs on London Main and AIM in 2Q16 YTD.
Financials4 deals(US$1.2b)
Health care4 deals(US$0.1b)
Technology6 deals(US$0.4b)
21%of UK IPOs

Find out more about future IPO prospects
For more information on global IPO performance by quarter and year, and how IPO market looks set to develop in 2016, visit the EY Global IPO website:
ey.com/ipo
About EYEY is a global leader in assurance, tax, transaction and advisory services. The insights and quality services we deliver help build trust and confidence in the capital markets and in economies the world over. We develop outstanding leaders who team to deliver on our promises to all of our stakeholders. In so doing, we play a critical role in building a better working world for our people, for our clients and for our communities.
EY refers to the global organization, and may refer to one or more, of the member firms of Ernst & Young Global Limited, each of which is a separate legal entity. Ernst & Young Global Limited, a UK company limited by guarantee, does not provide services to clients. For more information about our organization, please visit ey.com.
About EY’s IPO servicesEY is a leader in helping to take companies public worldwide. With decades of experience, our global network is dedicated to serving market leaders and helping businesses evaluate the pros and cons of an IPO. We demystify the process by offering IPO readiness assessments, IPO preparation, project management and execution services, all of which help prepare you for life in the public spotlight. Our Global IPO Center of Excellence is a virtual hub which provides access to our IPO knowledge, tools, thought leadership and contacts from around the world in one easy-to-use source. For more information, please visit ey.com/ipocenter.
© 2016 EYGM Limited.All Rights Reserved.
EYG no. 01766-163Gbl BSC No. 1606-1967577
ED None
This material has been prepared for general informational purposes only and is not intended to be relied upon as accounting, tax or other professional advice. Please refer to your advisors for specific advice.
ey.com
EY | Assurance | Tax | Transactions | Advisory
Note: Throughout this report, 2016 January to June (2Q16 YTD) IPO activity is based on priced IPOs as of 18 June and expected IPOs by end of June. Source of data: Dealogic and EY.
Jacqueline Kelley Americas IPO Leader [email protected]
Ringo Choi Asia-Pacific IPO Leader [email protected]
Dr. Martin Steinbach EMEIA IPO Leader [email protected]
Terence Ho Greater China IPO Leader [email protected]
Shinichiro Suzuki Japan IPO Leader [email protected]
Scott McCubbin UK and Ireland IPO Leader [email protected]
Contacts: