global ipo trends: q2 2018
TRANSCRIPT

Global IPO trends: Q2 2018Short-term IPO confidence wavers in some markets, thrives in others

ContentsGlobal IPO market 3Americas 7Asia-Pacific 11Europe, Middle East, India and Africa 21Appendix 30About this report
EY Global IPO trends report is released every quarter and looks at the IPO markets, trends and outlook for the Americas, Asia-Pacific, Japan and EMEIA regions.
The report provides insights, facts and figures on the 2018 IPO market year-to-date and analyzes the implications for companies planning to go public in the short and medium term.
You will find this report at the EY Global IPO website. You can also follow the report on LinkedIn or Twitter.
All values are US$ unless otherwise noted.

Global IPO trends: Q2 2018 | Page 3
Global IPO marketRisks and uncertainties return in Q2 2018“Risks and uncertainties returned to the IPO market in Q2 2018 as geopolitical tensions and changes in trade policies caused higher market volatility and softened IPO confidence in many parts of the world. Global IPO figures for the first half of 2018 dipped by volume compared with the same period in 2017, despite higher valuations on some of the world’s largest markets. The good news is that economic conditions remain encouraging, equity valuations remain high in many parts of the world and interest rates remain low. As a result, we expect a resurgence in IPO activity during the second half of 2018.”Dr. Martin SteinbachEY Global and EMEIA IPO Leader
Global IPO trends: Q2 2018 | Page 4All values are US$ unless otherwise noted. | Q2 2018 and Q2 18 refer to the second quarter of 2018 and cover priced IPOs from 1 April to 15 June 2018 plus expected IPOs by end of June. H1 2018 and YTD 2018 refer to the first six months of 2018 and cover priced IPOs from 1 January to 15 June 2018 plus expected IPOs by end of June.
Markets
Global IPO market
Activity Q2 2018
Stock exchangesby highest total proceeds
New York (NYSE)$7.0b15 IPOs
Shanghai (SSE)$6.7b19 IPOs
NASDAQ$5.9b39 IPOs
IPOslargest by proceeds
Foxconn Industrial Internet Co. Ltd. $4.2bTechnologyChinaShanghai (SSE)
AXA Equitable Holdings, Inc. $3.2bFinancialsUSNYSE
VinhomesJSC$1.3bReal estateVietnamHo Chi Minh (HOSE)
Sectorsby highest number of IPOs
Technology72 IPOs$16.9b
Consumer products49 IPOs$2.2b
Industrials39 IPOs$3.4b
Sources of IPOsYTD 2018
All amounts in table are in US$
14%2%
84%
Percentage of proceeds
8%
1%
91%
Percentage of IPOs
Financial sponsor-backed Former state-owned enterprises Non-financial sponsor-backed
$0
$1,000
$2,000
$3,000
$4,000
0
10,000
20,000
30,000
40,000
2014 2015 2016 2017 YTD 18
M&A activity
Number of M&A Deal value US$b
27% 17% 13% 10% 8%
1%1% 1% 1% 1%
72% 82% 87% 89% 91%
2014 2015 2016 2017 YTD 18
$0
$50
$100
$150
$200
$250
$300
0
500
1,000
1,500
2,000
2014 2015 2016 2017 YTD 18
IPO activity
Number of IPOs Proceeds US$b
Figures may not total 100% due to rounding
YTD 2018 Change on prior year Q2 2018
Change on prior yearquarter
660IPOs globally
325IPOs globally
$94.3bproceeds
$45.0bproceeds All amounts in table are in US$
26%21%
19%5%
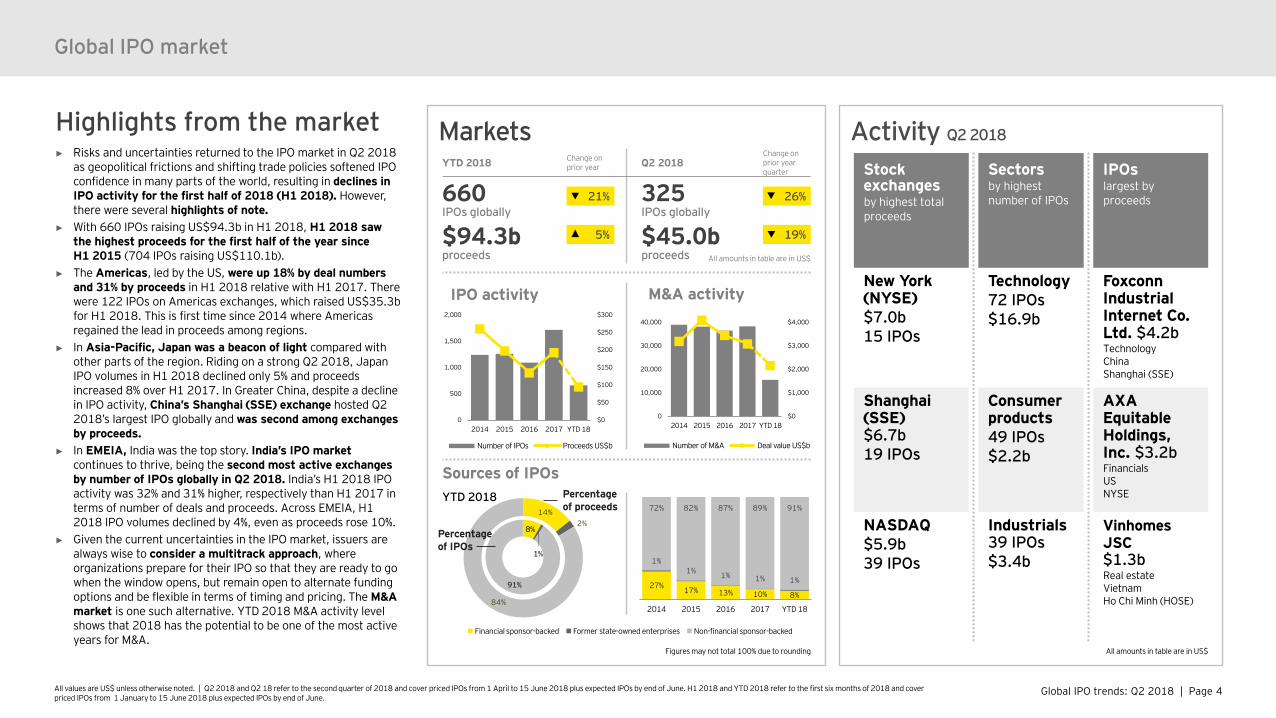
Highlights from the market► Risks and uncertainties returned to the IPO market in Q2 2018
as geopolitical frictions and shifting trade policies softened IPO confidence in many parts of the world, resulting in declines in IPO activity for the first half of 2018 (H1 2018). However, there were several highlights of note.
► With 660 IPOs raising US$94.3b in H1 2018, H1 2018 saw the highest proceeds for the first half of the year since H1 2015 (704 IPOs raising US$110.1b).
► The Americas, led by the US, were up 18% by deal numbers and 31% by proceeds in H1 2018 relative with H1 2017. There were 122 IPOs on Americas exchanges, which raised US$35.3b for H1 2018. This is first time since 2014 where Americas regained the lead in proceeds among regions.
► In Asia-Pacific, Japan was a beacon of light compared with other parts of the region. Riding on a strong Q2 2018, Japan IPO volumes in H1 2018 declined only 5% and proceeds increased 8% over H1 2017. In Greater China, despite a decline in IPO activity, China’s Shanghai (SSE) exchange hosted Q2 2018’s largest IPO globally and was second among exchanges by proceeds.
► In EMEIA, India was the top story. India’s IPO marketcontinues to thrive, being the second most active exchanges by number of IPOs globally in Q2 2018. India’s H1 2018 IPO activity was 32% and 31% higher, respectively than H1 2017 in terms of number of deals and proceeds. Across EMEIA, H1 2018 IPO volumes declined by 4%, even as proceeds rose 10%.
► Given the current uncertainties in the IPO market, issuers are always wise to consider a multitrack approach, where organizations prepare for their IPO so that they are ready to go when the window opens, but remain open to alternate funding options and be flexible in terms of timing and pricing. The M&A market is one such alternative. YTD 2018 M&A activity level shows that 2018 has the potential to be one of the most active years for M&A.

Global IPO trends: Q2 2018 | Page 5All values are US$ unless otherwise noted. | Q2 2018 and Q2 18 refer to the second quarter of 2018 and cover priced IPOs from 1 April to 15 June 2018 plus expected IPOs by end of June. H1 2018 and YTD 2018 refer to the first six months of 2018 and cover priced IPOs from 1 January to 15 June 2018 plus expected IPOs by end of June.
Regional performance and trends
25%
16%
12%
13%
18%
30%
30%
29%
30%
36%
45%
54%
59%
57%
46%
2014
2015
2016
2017
YTD 18
Regional share by number of IPOs
38%
19%
17%
27%
38%
31%
36%
28%
34%
31%
31%
45%
54%
39%
31%
2014
2015
2016
2017
YTD 18
Regional share by proceeds
Global IPO market
Increasing economic and political uncertainty has issuers and investors taking more of a wait-and-see approach toward IPOs. Issuers willing to take a multitrack approach to their IPO preparations would have the strongest chance for transaction success.
Americas EMEIA Asia-Pacific
Top countries of origin YTD 2018By number of IPOs outside home country
• Mainland China (16)• Singapore (8)• UK (6)• Malaysia (4)• Ireland (3)
Top IPO destinations* YTD 2018By number of IPOs
• Hong Kong (13)• NYSE (12)• NASDAQ (12)• London (7)• Sweden (4)
or or — = increase or decrease or remain constant for YTD 2018 compared with the full year of 2017Figures may not total 100% due to rounding.
10%
8%
6%
7%
8%
2014
2015
2016
2017
YTD 18
Cross-border IPOs Percentage by number of IPOs globally
*IPO destinations refer to stock exchanges.
Global IPO trends: Q2 2018 | Page 6All values are US$ unless otherwise noted. | Q2 2018 and Q2 18 refer to the second quarter of 2018 and cover priced IPOs from 1 April to 15 June 2018 plus expected IPOs by end of June. H1 2018 and YTD 2018 refer to the first six months of 2018 and cover priced IPOs from 1 January to 15 June 2018 plus expected IPOs by end of June.
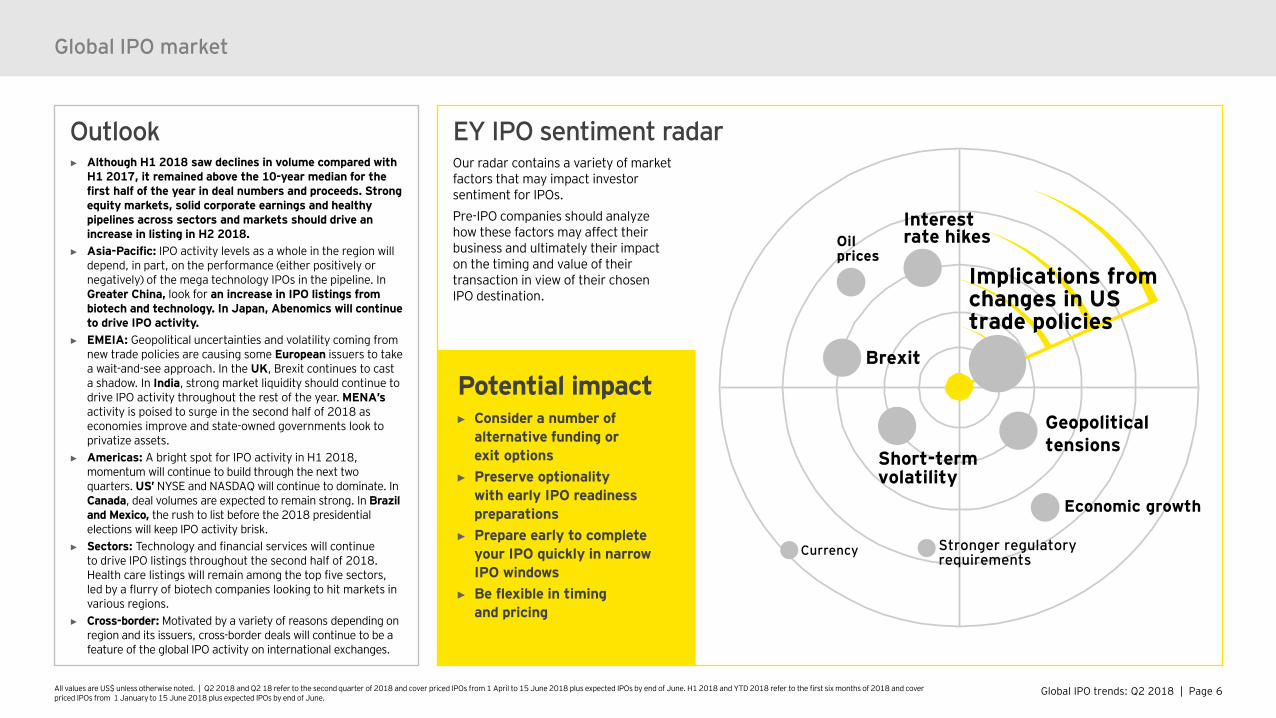
Outlook► Although H1 2018 saw declines in volume compared with
H1 2017, it remained above the 10-year median for the first half of the year in deal numbers and proceeds. Strong equity markets, solid corporate earnings and healthy pipelines across sectors and markets should drive an increase in listing in H2 2018.
► Asia-Pacific: IPO activity levels as a whole in the region will depend, in part, on the performance (either positively or negatively) of the mega technology IPOs in the pipeline. In Greater China, look for an increase in IPO listings from biotech and technology. In Japan, Abenomics will continue to drive IPO activity.
► EMEIA: Geopolitical uncertainties and volatility coming from new trade policies are causing some European issuers to take a wait-and-see approach. In the UK, Brexit continues to cast a shadow. In India, strong market liquidity should continue to drive IPO activity throughout the rest of the year. MENA’s activity is poised to surge in the second half of 2018 as economies improve and state-owned governments look to privatize assets.
► Americas: A bright spot for IPO activity in H1 2018, momentum will continue to build through the next two quarters. US’ NYSE and NASDAQ will continue to dominate. In Canada, deal volumes are expected to remain strong. In Brazil and Mexico, the rush to list before the 2018 presidential elections will keep IPO activity brisk.
► Sectors: Technology and financial services will continue to drive IPO listings throughout the second half of 2018. Health care listings will remain among the top five sectors, led by a flurry of biotech companies looking to hit markets in various regions.
► Cross-border: Motivated by a variety of reasons depending on region and its issuers, cross-border deals will continue to be a feature of the global IPO activity on international exchanges.
EY IPO sentiment radarOur radar contains a variety of market factors that may impact investor sentiment for IPOs.Pre-IPO companies should analyze how these factors may affect their business and ultimately their impact on the timing and value of their transaction in view of their chosen IPO destination.
Global IPO market
Brexit
Geopoliticaltensions
Short-term volatility
Interest rate hikes
Currency
Implications from changes in US trade policies
Economic growth
Stronger regulatory requirements
Potential impact► Consider a number of
alternative funding or exit options
► Preserve optionality with early IPO readiness preparations
► Prepare early to complete your IPO quickly in narrow IPO windows
► Be flexible in timing and pricing
Oil prices
Global IPO trends: Q2 2018 | Page 7
AmericasIPO momentum builds in Q2
“Americas IPO activity remains strong in the first half of 2018 with deal volume and proceeds up from the same period in 2017. Canada has a strong pipeline of deal activity which could enter the public market in the second half of 2018 and 2019. In Mexico, we saw a small handful of deals raise YTD proceeds that could be on pace to approach last year’s highs. Americas’ activity signals renewed activity in the technology, financial services and consumer products sectors. And overall, the US continues to set the pace, having two of the top three globally ranked exchanges by proceeds.”Jackie KelleyEY Americas IPO Markets Leader

Global IPO trends: Q2 2018 | Page 8All values are US$ unless otherwise noted. | Q2 2018 and Q2 18 refer to the second quarter of 2018 and cover priced IPOs from 1 April to 15 June 2018 plus expected IPOs by end of June. H1 2018 and YTD 2018 refer to the first six months of 2018 and cover priced IPOs from 1 January to 15 June 2018 plus expected IPOs by end of June.
Brazil‘s B3 YTD 2018
US‘ NASDAQ and NYSE YTD 2018
Canada‘s Toronto Stock Exchange and TSX Venture Exchange YTD 2018
Mexico‘s Mexican Stock Exchange YTD 2018
Activity Q2 2018
Markets YTD 2018
AmericasAmericas
Change on prior year
122 IPOs
$35.3b proceeds
$109.2m median deal size
18%
31%
6%
Highlights from the markets► After a roaring start in the first two months of 2018, market volatility toward the end of Q1 2018 tempered
IPO activity somewhat through Q2 2018. Yet both deal volumes and proceeds in H1 2018 were higher compared with H1 2017, with an increase of 18% and 31%, respectively.
► US exchanges continue to lead the charge, with the NYSE and NASDAQ ranked among the top three exchanges by proceeds globally and in the Americas for H1 2018.
► Toronto Exchange and Venture Exchange posted 7 IPOs in H1 2018 compared with 11 IPOs in H1 2017. ► What Brazil lacks in volume it more than makes up for in proceeds as B3 unveiled four financial services
IPOs in H1 2018 with combined proceeds of US$2.5b.► Americas results set the tone in Q2 2018 that the powerhouse sectors are back, with technology,
financials and consumer products sectors seeing renewed activity. ► Mexico has seen two IPOs in H1 2018, mirroring H1 2017, although their proceeds is nearly US$1b higher.
Change on prior year
7 IPOs
$381.7m proceeds
$1.6m median deal size
Change on prior year
2 IPOs
$2.3b proceeds
$1.2b median deal size
Change on prior year
4 IPOs
$2.5b proceeds
$714.7m median deal size
Change on prior year
101 IPOs
$29.9b proceeds
$124.2m median deal size
30%
All amounts in table are in US$
Stock exchanges by highest total proceeds
NYSE$7.0b | 15 IPOs US
NASDAQ$5.9b | 39 IPOs US
Sao Paulo (B3)$2.5b | 4 IPOs Brazil
Sectors by highest number of IPOs
Technology17 IPOs | $5.1b
Consumer products15 IPOs | $1.3b
Health care13 IPOs | $0.9b
IPOslargest by proceeds
AXA Equitable Holdings, Inc. $3.2b Financials, NYSE, US
Hapvida Participacoes e Investimentos SA$879m Financials, B3, Brazil
GreenSky Inc.$874m Technology, NASDAQ, US
All amounts in table are in US$
36%
69%
69%
All amounts in table are in US$
$0
$40
$80
$120
0
100
200
300
400
2014 2015 2016 2017 YTD 18
Number of IPOs Proceeds US$b
$0
$20
$40
$60
$80
$100
0
100
200
300
2014 2015 2016 2017 YTD 18
Number of IPOs Proceeds US$b
$0$1$2$3$4$5$6$7
02468
1012
2014 2015 2016 2017 YTD 18
Number of IPOs Proceeds US$b
$0
$1
$2
$3
$4
0
5
10
15
20
25
2014 2015 2016 2017 YTD 18
Number of IPOs Proceeds US$b
$0
$1
$2
$3
0
2
4
6
8
2014 2015 2016 2017 YTD 18
Number of IPOs Proceeds US$b
IPO activity in 2016 includes one IPO on BATS exchange.
IPO activity of Canadian Securities Exchange is excluded.
100%
427%
202%
98%
0%
79%
20%
1%
Global IPO trends: Q2 2018 | Page 9
Americas — US IPO market insightUS IPO markets pick up steam
“The second quarter of 2018 was marked by an influx of technology IPOs entering the US market. From 2013 to 2017 we saw health care companies dominate the markets in terms of deal count, but since then we’ve seen technology companies slowly gaining. Deal count and proceeds raised are up compared with last year, and post-IPO share price performance is solid, creating momentum heading into the second half of the year.”Jackie KelleyEY Americas IPO Markets Leader
Global IPO trends: Q2 2018 | Page 10All values are US$ unless otherwise noted. | Q2 2018 and Q2 18 refer to the second quarter of 2018 and cover priced IPOs from 1 April to 15 June 2018 plus expected IPOs by end of June. H1 2018 and YTD 2018 refer to the first six months of 2018 and cover priced IPOs from 1 January to 15 June 2018 plus expected IPOs by end of June.
TrendsYTD 2018
Change on prior year
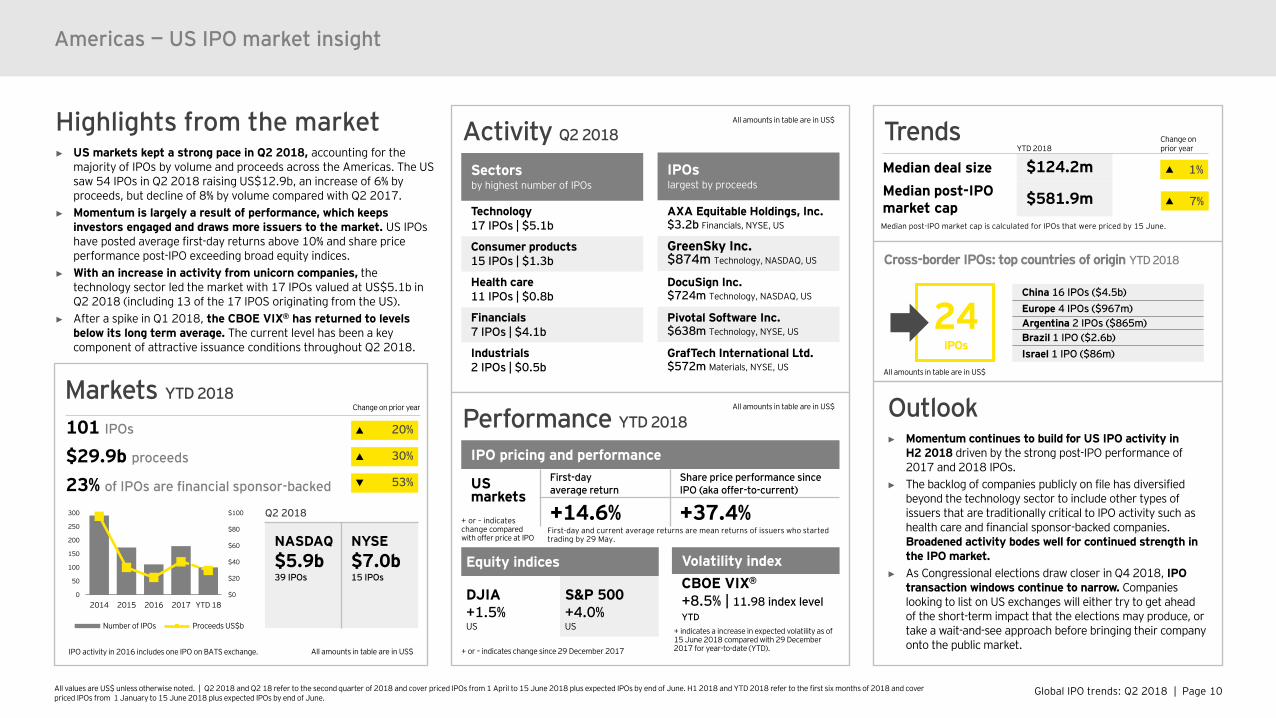
Median deal size $124.2mMedian post-IPO market cap $581.9m
Americas — US IPO market insight
Activity Q2 2018
Performance YTD 2018
IPO pricing and performance
US markets
First-day average return
Share price performance since IPO (aka offer-to-current)
+14.6% +37.4%
Equity indices
DJIA+1.5%US
S&P 500+4.0%US
Volatility indexCBOE VIX®
+8.5% | 11.98 index levelYTD
Sectorsby highest number of IPOs
Technology17 IPOs | $5.1b
Consumer products15 IPOs | $1.3b
Health care11 IPOs | $0.8b
Financials7 IPOs | $4.1b
Industrials2 IPOs | $0.5b
IPOslargest by proceeds
AXA Equitable Holdings, Inc.$3.2b Financials, NYSE, US
GreenSky Inc.$874m Technology, NASDAQ, US
DocuSign Inc.$724m Technology, NASDAQ, US
Pivotal Software Inc.$638m Technology, NYSE, US
GrafTech International Ltd.$572m Materials, NYSE, US
All amounts in table are in US$
All amounts in table are in US$
Cross-border IPOs: top countries of origin YTD 2018
All amounts in table are in US$
24IPOs
China 16 IPOs ($4.5b)Europe 4 IPOs ($967m)Argentina 2 IPOs ($865m)Brazil 1 IPO ($2.6b)Israel 1 IPO ($86m)
Markets YTD 2018
All amounts in table are in US$
Q2 2018
NASDAQ$5.9b39 IPOs
NYSE$7.0b15 IPOs
Change on prior year
101 IPOs
$29.9b proceeds
23% of IPOs are financial sponsor-backed
30%
+ or – indicates change since 29 December 2017
+ indicates a increase in expected volatility as of 15 June 2018 compared with 29 December 2017 for year-to-date (YTD).
+ or – indicates change compared with offer price at IPO
Highlights from the market► US markets kept a strong pace in Q2 2018, accounting for the
majority of IPOs by volume and proceeds across the Americas. The US saw 54 IPOs in Q2 2018 raising US$12.9b, an increase of 6% by proceeds, but decline of 8% by volume compared with Q2 2017.
► Momentum is largely a result of performance, which keeps investors engaged and draws more issuers to the market. US IPOs have posted average first-day returns above 10% and share price performance post-IPO exceeding broad equity indices.
► With an increase in activity from unicorn companies, the technology sector led the market with 17 IPOs valued at US$5.1b in Q2 2018 (including 13 of the 17 IPOS originating from the US).
► After a spike in Q1 2018, the CBOE VIX® has returned to levels below its long term average. The current level has been a key component of attractive issuance conditions throughout Q2 2018.
$0
$20
$40
$60
$80
$100
0
50
100
150
200
250
300
2014 2015 2016 2017 YTD 18
Number of IPOs Proceeds US$b
Outlook► Momentum continues to build for US IPO activity in
H2 2018 driven by the strong post-IPO performance of 2017 and 2018 IPOs.
► The backlog of companies publicly on file has diversified beyond the technology sector to include other types of issuers that are traditionally critical to IPO activity such as health care and financial sponsor-backed companies. Broadened activity bodes well for continued strength in the IPO market.
► As Congressional elections draw closer in Q4 2018, IPO transaction windows continue to narrow. Companies looking to list on US exchanges will either try to get ahead of the short-term impact that the elections may produce, or take a wait-and-see approach before bringing their company onto the public market.
IPO activity in 2016 includes one IPO on BATS exchange.
53%
First-day and current average returns are mean returns of issuers who started trading by 29 May.
Median post-IPO market cap is calculated for IPOs that were priced by 15 June.
20%
1%
7%
Global IPO trends: Q2 2018 | Page 11
Asia-PacificInvestor appetite remains in Asia-Pacific, despite drop in IPO activity“Strong macroeconomic fundamentals and investor appetite act as a counterbalance to the otherwise volatile performance of IPO activity across the region. Following the general declines in IPO performance in the first six months of 2018, largely resulting from recent interest rate increases, global political and economic uncertainties, we expect to see a rebound in the deal size of the IPOs in the second half of the year as a number of mega IPOs begin to hit the market.”Ringo ChoiEY Asia-Pacific IPO Leader

Global IPO trends: Q2 2018 | Page 12All values are US$ unless otherwise noted. | Q2 2018 and Q2 18 refer to the second quarter of 2018 and cover priced IPOs from 1 April to 15 June 2018 plus expected IPOs by end of June. H1 2018 and YTD 2018 refer to the first six months of 2018 and cover priced IPOs from 1 January to 15 June 2018 plus expected IPOs by end of June.
Markets YTD 2018 Change on
prior year Q2 2018Change on prior year quarter
302IPOs
137IPOs
$29.6bproceeds
$17.6bproceeds
Activity Q2 2018
Asia-Pacific
Stock exchangesby highest total proceeds
Shanghai (SSE)$6.7b19 IPOsMainland China
Hong Kong (Main and GEM)$3.0b35 IPOsHong Kong
Ho Chi Minh (HOSE)$2.3b2 IPOsVietnam
Sectorsby highest number of IPOs
Technology28 IPOs$7.9b
Materials20 IPOs $0.9b
Consumer products19 IPOs $0.5b
IPOslargest by proceeds
Foxconn Industrial Internet Co., Ltd. $4.2bTechnologyChinaShanghai (SSE)
Vinhomes JSC$1.3bReal estateVietnamHo Chi Minh (HOSE)
Ping An Healthcare and Technology Company Limited $1.1bTechnologyChinaHong Kong (HKEx)
Main markets Junior marketsQ2 2018 Change on
Q2 2017 Q2 2018 Change on Q2 2017
82IPOs
55IPOs
$14.3bproceeds
$3.4bProceeds
All amounts in table are in US$ All amounts in table are in US$
$0
$2
$4
$6
$8
$10
$12
$14
0
50
100
150
200
250
300
350
400
2014 2015 2016 2017 YTD 18
Number of IPOs Proceeds US$b
$0
$10
$20
$30
$40
$50
$60
$70
$80
$90
0
100
200
300
400
500
600
700
2014 2015 2016 2017 YTD 18
All amounts in table are in US$
20%
45%
41%
29%
37% 39%
17% 13%
Highlights from the market► Despite investor appetite for IPOs across the Asia-Pacific
region, H1 2018 volumes declined 37% while proceeds were down 17% compared with H1 2017.
► However, Asia-Pacific still accounted for a 46% share of global IPOs and 31% of global IPO proceeds in H1 2018. Five of the ten most active exchanges by deal numbers were from this region in H1 2018.
► Japan is performing well compared with the rest of the region, boosted by big gains in Q2 2018 with 21 IPOs raising US$1.5b. Q2 2018 IPO activity pushed Japan to see only a 5% decline in volume and an 8% increase in proceeds in H1 2018.
► Australia’s Q2 2018 deal volumes may have been down slightly (5%) compared to Q2 2017, but proceeds are continuing to rise (117%) as the size of the companies coming to the public market keeps growing.
► In Southeast Asia, IPO activity has been driven by entrepreneurial companies coming to market. However, geopolitical uncertainty, trade issues and macroeconomic conditions are dampening investor enthusiasm for IPOs.
► In Greater China, government policies that keep a tight rein on the IPO approval process for Mainland China exchanges may partly explain the drop in IPO activity.
► Financials and technology dominate the top 10 deals on Asia-Pacific exchanges in Q2 2018, representing 21% and 45% of proceeds and 7% and 20% of Asia-Pacific IPO deal numbers, respectively.
► Cross-border IPO activity is up across the Asia-Pacific region in Q2 2018, with 17 outbound IPOs representing 5.4% of all Asia-Pacific issuers listed outside Asia-Pacific.

Global IPO trends: Q2 2018 | Page 13All values are US$ unless otherwise noted. | Q2 2018 and Q2 18 refer to the second quarter of 2018 and cover priced IPOs from 1 April to 15 June 2018 plus expected IPOs by end of June. H1 2018 and YTD 2018 refer to the first six months of 2018 and cover priced IPOs from 1 January to 15 June 2018 plus expected IPOs by end of June.
Trends
Sources of IPOs
YTD 20185.5% 0.6%
93.9%
Percentage of proceeds
Asia-Pacific
Cross-border 4.1% of all Asia-Pacific issuers* listed abroad but within the Asia-Pacific region
Outbound5.4% of all Asia-Pacific issuers* listed outside Asia-Pacific
Inbound7.1% of cross-border IPOs globally** listed in Asia-Pacific but came from outside the region
*There were 315 IPOs by Asia-Pacific issuers in YTD 2018. This analysis is based on the listed company domicile, regardless of the listed company exchange.** There were 56 cross-border IPOs globally in YTD 2018.
Cross-border activity YTD 2018
Asia-Pacific issuers’ cross-border activityPercentage of all Asia-Pacific issuers
Despite a decline in IPO activity, strong investor appetite based on pricing and performance, particularly in the technology sector, combined with a record number of mega IPOs in the pipeline, should propel stronger IPO activity levels across the region in the months ahead.
4IPOs
17IPOs
Transaction sizes
Main markets Junior marketsYTD 2018 Change on prior year YTD 2018 Change on prior year
Median post-IPO market cap $149.4m $37.7mMedian deal size $30.9m $9.7mTrends
19%
33%
All amounts in table are in US$. Figures may not total 100% due to rounding.
Financial sponsor-backed Former state-owned enterprises Non-financial sponsor-backed
13IPOs
13% 6% 4.2% 4.9% 5.0%
1%1% 0.3% 0.3% 0.3%
86% 93% 95.5% 94.9% 94.7%
2014 2015 2016 2017 YTD 18
8%
5% 6% 6%
10%
2014 2015 2016 2017 YTD 18
$0
$100
$200
$300
2014 2015 2016 2017 YTD 18$0
$20
$40
$60
$80
$100
2014 2015 2016 2017 YTD 18
Median post-IPO market cap US$m
Median deal size US$m
5.0% 0.3%
94.7%
Percentageof IPOs
63%
60%
Global IPO trends: Q2 2018 | Page 14All values are US$ unless otherwise noted. | Q2 2018 and Q2 18 refer to the second quarter of 2018 and cover priced IPOs from 1 April to 15 June 2018 plus expected IPOs by end of June. H1 2018 and YTD 2018 refer to the first six months of 2018 and cover priced IPOs from 1 January to 15 June 2018 plus expected IPOs by end of June.
Asia-Pacific
PerformanceEquity indices YTD 2018
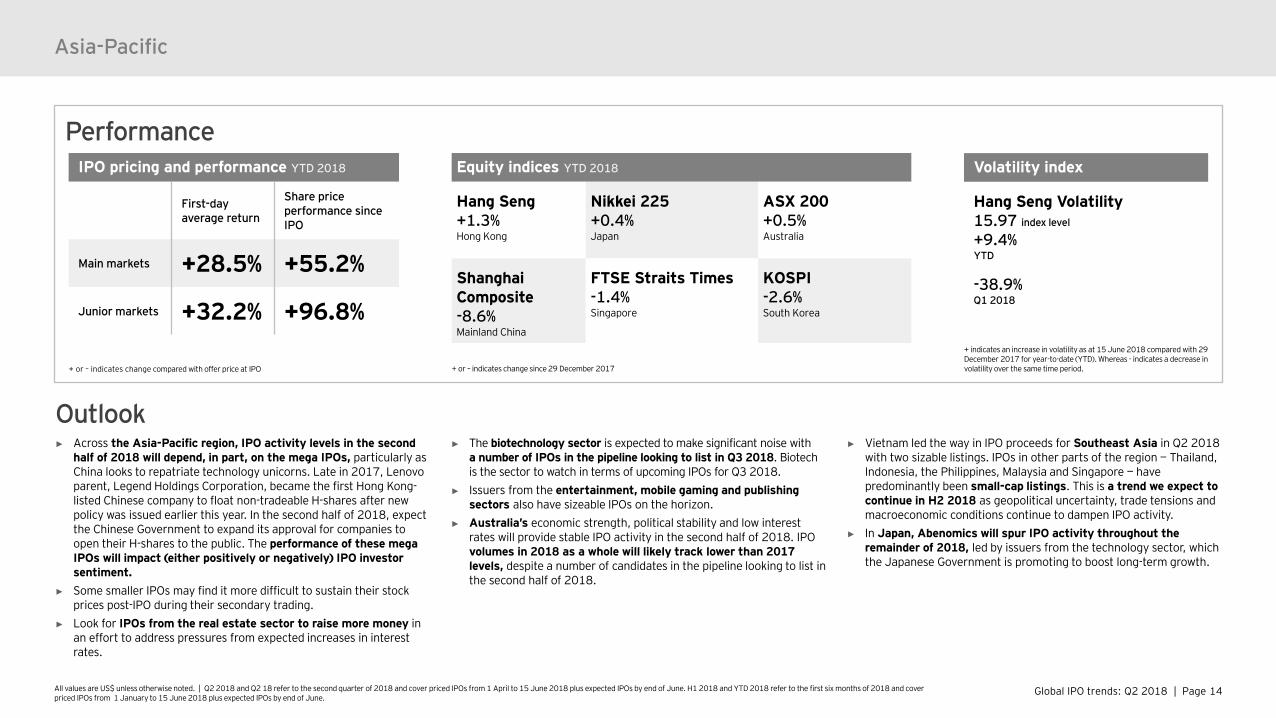
Hang Seng+1.3%Hong Kong
Nikkei 225+0.4%Japan
ASX 200+0.5%Australia
Shanghai Composite-8.6%Mainland China
FTSE Straits Times-1.4%Singapore
KOSPI-2.6%South Korea
IPO pricing and performance YTD 2018
First-day average return
Share price performance since IPO
Main markets +28.5% +55.2%
Junior markets +32.2% +96.8%
Volatility index
Hang Seng Volatility15.97 index level
+9.4%YTD
-38.9%Q1 2018
+ or – indicates change since 29 December 2017+ or – indicates change compared with offer price at IPO
► Across the Asia-Pacific region, IPO activity levels in the second half of 2018 will depend, in part, on the mega IPOs, particularly as China looks to repatriate technology unicorns. Late in 2017, Lenovo parent, Legend Holdings Corporation, became the first Hong Kong-listed Chinese company to float non-tradeable H-shares after new policy was issued earlier this year. In the second half of 2018, expect the Chinese Government to expand its approval for companies to open their H-shares to the public. The performance of these mega IPOs will impact (either positively or negatively) IPO investor sentiment.
► Some smaller IPOs may find it more difficult to sustain their stock prices post-IPO during their secondary trading.
► Look for IPOs from the real estate sector to raise more money in an effort to address pressures from expected increases in interest rates.
► The biotechnology sector is expected to make significant noise with a number of IPOs in the pipeline looking to list in Q3 2018. Biotech is the sector to watch in terms of upcoming IPOs for Q3 2018.
► Issuers from the entertainment, mobile gaming and publishing sectors also have sizeable IPOs on the horizon.
► Australia’s economic strength, political stability and low interest rates will provide stable IPO activity in the second half of 2018. IPO volumes in 2018 as a whole will likely track lower than 2017 levels, despite a number of candidates in the pipeline looking to list in the second half of 2018.
► Vietnam led the way in IPO proceeds for Southeast Asia in Q2 2018 with two sizable listings. IPOs in other parts of the region — Thailand, Indonesia, the Philippines, Malaysia and Singapore — have predominantly been small-cap listings. This is a trend we expect to continue in H2 2018 as geopolitical uncertainty, trade tensions and macroeconomic conditions continue to dampen IPO activity.
► In Japan, Abenomics will spur IPO activity throughout the remainder of 2018, led by issuers from the technology sector, which the Japanese Government is promoting to boost long-term growth.
Outlook
+ indicates an increase in volatility as at 15 June 2018 compared with 29 December 2017 for year-to-date (YTD). Whereas - indicates a decrease in volatility over the same time period.

Global IPO trends: Q2 2018 | Page 15
Asia-Pacific — Greater China market insight Large tech IPOs are raising top dollar“Technology unicorns were the driving force behind Greater China’s IPO activity in Q2 2018. With several more technology mega IPOs in the pipeline, and IPO activity in the financial services and biotech sectors heating up, we anticipate stronger IPO activity levels in second half of 2018.“Terence HoEY Greater China IPO Leader

Global IPO trends: Q2 2018 | Page 16All values are US$ unless otherwise noted. | Q2 2018 and Q2 18 refer to the second quarter of 2018 and cover priced IPOs from 1 April to 15 June 2018 plus expected IPOs by end of June. H1 2018 and YTD 2018 refer to the first six months of 2018 and cover priced IPOs from 1 January to 15 June 2018 plus expected IPOs by end of June.
Markets YTD 2018 Change on
prior year Q2 2018Change on prior yearquarter
163IPOs
63IPOs
$20.9bproceeds
$11.4proceeds
Asia-Pacific — Greater China market insight
Highlights from the markets► Although IPO activity remains robust in Mainland China and
Hong Kong, deal volumes and proceeds are both lower in Q2 2018 compared with Q2 2017 (63 IPOs with proceeds of US$11.4b in Q2 2018 versus 143 IPOs with proceeds of US$13.5b in Q2 2017).
► Government policies that keep a tight rein on which IPOs are approved for Mainland China exchanges may partly explain this decline in IPO activity.
► In particular, Mainland China's Issuance Examination Committee (IEC) of China Securities Regulatory Commission (CSRC) has applied more stringent criteria for approving IPOs on its exchanges. Because of the ever growing number of Chinese companies eager to go public, it can sometimes take two years for IPOs to be approved, creating a backlog of IPOs.
► IPOs that are coming to the Greater China markets have a tendency to be oversubscribed, making it a seller’s market. On the Hong Kong Main Market, the average oversubscription rate was 420 times above the amount of sales on offer in Q2 2018. On the Mainland China exchanges, IPOs were oversubscribed by more than 2,800 times in Q2 2018.
► Sizeable technology IPOs, with their willingness to take more risk are achieving high IPO valuations. Foxconn Industrial Internet Co. Ltd. soared by a maximum 44% in its Shanghai debut, elevating its market value to US$61b.
► Medium-sized IPOs in more traditional sectors may find it harder to achieve similar proceeds. This trend is reflected in Q2 2018 sector activity numbers, with industrials IPOs leading by volume on both the Hong Kong and Mainland China exchanges but technology vastly outpacing all other IPOs by proceeds.
► More Chinese companies are evaluating local and cross-border listings for their IPO destination decisions. In Q2 2018, 9.0% of Greater China issuers listed abroad. Sixteen Chinese IPOs were destined for US exchanges in Q2 2018.
Activity Q2 2018
Hong Kong Main Market
Sectors by highest number of IPOs
Technology4 IPOs | $1.6b
Industrials4 IPOs | $61m
Consumer staples3 IPOs | $94m
IPOslargest by proceeds
Ping An Healthcare and TechnologyCompany Limited
$1.1bTechnologyJiangxi Bank Co. Ltd.
$993mFinancials
Huifu Payment Ltd.
$215mTechnology
Shanghai and Shenzhen
Sectors by highest number of IPOs
Technology6 IPOs | $5.0b
Industrials6 IPOs | $495m
Materials5 IPOs | $617m
IPOslargest by proceeds
Foxconn Industrial Internet Co. Ltd.
$4.2bTechnology, Shanghai
Contemporary AmperexTechnology Co. Ltd.
$853mEnergy, Shenzhen-Chinext
WuXi AppTec Co., Ltd.
$354mHealth care, Shanghai
Hong Kong Main Market Shanghai and ShenzhenQ2 2018 Change on
Q1 2017 Q2 2018 Change on Q1 2017
18IPOs
28IPOs
$2.9bproceeds
$8.4bproceeds
Shenzhen includes both listings on the Mainboard, Small and Medium Enterprise board and ChiNextAll amounts in table are in US$
All amounts in table are in US$
$0
$5
$10
$15
$20
$25
$30
$35
$40
0
50
100
150
200
250
300
350
400
450
2014 2015 2016 2017 YTD 18
Number of IPOs Proceeds US$b
$0
$5
$10
$15
$20
$25
$30
$35
0102030405060708090
100
2014 2015 2016 2017 YTD 18
48%
75%
56%
All amounts in table are in US$
17% 15%
45%
29%
3%

Global IPO trends: Q2 2018 | Page 17All values are US$ unless otherwise noted. | Q2 2018 and Q2 18 refer to the second quarter of 2018 and cover priced IPOs from 1 April to 15 June 2018 plus expected IPOs by end of June. H1 2018 and YTD 2018 refer to the first six months of 2018 and cover priced IPOs from 1 January to 15 June 2018 plus expected IPOs by end of June.
Trends
Sources of IPOs
YTD 2018
100%
Percentage of proceeds
Asia-Pacific — Greater China market insight
Cross-border activity YTD 2018
Greater China issuers’ cross-border activityPercentage of all China issuers
YTD 2018
Leaving Greater China
Outbound9.6% of Greater China issuers* listed abroad
Coming to Greater China
Inbound 23.2% of cross-border IPOs globally** were listed on HKEx and GEM
*There were 166 IPOs by Greater China issuers in YTD 2018. This analysis is based on the listed company domicile, regardless of the listed company exchange.** There were 56 cross-border IPOs globally in YTD 2018.
13IPOs
16IPOs
To which destination? YTD 2018
16 IPOs to US exchanges
Transaction sizes
Hong Kong Main Market Shanghai and ShenzhenYTD 2018 Change on prior year YTD 2018 Change on prior year
Median post-IPO market cap $91.7m $502.6mMedian deal size $19.9m $107.3mTrends
144%32%
100%
Percentage of IPOs
All amounts in table are in US$. Figures may not total 100% due to rounding.
A series of technology mega IPO listings on Mainland China exchanges have pushed deal sizes up considerably when compared with the same time last year. But the big story is the median post-IPO market cap, which soared 144% above YTD 2017’s average.
Financial sponsor-backed Former state-owned enterprises Non-financial sponsor-backed
9% 5% 0.58% 1%
1% 1% 0.29%
90% 94% 99.14% 99% 100.0%
2014 2015 2016 2017 YTD 18
10%
4%6% 5%
10%
2014 2015 2016 2017 YTD 18
$0
$100
$200
$300
$400
$500
2014 2015 2016 2017 YTD 18$0
$100
$200
$300
$400
$500
$600
2014 2015 2016 2017 YTD 18
Median post-IPO market cap US$m
Median deal size US$m
41% 117%

Global IPO trends: Q2 2018 | Page 18All values are US$ unless otherwise noted. | Q2 2018 and Q2 18 refer to the second quarter of 2018 and cover priced IPOs from 1 April to 15 June 2018 plus expected IPOs by end of June. H1 2018 and YTD 2018 refer to the first six months of 2018 and cover priced IPOs from 1 January to 15 June 2018 plus expected IPOs by end of June.
Outlook
Asia-Pacific — Greater China market insight
PerformanceEquity indices YTD 2018 Mainland China
Shanghai Composite-8.6%
Shenzhen Composite-10.9%
Shenzhen SME-9.8%
IPO pricing and performance YTD 2018
First-day average return
Share price performance since IPO
Hong Kong Main Market
+3.4% +12.7%Shanghai and Shenzhen
+44.0% +91.1%
Equity indices YTD 2018 Hong Kong Volatility index
Hang Seng +1.3%
Hang Seng China Enterprises+1.4%
Hang Seng China Affiliated Corporations+3.4%
Hang Seng Volatility15.97 index level
+9.4% YTD
-38.9% Q1 2018
IPO pipelineMore than
307companies arein the China Securities Regulatory Commission (CSRC) pipeline.
More than
181companieshave submitted public filings with HKEx.
+ or – indicates change compared with offer price at IPO + or – indicates change since 29 December 2017
► Geopolitical uncertainty and trade issues could dampen investor enthusiasm for Greater China IPOs in H2 2018.
► However, repatriation of technology unicorns by the Chinese Government could propel a number of mega IPOs onto the Hong Kong and Mainland China IPO markets in H2 2018. With combined valuations estimated as high as US$1t, 2018 could become a blockbuster year for Greater China IPOs. First movers will set the tone for investor sentiment, whether positive or negative, in the months ahead.
► In H2 2018, China’s regional banks are poised to raise US$14b via IPOs. However, issuers may have to sell at low valuations to improve investors’ returns.
► As Hong Kong’s reforms to its listing regime come into effect, we expect to see an increase in IPO listings from biotech, technology and companies looking to take advantage of their ability to publicly trade their H-shares.
► Hong Kong will continue to be the preferred exchange for neighboring ASEAN companies, with increasing cross-border IPO activity in Q3 2018.
► In Mainland China, the CSRC pipeline has declined to more than 307 companies in June 2018 from more than 407 companies in March 2018. This decline was due to more stringent criteria for IPO approvals being applied by the IEC and the higher rejection rate of IPO applications. The rejection rate increased to 46% in
Q1 2018 and 40% in Q2 2018, compared with 35% in Q4 2017.► Despite being more stringent, the pace of IPO approvals has
accelerated, thus clearing the IPO backlog and shortening the time period for companies waiting to go public on Mainland China exchanges.
+ indicates an increase in volatility as at 15 June 2018 compared with 29 December 2017 for year-to-date (YTD). Whereas - indicates a decrease in volatility.

Global IPO trends: Q2 2018 | Page 19
Asia-Pacific — Japan market insight Japan IPO activity holds up well compared with global markets
“Relative to other parts of the world, Japan’s IPO market has continued to perform well, with small-cap listings still driving IPO activity in Q2 2018. Abenomics policies, particularly relating to the technology sector, are having their desired effect in boosting long-term growth.”Shinichiro SuzukiEY Japan IPO Leader

Global IPO trends: Q2 2018 | Page 20All values are US$ unless otherwise noted. | Q2 2018 and Q2 18 refer to the second quarter of 2018 and cover priced IPOs from 1 April to 15 June 2018 plus expected IPOs by end of June. H1 2018 and YTD 2018 refer to the first six months of 2018 and cover priced IPOs from 1 January to 15 June 2018 plus expected IPOs by end of June.
Markets YTD 2018 Change on
prior year Q2 2018Change on prior yearquarter
39IPOs
21IPOs
$2.7bProceeds
$1.5bproceeds
$11.1mmedian deal size
$7.2mmedian deal size
Tokyo Main Market JASDAQ and MOTHERSQ2 2018
Change on prior year quarter
Q2 2018Change on prior year quarter
3IPOs
18IPOs
$0.1bproceeds
$1.4bproceeds
$21.8mmedian deal size
$7.2mmedian deal size
Activity Q2 2018
Asia-Pacific — Japan market insight
Sectorsby highest number of IPOs
Technology11 IPOs$1.3b
Consumer products5 IPOs$147m
Retail2 IPOs$15m
IPOslargest by proceeds
Mercari, Inc.$1.1bTechnologyMOTHERS
Raksul Inc.$148mTechnologyMOTHERS
Sprix Ltd.$115mConsumer productsTokyo (TSE)
Equity index
Nikkei 225+0.4%Japan
Tokyo Main MarketIPO pricing and performance
First-day average return
+5.2%Share price performance since IPO
+13.4%
All amounts in table are in US$. + or – indicates change since 29 December 2017All amounts in table are in US$
Highlights from the market► The economic reform program of Abenomics continues to bear
fruit in Japan’s IPO market. Q2 2018 saw sizeable gains in both volume and proceeds, increasing 75% and 202%, respectively, over Q1 2018. The large increase in Q2 2018 meant that Japan finished H1 2018 with a 5% decline in volume and an 8% increase in proceeds compared with H1 2017.
► The Japan Exchange Group, which includes the Tokyo Stock Exchange, the two junior markets, the MOTHERS board for growth companies and JASDAQ, ranked as the sixth most active in terms of volume in Q2 2018 and fifth for H1 2018.
► Similar to other exchanges around the world, technology is driving Japan’s IPO market, with 11 technology IPOs listed in Q2 2018, producing proceeds of US$1.3b. Consumer products continues to be active by deal numbers in Q2 2018.
► The big news for Japan in Q2 2018 was the listing of Mercari, Inc. on the MOTHERS board, which raised approximately US$1.1b. Mercari, which offers an eBay-like service, is Japan’s first technology start-up unicorn ever to go public. Mercari is Japan’s largest IPO by proceeds so far this year and is likely to be the largest IPO for 2018. The company achieved post-IPO market cap of US$6.3b, which would make Mercari the largest company by market cap listed on the MOTHERS board.
► The volume of technology listings reflects strong support for the sector by the Japanese Government, which is encouraging investments in artificial intelligence, FinTech and other future-leading fields, as part of its Abenomics program to boost long-term economic growth.
► The self-regulating Japan Cryptocurrency Business Association was set up in April 2018, to oversee the virtual currency exchanges. They would have the power to create and enforce rules and set fines, and develop standards for cryptocurrencies.
► We expect an increase in IPO activity on Japan’s exchanges in the rest of 2018. We expect around 100 IPOs for the full year of 2018, slightly above the 95 IPOs seen in 2017.
+ or – indicates change compared with offer price at IPO
$0.0
$0.2
$0.4
$0.6
$0.8
$1.0
$1.2
$1.4
$1.6
$1.8
0
10
20
30
40
50
60
70
80
2014 2015 2016 2017 YTD 18
Number of IPOs Proceeds US$b
$0
$4
$8
$12
$16
0
5
10
15
20
25
30
2014 2015 2016 2017 YTD 18
66%
50%
90%
9%
75%
1796%
100%
5%
8% 202%
15%
8%

Global IPO trends: Q2 2018 | Page 21
Europe, Middle East, India and AfricaAmid uncertainty, IPO pipeline remains robust behind the scene“Rising geopolitical disruptions and trade tensions mean that EMEIA’s agenda is not entirely its own. As an export-oriented region, EMEIA relies on stable relationships with its partners for trade. Despite strong economic fundamentals and strong IPO pipeline, IPO activity levels may continue to lag until investors and issuers alike feel that market conditions are more favorable.” Dr. Martin SteinbachEY Global and EMEIA IPO Leader

Global IPO trends: Q2 2018 | Page 22All values are US$ unless otherwise noted. | Q2 2018 and Q2 18 refer to the second quarter of 2018 and cover priced IPOs from 1 April to 15 June 2018 plus expected IPOs by end of June. H1 2018 and YTD 2018 refer to the first six months of 2018 and cover priced IPOs from 1 January to 15 June 2018 plus expected IPOs by end of June.
Markets YTD 2018 Change on
prior year Q2 2018Change on prior year quarter
236IPOs
122IPOs
$29.5bproceeds
$11.8bproceeds
Europe, Middle East, India and Africa
Highlights from the markets► EMEIA IPO markets got off to a strong start in Q1 2018, but
ongoing geopolitical uncertainty and shifting trade policies had EMEIA investors proceeding with caution in Q2 2018. Despite a 4% decline in deal volumes in H1 2018, deal proceeds rose 10% compared with H1 2017. Furthermore, H1 2018 was above the EMEIA 10-year median deal numbers and proceeds for the first half of the year.
► EMEIA accounted for four of the top ten exchanges globally by proceeds in H1 2018 and three by deal numbers.
► Where IPO activity dipped across much of EMEIA, Indian IPO activity soared in H1 2018, with 94 IPOs raising US$4.0b. Globally, Indian exchanges recorded the second highest IPO activity in terms of deal numbers and accounted for 14% of global IPOs in H1 2018.
► While the volumes suggest a more modest Q2 2018, IPO pipelines and activity remain robust behind the scenes in Europe. Economies are strong in the Northern EU countries and interest rates remain low. However, geopolitical issues are diminishing the positive sentiment investors would otherwise feel. As a result, European candidates are taking a wait-and-see approach leading into H2 2018.
► In the UK, the London Main Market and AIM saw a drop in IPO activity in H1 2018, due to uncertainty surrounding Brexit. However, we expect numbers to pick up in H2 2018 as many UK companies look to launch their IPOs before Brexit is complete and to take advantage of market and regulatory stability.
► Cautious optimism summarizes the mood in the Middle East and North Africa (MENA) region in Q2 2018. Although oil prices have stabilized at a higher level, MENA countries are feeling the impact of the significant drop in oil prices in recent years. IPO activity was relatively slow in H1 2018 but activity is expected to pick up in H2 2018.
Activity Q2 2018
Stock exchangesBy highest proceeds
London (Main and AIM)$2.7b13 IPOsUK
NASDAQ OMX + First North$2.0b21 IPOsSweden, Finland, Denmark, Iceland, Estonia
Euronext & Alternext$1.4b9 IPOsFrance and Netherlands
IPOslargest byproceeds
Adyen BV$1.1bNetherlandsTechnologyEuronext
CEVA Logistics AG$824mSwitzerlandIndustrialsSIX Swiss
Vivo Energy plc$819mMoroccoEnergyLondon (LSE)
Sectorsby highestnumber of IPOs
Technology27 IPOs$3.8b
Industrials20 IPOs$2.3b
Consumer products15 IPOs$379m
All amounts in table are in US$
Main markets Junior marketsQ2 2018
Change on prior year quarter
Q2 2018Change on prior year quarter
54IPOs
68IPOs
$10.3bproceeds
$1.4bproceeds
All amounts in table are in US$
All amounts in table are in US$
$0.0
$1.0
$2.0
$3.0
$4.0
$5.0
$6.0
$7.0
0
50
100
150
200
250
300
350
2014 2015 2016 2017 YTD 18
Number of IPOs Proceeds US$b
$0
$20
$40
$60
$80
0
50
100
150
200
250
2014 2015 2016 2017 YTD 18
4%
23%
10%
15%
45%
48% 4%
7%

Global IPO trends: Q2 2018 | Page 23All values are US$ unless otherwise noted. | Q2 2018 and Q2 18 refer to the second quarter of 2018 and cover priced IPOs from 1 April to 15 June 2018 plus expected IPOs by end of June. H1 2018 and YTD 2018 refer to the first six months of 2018 and cover priced IPOs from 1 January to 15 June 2018 plus expected IPOs by end of June.
Trends
Sources of IPOs
YTD 2018
YTD 2018
Cross-border 8.3% of all EMEIA issuers* listed abroad
Outbound2.9% of all EMEIA issuers* listed outside EMEIA
Inbound3.6% of cross-border IPOs globally** listedon EMEIA exchanges but came fromoutside the region
*There were 241 IPOs by EMEIA issuers in YTD 2018. This analysis is based on the listed company domicile, regardless of the listed company exchange.** There were 56 cross-border IPOs globally in YTD 2018.
Europe, Middle East, India and Africa
Cross-border activity YTD 2018
EMEIA issuers’ cross-border activityPercentage of all EMEIA issuers
Although deal volumes fell in Q2 2018, median post-IPO market capitalization on Main markets rose substantially over the same time last year, with a few blockbuster technology and energy companies leading the way.
2IPOs
7IPOs
Transaction sizes YTD 2018
Main markets Junior marketsYTD 2018 Change on prior year YTD 2018 Change on prior year
Median post-IPO market cap $325.8m $12.3mMedian deal size $101.4m $3.3mTrends
12%5%
83%
Percentage of proceeds
All amounts in table are in US$. Figures may not total 100% due to rounding.
6%3%
91%
Percentageof IPOs
20IPOs
Financial sponsor-backed Former state-owned enterprises Non-financial sponsor-backed
25%
21% 19% 15% 10% 6%
1% 1%2% 2%
3%
78% 80% 83% 89% 91%
2014 2015 2016 2017 YTD 18
16%
12%8% 8% 8%
2014 2015 2016 2017 YTD 18
$0
$100
$200
$300
$400
2014 2015 2016 2017 YTD 18$0
$10
$20
$30
$40
2014 2015 2016 2017 YTD 18
Median post-IPO market cap US$m
Median deal size US$m
10%37%
6%

Global IPO trends: Q2 2018 | Page 24All values are US$ unless otherwise noted. | Q2 2018 and Q2 18 refer to the second quarter of 2018 and cover priced IPOs from 1 April to 15 June 2018 plus expected IPOs by end of June. H1 2018 and YTD 2018 refer to the first six months of 2018 and cover priced IPOs from 1 January to 15 June 2018 plus expected IPOs by end of June.
Europe, Middle East, India and Africa
PerformanceEquity indicesYTD 2018
BSE SENSEX+4.6%India
CAC 40+3.6%France
DAX 30+0.7%Germany
Euro STOXX 50+0.03%Europe
FTSE 100-0.7%UK
JSE All Share-3.1%South Africa
MICEX+6.1%Russian Federation
Tadawul All Share-6.1%Saudi Arabia
IPO pricing and performance YTD 2018
First-day average return
Share price performance since IPO
Main markets +11.0% +16.3%
Junior markets +7.0% +15.3%
Volatility indices
VSTOXX®
12.13index level
-10.2%YTD
-30.4%Q1 2018
VDAX®
13.27 index level
-6.2%YTD
-28.0%Q1 2018
VFTSE 100 11.91 index level
+24.7%YTD
-13.4%Q1 2018
+ or – indicates change since 29 December 2017
- + indicates a increase in volatility as at 15 June 2018 compared with 29 December 2017 for year-to-date (YTD). Whereas - indicates an decrease in volatility over the same time period.+ or – indicates change compared with offer price at IPO
► As we head into H2 2018, the outlook is less certain than it was in H1 2018. Geopolitical uncertainties and shifts in trade policies across Europe and globally are creating concerns among investors.
► In Europe, these uncertainties have many European issuers taking a wait-and-see approach.
► In the UK, Brexit is the wildcard that makes the IPO markets difficult to predict. However, we expect to see a flurry of activity in the next two quarters as issuers look to complete their IPOs before Brexit comes into force.
► In India, several companies have lined up for IPO plans with deal size totaling US$5.0b in the coming months. Consequently, the prospects for India IPO activity are bright for the rest of year. The Indian stock market is seeing a lot more volatility this year and thus
the windows for deals will get shorter as compared with last year. Also, a certain level of uncertainty surrounding next year’s general elections may impact the overall IPO activity in the country. However, inflows of domestic capital remain strong, leading to many opportunities for companies to take the IPO route.
► In MENA, IPO activity is expected to increase in H2 2018. The most important impetus for this region will likely be from the privatization drive across the region leading to the listing of government or quasi-government enterprises. The FTSE equity indices upgrading of Saudi Arabia to emerging market (EM) status is expected to pump billions of dollars of foreign investment into Tadawul, the region’s biggest stock exchange.
► Meanwhile, Egypt has chosen 23 companies for the first phase of its state privatization/IPO program, an initiative that aims to increase
funding to Egyptian companies and maximize benefits from state assets. These measures are expected to drive the highest IPO activity on Egyptian Stock Exchange for many years.
► The Kuwait Stock Exchange (KSE) is expected to enter the FTSE Russell Emerging Market Index in two equal stages during September and December 2018. The exchange is also introducing the second phase of its market development, which includes a three-tiered segmented market, the introduction of new market-capitalized indices, as well as new listing requirements.
► Due to recent political and economic instability in many key markets in Africa, we continue to anticipate that African IPO activity will remain subdued for the rest of 2018.
Outlook

Global IPO trends: Q2 2018 | Page 25All values are US$ unless otherwise noted. | Q2 2018 and Q2 18 refer to the second quarter of 2018 and cover priced IPOs from 1 April to 15 June 2018 plus expected IPOs by end of June. H1 2018 and YTD 2018 refer to the first six months of 2018 and cover priced IPOs from 1 January to 15 June 2018 plus expected IPOs by end of June.
MarketsYTD 2018 Change on
prior year Q2 2018Change on prior year quarter
119IPOs
73IPOs
$23.8bProceeds
$9.6bproceeds
11% of IPOs are financial sponsor-backed
7% of IPOs are financial sponsor-backed
Activity Q2 2018
Performance YTD 2018
Europe snapshot
Main markets Junior marketsQ2 2018
Change on prior year quarter
Q2 2018Change on prior year quarter
38IPOs
35IPOs
$8.3bproceeds
$1.3bproceeds
All amounts in table are in US$
All amounts in table are in US$
5% IPO pricing and performance
First-day average return
Main markets +12.6%Junior markets +9.0%Share price performance since IPO
Main markets +19.3%Junior markets +20.1%
Equity indices
CAC 40+3.6%France
DAX 30+0.7%Germany
Euro STOXX 50+0.03%Europe
FTSE 100-0.7%UK
Volatility index
VSTOXX®
-10.2% | 12.1 index levelYTD
VFTSE 100 +24.7% | 11.9 index levelYTD
Sectorsby highest number of IPOs
Technology24 IPOs | $3.8b
Consumer products10 IPOs | $0.4b
Industrials7 IPOs | $1.6b
All amounts in table are in US$ + or – indicates change since 29 December 2017
+ indicates a increase in volatility as at 15 June 2018 compared with 29 December 2017 for year-to-date (YTD).
+ or – indicates change compared with offer price at IPO
IPOslargest by proceeds
Adyen BV $1.1b Technology, Euronext (Amsterdam)
CEVA Logistics AG $824m Industrials, SIX Swiss
Vivo Energy plc$819m Energy, London (LSE)
Stock exchanges by highest total proceeds
London (Main and AIM)$2.7b | 13 IPOs UK
NASDAQ OMX and First NorthUS$2.0b | 21 IPOs
Euronext and AlternextUS$1.4b | 9 IPOs
Trends YTD 2018
Transaction sizesMain markets Change on prior year Junior markets Change on prior year
Median post-IPO market cap $424.4m $34.7m
Median deal size $143.2m $7.1m
$0
$1
$2
$3
$4
$5
$6
0
20
40
60
80
100
120
140
160
2014 2015 2016 2017 YTD 18
Number of IPOs Proceeds US$b
$0
$10
$20
$30
$40
$50
$60
$70
0
20
40
60
80
100
120
140
160
180
2014 2015 2016 2017 YTD 18
Cross-border IPOs: top IPO issuers
Cross-border 14% of all Europe issuers* listed abroad
17IPOs
Outbound5.0% of all Europe issuers* listed outside Europe
6IPOs
Inbound7.1% of cross-border IPOs globally** listed on European exchanges but came from outside Europe
4IPOs
*There were 121 IPOs by European issuers in YTD 2018. This analysis is based on the listed company domicile, regardless of the listed company exchange.
** There were 56 cross-border IPOs globally in YTD 2018.
38%
5%
40%
5%
12%
48%
27%
21%
52%
14%
16%

Global IPO trends: Q2 2018 | Page 26
EMEIA — UK IPO market insightTechnology IPOs shine through the cloudy Brexit environment
“The uncertainty concerning Brexit continues to cast a long shadow over the UK IPO market, with higher activity taking place before Brexit, while the market situation is well known. Technology and oil and gas companies have had a significant impact in 2018, overtaking financial services as the most active sectors, and proving the London Market has a wide range of sectors that attract investors.”Scott McCubbinEY UK and Ireland IPO Leader

Global IPO trends: Q2 2018 | Page 27All values are US$ unless otherwise noted. | Q2 2018 and Q2 18 refer to the second quarter of 2018 and cover priced IPOs from 1 April to 15 June 2018 plus expected IPOs by end of June. H1 2018 and YTD 2018 refer to the first six months of 2018 and cover priced IPOs from 1 January to 15 June 2018 plus expected IPOs by end of June.
Markets YTD 2018 Change on
prior year Q2 2018Change on prior yearquarter
22IPOs
13IPOs
$3.9bproceeds
$2.7bproceeds
EMEIA — UK IPO market insight
Highlights from the markets► Brexit continues to create uncertainty in the UK IPO market as
issuers and investors alike try to determine which direction the UK economy will move toward once the country’s exit from the EU is complete.
► In fact, the lower IPO deal volume is less about Brexit and more about the feeling of uncertainty it evokes. Some IPO candidates with mainly UK operations are rushing to complete their IPOs before the end of the year. Others will likely wait until Q1 2020 before making a move to let the dust settle. That said, we do expect some movement on London’s AIM as listings with values under US$100m look to go public.
► The good news is that more technology issuers are looking to list on the London Stock Exchange, seeking to take advantage of favorable media coverage and a strong pool of investors.
► Similarly, oil and gas and other resources issuers continue to look to the London Main Market and AIM to launch their IPOs. London has always been a strong market for the oil and gas sector.
► Financial services has been relatively quiet in Q2 2018. Although there were the same number of deals compared with Q2 2017, average deal size were notably smaller. In Q2 2017, there were four financials IPOs with total proceeds of US$4.0b. Whereas in Q2 2018, there were four IPOs with total proceeds of US$297m. However, given that financial services companies see the London Stock Exchange as a preferred destination for IPOs, we expect this sector to be one of the most active in the 2018 calendar year.
► In terms of pricing, IPOs are still emerging at the lower end of the pricing range as valuation pressure remains steady on issuers to provide investors with a deal they can feel good about, particularly in these uncertain times.
Activity Q2 2018
Sectorsby highest number of IPOs
Technology5 IPOs$1.4b
Financials4 IPOs$297m
Energy2 IPOs$821m
IPOs on AIMlargest by proceeds
Codemasters Group Holdings Ltd. $246mTechnologyUK
Urban Exposure plc $206mFinancialsUK
Mind Gym Limited$187mTechnologyUK
IPOs on Main Marketlargest by proceeds
Vivo Energy plc$819mEnergyMorocco
Avast plc$816mTechnologyCzech Republic
Predator Oil & Gas Holdings plc $2mEnergyUK
All amounts in table are in US$
London Main Market London AIMQ2 2018 Change on
Q2 2017 Q2 2018 Change on Q2 2017
3IPOs
10IPOs
$1.6bproceeds
$1.0bproceeds
All amounts in table are in US$
All amounts in table are in US$
$0
$2
$4
$6
$8
0
10
20
30
40
50
60
70
80
2014 2015 2016 2017 YTD 18
Number of IPOs Proceeds US$b
$0
$5
$10
$15
$20
$25
0
5
10
15
20
25
30
35
40
45
2014 2015 2016 2017 YTD 18
35%
67%
46% 56%
69%
17%
33%
38%
Global IPO trends: Q2 2018 | Page 28All values are US$ unless otherwise noted. | Q2 2018 and Q2 18 refer to the second quarter of 2018 and cover priced IPOs from 1 April to 15 June 2018 plus expected IPOs by end of June. H1 2018 and YTD 2018 refer to the first six months of 2018 and cover priced IPOs from 1 January to 15 June 2018 plus expected IPOs by end of June.
Trends
Sources of IPOs
YTD 20189%
0%
91%
Percentage of proceeds
5%
0%
95%
Percentage of IPOs
EMEIA — UK IPO market insight
Leaving UK
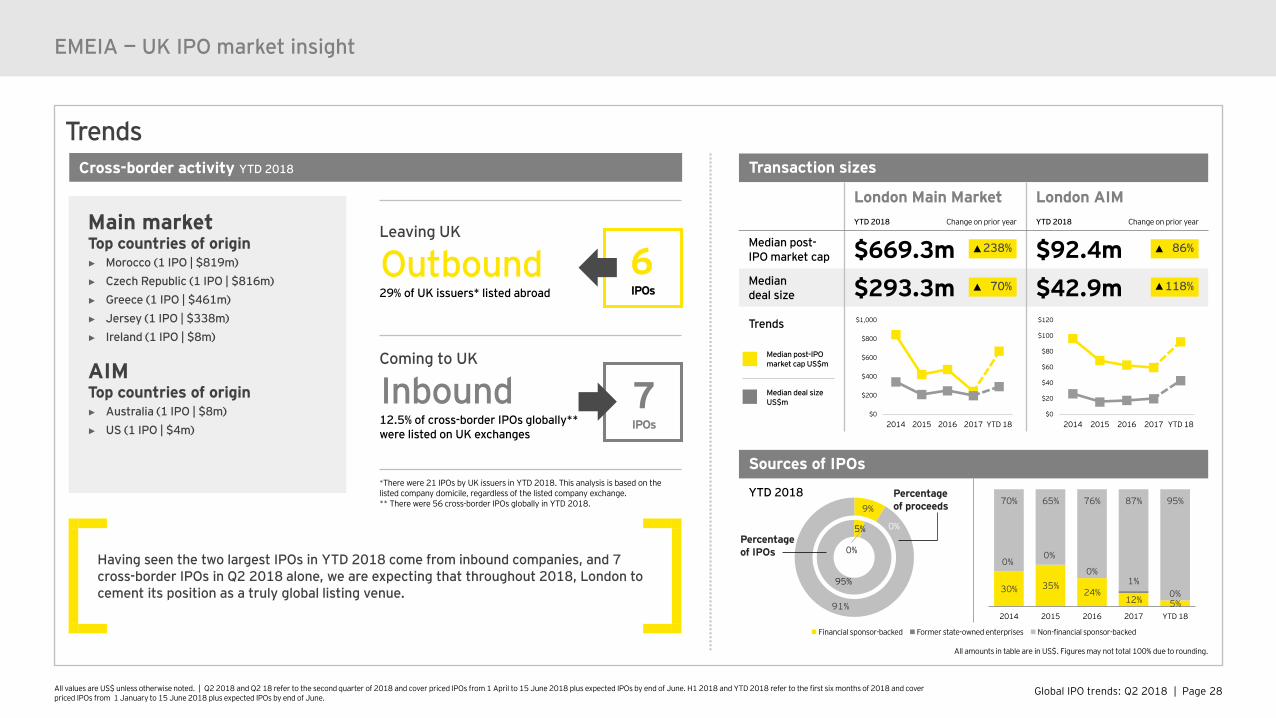
Outbound29% of UK issuers* listed abroad
Coming to UK
Inbound 12.5% of cross-border IPOs globally**were listed on UK exchanges
*There were 21 IPOs by UK issuers in YTD 2018. This analysis is based on the listed company domicile, regardless of the listed company exchange.** There were 56 cross-border IPOs globally in YTD 2018.
Cross-border activity YTD 2018
Main marketTop countries of origin► Morocco (1 IPO | $819m)► Czech Republic (1 IPO | $816m)► Greece (1 IPO | $461m)► Jersey (1 IPO | $338m)► Ireland (1 IPO | $8m)
AIMTop countries of origin► Australia (1 IPO | $8m)► US (1 IPO | $4m)
7IPOs
6IPOs
Transaction sizes
London Main Market London AIMYTD 2018 Change on prior year YTD 2018 Change on prior year
Median post-IPO market cap $669.3m $92.4mMedian deal size $293.3m $42.9mTrends
Median post-IPO market cap US$m
Median deal size US$m
All amounts in table are in US$. Figures may not total 100% due to rounding.
Financial sponsor-backed Former state-owned enterprises Non-financial sponsor-backed
Having seen the two largest IPOs in YTD 2018 come from inbound companies, and 7 cross-border IPOs in Q2 2018 alone, we are expecting that throughout 2018, London to cement its position as a truly global listing venue.
$0
$200
$400
$600
$800
$1,000
2014 2015 2016 2017 YTD 18$0
$20
$40
$60
$80
$100
$120
2014 2015 2016 2017 YTD 18
118%
86%238%
70%
30% 35%24%
12% 5%
0%0%
0%1%
0%
70% 65% 76% 87% 95%
2014 2015 2016 2017 YTD 18

Global IPO trends: Q2 2018 | Page 29All values are US$ unless otherwise noted. | Q2 2018 and Q2 18 refer to the second quarter of 2018 and cover priced IPOs from 1 April to 15 June 2018 plus expected IPOs by end of June. H1 2018 and YTD 2018 refer to the first six months of 2018 and cover priced IPOs from 1 January to 15 June 2018 plus expected IPOs by end of June.
EMEIA — UK IPO market insight
PerformanceEquity indices YTD 2018
FTSE 100-0.7%UK
FTSE 350-0.4%UK
FTSE AIM All-Share+5.0%UK
IPO pricing and performance YTD 2018
First-day average return
Share price performance since IPO
London Main Market +4.7% +2.4%
London AIM +18.9% +37.9%
Volatility indices
FTSE 100 VIX (VFTSE 100)11.91 index level
+24.7%YTD
-13.4%Q1 2018
+ or – indicates change since 29 December 2017+ or – indicates change compared with offer price at IPO
+ indicates a increase in volatility as at 15 June 2018 compared with 29 December 2017for year-to-date (YTD) . Whereas - indicates an decrease in volatility over the same time period.
► The UK has one of the strongest IPO markets globally, but between the uncertainty around Brexit and a confluence of geopolitical events, investors seem more inclined to hold their cash for the time being.
► The UK IPO pipeline remains positive for smaller Main Market listings and AIM listings. We expect to see IPO activity peak in Q3 2018 for this group of companies, particularly as some of the delayed listings from Q1 2018 hit the public market. There are some signs of more listings coming from larger companies with more significant deal sizes, but given the wait-and-see attitude, it will take one or two candidates to move first before we see an increase in activity around these companies.
► The low valuation of the pound, along with the continued uncertainty around the UK’s exit from the EU will suppress the appetite for listing toward the end of the year. As a result, we expect to see a quiet conclusion to 2018 as Brexit approaches.
► Private equity (PE), historically a strong player in the UK IPO market, had been relatively quiet recently. But in Q2 2018, PE-backed IPOs regained traction as a wide variety of companies came to market. In the past, PE was mainly looking to get its money from its investment through an IPO. Today, they are looking to maintain their investments, retaining existing management teams to keep managing the business.
► From a regulatory perspective, Financial Conduct Authority (FCA) changes to the rules around UK IPOs will come into effect in July 2018, clarifying and enhancing the listing process, particularly for foreign companies seeking to list in the UK. The most significant FCA change relates to the timing of the IPO documentation, which would become effective from 1 July 2018. As a result of these FCA rule changes, we expect some uplift in UK IPO activity level in the second half of 2018 and beyond, despite economic and geopolitical uncertainties.
Outlook

AppendixAreas and regional IPO markets facts and figures
Definitions

Global IPO trends: Q2 2018 | Page 31*Data based on domicile of the exchange, regardless of the listed company domicile. Euronext includes Amsterdam, Paris, Brussels and Lisbon; Shenzhen (SZSE) includes the Main Board, SME Board and ChiNext.
Appendix
By number of IPOs
2018
yea
r-to
-dat
e
Ranking Stock exchanges* Number of IPOs % of global IPOs
1 Hong Kong (HKEx) and GEM 97 14.72 National (NSE and SME) and Bombay (BSE and SME) 94 14.23 NASDAQ 66 10.04 Australia (ASX) 40 6.15 Tokyo (TSE), MOTHERS and JASDAQ 38 5.86 Shanghai (SSE) 37 5.67 New York (NYSE) 35 5.38 NASDAQ OMX and First North 34 5.29 Shenzhen (SZSE and Chinext) 28 4.2
10 London (Main and AIM) 22 3.311 Indonesia (IDX) 19 2.912 Euronext and Alternext 14 2.1
Other stock exchanges (35 exchanges) 136 20.6
Global IPO activity 660 100.0
2017
Ranking Stock exchanges* Number of IPOs % of global IPOs
1 Shenzhen (SZSE and Chinext) 222 13.02 Shanghai (SSE) 214 12.53 National (NSE and SME) and Bombay (BSE and SME) 171 10.04 Hong Kong (HKEx and GEM) 159 9.35 NASDAQ 108 6.36 Australia (ASX) 96 5.67 Tokyo (TSE), MOTHERS and JASDAQ 90 5.38 NASDAQ OMX and First North 86 5.09 London (Main and AIM) 78 4.6
10 New York (NYSE) 71 4.111 Korea (KRX+KOSDAQ) 56 3.312 Thailand (SET+MAI) 44 2.6
Other stock exchanges (53 exchanges) 318 18.6
Global IPO activity 1,713 100.0
By proceedsRanking Stock exchanges* US$b % of global IPOs
1 New York (NYSE) 18.6 19.72 NASDAQ 11.4 12.13 Shanghai (SSE) 10.1 10.74 Deutsche Boerse (Main and Scale) 8.9 9.45 Hong Kong (HKEx) and GEM 6.1 6.56 Shenzhen (SZSE and Chinext) 4.7 4.97 National (NSE and SME) and Bombay (BSE and SME) 4.0 4.28 London (Main and AIM) 3.9 4.19 NASDAQ OMX and First North 2.9 3.1
10 Tokyo (TSE), MOTHERS and JASDAQ 2.7 2.811 Sao Paulo (BM&F BOVESPA) 2.5 2.612 Ho Chi Minh (HOSE) 2.5 2.6
Other stock exchanges (35 exchanges) 16.2 17.2
Global IPO activity 94.3 100.0
Ranking Stock exchanges* US$b % of global IPOs
1 New York (NYSE) 30.1 15.72 Shanghai (SSE) 20.3 10.53 Hong Kong (HKEx) and GEM 16.1 8.44 London (Main and AIM) 14.8 7.75 Shenzhen (SZSE and Chinext) 13.7 7.16 National (NSE and SME) and Bombay (BSE and SME) 11.7 6.17 NASDAQ 10.3 5.38 Korea (KRX and KOSDAQ) 6.8 3.59 Tokyo (TSE), MOTHERS and JASDAQ 6.1 3.2
10 Sao Paulo (BM&F BOVESPA) 5.7 3.011 NASDAQ OMX and First North 4.9 2.612 SIX Swiss Exchange 4.6 2.4
New York (NYSE) 47.2 24.6
Global IPO activity 192.3 100.0
Top 12 stock exchanges

Global IPO trends: Q2 2018 | Page 32*Data based on domicile of the exchange, regardless of the listed company domicile. Euronext includes Amsterdam, Paris, Brussels and Lisbon; Shenzhen (SZSE) includes the Main Board, SME Board and ChiNext.
1. In YTD 2018 , there were 7 IPOs raising US$382m on Toronto Stock Exchange and TSX Venture Exchange. There were also 6 IPOs on Canadian Securities Exchange that raised US$3.1m altogether — these listings were excluded on page 8. In Q2 2018, there were 3 IPOs raising US$237.9m on Toronto Stock Exchange and TSX Venture Exchange, while there were also 5 IPOs on Canadian Securities Exchange that raised US$2.8m altogether.2. In Q2 2017 and Q1 2018, there were no IPOs on Brazil’s B3 exchange.3. In Q2 2017 and Q2 2018, there were no IPOs on Jamaica Stock Exchange. 4. In YTD 2018, there was one IPO on Chile’s Santiago Stock Exchange which raised US$108.0m whereas in YTD 2017, there was one IPO which raised US$197.7m. In Q2 2017 and Q2 2018, there were no IPOs on Santiago Stock Exchange. 5. In 2017 and YTD 2018, there were no IPOs on Argentina’s Buneos Aires Stock Exchange. There were 2 IPOs by Argentinean companies in 2017: one of the IPOs were dual listed on New York Stock Exchange and Buneos Aires Stock Exchange, while the other IPO was listed on New York Stock Exchange. In YTD 2018, there were 2 IPOs by Argentinean companies, both were dual listed on New York Stock Exchange.
Appendix
Regional IPO facts and figures: Americas
US 101 20% 29.93 30% 54 -8% 15% 12.9 6% -25%
Canada1 13 0% 0.38 -79% 8 -11% 60% 0.2 -86% 67%
Brazil2 4 100% 2.50 427% 4 NA NA 2.5 NA NA
Mexico 2 0% 2.34 69% 0 -100% -100% 0.0 -100% -100%
Jamaica3 1 0% 0.001 22% 0 NA -100% 0.0 NA -100%
Chile4 1 0% 0.11 -45% 0 NA -100% 0.0 NA -100%
Argentina5 0 NA 0 NA 0 NA NA 0.0 NA NA
Americas 122 18% 35.26 31% 66 -4% 18% 15.6 9% -21%
Quarterly comparison
Regions/country* IPOs YTDChange YOY%
Proceeds US$b YTD
Change YOY%Change previous
quarter% (vs Q1 18)
Proceeds US$b current quarter: Q2
2018
Change QOQ% (vs Q2 17)
Change previous quarter%
(vs Q1 18)
Change QOQ% (vs Q2 17)
IPOs current quarter: Q2 2018
Year to date comparison

Global IPO trends: Q2 2018 | Page 33*Data based on domicile of the exchange, regardless of the listed company domicile. Euronext includes Amsterdam, Paris, Brussels and Lisbon; Shenzhen (SZSE) includes the Main Board, SME Board and ChiNext.
Appendix
1. In YTD 2018 and 2017, there were no IPOs on New Zealand Exchange, this compares to 2 IPOs which raised US$0.3b altogether in the first nine months of 2016.
Regional IPO facts and figures: Asia-PacificYear to date comparison Quarterly comparison
Regions/country* IPOs YTD Change YOY%
Proceeds US$b YTD Change YOY% IPOs current
quarter: Q2 18Change QOQ%
(vs Q2 17)
Change previous quarter%
(vs Q1 18)
Proceeds US$b current quarter: Q2 18
Change QOQ% (vs Q2 17)
Change previous quarter% (vs Q1 18)
Indonesia 19 0 0.7 147% 15 -17% 275% 0.67 139% 2820%
Thailand 6 -45% 0.4 -64% 0 -100% -100% 0.00 -100% -100%
Singapore 7 -30% 0.4 20% 4 -60% 33% 0.07 -79% -1%
Malaysia 10 25% 0.1 -87% 4 -50% -33% 0.06 -1% 1%
Myanmar 1 NA 0.0 NA 0 NA -100% 0.00 NA -1%
Philippines 1 -67% 0.0 -100% 1 -67% NA 0.00 -100% NA
Sri Lanka 0 -100% 0.00 -100% 0 -100% NA 0.00 -100% NA
Cambodia 0 -100% 0.00 -100% 0 -100% NA 0.00 -100% NA
Vietnam 3 NA 2.5 NA 2 NA 100% 2.27 NA 1135%
ASEAN 47 -13% 4.0 41% 26 -33% 24% 3.07 80% 221%
Mainland China 65 -74% 14.8 -19% 29 -88% -19% 8.49 -53% 35%
Hong Kong 97 41% 6.1 -13% 35 -49% -44% 3.00 -58% -4%
Taiwan 1 0% 0.02 64% 0 -100% -100% 0.00 -100% -100%
Greater China 163 -48% 20.9 -17% 63 -56% -37% 11.41 -15% 20%
Japan 39 -5% 2.7 8% 21 75% 17% 1.54 202% 38%
South Korea 13 -35% 0.3 -93% 5 -38% -38% 0.10 -97% -45%
Australia 40 -20% 1.6 92% 22 -4% 22% 1.50 117% 921%
New Zealand1 0 NA 0.0 NA 0 NA NA 0.00 NA NA
Oceania 40 -20% 1.6 92% 22 -4% 22% 1.50 117% 921%
Asia-Pacific 302 -37% 29.6 -17% 137 -39% -17% 17.63 -13% 48%

Global IPO trends: Q2 2018 | Page 34*Data based on domicile of the exchange, regardless of the listed company domicile. Euronext includes Amsterdam, Paris, Brussels and Lisbon; Shenzhen (SZSE) includes the Main Board, SME Board and ChiNext.
Appendix
Regional IPO facts and figures: EMEIA
Nordics (Denmark, Norway, Sweden and Finland)
42 -28% 4.1 17% 26 -38% 63% 2.1 -30% 3%
Commonwealth of Independent States (CIS)
0 -100% 0.0 -100% — -100% NA — -100% NA
Central and Southern Europe (CSE)
15 36% 1.6 31% 10 0% 100% 0.8 0% -1%
Germany, Switzerland and Austria (GSA)
19 171% 10.6 202% 11 120% 38% 2.3 0% -73%
Mediterrean (Italy and Spain) 6 -54% 1.2 -71% 3 -57% 0% 0.3 -84% -58%
WEM (Western Europe and Maghreb)
15 15% 2.5 -18% 9 29% 80% 1.5 -48% 42%
Continental Europe 97 -7% 19.9 28% 59 -18% 59% 6.9 -44% -47%
UK and Ireland1 23 -32% 4.0 -45% 14 -33% 56% 2.7 -55% 128%
Europe 120 -13% 23.8 5% 73 -22% 59% 9.6 -48% -32%
Africa2 2 -33% 0.2 1% 2 100% NA 0.2 134249% NA
India 96 23% 4.0 30% 38 3% -34% 1.8 -26% -38%
Middle East and North Africa 18 -36% 1.4 48% 8 0% -20% 0.9 0.7% 25%
EMEIA 236 -4% 29.5 10% 122 -15% 7% 11.8 -45% -34%
Quarterly comparison
IPOs current quarter: Q2 18
Change QOQ% (vs Q2 17)
Change previous quarter%
(vs Q1 18)
Year to date comparison
Regions/country* IPOs YTDChange YOY%
Proceeds US$b YTD
Change YOY%Proceeds US$b
current quarter: Q2 18
Change QOQ% (vs Q2 17)
Change previous quarter% (vs Q1 18)
1. In YTD 2018, there were 22 IPOs on London Main Market and AIM, which raised US$3.9b and in Q2 2018, there were 13 IPOs which raised US$2.7b. There was also 1 IPO on Irish Stock Exchange during Q2 2018, which raised US$88m.2. In YTD 2018 and Q2 2018, there were 2 IPOs on African exchanges, which raised US$242m and there was no IPOs in Q1 2018. In YTD 2017, there was 3 IPOs on African exchanges which raised US$115m.
Global IPO trends: Q2 2018 | Page 35*Data based on domicile of the exchange, regardless of the listed company domicile. Euronext includes Amsterdam, Paris, Brussels and Lisbon; Shenzhen (SZSE) includes the Main Board, SME Board and ChiNext.
Appendix
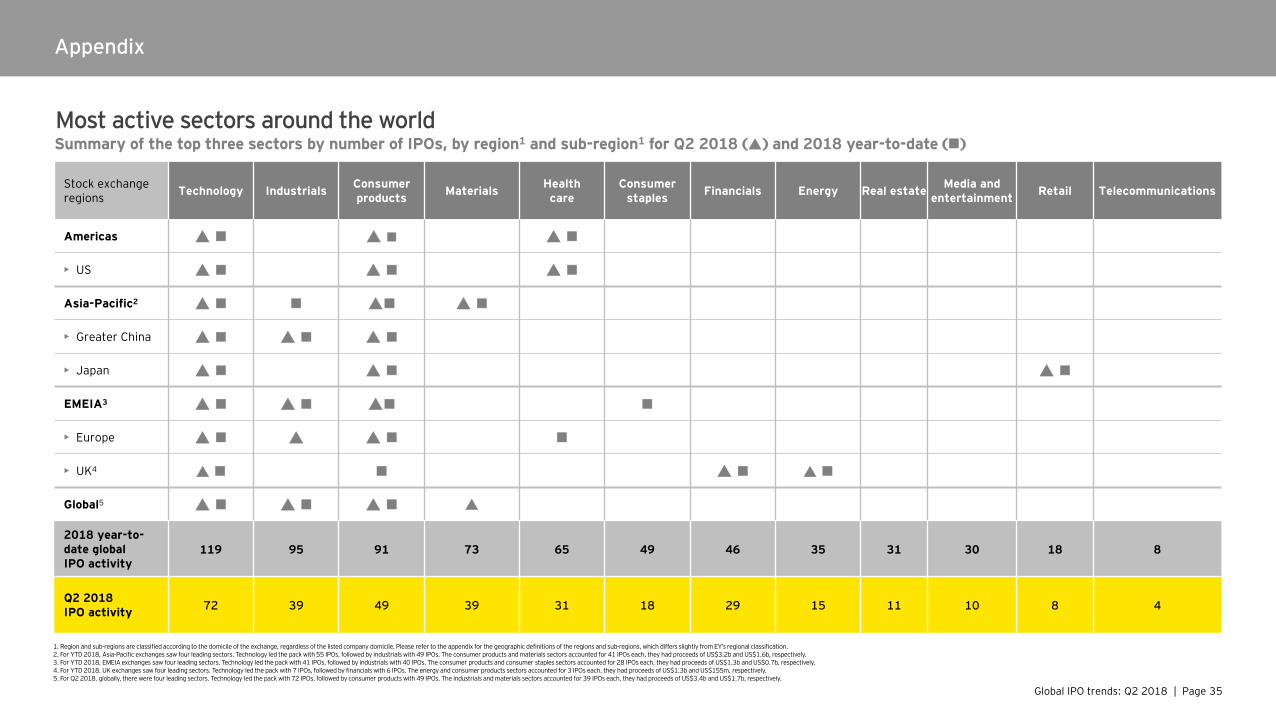
Most active sectors around the worldSummary of the top three sectors by number of IPOs, by region1 and sub-region1 for Q2 2018 () and 2018 year-to-date ()
Stock exchange regions Technology Industrials Consumer
products Materials Health care
Consumer staples Financials Energy Real estate Media and
entertainment Retail Telecommunications
Americas
• US
Asia-Pacific2
• Greater China
• Japan
EMEIA3
• Europe
• UK4
Global5
2018 year-to-date global IPO activity
119 95 91 73 65 49 46 35 31 30 18 8
Q2 2018 IPO activity 72 39 49 39 31 18 29 15 11 10 8 4
1. Region and sub-regions are classified according to the domicile of the exchange, regardless of the listed company domicile. Please refer to the appendix for the geographic definitions of the regions and sub-regions, which differs slightly from EY’s regional classification.2. For YTD 2018, Asia-Pacific exchanges saw four leading sectors. Technology led the pack with 55 IPOs, followed by industrials with 49 IPOs. The consumer products and materials sectors accounted for 41 IPOs each, they had proceeds of US$3.2b and US$1.6b, respectively.3. For YTD 2018, EMEIA exchanges saw four leading sectors. Technology led the pack with 41 IPOs, followed by industrials with 40 IPOs. The consumer products and consumer staples sectors accounted for 28 IPOs each, they had proceeds of US$1.3b and US$0.7b, respectively.4. For YTD 2018. UK exchanges saw four leading sectors. Technology led the pack with 7 IPOs, followed by financials with 6 IPOs. The energy and consumer products sectors accounted for 3 IPOs each, they had proceeds of US$1.3b and US$155m, respectively.5. For Q2 2018. globally, there were four leading sectors. Technology led the pack with 72 IPOs, followed by consumer products with 49 IPOs. The industrials and materials sectors accounted for 39 IPOs each, they had proceeds of US$3.4b and US$1.7b, respectively.

Global IPO trends: Q2 2018 | Page 36
Definitions
Methodology• The data presented in the Global IPO trends: Q2 2018 report and press release
is from Dealogic and EY. Q2 2018 (i.e., April-June) and YTD 2018 (January—June) is based on priced IPOs as of 15 June 2018 and expected IPOs in June. Data is up to 16 June 2018, 6 a.m. UK time. All data contained in this document is sourced to Dealogic and EY unless otherwise noted.
• For the purposes of these reports and press releases, we focus only on IPOs of operating companies and define an IPO as a company's first offering of equity to the public.
• This report includes only those IPOs for which Dealogic and EY offer data regarding the issue date (the day the offer is priced and allocations are subsequently made), trading date (the date on which the security first trades) and proceeds (funds raised, including any over-allotment sold). Postponed IPOs, or those which have not yet been priced, are therefore excluded. Over-the-counter (OTC) listings are also excluded.
• In an attempt to exclude non-operating company IPOs such as trusts, funds and special purpose acquisition companies (SPACs), companies with the following Standard Industrial Classification (SIC) codes are excluded:
• 6091: Financial companies that conduct trust, fiduciary and custody activities
• 6371: Asset management companies such as health and welfare funds, pension funds and their third-party administration as well as other financial vehicles
• 6722: Companies that are open-end investment funds
• 6726: Companies that are other financial vehicles
• 6732: Companies that are grant-making foundations• 6733: Asset management companies that deal with trusts, estates and
agency accounts
• 6799: Special purpose acquisition companies (SPACs)
• In our analysis, unless stated otherwise, IPOs are attributed to the domicile of the company undertaking an IPO. The primary exchange on which they are listed is as defined by Dealogic and EY research.
• A cross-border (or foreign) listing is where the stock exchange nation of the company is different from the company's domicile (i.e., issuer's nation).
• For IPO listings on HKEx; SSE; SZE; Japan’s Tokyo Stock Exchange (TSE); TSE MOTHERS; Korea's KRX and KOSDAQ; Thailand's SET and MAI; Indonesia IDX; WSE; NewConnect; TSX and TSX-V exchanges, we use their first trading date in place of issue date.
Markets definitions• Many stock exchanges have set up main markets and junior markets:
• Main markets are where medium and large IPOs (by proceeds) are usually listed and traded. Junior markets are where small-cap companies or smaller IPOs are listed or traded. Stock exchanges without junior markets are classified as main markets.
• Junior markets include Americas: Toronto Venture Exchange and Canadian National Stock Exchange; Asia-Pacific: Malaysia ACE Market, Bombay SME, Hong Kong Growth Enterprise Market, Japan JASDAQ, Japan MOTHERS, Korea KOSDAQ, Thailand’s Market for Alternative Investment, National SME, Shenzhen ChiNext, Singapore Catalist, Tokyo Stock Exchange MOTHERS Index; EMEIA: Alternext, London Alternative Investment Market, Germany's Frankfurt SCALE (formerly Entry Standard), Spain's Mercado Alternativo Bursatil, NASDAQ OMX First North, Warsaw New Connect, Johannesburg Alternative Market, Nomu — Parallel Market.
• Emerging markets or rapid-growth markets include issuers from Argentina, Armenia, Bangladesh, Bolivia, Brazil, Bulgaria, Chile, Colombia, Croatia, Cyprus, Egypt, Ethiopia, Greater China, Hungary, India, Indonesia, Ireland, Israel, Kenya, Kuwait, Kazakhstan, Laos, Lithuania, Malaysia, Mauritius, Mexico, Namibia, Pakistan, Peru, Philippines, Poland, Qatar, Russian Federation, Saudi Arabia, Sierra Leone, Singapore, Slovenia, South Africa, South Korea, Sri Lanka, Tanzania, Thailand, Tunisia, Turkey, Ukraine, United Arab Emirates, Vietnam and Zambia.
• Developed markets include issuers from Australia, Austria, Belgium, Bermuda, Canada, Denmark, Finland, France, Germany, Greece, Guernsey, Isle of Man, Italy, Japan, Jersey, Luxembourg, Netherlands, New Zealand, Norway, Portugal, Spain, Sweden, Switzerland, the United Kingdom and the United States.
Geographic definitions• Africa includes Algeria, Botswana, Egypt, Ghana, Kenya, Madagascar, Malawi,
Morocco, Namibia, Rwanda, South Africa, Tanzania, Tunisia, Uganda, Zambia and Zimbabwe.
• Americas includes North America and Argentina, Bermuda, Brazil, Chile, Colombia, Jamaica, Mexico and Peru.
• Asia includes Bangladesh, Greater China, Indonesia, Japan, Laos, Malaysia, Philippines, Singapore, South Korea, Sri Lanka, Thailand and Vietnam.
• Asia-Pacific includes Asia (as stated above) plus Australia, New Zealand, Fiji and Papua New Guinea.
• Central and South America includes Argentina, Bermuda, Brazil, Chile, Colombia, Ecuador, Jamaica, Mexico, Peru and Puerto Rico.
• EMEIA includes Armenia, Austria, Belgium, Bulgaria, Croatia, Cyprus, Czech Republic, Denmark, Estonia, Finland, France, Germany, Greece, Hungary, Iceland, India, Ireland, Isle of Man, Italy, Kazakhstan, Luxembourg, Lithuania, Netherlands, Norway, Pakistan, Poland, Portugal, Russian Federation, Spain, Sweden, Switzerland, Turkey, Ukraine and United Kingdom plus the Middle East and Africa countries listed below.
• Greater China includes Mainland China, Hong Kong, Macau and Taiwan.
• Middle East includes Bahrain, Iran, Israel, Jordan, Kuwait, Oman, Qatar, Saudi Arabia, Syria, United Arab Emirates and Yemen.
• North America consists of the United States and Canada.
Glossary• Financial sponsor-backed IPOs refer to IPOs that have private equity,
venture capital investors or both.• First-day average returns is the market value-weighted median of issuers’ offer
price versus the closing price at their first trade date, with the exception of the US section (page 10), where this is the mean of issuers’ offer price versus the closing price at their first trade date.
• Median deal size refers to the median IPO proceeds.
• Post-IPO market cap is the market value of the company after its IPO is completed. Median post-IPO market cap is calculated for IPOs priced by 15 June.
• Proceeds refers to total fund raised by the issuer company and selling shareholders. This is the total deal size.
• QOQ refers to quarter-on-quarter. This refers to the comparison of IPO activity on Q2 2018 with Q2 2017 for this current report.
• Share price performance since IPO is the market value weighted median current returns, which is the year-to-date returns as at 15 June 2018 versus offer price. This should be compared with equity indices performance that is also measured YTD. For the US section (page 10), this is the mean current returns.
• State-owned enterprise (SOE) privatizations refers to former state-owned entities that have completed their IPO listings to become public companies.
• YOY refers to year-on-year. This refers to the comparison of IPO activity for the first six months of 2018 with the first six months of 2017 for this current report.
• YTD stands for year-to-date. This refers to priced IPOs from 1 January to 15 June 2018 plus expected IPOs by the end of June.

EY | Assurance | Tax | Transactions | Advisory
About EY EY is a global leader in assurance, tax, transaction and advisory services. The insights and quality services we deliver help build trust and confidence in the capital markets and in economies the world over. We develop outstanding leaders who team to deliver on our promises to all of our stakeholders. In so doing, we play a critical role in building a better working world for our people, for our clients and for our communities.
EY refers to the global organization, and may refer to one or more, of the member firms of Ernst & Young Global Limited, each of which is a separate legal entity. Ernst & Young Global Limited, a UK company limited by guarantee, does not provide services to clients. For more information about our organization, please visit ey.com.
About EY’s Growth Markets NetworkEY worldwide Growth Markets Network is dedicated to serving the changing needs of high-growth companies. For more than 30 years, we’ve helped many of the world’s most dynamic and ambitious companies grow into market leaders. Whether working with international, mid-cap companies or early stage, venture backed businesses, our professionals draw upon their extensive experience, insight and global resources to help your business succeed. ey.com/growthmarkets
About EY’s Initial Public Offering ServicesEY is a leader in helping companies go public worldwide. With decades of experience, the global network is dedicated to serving market leaders and helping businesses evaluate the pros and cons of an initial public offering (IPO). We demystify the process by offering IPO readiness assessments, IPO preparation, project management and execution services, all of which help prepare you for life in the public spotlight. EY Global IPO Center of Excellence is a virtual hub, which provides access to our IPO knowledge, tools, thought leadership and contacts from around the world in one easy-to-use source.ey.com/ipocenter
© 2018 EYGM Limited. All Rights Reserved.
1806-2720734
EYG no: 03782-182Gbl
ED NoneThis material has been prepared for general information purposes only and is not intended to be relied upon as accounting, tax or other professional advice. Please refer to your advisors for specific advice.
ContactsDr. Martin SteinbachEY Global and EMEIA IPO [email protected]
Jackie KelleyEY Americas IPO Markets [email protected]
Ringo ChoiEY Asia-Pacific IPO [email protected]
Terence HoEY Greater China IPO [email protected]
Shinichiro SuzukiEY Japan IPO [email protected]
Scott McCubbinEY UK and Ireland IPO [email protected]
Find out more about future IPO prospectsFor more information on global IPO performance by quarter and year, and how the IPO market looks set to develop for the next 12 months, visit the EY Global IPO website:ey.com/ipoFollow the report on social media: via Twitter and LinkedInusing #IPOreport