f 2017: q4 r · pdf file · 2017-06-27same-restaurant sales growth1 7.3 % adjusted...
TRANSCRIPT

E A R N I N G S C A L L
FISCAL 2017: Q4 RESULTS
JUNE 27, 2017

2
IMPORTANT NOTICEThe following slides are part of a presentation by Darden Restaurants, Inc. (the "Company") and are intended to be viewed as part of that presentation (the "Presentation"). No
representation is made that the Presentation is complete.
Forward-looking statements in this communication regarding our expected earnings performance and all other statements that are not historical facts, including without limitation
statements concerning our future economic performance and expenses, are made under the Safe Harbor provisions of the Private Securities Litigation Reform Act of 1995. Any forward-
looking statements speak only as of the date on which such statements are first made, and we undertake no obligation to update such statements to reflect events or circumstances arising
after such date. We wish to caution investors not to place undue reliance on any such forward-looking statements. By their nature, forward-looking statements involve risks and uncertainties
that could cause actual results to materially differ from those anticipated in the statements. The most significant of these uncertainties are described in Darden's Form 10-K, Form 10-Q and
Form 8-K reports. These risks and uncertainties include our ability to successfully integrate Cheddar’s Scratch Kitchen operations into our business, technology failures including failure to
maintain a secure cyber network, food safety and food-borne illness concerns, litigation, unfavorable publicity, risks relating to public policy changes and federal, state and local regulation of
our business, labor and insurance costs, failure to execute a business continuity plan following a disaster, health concerns including food-related pandemics or virus outbreaks, intense
competition, failure to drive profitable sales growth, our plans to expand our smaller brands Bahama Breeze, Seasons 52 and Eddie V's, a lack of availability of suitable locations for new
restaurants, higher-than-anticipated costs to open, close, relocate or remodel restaurants, a failure to execute innovative marketing tactics, a failure to develop and recruit effective leaders,
a failure to address cost pressures, shortages or interruptions in the delivery of food and other products and services, adverse weather conditions and natural disasters, volatility in the
market value of derivatives, economic factors specific to the restaurant industry and general macroeconomic factors including interest rates, disruptions in the financial markets, risks of
doing business with franchisees and vendors in foreign markets, failure to protect our intellectual property, impairment in the carrying value of our goodwill or other intangible assets, failure
of our internal controls over financial reporting, an inability or failure to manage the accelerated impact of social media and other factors and uncertainties discussed from time to time in
reports filed by Darden with the Securities and Exchange Commission.
The information in this communication includes financial information determined by methods other than in accordance with accounting principles generally accepted in the United States of
America (“GAAP”), such as adjusted net earnings per diluted share from continuing operations. The Company’s management uses these non-GAAP measures in its analysis of the Company’s
performance. The Company believes that the presentation of certain non-GAAP measures provides useful supplemental information that is essential to a proper understanding of the
operating results of the Company’s businesses. These non-GAAP disclosures should not be viewed as a substitute for operating results determined in accordance with GAAP, nor are they
necessarily comparable to non-GAAP performance measures that may be presented by other companies. Reconciliations of these non-GAAP measures to the most comparable GAAP
measures are include under “Additional Information” in this presentation.
DISCLAIMER/NON-GAAP INFORMATION
1

3
$0.68$0.54
$1.21 $1.10$0.88
$0.64
$1.32$1.18
FY16 FY17 FY16 FY17 FY16 FY17 FY16 FY17
DARDEN ADJUSTED EPS2
Q1 Q2 Q3 Q4
$1.69 $1.61$1.85 $1.79$1.71 $1.64
$1.88 $1.93
FY16 FY17 FY16 FY17 FY16 FY17 FY16 FY17
DARDEN SALES ($BN)
Q1 Q2 Q3 Q4
1Excludes Cheddar’s Scratch Kitchen2 EPS values, except FY17 Q1, Q2 & Q3, are adjusted for special items. A reconciliation of reported to adjusted numbers can be found in the additional information section of this presentation.
1.3%
1.7%
0.9%
3.3%
Q1 FY17 Q2 FY17 Q3 FY17 Q4 FY17
SAME-RESTAURANT SALES GROWTH1
FISCAL FOURTH QUARTER HIGHLIGHTS
2

4
1 Industry excluding Darden brands. 2 Five weeks ending May 28, 2017.
4.4%SAME-RESTAURANT SALES
GROWTH
+590 BPSSAME-RESTAURANT SALES
INDUSTRY OUTPERFORMANCE1
3.5%SAME-RESTAURANT SALES
GROWTH
+500 BPSSAME-RESTAURANT SALES
INDUSTRY OUTPERFORMANCE1
ACQUISITION
COMPLETEDAPRIL 24, 2017
1.3%SAME-RESTAURANT SALES
GROWTH2
FISCAL FOURTH QUARTER HIGHLIGHTS
3

F I N A N C I A L D I S C U S S I O N

6
$1.18ADJUSTED DILUTED EPS FROM
CONTINUING OPERATIONS2
8.1%TOTAL SALES GROWTH
3.3%SAME-RESTAURANT SALES
GROWTH1
7.3%ADJUSTED DILUTED EPS GROWTH
VS LAST YEAR1
~$15 MILLION
SHARE REPURCHASES
1 Excludes Cheddar’s Scratch Kitchen2 EPS values adjusted for special items. A reconciliation of reported to adjusted numbers can be found in the additional information section of this presentation.
~$70 MILLION
DIVIDENDS PAID
FISCAL FOURTH QUARTER HIGHLIGHTS
5

7
As Reported As Adjusted
Q4 2017($ millions)
Q4 2017($ millions)
Q4 2017% of Sales
vs. Q4 2016 (bps) Favorable/(Unfavorable)
Sales $1,934.6 $1,934.6
Food & Beverage $557.5 $557.5 28.8% 10
Restaurant Labor $603.1 $603.1 31.2% (10)
Restaurant Expenses $335.8 $335.8 17.4% (20)
Marketing $64.3 $64.3 3.3% 20
Restaurant-Level EBITDA $373.9 $373.9 19.3% 10
G&A $133.3 $97.9 5.1% (10)
Depreciation & Amortization $70.4 $70.4 3.6% 10
Impairments - - 0.0 % 10
EBIT $170.2 $205.6 10.6% 10
Interest Expense $11.5 $11.5 0.6% (10)
EBT $158.7 $194.1 10.0% 10
Income Tax ExpenseNote: Effective Tax Rate
$33.321.0%
$45.3 2.3%23.3%
(30)
EAT $125.4 $148.8 7.7% (20)
Note: Continuing operations, values may not foot due to rounding. A reconciliation of reported to adjusted numbers can be found in the additional information section of this presentation.
MARGIN ANALYSIS
6

8
FY17 Q4 SEGMENT PERFORMANCE
18.9%17.4%
FY16 Q4 FY17 Q4
Segment Sales ($ millions)
Segment Profit Margin1
$982 $1,027
FY16 Q4 FY17 Q4
$413 $437
FY16 Q4 FY17 Q4
$132 $139
FY16 Q4 FY17 Q4
$264
$332
FY16 Q4 FY17 Q4
Other
Fine Dining
19.3% 19.9%
FY16 Q4 FY17 Q4
19.0% 19.1%
FY16 Q4 FY17 Q4
20.1% 20.4%
FY16 Q4 FY17 Q4
Other
Fine Dining
71 Segment profit margin calculated as (sales less costs of food & beverage, restaurant labor, restaurant expenses and marketing expenses) / sales.

9
1.8%SAME-RESTAURANT SALES
GROWTH1
3.4%TOTAL SALES GROWTH
13.9%ADJUSTED DILUTED EPS GROWTH
VS LAST YEAR2
$4.02ADJUSTED DILUTED EPS FROM
CONTINUING OPERATIONS2
~$230 MILLION
SHARE REPURCHASES
~$280 MILLION
DIVIDENDS PAID
FISCAL 2017 ANNUAL HIGHLIGHTS
1 Excludes Cheddar’s Scratch Kitchen2 EPS values adjusted for special items. A reconciliation of reported to adjusted numbers can be found in the additional information section of this presentation.
8

Food & BeverageRank: 1st
Gap: +7
ServiceRank: 5th
Gap: +2
AtmosphereRank: 1st
Gap: +6
Source: Technomic; Gap is Cheddar’s Scratch Kitchen – Casual Dining AverageCheddar’s Scratch Kitchen Rank is among Casual Dining brands (Y.E. Mar’17)
OUTPERFORMS CASUAL DINING ON MOST MEASURES
ValueRank: 1st
Gap: +9
Intent to ReturnRank: 1st
Gap: +9
Intent to
RecommendRank: 1st
Gap: +11
9

11
TRAILING TWELVE MONTHS
1 Trailing twelve months ended May 2017.2 Industry excluding Darden brands.
$4.5 MILLION
AVERAGE RESTAURANT VOLUME
$624 MILLION
TOTAL REVENUE
$72 MILLION
ADJUSTED EBITDA¹
~17%RESTAURANT-LEVEL EBITDA¹
0.3%SAME-RESTAURANT
SALES GROWTH
~300 BPSSAME-RESTAURANT SALES
INDUSTRY OUTPERFORMANCE2
10

12
SIGNIFICANT ROOM FOR GROWTH
1Cheddar’s Scratch Kitchen as of March 20172 Represents the range of calendar 2016 openings. Capital Investment includes cash investments for building, equipment, furniture and other construction costs; excludes internal capitalized overhead, pre-opening expenses,
tenant allowance and future lease obligations. Square feet includes all space under the roof, including the coolers and freezers and dining seats includes bar dining seats and patio seating, but excludes bar stools.11
Investment Profile2
Capital Investment Range $3.0 - $4.0MM
Square Feet 8,000
Dining Seats 280
Restaurant Footprint1

13
1 EPS values adjusted for special items. A reconciliation of reported to adjusted numbers can be found in the additional information section of this presentation.
FISCAL 2018 ANNUAL OUTLOOK
Total Sales Growth
11.5% to 13.0%
Same-Restaurant Sales Growth
1.0% to 2.0%
Restaurant Openings
35 to 40(Includes 4 to 5 Cheddar’s)
Capital Spending
$400 to $450 million
Total Inflation: ~2.0% Commodities: 0% to 1%
Labor: 3% to 4%
Effective Tax Rate
Approximately 26%
MARGIN
Adjusted Earnings per Diluted Share1
$4.38 to $4.50(~127 million Weighted Average Diluted Shares Outstanding)
SALES
12

14
INCREASING QUARTERLY DIVIDEND BY 12.5%
DARDEN QUARTERLY DIVIDEND
$0.50
$0.56 $0.56 $0.56 $0.56
$0.63
Mar 2016 Jun 2016 Sep 2016 Dec 2016 Mar 2017 Jun 2017
12.5%Increase
12.0%Increase
Note: Month dividend declared. 13

15
THANK YOU TO OUR 175,000 TEAM MEMBERS!
14

ADDITIONAL INFORMATION

17
As Reported As Adjusted
2017($ millions)
2017($ millions)
2017% of Sales
vs. 2016 (bps) Favorable/(Unfavorable)
Sales $7,170.2 $7,170.2
Food & Beverage $2,070.3 $2,070.3 28.9% 50
Restaurant Labor $2,265.3 $2,265.3 31.6% Flat
Restaurant Expenses $1,265.2 $1,265.2 17.6% (80)
Marketing $239.7 $239.7 3.3% 10
Restaurant-Level EBITDA $1,329.7 $1,329.7 18.5% (30)
G&A $387.7 $351.5 4.9% (10)
Depreciation & Amortization $272.9 $272.9 3.8% 40
Impairments ($8.4) ($8.4) (0.1%) 20
EBIT $677.5 $713.7 10.0% 30
Interest Expense $40.2 $40.2 0.6% 30
EBT $637.3 $673.5 9.4% 70
Income Tax ExpenseNote: Effective Tax Rate
$154.824.3%
$167.2 2.3%24.8%
(20)
EAT $482.5 $506.3 7.1% 50
Note: Continuing operations, values may not foot due to rounding. A reconciliation of reported to adjusted numbers can be found in the additional information section of this presentation.
ANNUAL MARGIN ANALYSIS
16
18
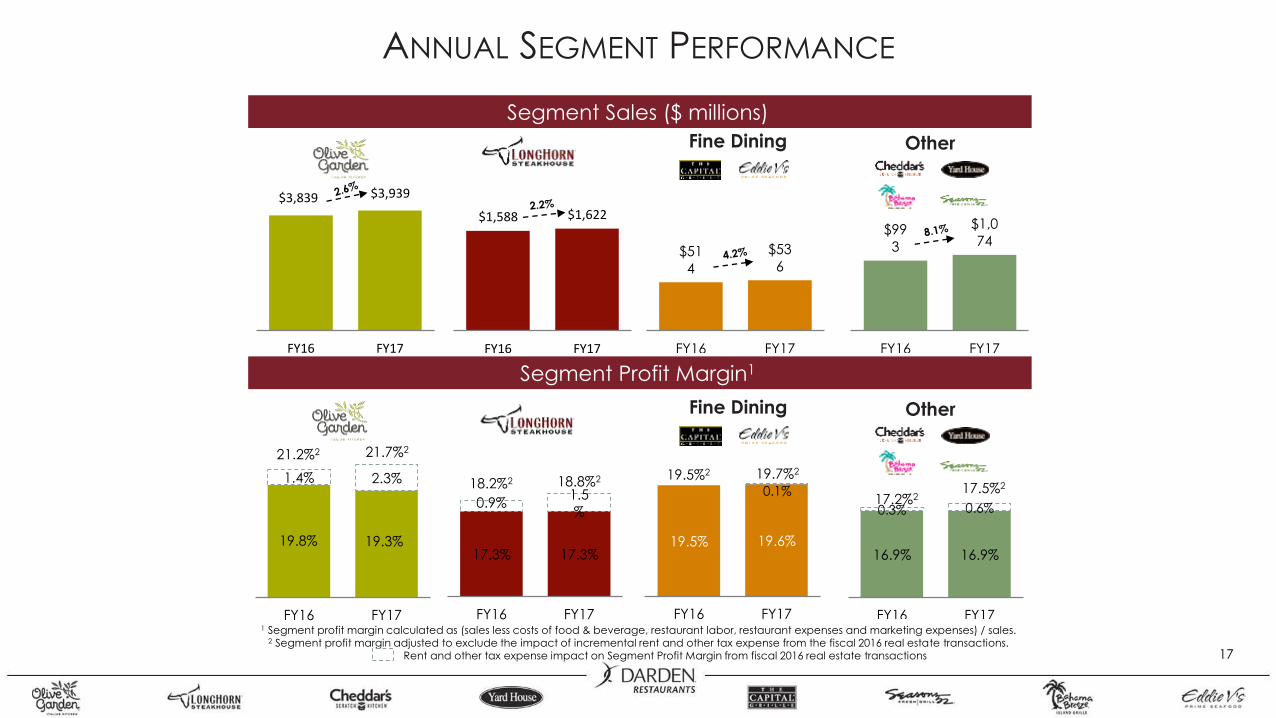
1 Segment profit margin calculated as (sales less costs of food & beverage, restaurant labor, restaurant expenses and marketing expenses) / sales.2 Segment profit margin adjusted to exclude the impact of incremental rent and other tax expense from the fiscal 2016 real estate transactions.
Rent and other tax expense impact on Segment Profit Margin from fiscal 2016 real estate transactions
Segment Sales ($ millions)
Segment Profit Margin1
19.8% 19.3%
1.4% 2.3%
FY16 FY17
17.3% 17.3%
0.9%1.5
%
FY16 FY17
19.5% 19.6%
0.1%
FY16 FY17
16.9% 16.9%
0.3% 0.6%
FY16 FY17
SEGMENT PERFORMANCE
$3,839 $3,939
FY16 FY17
$1,588 $1,622
FY16 FY17
$51
4
$53
6
FY16 FY17
$99
3
$1,0
74
FY16 FY17
21.7%2
18.8%2 19.7%2
17.5%2
21.2%2
18.2%2
17.2%2
19.5%2
ANNUAL SEGMENT PERFORMANCE
OtherFine Dining
OtherFine Dining
17

19
1 Cheddar’s Scratch Kitchen pro forma company owned. Knapp Track data excludes legacy Darden brands. Regional results are a simple average of Knapp regions in which Cheddar’s Scratch
Kitchen operates (excludes California, Pacific Northwest and New England Knapp Track regions). Knapp Track Q4 regional through April.
Fiscal 2017
Same-Restaurant Sales Growth1 Q1 Q2 Q3 Q4
Cheddar’s Scratch Kitchen 0.0% 0.8% (1.9%) 1.9%
Knapp Track (2.1%) (2.8%) (4.2%) (1.5%)
Knapp Track – Regional (2.2%) (3.2%) (4.9%) (1.7%)
HISTORICAL RESTAURANTS AND SAME-RESTAURANT SALES
Note: Cheddar’s Scratch Kitchen restaurant count includes company-owned and franchised restaurants. 2006-2016 based on calendar year and 2017 through May 28.
18
57 62 6780
90106
129
150157 162 163 165
2006 2007 2008 2009 2010 2011 2012 2013 2014 2015 2016 2017
Restaurants

20
Competitor A Competitor B Competitor C Competitor D Competitor E
Onion Rings $5.29 N/A $8.99 $5.99 N/A N/A
Spinach Dip $5.79 $7.32 N/A N/A $8.09 $10.02
Cheeseburger w/fries $8.86 $9.05 $9.99 $8.99 $8.99$9.44
(w/Bacon)
20oz Ribeye$19.99
($1.00/oz)
$18.29 (12oz)
($1.52/oz)
$27.77(22oz)
($1.26/oz)
$25.19(20oz)
($1.26/oz)N/A
$23.09(14oz)
($1.65/oz)
Full Rack of Ribs $16.11 $18.93 $20.27 $19.99 $18.69 $22.80
Grilled Salmon $11.37 $15.08 $18.53 $14.99 $15.25 $18.56
1/2 Rack of Ribs & 6oz
Sirloin$15.11 N/A N/A $17.19 $20.99 N/A
CHEDDAR’S SCRATCH KITCHEN
SUPERIOR PRICE PROPOSITION VS. MAJOR CD CHAINS
19Average of Orlando restaurants as of May 2017
21
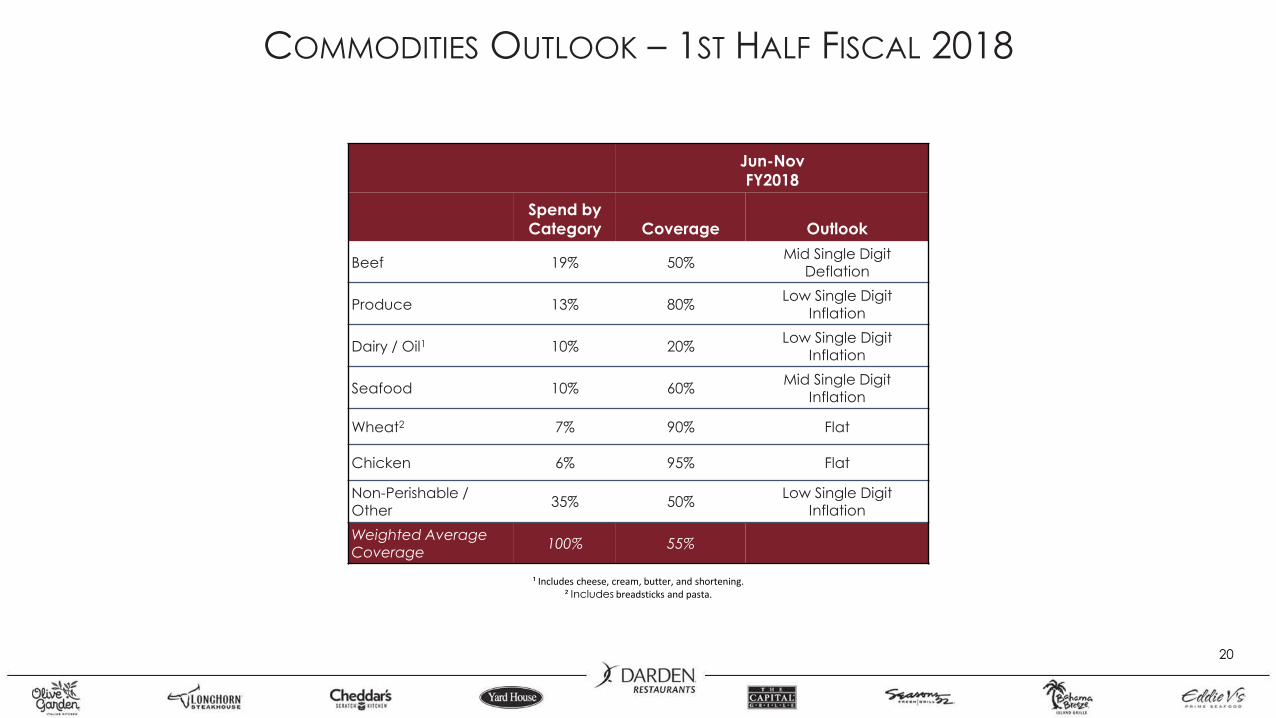
¹ Includes cheese, cream, butter, and shortening.² Includes breadsticks and pasta.
Jun-Nov
FY2018
Spend by
Category Coverage Outlook
Beef 19% 50%Mid Single Digit
Deflation
Produce 13% 80%Low Single Digit
Inflation
Dairy / Oil1 10% 20%Low Single Digit
Inflation
Seafood 10% 60%Mid Single Digit
Inflation
Wheat2 7% 90% Flat
Chicken 6% 95% Flat
Non-Perishable / Other
35% 50%Low Single Digit
Inflation
Weighted Average Coverage
100% 55%
COMMODITIES OUTLOOK – 1ST HALF FISCAL 2018
20

22
Note: The sum of the quarterly Diluted EPS amounts do not total the annual EPS amounts due to the impact of the timing of share repurchases on the weighted average share count.
REPORTED TO ADJUSTED EARNINGS RECONCILIATIONS
21

23
REPORTED TO ADJUSTED EARNINGS RECONCILIATIONS
22

24
REPORTED TO ADJUSTED EBIT MARGIN AND EARNINGS RECONCILIATIONS
23