facebook industry report 2015
TRANSCRIPT


Simply Measured 2015 Facebook Industry Report #SocialAnalytics
TABLE OF CONTENTSIntroduction | 1
Methodology | 2
Facebook Fan Count, Post Count, and Engagement | 3
Facebook Fans and Engagement by Vertical | 5
Response Time | 7
Facebook Content | 8
Adidas Highlight | 9
Vertical Report: Media | 11
Vertical Report: Alcohol | 13
Budweiser Highlight | 15
Vertical Report: Technology | 17
Vertical Report: Automotive | 19
BMW Highlight | 20
Vertical Report: Retail | 22
Vertical Report: Electronics | 24
Vertical Report: Luxury | 26
Vertical Report: Financial Services | 28
Vertical Report: Transportation | 30
Vertical Report: Restaurants | 32
McDonald’s Highlight | 34
Vertical Report: FMCG | 36
Vertical Report: Diversified | 38
3M Highlight | 40
Vertical Report: Apparel | 42
Conclusion | 44
About Simply Measured | 45

Simply Measured 2015 Facebook Industry Report #SocialAnalytics1
IntroductionFacebook is constantly evolving its platform and drawing more apps under its umbrella. In recent days, Facebook has changed the way it counts Page Likes, modified the frequency with which it serves users certain content types, and made Facebook video a dominant content type.
That’s just in the first few months of 2015, which Facebook closed strong with $3.54 billion in revenue, a user count of 1.44 billion monthly (up 3.6% quarter-over-quarter), and 936 million daily users (up 17% year-over-year). Facebook revenue also jumped by 42% year-over-year.
In this industry report, we’ll walk you through the impact of Facebook’s changes and break down trends and activities of the Interbrand 100 vertical by vertical, in hopes that you’ll be able to make more informed decisions on Facebook for your brand moving forward.

Simply Measured 2015 Facebook Industry Report #SocialAnalytics2
MethodologyThis study looks at the Facebook activity of the Interbrand 2014 Best 100 Global Brands.
At the end of each year, Interbrand ranks the top 100 global brands based on several factors, including market, brand, competitor, and financial data.
The Interbrand 100 is an industry standard, and a standard for our Simply Measured network studies. We analyze this list because these companies are the best in the world at building and maintaining a brand, which is a prerequisite to a successful social media strategy.
Statistics cited in this study are based on data from 1/1/15 - 3/31/15.
All data was analyzed using Simply Measured’s industry-leading social media analytics and reporting platform.
This study incorporates both paid and organic content. Since advertising data on Facebook is private, posts are not distinguishable as paid or organic without access to Insights data for each page. This info is available to page admins only.
THIS STUDY ENCOMPASSES:
11,522 posts by 96 brands
1,172,091,468 total fans
13,849 brand responses to 55,773 community posts and 160,681 comments

Simply Measured 2015 Facebook Industry Report #SocialAnalytics3
FACEBOOK FAN COUNT, POST COUNT, AND ENGAGEMENT
Facebook Fan and Post Count Decrease While Engagement Remains Stable Facebook updated Page Like counts to ensure that data is consistent and up-to-date, which had a minor effect on fan count. The number of brand posts dropped moderately between Q4 2014 and Q1 2015, but engagement remained stable. Year-over-year, the Interbrand 100 have seen a dramatic increase in engagement.
Likes are still the most dominant engagement type, but shares increased during Q1 2015 (largely due to photos and videos). This fact, coupled with the news that the Interbrand 100 posted less but received similar levels of engagement, tells us that top brands are focusing on quality, not quantity, and increasing their paid activity. According to Facebook, advertising on the network has increased by 31% in 2015.
Key Findings• After Facebook’s update to Page Like counts, the Interbrand 100’s
total number of fans is down 3% from Q4 2014
• Interbrand 100 brands active on Facebook posted 12% less in Q12015 than they did in Q4 2014
• Interbrand 100 brands received a negligible engagement decreaseof 0.11% between Q4 2014 and Q1 2015, effectively remaining stablein engagement
• Engagement for the Interbrand 100 has risen by 43.5% year-over-year
• The Interbrand 100 received 28% more shares in Q1 2015 than in theprevious quarter
Facebook engagement has remained stable quarter-over-quarter, while the number of brand posts has gone slightly down.
Facebook engagement has grown by 43.5% year-over-year, while the number of brand posts has gone slightly down.
0
2,000
4,000
6,000
8,000
10,000
12,000
14,000
0
20
40
60
80
100
120
Q4 2014 Q1 2015
Posts
Total Engagem
ent
(Millions)
Facebook Engagement: Q4 2014 vs. Q1 2015
Likes Comments Shares Post
0
2,000
4,000
6,000
8,000
10,000
12,000
14,000
0
20
40
60
80
100
120
Q1 2014 Q1 2015
Post
s
Tota
l Eng
agem
ent
(Mill
ions
)
Facebook Engagement: Year-‐Over-‐Year
Likes Comments Shares Post

Simply Measured 2015 Facebook Industry Report #SocialAnalytics4
TakeawayBrands don’t need to post more to increase engagement—they just need to post more strategically and be smart about which content they promote with ad dollars. Expect to see a minor drop in fan count as inactive or spammy fans are weeded out. Facebook photos and videos received the greatest share growth and greatest engagement generally, indicating that Facebook users interact with these posts most often and most deeply.

Simply Measured 2015 Facebook Industry Report #SocialAnalytics5
FACEBOOK FANS AND ENGAGEMENT BY VERTICAL
Media Vertical Smashes Engagement and Business Services Sees Fan Growth The media vertical (Discovery, Disney, MTV, and Thomson-Reuters) saw the greatest engagement during Q1 2015. Most verticals saw a minor dip in fan growth, but business services (Accenture, IBM, Xerox) and restaurants (KFC, McDonalds, Pizza Hut, and Starbucks) saw minor growth, indicating that these are industries to watch for Facebook fan growth in the year to come.
Key Findings• The media vertical posted most often (3,667 in total over the quarter)
and received the most total engagement (49,783,273). This vertical experienced a 15% positive change in engagement per post over the quarter
• Automotive brands (Audi, BMW, Chevrolet, Ford, Harley-Davidson, Honda, Hyundai, Kia, Land Rover, Mercedes-Benz, Nissan, Porsche, Toyota, and Volkswagen) received 37% more engagement in Q1 2015 than in the previous quarter, including 37% more comments, 30% more Likes, and 151% more shares
• Sporting goods brands Adidas and Nike received 247% more engagement and 451% more engagement per post in Q1 2015 than in Q4 2014
• The business services and restaurants verticals received under 1% fan growth—putting them in the upper echelon for fan growth when compared to other verticals during Q1 2015
The media vertical has the most engagement, while business services has the least.
The business services vertical saw the most fan growth, while media saw the greatest fan decline. Both increases and decreases in fanbase over the quarter were pretty minor.
0
10
20
30
40
50
60
Media
Autom
o3ve
Technolog
y
Luxury
Alcohol
Resta
urants
Apparel
Retail
Transporta
3on
Electr
onics
Spor3
ng Go
ods
Financia
l Serv
ices
FMCG
Divers
ified
Energ
y
Beverag
es
Busin
ess Se
rvices
Tota
l Eng
agem
ent (
Millions
)
Q1 2015 Facebook Engagement by Ver3cal
-‐6%
-‐4%
-‐2%
0%
2%
4%
6%
8%
Alcoh
ol
Appa
rel
Autom
o5ve
Beve
rages
Busin
ess Se
rv.
Divers
ified
Electr
onics
Energ
y
Finan
cial Serv
.
FMCG
Luxu
ry
Media
Resta
urants
Retai
l
Sport
. Goo
ds
Tech
nolog
y
Transpo
rt.
Q1 2014 to 2015 Facebook Fan Change

Simply Measured 2015 Facebook Industry Report #SocialAnalytics6
Takeaway Among the Interbrand 100, media brands posted the most and received the most engagement. Sporting goods superstars Adidas and Nike saw incredible engagement increases during Q1 2015, as did the automotive vertical. Fan growth has been negligible in 2015 so far, but the business services and restaurants verticals have done the best job in this category.

Simply Measured 2015 Facebook Industry Report #SocialAnalytics7
RESPONSE TIME
Retail and Automotive Respond Most, Electronics and Media Respond Fastest The retail vertical (Amazon, eBay, and Ikea) and automotive vertical (Audi, BMW, Chevrolet, Ford, Harley-Davidson, Honda, Hyundai, Kia, Land Rover, Mercedes-Benz, Nissan, Porsche, Toyota, and Volkswagen) sent the most responses to fans during Q1 2015.
Electronics (Canon, Nintendo, Panasonic, Philips, and Sony) and media (Discovery, Disney, MTV, and Thomson-Reuters) responded the most quickly, indicating that these are industries that particularly value engaging in dialogue with their fans.
Key Findings• The retail vertical responded most often (2,467 times), while the
sporting goods vertical responded least often, only once
• Electronics brands had the shortest average response time, at four hours, while beverage brands had the longest average response time, at 70 hours
Takeaway The retail and automotive verticals sent the most responses to fans during Q1 2015. The electronics and media verticals responded the most quickly.
The retail vertical responded the most, while the electronics vertical had the best response time.
0 10 20 30 40 50 60 70 80
0
500
1,000
1,500
2,000
2,500
3,000
Electr
onics
Media
Transporta
;on
Resta
urants
Busin
ess Se
rvices
Alcohol
Technolog
y
Energ
y
Apparel
Financia
l Serv
ices
Divers
ified
Retail
Autom
o;ve
FMCG
Luxury
Beverag
es Resp
onse
Tim
e (M
inut
es)
Tota
l Adm
in Res
pons
es
Interbrand 100 Response Times by Ver;cal
Total Admin Responses Average Post Response Time

Simply Measured 2015 Facebook Industry Report #SocialAnalytics8
FACEBOOK CONTENT
Links and Photos Drive Most Engagement, Photo and Video Sharing IncreasesLinks and photos are the most successful content types for the Interbrand 100 when it comes to driving engagement on Facebook, but Facebook videos are an incredibly promising and viral-tending content type: shares of Facebook videos increased by 43% in just one quarter.
Key Findings• Engagement on videos went up 8% during Q1 2015, with the bulk of
that increase coming from a 43% increase in shares
• Videos were the only content type that the Interbrand 100 increased use of, with a 2% change from the previous quarter
• Engagement on photos increased by 6%, with the bulk of that increase coming from a 53% increase in shares
• Engagement on status updates went down a whopping 72%, which is largely due to brands posting fewer status updates—40% less than the previous quarter
Takeaway Links and photos dominate when it comes to overall engagement, but video and photos are the post types to keep an eye on if you want your content to spread more widely on Facebook. Top brands are investing less in status updates and yielding less engagement from this type of post.
0
200
400
600
800
1,000
1,200
1,400
1,600
0
2
4
6
8
10
12
Q4 Q1
Post
s
Tota
l Eng
agem
ent (
Mill
ions
)
Video Engagement On Facebook Quarter-‐Over-‐Quarter
Likes Comments Shares Posts
Video engagement has risen quarter-over-quarter to match an increase in video posts among the Interbrand 100. Facebook videos did not exist in Q1 2014, which is why a YOY comparison is not pictured on here.

Simply Measured 2015 Facebook Industry Report #SocialAnalytics11
FACEBOOK VIDEOS
Adidas Sees a Massive Uptick in Facebook Video EngagementAdidas is a notable example of the impressive engagement that videos can drive for brands on Facebook.
Adidas posted 86% more videos on Facebook in Q1 2015 than they did the previous quarter.
Those videos received 1,487% more comments, 9,398% more Likes, and 9,041% more shares for a total video engagement boost of 8,858%--all in the first three months of 2015.
Tactics• Riveting, motivational content in a movie trailer format
• Tagging and driving support from athlete partners
• Displaying inspirational, swagger-heavy words from videos in captions to build interest
• Reinforcing brand connection to hip hop
0
2
4
6
8
10
12
14
0.0
0.1
0.2
0.3
0.4
0.5
0.6
0.7
Q4 Q1
Posts
Total Engagem
ent (Millions)
Adidas Video Engagement Q4 2014 vs. Q1 2015
Likes Comments Shares Posts
Adidas’s video engagement grew by 8,858% in Q1 2015.

Simply Measured 2015 Facebook Industry Report #SocialAnalytics12
Takeaway Adidas boosted its Facebook engagement by posting videos more frequently and more strategically. By devoting resources to creating compelling, entertaining, and motivational video content designed to hit multiple target audiences and optimize celebrity partnerships, Adidas grabbed the attention of existing fans and audiences it previously didn’t touch.
This was Adidas’s most engaging video in Q1 2015. It received 17,726,622 views, 593,343 Likes, 6,261 comments, and 25,913 shares.

Simply Measured 2015 Facebook Industry Report #SocialAnalytics11
VERTICAL REPORT: MEDIA
Still on Top Despite a Slight Engagement Decrease The media brands represented in the Interbrand 100 are Discovery, Disney, MTV, and Thomson-Reuters. As previously mentioned, media brands posted the most and received the most engagement during Q1 2015.
Media brands were most successful with links as a content type during Q1 2015. MTV posted substantially more than any other brand in this vertical.
Key Findings• Media brands posted 16% less in Q1 2015 than in Q4 2014
• Media brands received the most engagement from links, coming in at 32,364,787 in total engagement
• MTV posted the most by a long shot, with 2,275 posts for the quarter as compared to Discovery’s 714, Disney’s 347, and Thomson Reuters’ 331
• Media brands received 654,992 comments in Q1 2015, 32% fewer than they received in Q4 2014
• Media brands received 46,804,683 Likes in Q1 2015, 2% fewer than they received in Q4 2014
• Media brands received 2,323,598 shares in Q1 2015, 26% fewer shares than they received in Q4 2014
• Media brands decreased 4% in total engagement, coming in at 49,783,273 in total engagement
0 500 1,000 1,500 2,000 2,500 3,000 3,500 4,000 4,500 5,000
44
45
46
47
48
49
50
51
52
53
Q4 2014 Q1 2015
Post
s
Tota
l Eng
agem
ent (
Mill
ions
)
Media VerAcal: Q4 2014 vs. Q1 2015 Engagement
Likes Comments Shares Posts
The media vertical’s engagement went down 4% in Q1 2015.
The media vertical’s engagement increased substantially between Q1 2014 and Q1 2015, as did number of brand posts.
0
500
1,000
1,500
2,000
2,500
3,000
3,500
4,000
0
10
20
30
40
50
60
Q1 2014 Q1 2015
Post
s
Tot
al E
ngag
emen
t (M
illio
ns)
Media Ver>cal: Year-‐Over-‐Year Engagement
Likes Comments Shares Posts

Simply Measured 2015 Facebook Industry Report #SocialAnalytics12
Takeaway Though they are the top vertical for engagement, media brands experienced a decrease in engagement quarter-over-quarter. However, both posting frequency and engagement have increased year-over-year. MTV posts much more than any brand in the media category, but still experiences substantial engagement. Links are the most successful content type for this vertical.
Simply Measured 2015 Facebook Industry Report #SocialAnalytics13
VERTICAL REPORT: ALCOHOL
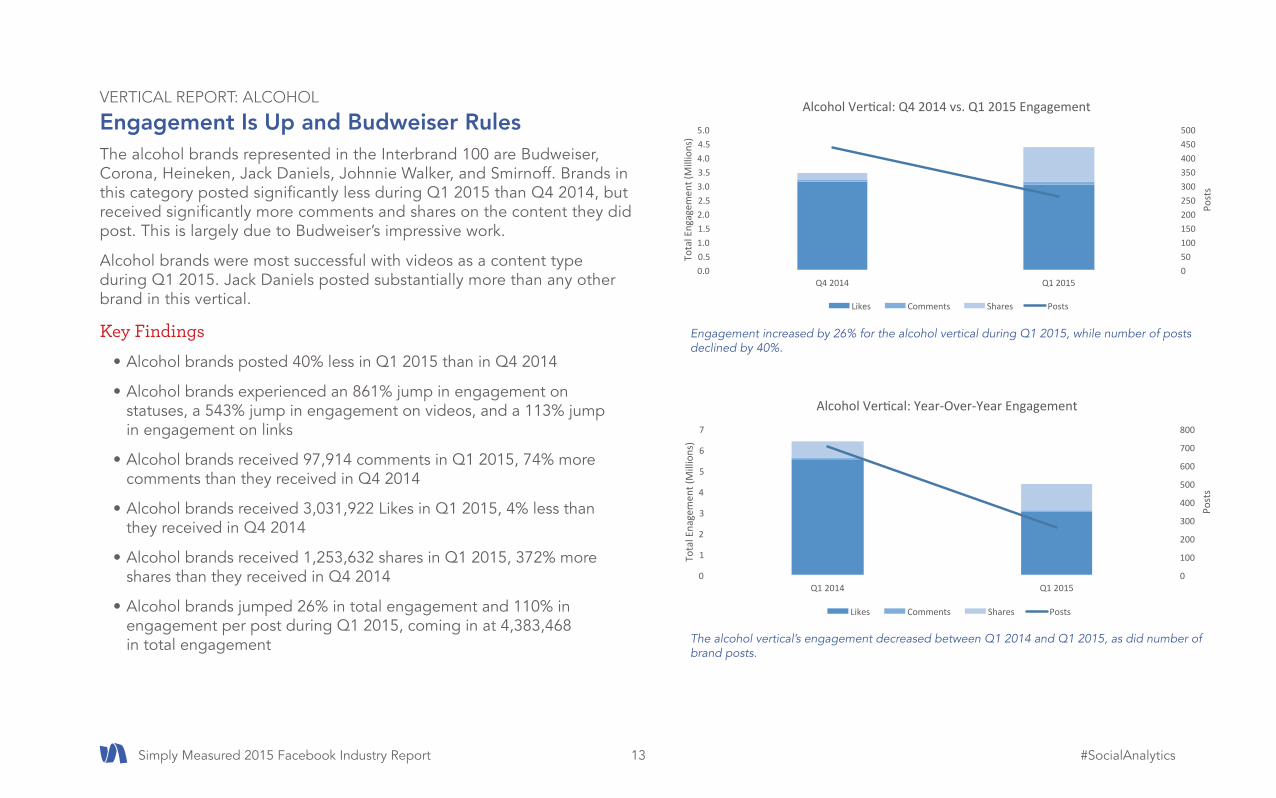
Engagement Is Up and Budweiser RulesThe alcohol brands represented in the Interbrand 100 are Budweiser, Corona, Heineken, Jack Daniels, Johnnie Walker, and Smirnoff. Brands in this category posted significantly less during Q1 2015 than Q4 2014, but received significantly more comments and shares on the content they did post. This is largely due to Budweiser’s impressive work.
Alcohol brands were most successful with videos as a content type during Q1 2015. Jack Daniels posted substantially more than any other brand in this vertical.
Key Findings• Alcohol brands posted 40% less in Q1 2015 than in Q4 2014
• Alcohol brands experienced an 861% jump in engagement on statuses, a 543% jump in engagement on videos, and a 113% jump in engagement on links
• Alcohol brands received 97,914 comments in Q1 2015, 74% more comments than they received in Q4 2014
• Alcohol brands received 3,031,922 Likes in Q1 2015, 4% less than they received in Q4 2014
• Alcohol brands received 1,253,632 shares in Q1 2015, 372% more shares than they received in Q4 2014
• Alcohol brands jumped 26% in total engagement and 110% in engagement per post during Q1 2015, coming in at 4,383,468 in total engagement
0 50 100 150 200 250 300 350 400 450 500
0.0 0.5 1.0 1.5 2.0 2.5 3.0 3.5 4.0 4.5 5.0
Q4 2014 Q1 2015
Post
s
Tota
l Eng
agem
ent (
Mill
ions
)
Alcohol Ver?cal: Q4 2014 vs. Q1 2015 Engagement
Likes Comments Shares Posts
0
100
200
300
400
500
600
700
800
0
1
2
3
4
5
6
7
Q1 2014 Q1 2015
Post
s
Tota
l Ena
gem
ent (
Mill
ions
)
Alcohol VerAcal: Year-‐Over-‐Year Engagement
Likes Comments Shares Posts
Engagement increased by 26% for the alcohol vertical during Q1 2015, while number of posts declined by 40%.
The alcohol vertical’s engagement decreased between Q1 2014 and Q1 2015, as did number of brand posts.

Simply Measured 2015 Facebook Industry Report #SocialAnalytics14
Takeaway Alcohol brands experienced higher engagement quarter-over-quarter but lower engagement year-over-year. They are posting less, but seeing greater reward from better-targeted content. Much of the alcohol vertical’s improved engagement in the early part of 2015 was due to Budweiser’s admirable efforts.

Simply Measured 2015 Facebook Industry Report #SocialAnalytics17
VERTICAL REPORT: ALCOHOL
Budweiser Wins Engagement Growth with Super Bowl Videos and Fan LoveBudweiser was a particularly high-growth brand in the alcohol vertical during Q1 2015, decreasing its posting cadence by 32% but making the content it did post count, like the now-famous #BestBuds Super Bowl commercial.
In Q1 2015, Budweiser received 335% more comments, 116% more Likes, and 1,901% more shares than it did in Q4 2014 for a total engagement boost of 242%.
Budweiser is well known in the B2C category for its compelling video content, and it’s reaping the rewards. It’s no surprise that two out of Budweiser’s three most engaging posts during Q1 2015 were videos.
Key Findings• Longer videos that pulled at the heart strings and suavely avoided the
sales pitch
• Shorter videos that used humor to grab shares and attention
• Content that activated Budweiser’s fiercely loyal fan base to show their love—and brand response that kept the momentum going
Budweiser’s most engaging post in Q1 2015 was this video, which received over 30 million views, 687,606 Likes, 43,999 comments, and over 1 million shares.

Simply Measured 2015 Facebook Industry Report #SocialAnalytics18
Takeaway Budweiser boosted its Facebook engagement by posting less frequently but more strategically. By creating both compelling, everybody-loves-it video content and content for people who are already fans, Budweiser covered all its bases and found enviable engagement growth.
Budweiser’s third most engaging post in Q1 2015 was this post, which received 84,000 Likes, 2,254 comments, and 3,252 shares.

Simply Measured 2015 Facebook Industry Report #SocialAnalytics17
VERTICAL REPORT: TECHNOLOGY
Technology Brands Post More, Drive More EngagementThe technology brands represented in the Interbrand 100 are Adobe, Cisco, Facebook, Google, HP, Huawei, Intel, Microsoft, Nokia, Oracle, Samsung, and SAP. Brands in this category posted more during Q1 2015 than Q4 2014, and received an equal engagement increase in return.
There was a wide range of activity and engagement in this category. For instance, Cisco posted the most with 271 posts, while Facebook only posted 20 times. Facebook received almost 6 million in total engagement, while Huawei’s total engagement hovered around 2,000.
Key Findings• Technology brands posted 9% more in Q1 2015 than in Q4 2014
• Technology brands received 193,409 comments in Q1 2015, 4% less than they received in Q4 2014
• Technology brands received 8,594,171 Likes in Q1 2015, 8% more than they received in Q4 2014
• Technology brands received 549,022 shares in Q1 2015, 51% more shares than they received in Q4 2014
• Technology brands jumped 9% in total engagement, coming in at 9,336,602 in total engagement
0
200
400
600
800
1,000
1,200
1,400
7.0
7.5
8.0
8.5
9.0
9.5
Q4 2014 Q1 2015
Post
s
Tota
l Ena
gem
ent (
Mill
ions
)
Technology VerCcal: Q4 2014 vs. Q1 2015 Enagement
Likes Comments Shares Posts
0
200
400
600
800
1,000
1,200
1,400
1,600
7.6 7.8 8.0 8.2 8.4 8.6 8.8 9.0 9.2 9.4 9.6
Q1 2014 Q1 2015
Post
s
Tota
l Eng
aem
ent (
Mill
ions
)
Technology VerCcal: Year-‐Over-‐Year Engagement
Likes Comments Shares Posts
Engagement increased by 9% for the technology vertical during Q1 2015. The number of posts by the Interbrand 100 increased by 9%, as well.
Engagement increased for the technology vertical year-over-year, with shares overtaking Likes. The number of posts by the technology vertical declined during this year.

Simply Measured 2015 Facebook Industry Report #SocialAnalytics18
Takeaway Technology brands experienced higher engagement quarter-over-quarter but lower engagement year-over-year. There is a wide spread in this category between brands that are posting frequently and driving a ton of engagement and brands that are doing the opposite. This category’s content is experiencing impressive growth in shares on Facebook.

Simply Measured 2015 Facebook Industry Report #SocialAnalytics19
VERTICAL REPORT: AUTOMOTIVE
Growth in Every Category, Except Post CountThe automotive brands represented in the Interbrand 100 are Audi, BMW, Chevrolet, Ford, Harley-Davidson, Honda, Hyundai, Kia, Land Rover, Mercedes-Benz, Nissan, Porsche, Toyota, and Volkswagen. The number of posts within the automotive vertical stayed exactly the same ias the previous quarter, but engagement increased significantly, suggesting that these brands are getting better at creating content which appeals to their fans.
Key Findings• Automotive brands posted 0% more in Q1 2015 than in Q4 2014
• Automotive brands received 317,629 comments in Q1 2015, 37% more than they received in Q4 2014
• Automotive brands received 25,439,759 Likes in Q1 2015, 30% more than they received in Q4 2014
• Automotive brands received 3,039,788 shares in Q1 2015, 151% more shares than they received in Q4 2014
• Automotive brands jumped 37% in total engagement, coming in at 28,797,176 in total engagement
Takeaway Automotive brands are experiencing higher engagement quarter-over-quarter and year-over-year. Automotive brand content is experiencing impressive growth in shares on Facebook. This is all despite the fact that these brands have not increased their posting cadence.
0 200 400 600 800 1,000 1,200 1,400 1,600 1,800 2,000
0
5
10
15
20
25
30
35
Q4 2014 Q1 2015
Post
s
Tota
l Ena
gem
ent (
Mill
ions
)
Automo>ve Ver>cal: Year-‐Over-‐Year Engagement
Likes Comments Shares Posts
0
500
1,000
1,500
2,000
2,500
0
5
10
15
20
25
30
35
Q1 2014 Q1 2015
Post
s
Tota
l Eng
agem
ent (
Mill
ions
)
Automo<ve Ver<cal: Year-‐Over-‐Year Engagement
Likes Comments Shares Posts
Engagement increased by 37% for the automotive vertical during Q1 2015. The number of posts by the automotive vertical remained stable.
Engagement increased for the automotive vertical year-over-year. The number of posts by the automotive vertical decreased.

Simply Measured 2015 Facebook Industry Report #SocialAnalytics22
VERTICAL REPORT: AUTOMOTIVE
BMW Sees Hefty Engagement Spike via Well-Targeted Content In the high-performing automotive vertical, BMW is especially notable.
BMW was a particularly high-growth brand during Q1 2015, increasing its posting cadence by 113% and making the content it did post count with 167% more comments, 152% more Likes, and 602% more shares than it had in Q4 2014 for a total engagement boost of 180%.
BMW posted 100% more links than in Q4 2014, 117% more photos, and 57% more videos. Photos received the bulk of engagement: 11,398,635 of BMW’s 11,593,587 total engagement came from photos.
This success is no surprise, since BMW fans are known for being incredibly loyal and excitable about new car releases and product features, most of which are revealed and reveled in with gorgeous visual content on BMW’s Facebook page.
Key Findings• Gratitude towards fans
• Facebook photo albums
• Announcement of presence on another social network
• Pairing a beautiful product with beautiful scenery
• Interior dashboard shots
0
10,000
20,000
30,000
40,000
50,000
60,000
0
2
4
6
8
10
12
14
Q4 2014 Q1 2015
Engagemen
t Per Post
Total Engagem
ent (Millions)
BMW Engagement: Q4 2014 vs. Q1 2015
Likes Comments Shares Engagement Per Post
Engagement increased for the automotive vertical year-over-year. The number of posts by the automotive vertical decreased.

Simply Measured 2015 Facebook Industry Report #SocialAnalytics23
Takeaway By playing to their audience with sleek visuals of their gorgeous cars (and posting more frequently), BMW boosted its Facebook engagement and kept fans’ attention.
BMW’s most engaging post in Q1 2015 was this photo montage, which received 515,374 Likes, 7,468 comments, and 75,547 shares.

Simply Measured 2015 Facebook Industry Report #SocialAnalytics22
VERTICAL REPORT: RETAIL
Retail Fans Increase Video and Link Shares, Engagement Climbs YOYThe retail brands represented in the Interbrand 100 are Amazon, eBay, and Ikea. These brands posted less in Q1 2015 and received less engagement in almost every category, except for shares, which grew exponentially.
Retail brands posted more videos in Q1 2015 than in Q4 2014, and brands within this category responded most often to fans. eBay was especially successful in this vertical.
Key Findings• Retail brands posted 27% less in Q1 2015 than in Q4 2014, but posted
13% more videos
• Retail brands’ video and link posts received 154% and 211% more engagement, respectively
• Retail brands received 226,927 comments in Q1 2015, 79% less than they received in Q4 2014
• Retail brands received 1,399,602 Likes in Q1 2015, 1% more than they received in Q4 2014
• Retail brands received 213,507 shares in Q1 2015, 109% more shares than they received in Q4 2014
• Retail brands decreased 29% in total engagement, coming in at 1,840,036 in total engagement
• eBay posted 17% less, but received 12% more comments, 252% more Likes, and 295% more shares, for a total of 206% more engagement
0 100 200 300 400 500 600 700 800 900 1,000
0.0
0.5
1.0
1.5
2.0
2.5
3.0
Q4 2014 Q1 2015
Post
s
Tota
l Eng
agem
ent (
Mill
ions
)
Retail VerBcal: Q4 2014 vs. Q1 2015 Engagement
Likes Comments Shares Posts
0
100
200
300
400
500
600
700
800
900
0.0
0.5
1.0
1.5
2.0
2.5
Q1 2014 Q1 2015
Post
s
Tota
l Eng
agem
ent (
Mill
ions
)
Retail VerAcal: Year-‐Over-‐Year Engagement
Likes Comments Shares Posts
Engagement decreased by 29% for the retail vertical during Q1 2015, with Likes overtaking comments. The number of brand posts decreased by 27%.
Engagement decreased for the retail vertical year-over-year. The number of brand posts decreased, as well.

Simply Measured 2015 Facebook Industry Report #SocialAnalytics23
Takeaway Retail brands have experienced lower engagement quarter-over-quarter, but higher engagement year-over-year. Retail brands excel with links and videos, and eBay does especially well among its peers in this vertical. This vertical responds to fans the most.

Simply Measured 2015 Facebook Industry Report #SocialAnalytics24
VERTICAL REPORT: ELECTRONICS
Engagement Grows for Links and Statuses, Video Shares Continue to Rise The electronics brands represented in the Interbrand 100 are Canon, Nintendo, Panasonic, Philips, and Sony. This vertical posted less in Q1 2015 and received less engagement overall, except for shares. Links and statuses experienced the most engagement growth.
This vertical also has the shortest response time to fans among all the other verticals in this study.
Key Findings• Electronics brands posted 13% less in Q1 2015 than in Q4 2014, but
posted 4% more videos
• Electronics brands’ link and status posts received 35% and 27% more engagement, respectively
• Electronics brands received 68,166 comments in Q1 2015, 9% less than they received in Q4 2014
• Electronics brands received 648,240 Likes in Q1 2015, 53% less than they received in Q4 2014
• Electronics brands received 100,948 shares in Q1 2015, 10% more shares than they received in Q4 2014
• Electronics brands decreased 47% in total engagement, coming in at 817,354 in total engagement
0 50 100 150 200 250 300 350 400 450 500
0
0.2
0.4
0.6
0.8
1
1.2
1.4
1.6
1.8
Q4 2014 Q1 2015
Post
s
Tota
l Eng
agem
ent (
Mill
ions
)
Electronics Ver?cal: Q4 2014 vs. Q1 2015
Likes Comments Shares Posts
0
50
100
150
200
250
300
350
400
450
0
0.1
0.2
0.3
0.4
0.5
0.6
0.7
0.8
0.9
Q1 2014 Q1 2015
Post
s
Tota
l Eng
agem
ent (
Mill
ions
)
Electronics VerAcal: Year-‐Over-‐Year Engagement
Likes Comments Shares Posts
Engagement decreased 47% for the electronics vertical during Q1 2015. The number of brand posts decreased by 13%.
Engagement increased substantially for the electronics vertical year-over-year. The number of brand posts increased substantially, as well.

Simply Measured 2015 Facebook Industry Report #SocialAnalytics25
Takeaway Electronics brands posted less and experienced lower engagement quarter-over-quarter, but the opposite was true from a year-over-year view. Electronics brands are posting photos and videos most, but are seeing the most engagement growth from links and statuses, often from posts related to new product releases and features. They respond more speedily to Facebook comments than any other vertical in this study.
Simply Measured 2015 Facebook Industry Report #SocialAnalytics26
VERTICAL REPORT: LUXURY
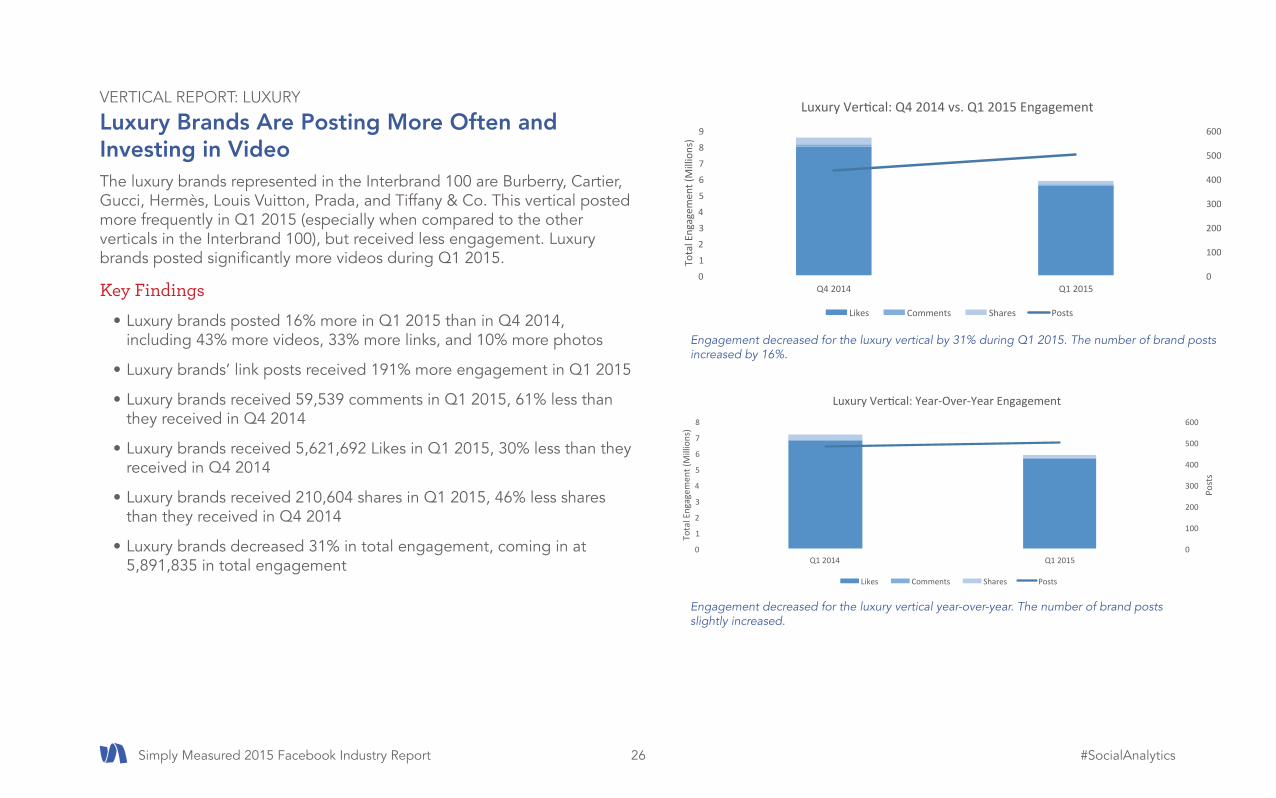
Luxury Brands Are Posting More Often and Investing in Video The luxury brands represented in the Interbrand 100 are Burberry, Cartier, Gucci, Hermès, Louis Vuitton, Prada, and Tiffany & Co. This vertical posted more frequently in Q1 2015 (especially when compared to the other verticals in the Interbrand 100), but received less engagement. Luxury brands posted significantly more videos during Q1 2015.
Key Findings• Luxury brands posted 16% more in Q1 2015 than in Q4 2014,
including 43% more videos, 33% more links, and 10% more photos
• Luxury brands’ link posts received 191% more engagement in Q1 2015
• Luxury brands received 59,539 comments in Q1 2015, 61% less than they received in Q4 2014
• Luxury brands received 5,621,692 Likes in Q1 2015, 30% less than they received in Q4 2014
• Luxury brands received 210,604 shares in Q1 2015, 46% less shares than they received in Q4 2014
• Luxury brands decreased 31% in total engagement, coming in at 5,891,835 in total engagement
0
100
200
300
400
500
600
0
1
2
3
4
5
6
7
8
9
Q4 2014 Q1 2015
Tota
l Eng
agem
ent (
Mill
ions
)
Luxury VerBcal: Q4 2014 vs. Q1 2015 Engagement
Likes Comments Shares Posts
0
100
200
300
400
500
600
0
1
2
3
4
5
6
7
8
Q1 2014 Q1 2015
Posts
Total E
ngag
emen
t (Millions
)
Luxury VerBcal: Year-‐Over-‐Year Engagement
Likes Comments Shares Posts
Engagement decreased for the luxury vertical by 31% during Q1 2015. The number of brand posts increased by 16%.
Engagement decreased for the luxury vertical year-over-year. The number of brand posts slightly increased.

Simply Measured 2015 Facebook Industry Report #SocialAnalytics27
Takeaway Luxury brands have posted more often and experienced lower engagement quarter-over-quarter. From a year-over-year view, posting frequency has just about flatlined and engagement has slightly decreased. Luxury brands are posting links and videos most, but are seeing the most engagement growth from links by far, ostensibly thanks to product links.

Simply Measured 2015 Facebook Industry Report #SocialAnalytics28
VERTICAL REPORT: FINANCIAL SERVICES
Engagement Is Down, Photos Are Used Most, and Links Work Best The financial services brands represented in the Interbrand 100 are American Express, AXA, Citi, J.P. Morgan, MasterCard, Santander, and Visa. This vertical posted slightly less frequently in Q1 2015 and received less engagement. Financial services brands were most successful with links as a content type during Q1 2015.
Key Findings• Financial services brands posted 2% less in Q1 2015 than in Q4 2014,
including 17% more links, 13% fewer photos, 100% more statuses, and 9% fewer videos
• Financial services brands’ link posts received 28% more engagement in Q1 2015 than in Q4 2014
• Financial services brands received 15,920 comments in Q1 2015, 19% fewer than they received in Q4 2014
• Financial services brands received 586,105 Likes in Q1 2015, 20% fewer than they received in Q4 2014
• Financial services brands received 45,111 shares in Q1 2015, 55% fewer shares than they received in Q4 2014
• Financial services brands decreased 24% in total engagement, coming in at 648,136 in total engagement
0
100
200
300
400
500
600
700
0
0.1
0.2
0.3
0.4
0.5
0.6
0.7
0.8
0.9
Q4 2014 Q1 2015
Post
s
Tota
l Eng
agem
ent (
Mill
ions
)
Financial VerBcals: Q4 2014 vs Q1 2015
Likes Comments Shares Posts
0
100
200
300
400
500
600
700
800
0
0.2
0.4
0.6
0.8
1
1.2
1.4
1.6
Q1 2014 Q1 2015
Post
s
Tota
l Eng
agem
ent (
Mill
ions
)
Financial VerAcals: Year-‐Over-‐Year Engagement
Likes Comments Shares Posts
Engagement decreased for the financial services vertical by 24% during Q1 2015. The number of brand posts decreased by 2%.
Engagement decreased for the financial services vertical year-over-year. The number of brand posts decreased, as well.

Simply Measured 2015 Facebook Industry Report #SocialAnalytics29
Takeaway Financial services brands continue the struggle to carve out solid, highly engaging identities on Facebook. Financial services brands are posting links and photos most, but are seeing the most engagement growth from links by far.

Simply Measured 2015 Facebook Industry Report #SocialAnalytics30
VERTICAL REPORT: TRANSPORTATION
DHL, FedEx, and UPS Increase Engagement and Posting Year-Over-YearThe transportation brands represented in the Interbrand 100 are DHL, FedEx, and UPS. This vertical posted less frequently in Q1 2015 and received less engagement. However, both posting frequency and engagement were up year-over-year.
Transportation brands saw the most engagement with photos as a content type during Q1 2015, but saw the most growth in engagement from links. This vertical also posted more videos in Q1 2015 than it did in Q4 2014.
Key Findings• Transportation brands posted 12% less in Q1 2015 than in Q4 2014,
but posted 10% more videos
• Transportation brands’ link posts received 95% more engagement in Q1 2015 than in Q4 2014
• Transportation brands received 26,963 comments in Q1 2015, 29% fewer than they received in Q4 2014
• Transportation brands received 773,674 Likes in Q1 2015, 43% fewer than they received in Q4 2014
• Transportation brands received 52,570 shares in Q1 2015, 52% fewer shares than they received in Q4 2014
• Transportation brands decreased 44% in total engagement, coming in at 853,207 in total engagement
0
50
100
150
200
250
300
0.0
0.2
0.4
0.6
0.8
1.0
1.2
1.4
1.6
Q4 2014 Q1 2015
Post
s
Tota
l Eng
agem
ent (
Mill
ions
)
Transporta>on Ver>cal: Q4 2014 vs. Q1 2015 Engagement
Likes Comments Shares Posts
0
50
100
150
200
250
300
0.0
0.1
0.2
0.3
0.4
0.5
0.6
0.7
0.8
0.9
Q1 2014 Q1 2015
Post
s
Tota
l Eng
agem
ent (
Mill
ions
)
Mill
ions
Transporta@on Ver@cal: Year-‐Over-‐Year Engagement
Likes Comments Shares Posts
Engagement decreased for the transportation vertical by 44% during Q1 2015. The number of brand posts decreased by 12%.
Engagement increased substantially for the transportation vertical by 31% year-over-year. The number of brand posts increased substantially, too.

Simply Measured 2015 Facebook Industry Report #SocialAnalytics31
Takeaway Transportation brands experienced a decrease in engagement from Q4 2014, but are climbing in engagement year-over-year. The transportation vertical drives the most engagement from photos, but this vertical’s links are growing in popularity with Facebook users. Transportation brands are beginning to invest in video, too.

Simply Measured 2015 Facebook Industry Report #SocialAnalytics32
VERTICAL REPORT: RESTAURANTS
Posting More, Coming Down Off the Q4 2014 Engagement HighRestaurant brands represented in the Interbrand 100 are KFC, McDonald’s, Pizza Hut, and Starbucks. This vertical posted more frequently in Q1 2015 and received less engagement, which is no surprise since Q4 2014 was such a massively successful quarter engagement-wise for this vertical.
Restaurant brands were most successful with photos as a content type during Q1 2015, and are making a big investment in video posts.
Key Findings• Restaurant brands posted 24% more in Q1 2015 than in Q4 2014,
including 50% fewer links, 35% more photos, 100% more statuses, and 65% more videos
• Restaurant brands’ link posts received 177% more shares in Q1 2015 than in Q4 2014
• Restaurant brands received 59,629 comments in Q1 2015, 35% fewer than they received in Q4 2014
• Restaurant brands received 3,384,352 Likes in Q1 2015, 28% fewer than they received in Q4 2014
• Restaurant brands received 93,804 shares in Q1 2015, 50% fewer shares than they received in Q4 2014
• Restaurant brands decreased 29% in total engagement, coming in at 3,537,785 in total engagement
0
100
200
300
400
500
600
700
0
0.1
0.2
0.3
0.4
0.5
0.6
0.7
0.8
0.9
Q4 2014 Q1 2015
Post
s
Tota
l Eng
agem
ent (
Mill
ions
)
Resturant VerBcal: Q4 2014 vs. Q1 2015 Engagement
Likes Comments Shares Posts
0
100
200
300
400
500
600
700
800
0
0.2
0.4
0.6
0.8
1
1.2
1.4
1.6
Q1 2014 Q1 2015
Post
s
Tota
t Eng
agem
ent (
Mill
ions
)
Resturant VerAcal: Year-‐Over-‐Year Engagement
Likes Comments Shares Posts
Engagement decreased for the restaurant vertical by 29% during Q1 2015. The number of brand posts increased by 25%.
Engagement decreased for the restaurant vertical year-over-year. The number of brand posts decreased, as well.

Simply Measured 2015 Facebook Industry Report #SocialAnalytics33
Takeaway Restaurant brands experienced such respectable engagement in Q4 2014 that their engagement numbers were understandably less in Q1 2015. Despite this, the restaurant vertical still has one of the highest levels of engagement of any other vertical in the Interbrand 100. Restaurant brands are posting photos most by far, but are beginning to solidly invest in video, too.

Simply Measured 2015 Facebook Industry Report #SocialAnalytics36
VERTICAL REPORT: RESTAURANTS
Why Is McDonald’s the Only Brand Growing Engagement in Its Vertical? McDonald’s was a particularly high-growth brand in the restaurant vertical during Q1 2015, increasing its posting cadence by 104%, receiving 9% more Likes and 54% more shares for a total engagement boost of 7%.
McDonald’s increased its video posting by 429% in Q1 2015, and reaped the rewards with a 94% increase in video comments, 140% increase in Likes on videos, and 9,906% increase in video shares. In fact, McDonald’s top post for the quarter was a video.
Key Findings• The multi-channel “Moments of Joy” campaign, which ran in 24 cities
in 24 countries on March 24 and included on- and off-line events
• Building on the excitement around popular holidays
• Showcasing photos of sweet treats
McDonald’s most engaging post in Q1 2015 was this video, which received 153,326 views, 1,070 Likes, 52 comments, and 1,372 shares.

Simply Measured 2015 Facebook Industry Report #SocialAnalytics37
Takeaway McDonald’s boosted its Facebook engagement by posting more frequently, but also by posting as a part of larger campaigns and with the intention of directing Facebook users to more information about those campaigns. McDonald’s also scored with simple yet effective images of their sweet treats, especially the celebratory ones.
McDonald’s second most engaging post in Q1 2015 was this one, which received 2,220 Likes, 53 comments, and 39 shares.
Simply Measured 2015 Facebook Industry Report #SocialAnalytics36
VERTICAL REPORT: FMCG
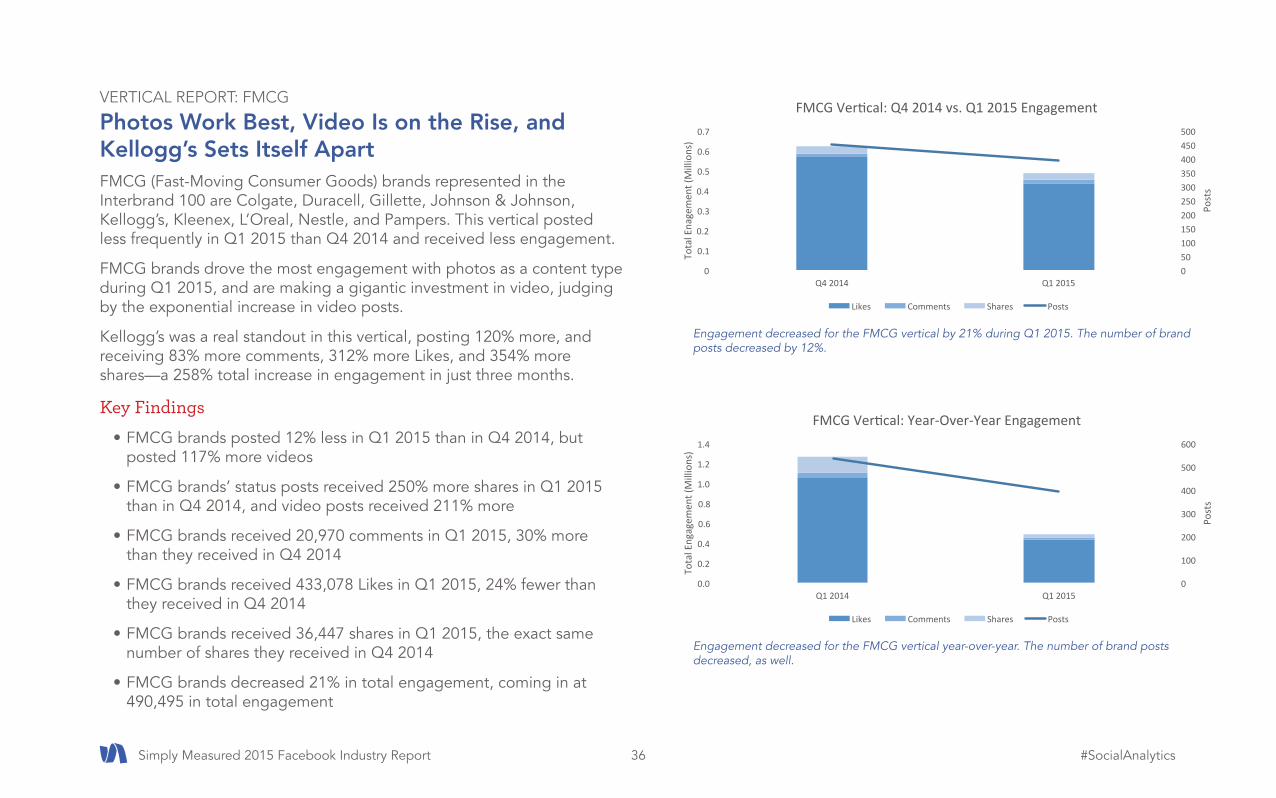
Photos Work Best, Video Is on the Rise, and Kellogg’s Sets Itself ApartFMCG (Fast-Moving Consumer Goods) brands represented in the Interbrand 100 are Colgate, Duracell, Gillette, Johnson & Johnson, Kellogg’s, Kleenex, L’Oreal, Nestle, and Pampers. This vertical posted less frequently in Q1 2015 than Q4 2014 and received less engagement.
FMCG brands drove the most engagement with photos as a content type during Q1 2015, and are making a gigantic investment in video, judging by the exponential increase in video posts.
Kellogg’s was a real standout in this vertical, posting 120% more, and receiving 83% more comments, 312% more Likes, and 354% more shares—a 258% total increase in engagement in just three months.
Key Findings• FMCG brands posted 12% less in Q1 2015 than in Q4 2014, but
posted 117% more videos
• FMCG brands’ status posts received 250% more shares in Q1 2015 than in Q4 2014, and video posts received 211% more
• FMCG brands received 20,970 comments in Q1 2015, 30% more than they received in Q4 2014
• FMCG brands received 433,078 Likes in Q1 2015, 24% fewer than they received in Q4 2014
• FMCG brands received 36,447 shares in Q1 2015, the exact same number of shares they received in Q4 2014
• FMCG brands decreased 21% in total engagement, coming in at 490,495 in total engagement
0 50 100 150 200 250 300 350 400 450 500
0
0.1
0.2
0.3
0.4
0.5
0.6
0.7
Q4 2014 Q1 2015
Post
s
Tota
l Ena
gem
ent (
Mill
ions
)
FMCG VerAcal: Q4 2014 vs. Q1 2015 Engagement
Likes Comments Shares Posts
0
100
200
300
400
500
600
0.0
0.2
0.4
0.6
0.8
1.0
1.2
1.4
Q1 2014 Q1 2015
Post
s
Tota
l Eng
agem
ent (
Mill
ions
)
FMCG VerAcal: Year-‐Over-‐Year Engagement
Likes Comments Shares Posts
Engagement decreased for the FMCG vertical by 21% during Q1 2015. The number of brand posts decreased by 12%.
Engagement decreased for the FMCG vertical year-over-year. The number of brand posts decreased, as well.

Simply Measured 2015 Facebook Industry Report #SocialAnalytics37
Takeaway FMCG brands’ posting cadence and engagement levels slid both in Q1 2015 and year-over-year. The FMCG vertical is posting photos most and sees the greatest level of engagement with that content type, but Q1 2015 shows us that videos are this vertical’s most high-growth content type and something to pay attention to as the year progresses.

Simply Measured 2015 Facebook Industry Report #SocialAnalytics38
VERTICAL REPORT: DIVERSIFIED
Photos Stay Most Successful, But Videos See Huge Engagement Surge Diversified brands represented in the Interbrand 100 are 3M, Caterpillar, GE, John Deere, and Siemens. This vertical posted slightly less frequently in Q1 2015 and received less engagement.
Diversified brands were most successful with photos as a content type during Q1 2015, and are making a big investment in video posts. 3M was a particularly high-growth brand in the diversified vertical.
Key Findings• Diversified brands posted 1% less in Q1 2015 than in Q4 2014,
including 17% fewer links, 4% fewer photos, 67% fewer statuses, and 44% more videos
• Diversified brands’ video posts received 41% more comments, 106% more Likes, and 100% more shares in Q1 2015 than in Q4 2014
• Diversified brands received 9,283 comments in Q1 2015, 37% fewer than they received in Q4 2014
• Diversified brands received 427,540 Likes in Q1 2015, 39% fewer than they received in Q4 2014
• Diversified brands received 47,417 shares in Q1 2015, 69% fewer shares than they received in Q4 2014
• Diversified brands decreased 44% in engagement, coming in at 484,240 in total engagement
0
50
100
150
200
250
300
350
400
450
0 0.1 0.2 0.3 0.4 0.5 0.6 0.7 0.8 0.9
1
Q4 2014 Q1 2015
Post
s
Tota
l Eng
agem
ent (
Mill
ions
)
Diversified VerDcal: Q4 2014 vs. Q1 2015 Engagement
Likes Comments Shares Posts
0 50 100 150 200 250 300 350 400 450 500
0.0
0.1
0.2
0.3
0.4
0.5
0.6
Q1 2014 Q1 2015
Posts
Total E
ngag
emen
t (Millions
)
Diversified VerAcal: Year-‐Over-‐Year Engagement
Likes Comments Shares Posts
Engagement decreased for the diversified vertical by 44% during Q1 2015. The number of brand posts decreased by 1%.
Engagement increased for the diversified vertical year-over-year. The number of brand posts decreased.

Simply Measured 2015 Facebook Industry Report #SocialAnalytics39
Takeaway Diversified brands’ posting cadence held about steady in Q1 2015. The diversified vertical is posting photos most and sees the greatest level of engagement with that content type, but Q1 2015 shows us that videos are this vertical’s most high-growth content type and something to pay attention to as the year progresses.

Simply Measured 2015 Facebook Industry Report #SocialAnalytics42
VERTICAL REPORT: DIVERSIFIED
3M Wins Engagement Growth with Brand-True Videos and Partnerships3M was a particularly high-growth brand in the diversified vertical during Q1 2015, increasing its posting cadence by 124%, receiving 232% more comments, 516% more Likes, and 618% more shares for a total engagement boost of 520%.
3M was an early adopter of video within the diversified vertical, and it’s reaping the rewards. In fact, two out of 3M’s three most engaging posts during Q1 2015 were videos.
Key Findings• Visually stunning, science-based videos which suavely avoided the
sales pitch
• Building on the momentum of popular events like SXSW
• Partnering with socially super-successful brands like MTV 3M’s most engaging post in Q1 2015 was this video, which received 2,329,517 views, 15,710 Likes, 255 comments, and 1,198 shares.

Simply Measured 2015 Facebook Industry Report #SocialAnalytics43
Takeaway 3M boosted its Facebook engagement by posting more frequently, but also by posting more strategically. By devoting resources to creating compelling, entertaining video content and partnering smartly, this brand grabbed the attention of existing fans and audiences it previously didn’t touch.
3M’s second most engaging post in Q1 2015 was this one, which received 2,532 Likes, 6 comments, and 18 shares.

Simply Measured 2015 Facebook Industry Report #SocialAnalytics42
VERTICAL REPORT: APPAREL
Posting Less and Receiving Less EngagementApparel brands represented in the Interbrand 100 are Gap, H&M, Hugo Boss, Ralph Lauren, and Zara. This vertical posted less frequently in Q1 2015 and received less engagement because of that.
Apparel brands posted photos the most and drove the most engagement from that content type during Q1 2015. The number of videos posted during this time period grew, as well.
Key Findings• Apparel brands posted 33% less in Q1 2015 than in Q4 2014,
but posted 9% more videos
• Apparel brands received 15,323 comments in Q1 2015, 39% fewer than they received in Q4 2014
• Apparel brands received 1,952,492 Likes in Q1 2015, 10% fewer than they received in Q4 2014
• Apparel brands received 42,839 shares in Q1 2015, 26% fewer shares than they received in Q4 2014
• Apparel brands decreased 11% in engagement, coming in at 2,010,654 in total engagement
0
100
200
300
400
500
600
700
800
900
1.8 1.9 1.9 2.0 2.0 2.1 2.1 2.2 2.2 2.3 2.3
Q4 2014 Q1 2015
Post
s
Tota
l Eng
agem
ent (
Mill
ions
)
Apparel VerBcal: Q4 2014 vs. Q1 2015
Likes Comments Shares Posts
0
100
200
300
400
500
600
700
800
900
0.0
0.5
1.0
1.5
2.0
2.5
3.0
3.5
Q1 2014 Q1 2015
Post
s
Tota
l Eng
agem
ent (
Mill
ions
)
Apparel VerBcal: Year-‐Over-‐Year Engagement
Likes Comments Shares Posts
Engagement decreased for the apparel vertical by 11% during Q1 2015. The number of brand posts decreased by 27%.
Engagement decreased for the apparel vertical year-over-year. The number of brand posts decreased, too.

Simply Measured 2015 Facebook Industry Report #SocialAnalytics43
Takeaway The apparel vertical is posting photos most and sees the greatest level of engagement with that content type, but Q1 2015 shows us that videos are this vertical’s most high-growth content type and something to pay attention to as the year progresses.

Simply Measured 2015 Facebook Industry Report #SocialAnalytics44
ConclusionAs Facebook evolves, so do the top global brands who use the social network for brand awareness, touting new products, communicating with fans, and driving innumerable business results. What success consists of varies by vertical and by brand, depending on what a brand’s goals are. Standout trends include:
• The Interbrand 100 experienced a dramatic increase in engagement year-over-year
• Shares increased across verticals during Q1 2015, largely due to photos and videos
• Brands like Adidas, McDonald’s, and 3M saw record engagement growth with Facebook videos
• The media vertical was the most successful at engagement, while the business services vertical saw the most fan growth (though still minor)
• Retail and automotive brands responded to fans most, while electronics and media brands responded fastest
• The Interbrand 100’s links and photos drove the most engagement, while photo and video sharing Increased
Growing a healthy presence on Facebook requires more strategy than optimizing your posting frequency. Interbrand 100 companies are experiencing progress, challenges, and discoveries as they continue to experiment with techniques on the network.
Facebook® is a registered trademark of Facebook, Inc.
Lucy Hitz is a Content Marketing Producer at Simply Measured, where she works on longform content and writes for the award-winning social analytics blog. Her favorite musical artist is Taylor Swift, and you can find her on Twitter at @LLHitz.
Avenicio Baca is the Client Services Engineer on our Professional Services team. He spends his days wrangling large datasets and kittens.

Want to try Simply Measured?
Request a Free Trial Today
Copyright © 2010–2015 Simply Measured, Inc. All Rights Reserved.
About Simply MeasuredSimply Measured is the most complete social analytics solution, empowering marketers with unmatched access to their social data to more clearly define their social strategy and to optimize their tactics for maximum impact.
Our goal is to put the tools to understand business data in the hands of business users. We think reporting should be simple, attractive, and accessible for everyone – not just data scientists. Our software streamlines the process from data to deliverables and eliminates the countless hours spent on everyday reporting tasks. We do this by putting cloud data sources at your fingertips, providing a marketplace of best practice reports, and allowing you to generate beautiful solutions on the web, in Excel, and in PowerPoint with a couple of clicks.