facility operations, energy & design you canyou can t manage
TRANSCRIPT
Facility Operations, Energy & DesignFacility Operations, Energy & DesignYou Can’t Manage What You Don’t MeasureYou Can t Manage What You Don t Measure
SAME South Atlantic Region October 19, 2011

PresentersPresentersLaura Girard, PE, LEED AP O+M, CEM, PMPStephanie Graham, LEED AP BD+CS ep a e G a a , C
AgendaFederal Mandates for EnergyFederal Mandates for EnergyAnalysis & DesignMeasurement & VerificationOn-going Performance Case Study
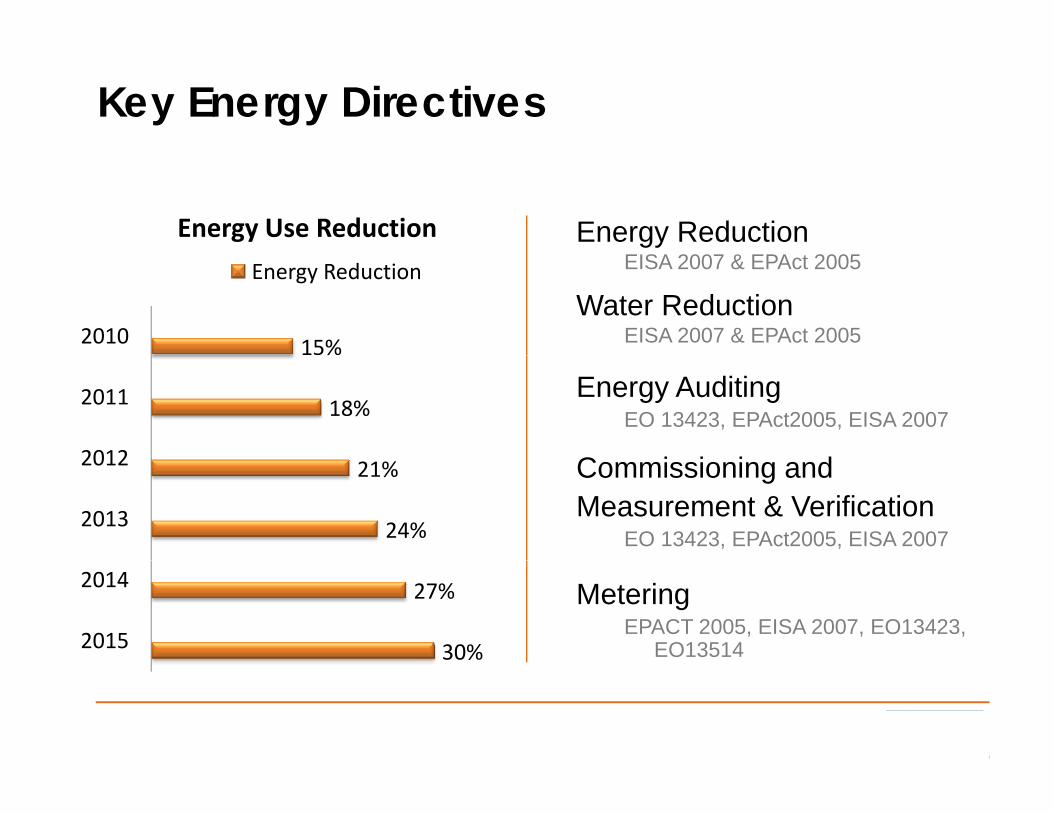
Key Energy Directives
Energy ReductionEnergy Use ReductionEISA 2007 & EPAct 2005
Water ReductionEISA 2007 & EPAct 200515%2010
Energy Reduction
Energy AuditingEO 13423, EPAct2005, EISA 2007
C i i i d
18%
2012
2011
Commissioning and Measurement & Verification
EO 13423, EPAct2005, EISA 200724%
21%
2013
2012
Metering EPACT 2005, EISA 2007, EO13423,
EO1351430%
27%
2015
2014

Managing Building Performance
DefineNeeds/Goals
ManageDesign
and Implement
ManageUtility
Monitoring & Analysis
Measure and Verify
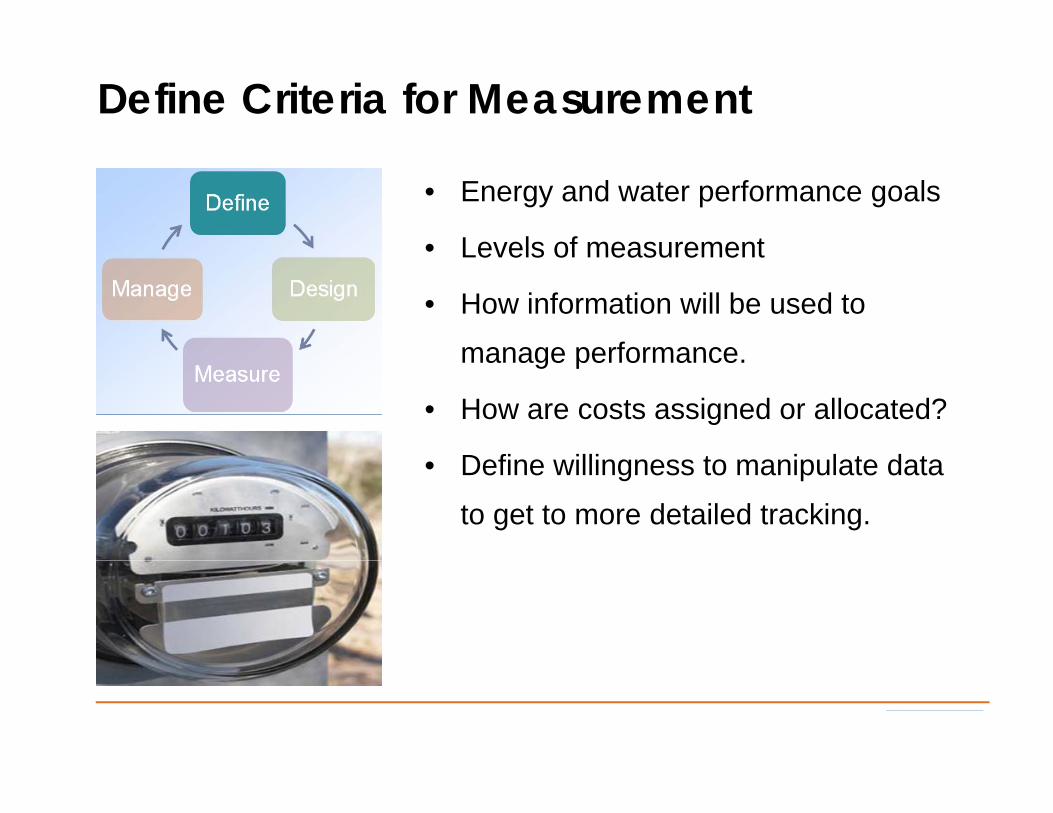
Define Criteria for Measurement
• Energy and water performance goals
• Levels of measurementLevels of measurement
• How information will be used to
manage performancemanage performance.
• How are costs assigned or allocated?
D fi illi t i l t d t• Define willingness to manipulate data
to get to more detailed tracking.

Design to Optimize Performance
• Building Energy Modeling
• Metering, Submetering
• Identify BAS Tracking Points• Identify BAS Tracking Points

Optimize System Performance
• Commission the building systems
Develop building systems• Develop building systems O+M plans
• Develop measurement & verification plan

Measure Actual Performance
• Track utility usage • Compare actual energy use
modeled energy use– Adjust and recalibrate– Investigate discrepanciesInvestigate discrepancies
The more measurement points, the easier to identify sources of problems
modeled energy use vs actual energy use

Manage Ongoing Performance
• Continue to track utility usage • Look for patternsLook for patterns• Investigate discrepancies• Manage human behaviorgIt’s a journey . . . Not a destination!
Source of image – Lucid Design Group, http://www.luciddesigngroup.com

Managing Building Performance
Building InventoryEnergy Usage
Existing Building
Existing Building g
Stock
New Construction
gStockNew Construction
Greatest opportunity is in the existing building inventory

Managing Building Performance
DefineNeeds/Goals
ManageDesign
and Implement
ManageUtility
Monitoring & lAnalysis
Measure and Verify
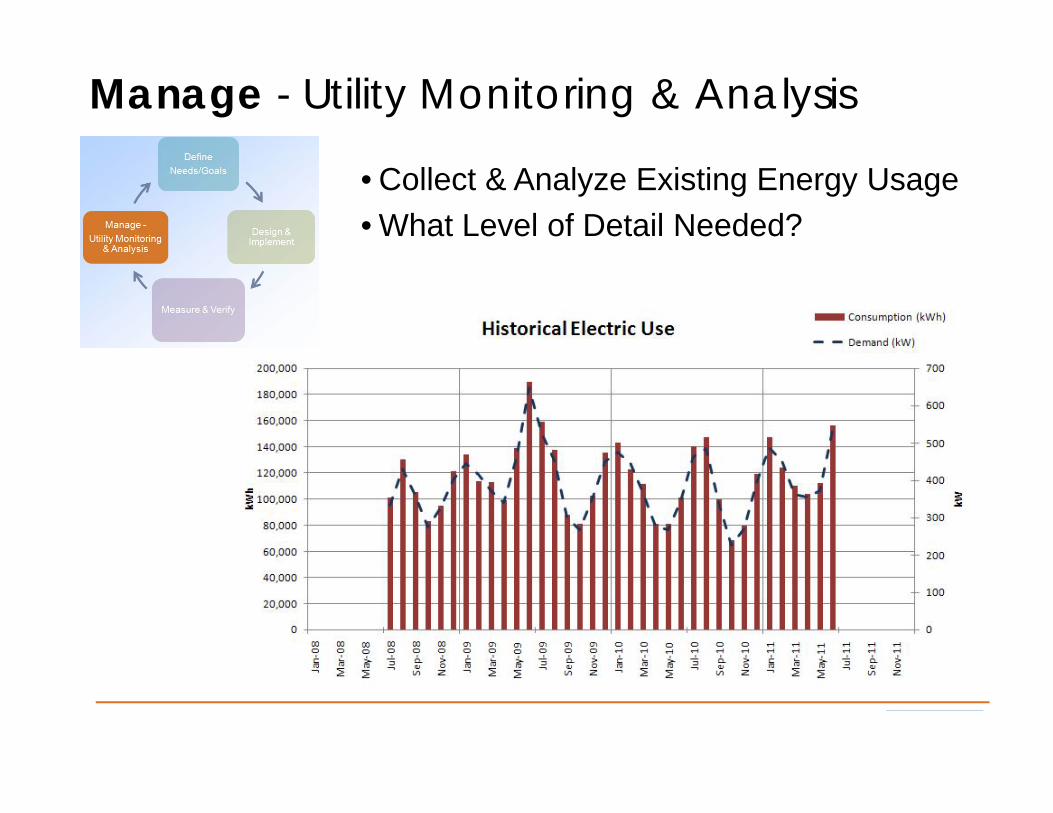
Manage - Utility Monitoring & Analysis
• Collect & Analyze Existing Energy Usage• What Level of Detail Needed?

Manage - Utility Monitoring & Analysis
• Benchmark Facilities– Energy Star
Energy Use Intensity (EUI) Btu/sq ft– Energy Use Intensity (EUI) Btu/sq. ft.
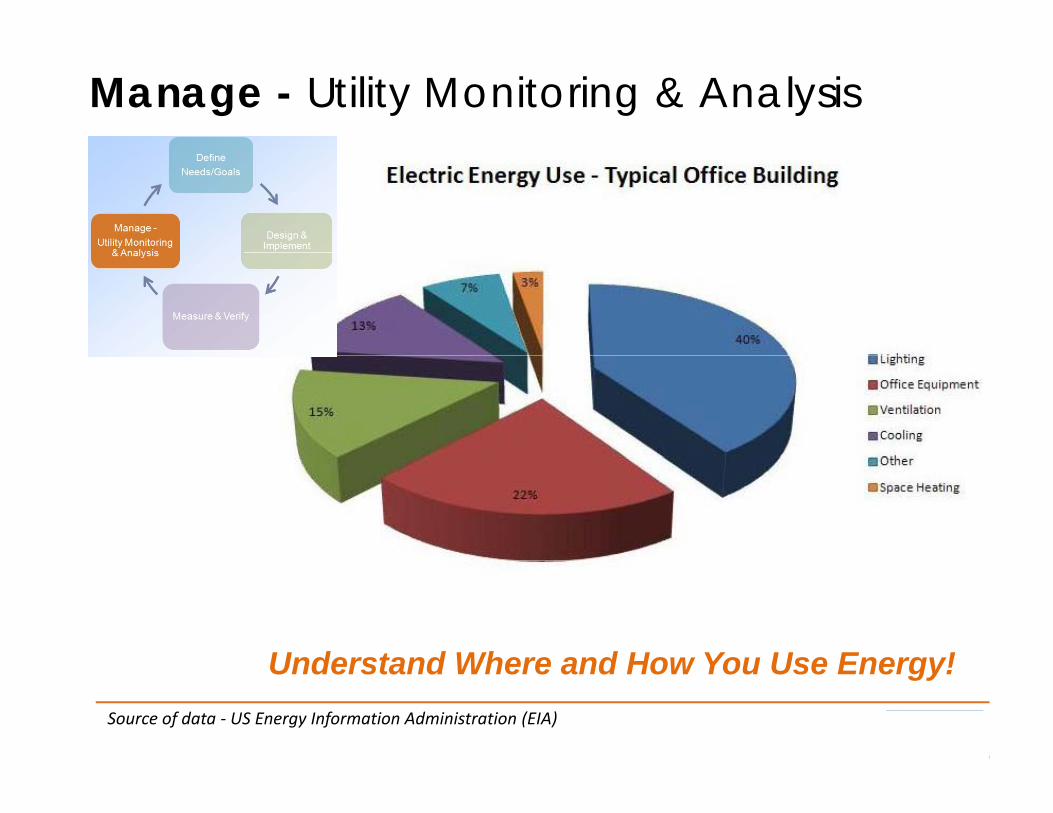
Manage - Utility Monitoring & Analysis
Understand Where and How You Use Energy!Source of data ‐ US Energy Information Administration (EIA)
Understand Where and How You Use Energy!

Define – Needs / Goals
• Meeting Federal Mandates• Energy Security• Cost Reduction• LEED Certification
H D W G t Th ?• How Do We Get There?

Design to Maximize Impact – Energy Audits
• Utility Analysis & Baseline• Benchmark• Energy Conservation Measures (ECMs)
– Identify– Conceptual Design – Energy Analysis
• Environmental Analysis– Economic Analysis
P b k A l i• Payback Analysis• Life Cycle Cost Analysis
• Implementation PlanM t & V ifi ti Pl• Measurement & Verification Plan
D t il d D i & C t ti I l t tiDetailed Design & Construction Implementation

Measurement & Verification• Know the Requirements!
– Energy Conservation Investment Program (ECIP)– Energy Savings Performance Contracts (ESPC)gy g ( )– Utility Energy Savings Contracts (UESC)– Utility Rebate Requirements
M&V R f• M&V References– FEMP M&V Guidelines– International Performance Measurement
d V ifi ti P t l (IPMVP)and Verification Protocol (IPMVP)
• M&V OptionsOption A Stipulated (Calculated)– Option A – Stipulated (Calculated)
– Option B – Before & After Measurements– Option C – Utility Bill Analysis
Option D Whole B ilding Modeling– Option D – Whole Building Modeling

Case Study

County of Fresno, CA• Define
– Cost Reduction– Energy Security
• Design• Design– Campus Wide Energy Efficient Retrofit– 1.25 MW Combined Heat and Power
• Measure– IPMVP Option C – Utility Bill– Project Cost: $12 Million– Rebates & Incentives: $1.5 Million
$1 4 Million in Annual Savings– $1.4 Million in Annual Savings• Manage
– On-going Monitoring & Analysis
Annual Utility Savings of $1 4 Million$1.4 Million

County of Fresno ECMs• 1.25 MW Combined Heat & Power Facility• Utility Rate Conversion• Lighting RetrofitsLighting Retrofits• Chillers with Variable Frequency Drives• Upgraded Existing Energy Management
SystemSystem• HVAC Improvements• Addition of VFDs• High Efficiency BoilersHigh Efficiency Boilers• Upgraded Steam Distribution• Low Flow Plumbing Program• Cooling Towers for Water Conservation• Cooling Towers for Water Conservation• Laundry Water Conservation• Irrigation Controls

County of Fresno: Verified ResultsCounty of Fresno: Verified Results

Managing Building Performance
DefineNeeds/Goals
ManageDesign
and Implement
ManageUtility
Monitoring & Analysis
Measure and Verify
It’s a journey . . . Not a destination!
Thank You!
Laura Girard, PE, LEED AP O+M, CEM, PMP St h i G h LEED AP BD CStephanie Graham, LEED AP BD+C
Burns & McDonnellMain: 816‐333‐9400
[email protected]@burnsmcd.comg @
SAME South Atlantic Region October 19, 2011