factors influencing oil prices: a survey of the current … of oil prices can be grouped into three...
TRANSCRIPT

Factors Influencing Oil Prices: A Survey of the Current State of Knowledge in the Context of the 2007-08 Oil Price Volatility
Louis H. Ederington, University of Oklahoma
Chitru S. Fernano, University of Oklahoma Thomas K. Lee, U.S. Energy Information Administration Scott C. Linn, University of Oklahoma Anthony D. May, Wichita State University August 2011
Independent Statistics & Analysis
www.eia.gov
U.S. Energy Information Administration Washington, DC 20585
This paper is released to encourage discussion and critical comment. The analysis and conclusions expressed here are those of the authors and not necessarily those of the U.S. Energy Information Administration.
WORKING PAPER SERIES

Factors Influencing Oil Prices: A Survey of the Current State of Knowledge
in the Context of the 2007-08 Oil Price Volatility
Louis H. Ederington, Chitru S. Fernando, Thomas K. Lee, Scott C. Linn, and Anthony D. May∗
August 30, 2011
Abstract
We document the findings of a study undertaken to identify gaps in current knowledge pertaining to price formation, volatility and the role of hedging and speculation in the global oil market. Our survey uncovers considerable evidence based on several research studies to suggest that fundamental factors, namely stagnant supply, unexpected economic growth from China and other countries such as India, low interest rates, and a weak U.S. dollar, were at least associated with and may have contributed to the sharp oil price run-up and subsequent decline in the 2007-08 period. There is also some evidence to suggest that the price run-up and decline may have been exacerbated by the formation and collapse of an oil price bubble, perhaps triggered by fundamental factors in both the oil market and the broader global economy. Despite considerable evidence pointing to a major increase in oil derivatives trading and a significant change in the composition of derivatives traders over the past decade, the contribution, if any, of these traders and of speculation in oil derivatives to the 2007-08 oil market turbulence remains undetermined for two reasons. First, the existing body of research does not provide a definitive answer to the question of how oil inventories respond to the futures-spot price spread, which should be the mechanism connecting financial market speculation and physical oil prices if the latter are determined by supply and demand. Second, the Granger causality tests that have been conducted to date to test whether open interest position changes by speculators lead or lag futures price changes shed little light on how speculation impacts oil futures prices.
∗ Ederington, Fernando and Linn are with the Price College of Business, University of Oklahoma; Lee is with the U.S. Energy Information Administration; and May is with the Barton School of Business at Wichita State University. We gratefully acknowledge financial support for this research from the U.S. Energy Information Administration and the University of Oklahoma Office of the Vice President for Research. The views expressed in this paper reflect the opinions of the authors only, and do not necessarily reflect the views of the U.S. Energy Information Administration. The authors are solely responsible for all errors and omissions. All correspondence should be addressed to Chitru Fernando, Price College of Business, University of Oklahoma, 307 West Brooks Street, Norman, OK 73019. Email: [email protected] and telephone: (405)325-2906.
Thomas K. Lee | U.S. Energy Information Administration | This paper is released to encourage discussion and critical comment. The analysis and conclusions expressed here are those of the authors and not necessarily those of the U.S. Energy Information Administration.

1. Introduction The current state of knowledge on the important factors influencing oil prices have been identified in relevant venues, including recent academic literature, government reports, policy debate, and industry analysis. In this paper, we briefly survey the current state of knowledge on this topic, based on an objective assessment of each factor’s influence and potential to influence ongoing policy debates, or academic or industry research. In sections 2 to 6, we provide a summary of what current research tells us, and with what degree of confidence, about the identified factors, their interactions, and influences on prices. We draw on nearly 200 research papers, articles, and industry and policy documents, mostly work published in the past five years. Section 7 concludes. 2. Models of oil prices
Models of oil prices can be grouped into three broad categories: 1) Structural models designed to capture the interplay of fundamental supply and demand conditions and the factors influencing supply and demand, 2) Reduced form or hybrid models built on hypotheses about the reduced form stochastic behavior of oil prices, and 3) Econometric models which posit specific types of time series behavior for the conditional first and second moments of the oil price series. The first group of models tends to focus on longer time-horizons and includes macro-type models used for forecasting while the latter two groups tend to focus on short-term dynamic behavior. An important dimension typically missing from extant models of oil prices but which has become a topic of great interest to oil market observers and participants is the role that speculators play in the futures market for oil and the implications of such activities for the spot price of oil. We examine this question in detail in section 4 of this review. 2.1 Fundamental models/Structural models 2.1.1 The Hotelling model of optimal extraction of an exhaustible resource The Hotelling model is regarded by most as a seminal contribution to the literature on exhaustible resources such as oil and so is an appropriate starting point. Hotelling (1931) presents a model of optimal resource extraction within a competitive market for an exhaustible resource. The resource is extracted at a constant rate per unit of time and the objective is to maximize the present value of all future profits. The model has been a mainstay in the literature on oil prices and has been studied extensively. Hotelling's results are developed assuming a world of perfect competition and certainty. Producers in the model follow the objective of maximizing the present value of profit (price minus
Thomas K. Lee | U.S. Energy Information Administration | This paper is released to encourage discussion and critical comment. The analysis and conclusions expressed here are those of the authors and not necessarily those of the U.S. Energy Information Administration.

3
extraction cost). Hotelling’s original development assumed zero extraction costs. Hotelling shows that in the solution each unit of stock of the resource will at any time have the same present value as any other unit. Likewise, the percentage change in the net-price (net of extraction cost) per unit of time will equal the discount rate (under certainty, the interest rate) in order to maximize the present value of the resource capital over the extraction period. Crude oil futures contracts have historically traded in backwardation, the case in which futures prices are below spot prices. However, this changed around 2005 when the market began to exhibit contango, i.e., futures prices exceeding spot prices. Backwardation is inconsistent with the Hotelling result unless either extraction costs rise at a rate that is smaller than the interest rate or fall over time or where there are binding production constraints inhibiting supply responses. Pindyck (1980) reaches a similar conclusion to the Hotelling model in a world characterized by uncertainty but as Litzenberger and Rabinowitz (1995) point out this arises because Pindyck assumes a non-optimal production rule. He assumes that production ceases permanently as soon as the price falls below extraction costs. Litzenberger and Rabinowitz show that strong backwardation emerges in a model incorporating uncertainty if the riskiness of futures prices is high. The Hotelling model has been examined by many and generally found to be lacking as a tool for predicting oil price behavior. Recently Lin (2009) in a study of annual prices for the period 1965-2006 finds that the Hotelling model does a poor job of replicating actual data. Slade and Thille (2009) point out that rejection of the basic Hotelling model may arise because it lacks a complete description of the relevant cost function for resource extraction and/or because of econometric issues. Slade and Thille (2009) present a review of the literature focusing on the Hotelling model and discuss numerous theoretical extensions to the basic model along with econometric issues that arise in testing the model’s predictions. The primary focus of their survey is on the dynamics of spot price behavior that follows from the model. The basic Hotelling model assumes a world of certainty and perfect competition. Slade and Thille (2009) present the price change dynamics implications of several variations of the model. Producers follow a decision rule of maximizing the present value of net revenues. We
will define p as the change in the price from date t to t+1 and pp
as the rate of change in
the price, r as the known constant discount rate, ( )T,R,qC as the extraction cost function
where ( )tq is the volume of the resource extracted at time t, R equals the level of reserves, and T denotes an index of the technology available for extraction. Hotelling in his original work assumed the cost of extraction was equal to zero. Common assumptions
Thomas K. Lee | U.S. Energy Information Administration | This paper is released to encourage discussion and critical comment. The analysis and conclusions expressed here are those of the authors and not necessarily those of the U.S. Energy Information Administration.
4
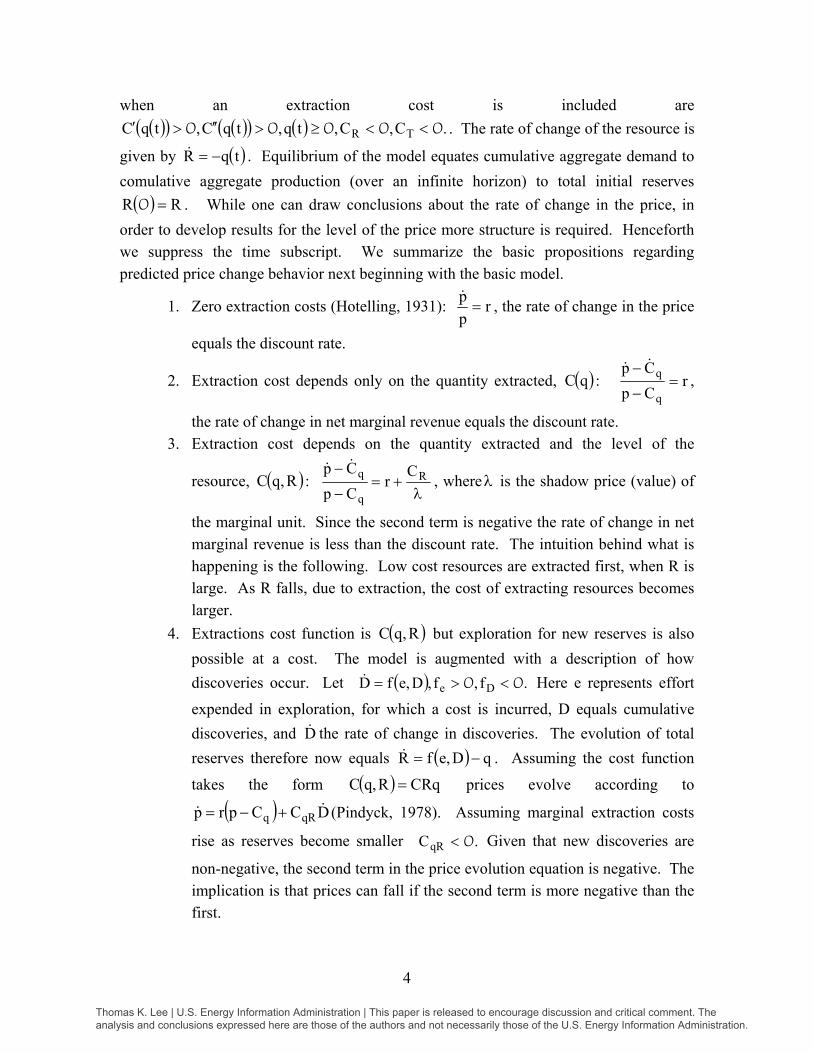
when an extraction cost is included are ( )( ) ( )( ) ( ) .C,C,tq,tqC,tqC TR 00000 <<≥>′′>′ . The rate of change of the resource is
given by ( )tqR −= . Equilibrium of the model equates cumulative aggregate demand to comulative aggregate production (over an infinite horizon) to total initial reserves ( ) RR =0 . While one can draw conclusions about the rate of change in the price, in
order to develop results for the level of the price more structure is required. Henceforth we suppress the time subscript. We summarize the basic propositions regarding predicted price change behavior next beginning with the basic model.
1. Zero extraction costs (Hotelling, 1931): rpp= , the rate of change in the price
equals the discount rate.
2. Extraction cost depends only on the quantity extracted, ( )qC : rCpCp
q
q =−
−,
the rate of change in net marginal revenue equals the discount rate. 3. Extraction cost depends on the quantity extracted and the level of the
resource, ( )R,qC : λ
+=−
− R
q
q Cr
CpCp
, whereλ is the shadow price (value) of
the marginal unit. Since the second term is negative the rate of change in net marginal revenue is less than the discount rate. The intuition behind what is happening is the following. Low cost resources are extracted first, when R is large. As R falls, due to extraction, the cost of extracting resources becomes larger.
4. Extractions cost function is ( )R,qC but exploration for new reserves is also possible at a cost. The model is augmented with a description of how discoveries occur. Let ( ) .f,f,D,efD De 00 <>= Here e represents effort
expended in exploration, for which a cost is incurred, D equals cumulative discoveries, and D the rate of change in discoveries. The evolution of total reserves therefore now equals ( ) qD,efR −= . Assuming the cost function
takes the form ( ) CRqR,qC = prices evolve according to
( ) DCCprp qRq +−= (Pindyck, 1978). Assuming marginal extraction costs
rise as reserves become smaller .CqR 0< Given that new discoveries are
non-negative, the second term in the price evolution equation is negative. The implication is that prices can fall if the second term is more negative than the first.
Thomas K. Lee | U.S. Energy Information Administration | This paper is released to encourage discussion and critical comment. The analysis and conclusions expressed here are those of the authors and not necessarily those of the U.S. Energy Information Administration.

5
5. Extraction cost function, ( )T,R,qC , depends upon quantity extracted, the
level of reserves and the level of technology, where 0<TC , that is costs fall
as technology improves. Assuming ( ) CRq)T(hT,R,qC = but no exploration, prices evolve according to ( ) qTq CCprp +−= . As technology improves the
marginal cost of extraction falls and 0<qTC and prices may fall.
A final but potentially important issue is the extension of the setting to incorporate uncertainty. Slade and Thille (1997), and Gaudet (2007) extend Case 3 above to include uncertainty about prices and costs. The expected rate of change in marginal net revenue (the shadow price) that emerges is equal to
RPC
r R +λ
+ where RP is a risk premium.
Each of the aforementioned modifications of the basic Hotelling model yields a prediction about the change in the price over time. However, as should be clear these predictions depend upon the extraction cost function assumed. Incorporating information based upon the actual common technology employed in extraction would help to maximize the utility of the model, but accounting for shifts in technology, which are not likely to be continuous but rather lumpy will be a challenge. One prospect is the cost function for oil estimated by Chakravorty, Roumasset and Tse (1997), which should however be updated using more recent data. Worth mentioning however is the study by Wu and McCallum (2005) which focuses on monthly oil prices for the period 1986-2005. The authors report that the basic Hotelling model in which the price grows at the constant riskless rate comes in first amongst three popular alternatives in terms of standard deviation of prediction error for long-term forecasts of out-of-sample prices. Unfortunately the authors do not report the relevant statistics to back up their claim. A thorough up-to-date investigation of the predictive ability of the Hotelling model in comparison with other alternatives would therefore seem fruitful. Slade and Thille argue that oil prices exhibit both time varying volatility as well as trend shifts. If the intent is to construct a predictive model for oil prices then a hybrid model that both accounts for the predictions of the models described above as well as short-run time-varying volatility as well as long-run trends is warranted.
2.1.2 Models of optimal storage The canonical model of optimal storage is the Theory of Storage which had its genesis in the work of Kaldor (1939) and Working (1949) and subsequent work by Brennan (1958).
Thomas K. Lee | U.S. Energy Information Administration | This paper is released to encourage discussion and critical comment. The analysis and conclusions expressed here are those of the authors and not necessarily those of the U.S. Energy Information Administration.
6
Subsequent models, such as Schennkman and Schetman (1983), Deaton and Laroque (1992, 1996), Chambers and Bailey (1996), introduce uncertainty and rational decision making behavior regarding the optimal storage decision; however they do not account for the convenience yield posited by Kaldor (the user benefit to holding inventory). The models themselves are parsimonious and the supply and demand factors are primitive in nature, generally relying on two sources of uncertainty, a production or supply shock and a demand shock. Optimizing behavior is with respect to the storage decision, ignoring the production decision, that is, production (supply) is simply a random influence. These models tend to not do a very good job of predicting price behavior. A recent proposal by Dvir and Rogoff (2010) in which the authors extend the model to reflect persistent shocks to demand, produces both persistent price behavior as well as price volatility consistent with observed annual data.1 Carlson, Khokher and Titman (2007) and Kogan, Livdan and Yaron (2009) have recently examined a variant of the problem in which production is the choice variable but storage is ignored, one case under an infinitely available resource and one in which the capacity to produce is constrained. We discuss these models following our presentation on reduced form models. The implications of the storage models for the connection between futures market speculation and cash prices is discussed in sections 4.6 and 4.7 below. 2.1.3 Macro models of supply and demand Macro models of domestic and world oil markets seek to draw conclusions regarding oil prices based upon the interaction of supply and demand forces at the macro level. These models are generally constructed to relate prices, demand and supply with an eye towards forecasting future prices and/or the price and income elasticity of demand. The basic structure of these models is the specification of demand and supply generally in terms of price, a proxy for aggregate income, exchange rates, interest rates, production costs, inventory stocks and production capacity. However, a complicating factor influencing supply is the behavior of OPEC. OPEC is usually treated as an exogenous influence. At various points in this review we take up the relations between several of these factors and oil prices but for the moment only mention them. The models can have simple structures involving few elements, such as the work of Dees et al. (2007) and Krichene (2007), or can be highly complex such as the models used by the Energy Information Administration and the International Energy Agency.2 Models like those of Dees et al. 1 Gorton, Hayashi and Rouwenhorst (2007) extend the Deaton and Laroque (1992) model by including a futures market and risk averse traders. They go on to test several predictions of the theory of storage but the results presented for crude oil are generally weak. 2 Energy Information Administration. 2009. National Energy Modeling System: An Overview 2009 (www.eia.doe.gov/oiaf/aeo/overview/); International Energy Agency, 2009, World Energy Model (http://www.worldenergyoutlook.org/docs/weo2009/World_Energy_Model.pdf).
Thomas K. Lee | U.S. Energy Information Administration | This paper is released to encourage discussion and critical comment. The analysis and conclusions expressed here are those of the authors and not necessarily those of the U.S. Energy Information Administration.

7
(2007) and Krichene (2007) do not directly incorporate optimizing behavior but it is indirectly present in the functional forms selected for the aggregate supply and demand functions. The EIA and IEA models directly involve optimizing behavior regarding production as part of the steps involved in solving the model. Extant macro models generally do not incorporate a futures market and hence do not model the potential for speculative trading in a futures market and its implications for spot prices.3 In section 6.2 we discuss empirical evidence which has found that oil futures price changes tend to lead spot price changes (price discovery tends to occur in the futures market). As already mentioned the issue of speculative trading in the oil futures market has raised serious questions about oil price behavior. Dees et al. (2008) study an oil price model in which prices are related to refinery utilization, nonlinearities between price and supply (specifically OPEC capacity utilization) and information reflected in futures prices for oil. They conduct a series of tests pitting the predictive power of their fundamental model against a simple random walk model and a model in which futures prices are the only predictors of spot prices. The authors find that a simple random walk model generates the best predictions. We could find no research on the recent oil price forecast accuracy of the EIA forecasts as compared to alternative models. A primary use of the EIA and IEA models is to generate forecasts of prices along with other fundamental market variables by solving the model for a given set of empirical assumptions. The models are set up to generate point estimates. One potential, but probably not trivial, extension of these models would be the incorporation of uncertainty through the delineation of probability distributions for key fundamental variables and the use of Monte Carlo simulation to construct empirical probability distributions for future oil prices. Currently the EIA utilizes data inferred from NYMEX options on oil futures to compute confidence intervals for price forecasts. In addition, the supply modules of these models focus on investment and production activity based upon a traditional net present value paradigm. Advances in investment theory in recent years reflect the insight that many investments contain flexibilities (real options) that have value.4 The traditional net present value rule explicitly ignores choice strategies built on the exploitation of real options and flexibilities. One industry in which investment strategy based upon the
3 For instance, a potentially interesting issue is the 2009 adoption of the Argus Sour Crude Index by Saudi Arabia and other Middle East oil exporters as a basis for oil export pricing to the U.S. The Argus Sour Crude Index is computed in part using price information on WTI futures contracts traded on NYMEX, combined with spot prices from three physical locations on the U.S. Gulf Coast other than the spot prices from Cushing, OK. Similarly, many of these same countries use what is referred to as the BWAVE index (a weighted average of futures prices on Brent oil) for pricing oil exports to Europe. For details on the Argus Sour Crude Index please see: (http://www.argusmedia.com/pages/StaticPage.aspx?tname=Argus+Home&pname=Petroleum&staticurl=snips/bir/ASCI.shtml#c). 4 An excellent resource on the topic of real options and capital investment is Dixit and Pindyck (1994).
Thomas K. Lee | U.S. Energy Information Administration | This paper is released to encourage discussion and critical comment. The analysis and conclusions expressed here are those of the authors and not necessarily those of the U.S. Energy Information Administration.
8
exploitation of real options has found a home is the oil industry. A third possible extension is the introduction of a futures market for oil claims. 2.1.4 Fundamentals and recent oil price behavior The recent behavior of oil prices has attracted much attention and generated much debate about the forces that drove price changes. One view is that recent oil price behavior was due to fundamental supply and demand factors. The principal opposing view attributes the run up in prices to excess speculation and possibly manipulation. The empirical evidence suggests that this is not a black and white issue but that both forces may have contributed to the recent escalation in oil prices. Hamilton (2009a) points out, as have numerous other authors surveying the oil market (Smith, 2009; Fattouh, 2007), that to understand short run oil price behavior one must recognize that income, not price, is the key determinant of the quantity demanded. Estimates of short run price elasticity of demand tend to be close to zero for the U.S. while estimates of income elasticity are much larger on the order of 0.5 for industrialized countries. Kilian and Murphy (2010) however is a recent exception to most of the literature. Those authors conclude that the short-run price elasticity of demand may be on the order of -0.26 when one accounts for inventory. Gately and Huntington (2002) report a nearly proportional relationship between income and oil demand in developing countries (what they refer to as ‘income growing’ countries) (income elasticity in the vicinity of 1.00) and Dargay and Gately (2010) report an income elasticity for China of roughly 0.74 for the period 1980-2007. Likewise supply is fairly inelastic as well. Hamilton argues the recent price escalation and subsequent decline in oil prices was driven at least in part by stagnant supply and increased demand driven heavily by China. Several other investigators have also argued in favor of fundamentals as the driving force. Kilian (2009) using a structural VAR model suggests the surge in prices was driven by demand for industrial commodities and oil and that this was driven by demand growth in Asia, primarily China and India. Kilian and Murphy (2010) reach a similar conclusion. Similar conclusions have been reached via an alternative route by Kilian and Hicks (2009). Kilian and Hicks examine the relation between oil price changes and a weighted average of GDP forecast revisions for the country groupings, China + India and U.S. + Germany + Japan arguing that GDP forecast revisions are direct measures of demand shocks. A forecast revision is measured month to month over the period 2000:11-2008:12 and all forecasts are from the Economic Intelligence Unit.5 The authors find that
5 See www.eiu.com for further details.
Thomas K. Lee | U.S. Energy Information Administration | This paper is released to encourage discussion and critical comment. The analysis and conclusions expressed here are those of the authors and not necessarily those of the U.S. Energy Information Administration.

9
forecast revisions of GDP appear to drive real oil price changes during the period studied and that revisions for China + India dominate. A recent report of a special task force of the U.S. government, the Interagency Task Force on Commodity Markets (2008), also concludes that intense demand and sluggish supply were the primary reasons for the recent run up in the oil price. However the report documents no formal statistical analysis to accompany the qualitative analysis presented. Additionally, industry analysts have drawn attention to the rising cost of marginal supply (see, for example, Diwan (2008) and Deutsche Bank (2008) & (2009)) although, instead of production costs driving oil prices, it is conceivable that higher oil prices attract more expensive supply into the market. Hamilton (2009a) however also concludes that the speed of the changes in oil prices observed warrants serious consideration of the hypothesis that a speculative price bubble was at work. After considering the question of the impact of speculative activity on oil prices (we take this up more fully in section 4) he concludes that low price elasticity of demand and sluggish supply (production) and not speculation per se were the most likely forces driving the oil price run up. Smith (2009) reaches a similar conclusion as does the Interagency Task Force on Commodity Markets (2008).6 2.1.5 Organization of Petroleum Exporting Countries (OPEC) Price level changes OPEC plays an important role in terms of world oil supply. In most macro/global models of the oil market OPEC supply is a crucial ingredient. OPEC in principle can influence oil prices by managing production quotas (Wirl and Kujundzic, 2004; Kaufmann et al., 2008a) and/or capacity utilization (Kaufmann et al., 2004, 2008b).7 Kaufmann et al. (2004) study the time series behavior of real oil prices, OPEC capacity utilization, OPEC quotas, the degree to which OPEC exceeds its production quotas and OPEC stocks of crude oil. The authors study quarterly data for the period 1986 through 2000 and find the
6 Smith (2009, 2010) also argues against the ‘peak oil’ hypothesis first articulated by Hubbert (1956) as an explanation for the price run up. That theory argues oil production will eventually reach a peak and then begin to fall as the resource (oil) is used up. Citing statistics on use and discovery, such as the stock of remaining reserves having doubled between 1980 and 2009, Smith concludes that peak oil theory cannot explain the run up in prices. Adams and Shachmurove (2007) build an econometric model based on the energy balance framework to forecast future energy requirements and import needs of China up to 2020. The study suggests that, due to continued rapid growth of industrial output and GDP and the prospect of continued rapid motorization, China will require rapidly growing imports of oil, coal, and gas, suggesting that if income elasticity remains high upward pressure on oil prices is likely. 7 Smith (2005) reviews the extent to which OPEC behaves in practice the way theory tells us a cartel will behave and concludes
Thomas K. Lee | U.S. Energy Information Administration | This paper is released to encourage discussion and critical comment. The analysis and conclusions expressed here are those of the authors and not necessarily those of the U.S. Energy Information Administration.
10
OPEC related variables Granger cause oil prices during the sample period. As such it is probably no surprise that announcements by OPEC of policy changes are greeted by oil markets much like announcements of U.S. Federal Reserve policy changes are greeted by financial markets. Demirer and Kutan (2010) use event study tests to examine the effects of OPEC announcements on crude oil market activity in the U.S. Their sample consists of 63 OPEC press releases from the period 1983-2008. The empirical approach involves the measurement of cumulative daily abnormal log price changes in the spot and futures markets at the time of and around the announcements using suitably chosen benchmarks to estimate conditional expected changes. Their findings suggest no significant reaction to OPEC production increases in either the spot or futures markets. OPEC announcements of production cuts, however, are associated with significantly negative abnormal returns in the spot and futures markets during the period Day +2 to +20, where Day 0 is the day of the announcement. OPEC announcements that maintain the aggregate production quota are associated with negative abnormal returns in the spot and futures markets in the Day +2 to +20 period.8 Price volatility changes In a study of implied volatilities from options on crude oil futures surrounding OPEC meetings, Horan et al. (2004) find implied volatility drifts upward as a meeting approaches and then drops by roughly 5% over the 5 days following. The authors find that highly visible bi-annual conferences are associated with very little drop in implied volatility. The most pronounced decline in volatility coincides with the meetings of the Ministerial Monitoring Committee, which makes production recommendations to the larger conference. 2.1.6 Prices, price volatility and fundamentals The theory of storage predicts that price volatility and price level are inversely related to the level of inventories. When there are little or no inventories to act as a buffer, imbalances in supply and demand may result in dramatic price changes. In addition, prices and volatility will be positively correlated as both are negatively related to inventories. A separate argument made by Smith (2009) and others emphasizes that oil price volatility can be high because the underlying demand and supply curves are so price inelastic that shocks to supply or demand are immediately reflected in the price. Finally, the relation between volatility and inventory can run in the opposite direction as well, that is, volatility can potentially influence inventory levels. For instance as Pindyck (2004) 8 Wirl and Kumundzic (2004) study the impact of OPEC conference meetings on the Dubai light oil price and conclude there is no statistically significant impact.
Thomas K. Lee | U.S. Energy Information Administration | This paper is released to encourage discussion and critical comment. The analysis and conclusions expressed here are those of the authors and not necessarily those of the U.S. Energy Information Administration.

11
has suggested, high oil price volatility increases the opportunity cost of producing now in contrast to producing later, that is, waiting to see if the state of nature next period is associated with a spot price that is greater than the current spot price. Balancing these views Smith (2009) points out that price volatility provides incentives to hold inventories, but since inventories are costly, they may not be sufficiently large enough to fully offset the rigidity of demand and supply.9 In this section we concentrate on fundamental explanations for why price volatility may be high and may change over time. As with other questions highlighted earlier, the issue of whether speculation has also influenced volatility is treated in section 4. Kilian and Murphy (2010) use a structural VAR and monthly data for 1973-2009 to model the world price of crude oil. Their model attempts to account for shocks to the speculative demand for oil as well as shocks to fundamental demand and supply. The use of this model is motivated by two different views of oil price modeling. The first views the price of oil as being determined by shocks to the flow of supply and demand for oil, with little attention given to the role of inventories in smoothing oil consumption. The second views oil as an asset whose price is determined by desired stocks. In this view, changes in expectations of forward-looking investors are reflected in changes in the real price of oil and changes in oil inventories. Kilian and Murphy (2010) attempt to embed these two explanations within a single empirical model. The forward-looking element of the real price of oil is identified with data on inventories for the U.S. and other OECD producers. Their findings do not support explanations of the 2003-2008 oil price surge based on unexpected decreases in oil supplies or explanations based on speculative trading. Rather, the study finds that the surge of 2003-2008 was caused by fluctuations in the flow demand for oil driven by global economic activity. However, the study does find that speculative demand played an important role in determining oil prices during earlier periods, including 1979, 1986, and 1990. Kilian and Murphy (2010) note that opponents of the view that speculation caused high oil prices during 2003-2008 often cite a lack of noticeable increases in the rate of inventory accumulation during the same period. However, they point out that Hamilton (2009a) argues that speculative trading can, in theory, influence oil prices without any change in inventories if the short-run price elasticity of oil demand is zero. Hamilton observes that existing estimates of this elasticity in the literature are close to zero. Kilian and Murphy (2010) criticize existing estimates, though, and argue that they suffer from a downward bias because they are based on dynamic reduced form regressions that ignore the endogeneity of oil prices. Kilian and Murphy (2010) attempt to address this limitation 9 Fattouh (2005) conjectures that international oil companies have moved in the direction of reducing storage to reduce costs.
Thomas K. Lee | U.S. Energy Information Administration | This paper is released to encourage discussion and critical comment. The analysis and conclusions expressed here are those of the authors and not necessarily those of the U.S. Energy Information Administration.

12
with their structural VAR model. Their response estimates indicate that speculative demand shocks are associated with systematic inventory accumulation. They also use the model to construct estimates of the price elasticity of oil demand based on exogenous shifts of the oil supply curve along the oil demand curve. Without accounting for the role of inventories in smoothing oil consumption, their median estimate of the short-run price elasticity of oil demand is -0.44, seven times greater than conventional estimates in the literature. Alternatively, after accounting for inventories, their median estimate of the short-run price elasticity of oil demand is -0.26, about four times larger than conventional estimates. This leads Kilian and Murpthy (2010) to reject Hamilton’s theoretical requirement of zero or near-zero short-run price elasticity. Pindyck (2004) develops a structural model of inventories, spot prices, and futures prices that explicitly considers the role of volatility and estimates the model with daily and weekly data on crude oil, heating oil, and gasoline during 1984-2001. Pindyck (2004) finds that spot prices, inventories, and convenience yield do not cause volatility in crude oil and thus concludes that volatility is an exogenous variable. Weekly volatilities are estimated as sample standard deviations of adjusted daily log changes in prices. Pindyck (2004) finds however that the model performs poorly for the crude oil market. For heating oil, changes in volatility influence convenience yields and, to a lesser extent, inventories, but the effects are not large in magnitude. There is no strong evidence of such effects in the crude oil and gasoline markets. Furthermore, while changes in heating oil volatility can help explain changes in the spot-futures spread (convenience yield), it does not have explanatory power over the spot price itself. Pindyck (2004) concludes that the results fit the theoretical predictions for heating oil but not for crude oil and gasoline. Pindyck conjectures that the mixed results might be an artifact of model misspecifications or possibly that market variables affect production decisions more slowly than can be captured with weekly data. Pindyck also notes that speculation might also influence price volatility, which is not considered in the model. Baumeister and Peersman (2009) analyze changes in oil market dynamics during 1960-2008. The study is motivated by the fact that volatility in crude oil prices increased considerably during this period, while oil production fell substantially. The focus of the study is identifying the source of this puzzle. To this end, they estimate a time-varying parameter Bayesian vector autoregressive model with stochastic volatility in the innovation process. The model identifies three types of structural shocks that drive oil prices: oil supply shocks, oil demand shocks caused by economic activity, and demand shocks specific to the crude oil market. The shocks are identified via sign restrictions to allow for the immediate impact shocks on both prices and production that can vary with time. The main finding is that the oil price volatility puzzle can be attributed mostly to a
Thomas K. Lee | U.S. Energy Information Administration | This paper is released to encourage discussion and critical comment. The analysis and conclusions expressed here are those of the authors and not necessarily those of the U.S. Energy Information Administration.

13
substantial decrease in the price elasticity of oil supply and demand after the mid-1980s. Thus, market shocks of the same magnitude generate larger and larger price swings due to the steepening of the supply and demand curves. In addition, the analysis indicates that oil prices adjust rather quickly to their long-run equilibrium levels in response to shocks during the entire sample period. A recent study by Guerra (2008) which includes an analysis of the time series response of a shock to investment (measured as a shock to oil rig activity) finds only a slight impact on oil price changes, 8% of variation in price changes. Most of the studies that do examine the relation between oil rig count changes and oil price changes tend to parameterize the model to test whether expected prices influence oil rig activity, but do not allow for feedback from changes in oil rig activity to changes in prices. A good example of this literature is Ringlund, Rosendahl and Skjerpen (2008) who, like Guerra, conclude that a shock to oil prices has a significant immediate impact on oil rig activity. 2.2 Reduced form models An alternative to modeling spot prices explicitly from supply and demand fundamentals is to model the price process using a reduced form structure. Models in this class are more difficult to associate directly with fundamentals or investor behavior as they are designed to capture the net effects of these factors without explicitly modeling the underlying forces. 2.2.1 Model specifications Reduced form models are popular amongst short-horizon decision makers who trade in oil futures contracts or options on futures. The genesis of these models can be traced back at least to Black (1976) in his work on commodity derivatives. Modern thought on the construction of these types of models for oil prices stems from the work by Brennan and Schwartz (1985) and later Schwartz (1997). Numerous extensions of the basic framework by Schwartz and his coauthors as well as others have appeared in the literature. Because these models are largely used in the pricing of futures and options on futures for oil and consequently for devising hedging and speculation programs they may indirectly have important consequences if futures prices impact spot prices, a form of self-fulfilling result. We return to the question of whether price discovery occurs in the spot or futures market for oil later but as a preview point out that the empirical evidence suggests futures prices do influence spot prices for oil. There is ample evidence of the demand for platforms that allow the easy use of these models as evidenced by the number
Thomas K. Lee | U.S. Energy Information Administration | This paper is released to encourage discussion and critical comment. The analysis and conclusions expressed here are those of the authors and not necessarily those of the U.S. Energy Information Administration.
14
of commercial vendors who specialize in this area (see for example the website of Financial Engineering Associates http://www.fea.com/products/energy.asp). Reduced form models are designed around a framework in which one or more sources of randomness (commonly referred to as random factors) contribute to the total randomness of spot prices. A single factor framework is essentially a model in which there is a single source of ‘net’ uncertainty driving oil price changes. The fundamental source of the randomness however is not explicitly modeled but it is implied that the factor reflects the net effect of all fundamental sources of uncertainty. As already mentioned an ongoing debate exists regarding whether speculative trading activity can disrupt or increase the level of oil prices and the volatility (randomness) of oil prices. Non-structural models are agnostic on this potential force. If such effects do exist these models capture those influences along with all other fundamental randomness in a reduced form manner. This is not to say that one could not construct a ‘hybrid’ model in which key parameters of the model are functionally related to ‘non-price’ data such as relating the size of a price drift term or price volatility to a non-price measure of speculative trading activity.10 The notion of the ‘convenience yield’ plays an important role in many non-structural models and is a fundamental element of the modern theory of storage so a brief comment is warranted. Brennan and Schwartz (1985) define the convenience yield in the following manner: “The convenience yield is the flow of services that accrues to an owner of the physical commodity but not to the owner of a contract for future delivery of the commodity.” (p. 139), and go on to point out “…competition among potential storers will ensure that the net convenience yield of the marginal unit of inventory will be the same across all individuals who hold positive inventories.” (p. 140). Most reduced form models that incorporate a convenience yield actually use the net convenience yield measured as the convenience yield minus the cost of carry where the cost of carry includes storage costs as well as borrowing costs. Reduced form models of oil prices are generally couched in terms of the instantaneous dynamics of price changes and not the level of prices. The models are generally variations on Geometric Brownian Motion insuring that under the usual set of statistical distributional assumptions prices can never fall below 0. The development of these models has proceeded through various incremental stages with an eye towards identifying a structure that best fits the actual data. Best fit is generally defined not in terms of whether the spot price process fits the spot data but by whether the implied prices of derivatives (futures and options on futures) on the commodity are priced accurately under 10 The issue of speculative trading activity depending on the price and volatility might make such an exercise difficult. We briefly discuss hybrid models at the end of this section.
Thomas K. Lee | U.S. Energy Information Administration | This paper is released to encourage discussion and critical comment. The analysis and conclusions expressed here are those of the authors and not necessarily those of the U.S. Energy Information Administration.

15
a particular set of assumptions about the spot process. Recent work by Bernard, Khalaf, Kichian and McMahon (2008) tests the predictive accuracy of a suite of empirical models involving time varying volatility and jump dynamics (see discussion in section 2.3 on empirical models of oil prices), against a model developed by Schwartz and Smith (2000) that allows mean reversion to a stochastically changing long run mean. The authors study daily futures prices for NYMEX contracts maturing in 1, 2, 3 and 4 months for the period 1986-2007 and find the Schwartz and Smith model has the best out-of-sample predictive power. As it turns out, this specification is close in spirit to a model proposed and estimated by Pindyck (1999) that he fits using annual data.11 The logic behind mean reversion is fairly straightforward. The idea is that if the commodity price is too far away from its long-run equilibrium level, real forces will act to adjust supply and demand pushing prices back towards the long-run equilibrium. This creates a mean-reverting force. Interestingly, Schwartz and Smith show that the parameters of the mean reverting model have an equivalent representation based upon a model proposed by Schwartz (1997) in which there is no mean reversion but the drift in prices is influenced by a stochastically changing convenience yield. Table I provides a brief catalog of popular reduced form models. The ingredients of the class of reduced form models for oil prices tend to include combinations of the following characteristics: a) A constant mean spot price change per period, or mean reversion to a constant
long-run mean price level, or mean reversion to a stochastic long-run mean price level;
b) A constant spot price volatility, or a time varying stochastic spot price volatility;
c) A price jump process with a constant mean jump size and constant jump volatility, or a variable mean jump size and constant jump volatility;
d) A stochastic process describing the behavior of the instantaneous change in the ‘convenience yield’ which itself can follow a mean reverting process; and
e) A constant or stochastic risk free rate of interest. It should be recognized that refinements continue to be made and that models used by practitioners may exist which reflect further extensions. However, as pointed out earlier, the current popular and well performing model appears to be a mean reverting process that reverts to a stochastically changing mean, the Schwartz and Smith (2000) model. A recent extension of these models has been developed by Trolle and Schwartz (2010) in which the authors permit time varying volatility within the context of a model of time
11 We take mean reversion up again when discussing empirical evidence on the behavior of oil prices.
Thomas K. Lee | U.S. Energy Information Administration | This paper is released to encourage discussion and critical comment. The analysis and conclusions expressed here are those of the authors and not necessarily those of the U.S. Energy Information Administration.

16
varying convenience yields. Whether the Trolle and Schwartz model performs better in a predictive sense than the Schwartz and Smith model is unknown. Table I: Examples of Extant Reduced Form Stochastic Models of Oil Prices Label Stochastic Structure References Single Factor (Geometric Brownian Motion)
SdzσSdtμdS += Brennan and Schwartz (1985)
Simple Mean Reversion, Single Factor
( ) SdzσSdtSlnμκdS LR +−= (logarithm of the price assumed to follow a mean reverting process)
Schwartz (1997)
Two Factors, Random C*onvenience Yield
( )( )
dtρdzdzdzσdtδακδd
SdzσSdtδμdS
121
22δδ
11
=+−=
+−=
Gibson and Schwartz (1990); Schwartz (1997)
Mean Reversion to Stochastic Long Run Mean
ξχSln
dtρdzdz
dzσdtμξd
dzσdtχκχd
χξξχ
ξξξ
χχχ
+=
=
+=
+−=
Pindyck (1999); Schwartz and Smith (2000)
Mean Reversion with Jumps in Price
( ) KSdqSdzσSdtSlnKμκdS mLR ++−Φ−= Clewlow and Stickland (2000)
Notes: μ = mean or LRμ long run mean level of the price
iσ = volatility for process i δ = net convenience yield κ = mean reversion rate χ = the deviation of the spot price from its long term mean ξ = the long term mean price
K= jump with lognormal distribution ( )K1ln + ∼ ( )22
γm γ,K1N
2
−+ Φ = average number of jumps per year dq = Poisson process
Thomas K. Lee | U.S. Energy Information Administration | This paper is released to encourage discussion and critical comment. The analysis and conclusions expressed here are those of the authors and not necessarily those of the U.S. Energy Information Administration.

17
2.2.2 Is there any economic theory to back up the reduced form models? Reduced form models of oil prices are generally not constructed in settings in which the dynamics of spot prices are built up from fundamentals and reflect equilibrium dynamics. Rather, spot price behavior is heuristically ‘inferred’. This, of course, is a shortcoming of these models. Recently Carlson, Khokher and Titman (2007) have developed a model of spot price dynamics that extends the basic Hotelling framework to include uncertainty and in which prices as well as resource extraction decisions are endogenous. The authors assume the resource is finite, that is, can be exhausted. The shortcoming of the model is that storage decisions are not allowed. Their model contains two sources of uncertainty, demand uncertainty and technological uncertainty. Producers, who are assumed to be price takers, make output decisions that maximize the market value of their reserves net of the expected costs of extraction. The authors show that the equilibrium price dynamics of the model produces data that tend to fit (in sample) the Schwartz and Smith (2000) two-factor model reflecting mean reversion in the short run to a level that is itself uncertain. As mentioned above, the Schwartz and Smith model stands up to the data and is a popular format for oil prices. Kogan, Livdan and Yaron (2009) develop a model of optimal commodity production when investment in production capacity is irreversible and capacity is constrained, but also ignore storage. One conclusion of the model is that spot prices follow Geometric Brownian Motion (by assumption demand shocks in the model follow a GBM process), but that the drift term in the GBM model for prices can shift between two different regimes. The Kogan et al. model does not seem to be a satisfactory description of oil price dynamics.
2.2.3 Reduced form hybrid models and fundamental hybrid models Reduced form hybrid models take as a starting point one of the basic forms described above; however these models then use non-price data as a way to more faithfully incorporate fundamental effects. For example, suppose that historic analysis suggests jumps in the spot price are related to weather behavior. Further, suppose we utilize a meteorological model to describe the behavior of the weather (non-price information). By specifying a function connecting the mean jump size and the random ‘level’ or change in the level of the weather variable one could incorporate this non-price information making jumps in the price dependent on the weather. No academic work on this subject has appeared in the literature on oil prices as far as we can tell. Non-price information pertaining to oil could include specifying stochastic processes for discovery and reservoir development, weather related processes including extreme events such as hurricane
Thomas K. Lee | U.S. Energy Information Administration | This paper is released to encourage discussion and critical comment. The analysis and conclusions expressed here are those of the authors and not necessarily those of the U.S. Energy Information Administration.

18
activity, and processes modeling refinery outages and logistics problems. As Eydeland and Wolyniec (2003) point out, most models of this nature have been applied to the analysis of power (electricity) prices and these models are largely in the non-academic sphere. 2.3 Empirical models of oil prices and empirical regularities 2.3.1 General conclusions The literature examining the properties and stochastic behavior of prices for the nearby NYMEX WTI oil futures contract reaches several conclusions, perhaps most importantly as regards the volatility of oil prices. First, oil futures prices exhibit mean reversion and many hold the price reverts to a stochastically changing long-run mean which, in principle, should depend upon fundamentals. Second, the volatility of oil futures prices has become larger over time and volatility itself exhibits randomness. Third, volatility at any date is conditionally related to volatility in the recent past. Fourth, there is long-memory in volatility meaning that after controlling for the short term effects in the relation between current and past volatility, there is also a relation between volatility at longer lags. Related to these observations is the conclusion that oil prices exhibit jumps and that this leads to the result that the distribution of oil price changes exhibits ‘fat tails’. The above conclusions are drawn without any formal attempt to explain the findings. The issue of what drives oil futures price volatility and, for instance, the implications for the natural gas market have important policy implications and warrant additional research. In particular, the empirical evidence shows that oil prices and oil price volatility have historically influenced natural gas prices and natural gas price volatility, but not the reverse. Finally, anecdotal evidence suggests that the contemporaneous correlation between oil futures price changes (returns) and U.S. common stock returns is positive and has increased dramatically in recent years. The factors driving this closer association may, in turn, be related to those driving volatility, for instance speculation and the increased activities of hedge funds and commodity index funds. 2.3.2 General distributional characteristics of oil price changes Kat and Oomen (2007a), Chong and Miffre (2010), Büyükşahin, Haigh and Robe (2010), Erb and Harvey (2006) and Gorton and Rouwenhorst (2006) have investigated the general distributional characteristics of commodity price changes (returns). Kat and Oomen (2007a) and Chong and Miffre (2010) present results on crude oil futures while the remaining papers restrict attention to commodity indices. Kang et al. (2009) present similar results. Kat and Oomen address five questions in their study of daily futures
Thomas K. Lee | U.S. Energy Information Administration | This paper is released to encourage discussion and critical comment. The analysis and conclusions expressed here are those of the authors and not necessarily those of the U.S. Energy Information Administration.

19
settlement prices on 142 different (including different trading locations for the same commodity) commodities covering the period January 1965 – February 2005. The nearby light sweet crude oil futures contract traded on NYMEX is examined in their study. Chong and Miffre (2010) present results for the period January 1, 1981 to December 27, 2006. Kang et al. study daily data for the period January 6, 1992 to December 29, 2006. The following questions are examined by Kat and Oomen: a) Do commodities offer a risk premium?
b) Are commodity returns excessively volatile?
c) Are commodity returns positively or negatively skewed?
d) Do commodity returns exhibit “fat tails”?
e) Are commodity returns autocorrelated?
Summarizing the results of Kat and Oomen on crude oil: a) Crude oil exhibits sizeable and statistically significant annualized positive
excess returns, relative to the risk free return. Energy performs especially well during the start of a recession, but does particularly badly during the end of a recession. Energy and industrial metals tend to perform particularly well in a restrictive and particularly badly in an expansive monetary environment.
b) Light sweet crude oil exhibited an annualized daily standard deviation of return of 36.2% as compared with 29.5% for the components of the DJIA. Volatility varies with the business cycle as well as the monetary regime.
c) Crude oil returns exhibit little skewness after accounting for one extreme
event, the US invasion of Iraq on January 17, 1991 (“Operation Desert Storm”).
d) Crude oil returns exhibit significant kurtosis (fat tails).
e) Crude oil returns exhibit significant daily autocorrelation.
The results presented by Chong and Miffre (2010) in an examination of weekly data for the period 1/1/1981-12/27/2006 are consistent with the results presented by Kat and Oomen. Gorton and Rouwenhorst (2006), Erb and Harvey (2006) and Büyükşahin, Haigh and Robe (2010) restrict their investigations to analyses of commodity indices, which make statements about crude oil problematic.
Thomas K. Lee | U.S. Energy Information Administration | This paper is released to encourage discussion and critical comment. The analysis and conclusions expressed here are those of the authors and not necessarily those of the U.S. Energy Information Administration.

20
2.3.3 Price volatility
General results Regnier (2007) in a study of a monthly index of oil prices and the prices of commodities from the oil complex between 1945-2005 finds that oil price volatility has increased appreciably over time, with a structural break occurring roughly around 1973, the time of the OPEC oil crisis and again in 1981, as a result of price deregulation. She reports 5-year rolling estimates of the standard deviation of monthly log price changes. Regnier’s results also provide general support for the proposition that volatility of oil price changes varies over time. Stochastic volatility Evidence on time varying volatility in oil returns has been presented by numerous authors. Duffie, Gray, and Hoang (2004) for instance conclude from an examination of daily oil price data that volatility is stochastic and exhibits persistence. Statistical models of time varying volatility have largely focused on specifying the oil price change process as an ARMA – GARCH process. The consensus is that oil price changes exhibit conditional heteroskedasticity (Fong and See, 2002; Sadorsky, 2006; Agnolucci, 2009). Agnolucci examines daily data for the NYMEX WTI nearby futures contract for the period 31/12/1991 to 02/05/2005, and estimates a comprehensive menu of alternative specifications and extensions of the generic ARMA - GARCH model.12 Agnolucci concludes that a model popularly known as the Component GARCH (CGARCH) fits the data best. The CGARCH model of Engle and Lee (1999) was designed to better account for long-run volatility dependencies. Kang et al. (2009) also find that the CGARCH model fits daily oil price behavior for the WTI, Brent and Dubai prices. The essence of the result is that volatility changes over time, that volatility in the near future depends on recent volatility, and that volatility exhibits reversion to a time varying long-run volatility level. Lee and Zyren (2007) study historical volatility behavior for weekly crude oil as well as gasoline and heating oil spot and futures prices during the period January 1, 1990 to May 20, 2005. The authors present evidence that volatility in these markets shifted up around April 1999 when OPEC changed its production policies. The authors also find generally
12 Developments in the literature have extended the menu of possible models to a number too large to review here (see, Bollerslev, T. 2009. Glossary to ARCH (GARCH) at http://econ.duke.edu/~boller/Papers/glossary_arch.pdf).
Thomas K. Lee | U.S. Energy Information Administration | This paper is released to encourage discussion and critical comment. The analysis and conclusions expressed here are those of the authors and not necessarily those of the U.S. Energy Information Administration.

21
that while GARCH-type models fit most of the series well, heating oil price behavior is better explained by a TARCH model (a model permitting asymmetric responses to good and bad news). Finally, volatility of the petroleum product prices is larger than volatility of crude prices. Last, the authors show that volatility persistence is low. Trolle and Schwartz (2009) study daily settlement prices for the all futures contracts traded on NYMEX from 2 January 1990 until 18 May 2006. The authors propose a reduced form model (see discussion above and Table I) in which the spot price and the net cost of carry (convenience yield net of interest) are both subject to time varying variability. The authors fit the model to the entire futures term structure and find evidence that the model is a good fit. Volatility spillover A volatility spillover occurs when changes in price volatility in one market spill over to another market with a lag. There is relatively little work on the relation between the oil price volatilities across oil markets. Chang et al. (2010) study oil spot, forward and futures prices in four markets: Brent, WTI, Dubai/Oman and Tapis (Asia-Pacific). Their objective is to document whether volatility spills over across these markets. They study the period 30 April 1997 to 10 November 2008. The authors estimate a variety of bivariate GARCH-type models. The authors find evidence of volatility spillovers from Brent futures returns to Brent spot and forward returns, from Brent spot returns to WTI spot returns, and from WTI futures returns to Brent spot returns. Curiously they find no spillover from WTI futures to WTI spot. In addition, the results show that most of the Dubai and Tapis returns have volatility spillover effects with Brent and WTI returns in particular volatility shocks in the Dubai spot spillover to the WTI spot and vice versa. The authors conclude the evidence is consistent with the hypothesis that the Brent and WTI markets are two “marker” crudes that set crude oil prices and influence the other crude oil markets. The results are, however, somewhat at variance with another paper discussed below within the context of price discovery. In that paper Kaufman and Ullman (2009) study the linkages between the major spot and futures markets for oil and argue that the primary spot market is the Dubai. Those authors do not study volatility linkages. Clearly, additional work needs to be done on this issue before any definitive conclusions can be drawn. The extent of volatility interactions across markets, especially between commodity and financial markets is potentially of interest to both investors as well as policy makers seeking to forecast the impact of policy choices, especially monetary policy choices. Lee and Zyren (2009) study volatility interactions using daily data across four
Thomas K. Lee | U.S. Energy Information Administration | This paper is released to encourage discussion and critical comment. The analysis and conclusions expressed here are those of the authors and not necessarily those of the U.S. Energy Information Administration.
22
economically important market sectors, the U.S. stock market (proxied by the S&P 500 index), the commodity market, tilted towards the energy sector (proxied by the S&P Commodity Price Index), the foreign exchange market (proxied by EUR/US foreign exchange rate) and the U.S. bond market (proxied by the 3-month U.S. T-bill rate). Using a multivariate GARCH framework, the authors study the period January 2000 through August 2008. The authors document significant volatility linkages between these markets, concluding that for instance monetary policy actions targeting interest rates may have volatility impacts across markets that are of economic significance. Of specific interest to this report, the authors find the level of conditional covariance between the equity index and commodity index has increased in recent years, with exchange rates being an important factor driving the relation. Aside: Implied volatility of oil futures prices Implied volatility for a commodity such as oil is a market-based measure of forward looking expectations of price volatility. The process of calculating an implied volatility begins by first ‘assuming’ that a particular model for the pricing of options on futures for the commodity (in this case oil) is true. A crucial parameter for the valuation of options is the price volatility of the underlying asset or security expected to prevail over the life of the option. The second step in the process is to numerically recover the implied value of volatility that makes the current observed price of the option equal to the ‘formula’ price based upon the assumed model. It is not unusual to compute oil price implied volatilities by first invoking the model of Black (1976) for valuing options on commodity futures. Indeed, this is the model employed by the EIA (2009) for the purpose of computing confidence intervals for oil price forecasts. Szakmary et al. (2003) study the predictive content of implied volatility on oil futures for future realized volatility for the period 01/11/1989–02/05/2001. The authors find that implied volatility computed using the Black (1976) model is a better predictor of future realized volatility than is historical volatility computed from past price history. Bakanova (2010) performs a similar study on daily oil futures and options on futures data but utilizes a ‘model-free’ approach when computing implied volatility based upon results in Jiang and Tian (2005). The model free estimates, in other words, do not require the assumption that the Black (1976) model is true, only that there are no arbitrage opportunities.13 She examines the period November 1986-December 2006. The model free approach is similar to the method now used by the CBOE to compute the VIX index. Bakanova shows that implied volatility varies over time and also finds that model free implied volatility is a better predictor of future realized volatility than is historical volatility. No study has yet tested whether 13 The CBOE now uses a model free estimate of implied volatility when computing the VIX index. CBOE (2009). See Anderson and Bondarenko (2007) for details on model free estimation of implied volatility.
Thomas K. Lee | U.S. Energy Information Administration | This paper is released to encourage discussion and critical comment. The analysis and conclusions expressed here are those of the authors and not necessarily those of the U.S. Energy Information Administration.

23
implied volatilities from the Black model for commodities are or are not superior to model free implied volatilities. 2.3.4 Mean reversion There is general agreement that crude oil prices exhibit mean reversion, meaning generally that deviations from long-run equilibrium value for the oil price will be corrected over time. Bessembinder et al. (1995) in a study of daily crude oil futures prices for the period 1982:01-1991:12 (in which they proxy the spot price with the nearby futures price) conclude that crude oil prices are mean reverting for the sample period. Schwartz (1997) finds evidence of significant mean reversion based upon weekly oil futures price data for the period 1/2/1985-2/17/1995 and similarly concludes that mean reversion is present in the data. Pindyck (1999) analyzes 127 years of (real, deflated to a 1967 dollar basis) annual price data on crude oil for the period 1987-1996 on crude oil. Pindyck proposes a stochastic model of oil prices that incorporates mean reversion to stochastically fluctuating trendlines that represent long-run total marginal costs but are themselves unobservable. He estimates the model and provides evidence of mean reversion. Geman and Ohana (2008) present results based upon monthly data for the period 1983:01-2008:04 based upon unit root tests in the presence of structural breaks and reach conclusions similar to Pindyck. Geman (2007) also uses the nearby contract price to proxy for the spot price and concludes from a series of unit root tests that mean reversion was present for the period 1994-2000 but not for the period 2000-2004. However, Hamilton (2008) in an analysis of quarterly data for the period 1970-2008 concludes that oil prices follow a random walk with no drift while Dvir and Rogoff (2010) find that annual oil prices have gone through ‘epochs’ during which oil prices were persistent and highly volatile or alternatively exhibited no persistence and low volatility. 2.3.5 Jumps in oil prices As mentioned earlier, Kat and Oomen (2007a) identify significant excess kurtosis in the distribution of oil price changes, suggestive of the presence of jumps in oil prices (Das and Sundaram, 1999). A natural extension of the empirical models described above is to define the process of oil price changes as one exhibiting both stochastic volatility and random jumps. Lee, Hu and Chiou (2010) study daily spot prices and prices of the nearby futures contract for WTI for the period 2 January 1990 to 31 December 2007 and Gronwald (2009) examines daily spot price data for the period 30/03/1983 to 24/11/2008. Askari and Krichene (2008) examine both estimate such models and conclude that a jump process with a time varying jump intensity is not rejected by the data.
Thomas K. Lee | U.S. Energy Information Administration | This paper is released to encourage discussion and critical comment. The analysis and conclusions expressed here are those of the authors and not necessarily those of the U.S. Energy Information Administration.
24
2.3.6 Price patterns While natural gas prices follow a definite seasonal pattern this is not the case for oil prices. Regarding intraday patterns, Fotak, Linn, Zhu (2010) study the intraday pattern in the volatility of log price changes in the nearby NYMEX WTI contact by examining 5-minute interval price changes. The authors show that while intraday volatility at one time exhibited a U-shaped pattern, high at the beginning and ending of the trading day, this pattern largely vanished over the last five years of their study period, which ends January 1, 2008, although evidence of slightly higher volatility towards the end of the day is present during the final year. Lautier and Riva (2008) in a study of the nearby NYMEX WTI contract prices find that daily variances in price changes exceed overnight variances, measured from the close to open, and these are in turn greater than variances for the weekend, close Friday to open Monday. 2.3.7 Long memory persistence in price changes and volatility Cunado, Gil-Alana and de Gracia (2010) test for long-memory (persistence) in oil daily oil futures prices from NYMEX. They study two contracts, the first over the period 1983-2008 and the second over 1985-2008. A variety of test statistics, parametric as well as non-parametric are employed in the tests, including Lo’s modified rescaled range statistic. The authors find no statistically significant evidence of long memory in log price changes in oil futures for the nearby month contract and for the fourth nearest maturing contract. However, tests for long memory in the series of absolute daily log price changes (where the absolute return is used as a proxy for volatility) show that the absolute return series exhibits long memory. Kang et al. (2009) concentrate their study on long memory in the volatility series. The approach they take is to fit models from the GARCH family to daily spot oil price data for the period January 6, 1992 to December 29, 2006. Kang et al. (2009) estimate models for WTI, Brent and Dubai prices separately and find the CGARCH model performs best in out-of-sample forecasts for WTI (see also discussion above on stochastic volatility). 2.3.8 Oil prices and natural gas prices Villar and Joutz (2006) examine the relation between changes in U.S. oil prices and changes in U.S. natural gas prices using monthly data for the period 1989-2005. Villar and Joutz suggest that an increase in oil prices may lead to an increase or a decrease in natural gas prices. Essentially if oil prices rise users substitute gas for oil placing upward pressure on gas prices (a demand effect). Likewise, as regards supply effects, if oil prices
Thomas K. Lee | U.S. Energy Information Administration | This paper is released to encourage discussion and critical comment. The analysis and conclusions expressed here are those of the authors and not necessarily those of the U.S. Energy Information Administration.

25
rise, generating increased drilling activity, more gas may be produced as a byproduct placing downward pressure on prices. Conversely more oil drilling places upward pressure on the factors of production shared between oil and gas (for instance oil rigs) which could decrease gas production and increase gas prices. Finally an increase in oil prices may lead to greater cash flows for oil and gas producers and more resources for gas development projects and production, potentially pushing prices down. The authors find that oil price changes cause natural gas price changes but not the reverse. Brown and Yucel (2008) study weekly price data from January 1994-July 2006 and also reach the conclusion that causality runs from oil prices to natural gas prices but not in the other direction. Hartley et al. (2008) in a related study of monthly prices conclude that oil prices influence fuel oil prices which in turn influence natural gas prices, but that natural gas prices do not influence oil prices. Work on volatility transmission between the oil and gas markets is very limited. Pindyck (2004) tests the relation between oil and natural gas price volatility. He concludes that oil price volatility influences natural gas price volatility but natural gas price volatility does not influence oil price volatility. In general the result that oil prices influence natural gas prices but not the other way around is exactly what one would expect given that oil prices are determined in a global market while natural gas prices are determined in a local market.14 2.3.9 Contemporaneous correlation between oil price changes and stock returns: Have
oil futures become more like stocks? Evidence for the period up to roughly 2006 (Kat and Oomen, 2007b; Chong and Miffre, 2010) indicates that unconditional as well as conditional contemporaneous correlations computed using a GARCH based model of dynamic conditional correlation between crude oil futures returns and stock returns (as well as bond returns) are close to zero and tend to not be statistically significant. While evidence suggests that lagged changes in oil prices may influence stock returns, there is no evidence that causality runs in the opposite direction.
14 Ewing, Malik, and Ozfidan (2002) get close by studying daily stock returns on an index of U.S. oil stocks and an index of U.S. natural gas producer stocks for the period 1 April 1996 to 29 October 1999. Using a multivariate GARC type model they find that volatility of the oil stock returns is related to past volatility of the natural gas stock returns. It must be remembered however that Ewing, Malik, and Ozfidan do not directly test whether the volatility of oil price changes is related to the volatility of natural gas price changes.
Thomas K. Lee | U.S. Energy Information Administration | This paper is released to encourage discussion and critical comment. The analysis and conclusions expressed here are those of the authors and not necessarily those of the U.S. Energy Information Administration.

26
Recent anecdotal evidence on contemporaneous correlation Around the start of the recent financial crisis oil prices and stock prices began to move more in sync. In a recent WSJ article (Cui, C. 2010. Stocks, Oil Moving in Lockstep, WSJ, August 16, 2010)15 the author claims that the correlation is approaching 70%, up from the roughly 34% since 2008. Industry experts quoted appear to speculate that oil futures now attract significant investment funds similar to investment in common stocks, and that the movement towards treating oil futures like investment assets has joined stocks and oil futures ‘at the hip’. We could discover no direct academic work that focuses on the most recent periods. 3. Macroeconomic factors and oil prices The literature on the macroeconomy-oil price relationship can be classified broadly into studies that examine how oil prices affect macroeconomic variables, such as economic output or growth, interest rates, and exchange rates,16 and papers that study how macroeconomic variables affect oil prices. The major focus of this review is on the latter group. Although empirical evidence on their validity is sometimes mixed, theoretical links have been established between, for example, interest rates and inflation (the Fisher Effect), interest rates and exchange rates (Interest Rate Parity), and inflation rates and exchange rates (Purchasing Power Parity). Due to endogeneity in the relationships that may exist across macroeconomic variables and between macroeconomic factors and energy prices, researchers often face significant challenges when empirically modeling their relationships. Nonetheless, there is an ample body of evidence suggesting that macroeconomic conditions affect world oil prices. In what follows, we review this evidence with a special focus on the recent literature. 3.1 Interest rates and monetary policy Barsky and Kilian (2002, 2004) argue that macroeconomic conditions play a significant role in determining oil prices. They study the relationships between U.S. monetary policy, economic growth, and oil prices from the 1970s to the early 2000s and note that the sharp increases in the price of oil in 1973-1974 and 1979-1980 were both preceded by economic expansion and abnormally low real interest rates. The decline in oil prices that occurred after 1982 coincided with a global recession and unusually high real U.S.
15 (http://online.wsj.com/article_email/SB10001424052748703382304575431332123881218-lMyQjAxMTAwMDIwNDEyNDQyWj.html) 16 Recent studies include Sauter and Awerbuch (2003), Chen (2009), Cologni and Manera (2008), Hamilton (2008), Herrera and Pesavento (2009), and Lizardo and Mollick (2010).
Thomas K. Lee | U.S. Energy Information Administration | This paper is released to encourage discussion and critical comment. The analysis and conclusions expressed here are those of the authors and not necessarily those of the U.S. Energy Information Administration.
27
interest rates. They conclude that monetary expansions (contractions) have a causal effect leading to positive (negative) oil price shocks. In their view, monetary conditions influence oil demand, and therefore prices, through economic growth. As outlined in Frankel (2006) and IMF (2008), interest rates may also influence oil prices through a number of other channels related to the opportunity cost of investing in real assets. These include (1) affecting storage costs, (2) affecting firms’ decisions pertaining to when oil is extracted, since the opportunity cost of leaving oil in the ground should vary with prevailing interest rates, and (3) affecting investors’ relative demand for holding commodities vs. money market instruments. Using weekly data from 1982-2002, Frankel (2006) purports some evidence of a contemporaneous negative correlation between oil inventories and real U.S. interest rates. He concludes that interest rates significantly influence firms’ desire to hold inventories. He also reports negative correlations between real US interest rates and the real prices of several broad commodity indices. However, he fails to find a significant correlation between real interest rates and the real price of oil. In contrast to the conclusions of Frankel (2006), the Interagency Task Force on Commodity Markes (2008) lead by the CFTC finds no evidence of a significant relationship between known OECD oil inventories and interest rates. Akram (2009) uses quarterly data during 1990-2007 and a structural VAR model to examine the relationships between real oil prices, interest rates, and the US dollar exchange rate. The analysis consists of a vector autoregressive (VAR) model that includes the real oil price, a measure of global activity, real short term U.S. interest rates, and the effective real exchange rate for the US dollar. Akram (2009) finds that real oil prices increase in response to negative interest rate shocks and that oil prices tend to display overshooting behavior in response to such shocks. That is, oil prices fall immediately and thereafter increase gradually in response to a negative real interest rate shock. A fall in the value of the dollar due to an exchange rate shock tends to cause higher oil prices. Akram (2009) concludes that interest rate and exchange rate shocks account for substantial shares of fluctuations in commodity prices at all horizons. Krichene (2006) empirically models the demand for oil as a function of interest rates and the US dollar exchange rate. The analysis indicates that nominal effective exchange rate for the US dollar and US interest rates (federal funds rate and, alternatively, short term Treasury rates) act negatively on oil demand and prices. Additionally, causality between interest rates and oil prices runs in both directions and depends on the type of oil shock. During a supply shock, rising oil prices cause interest rates to increase, whereas during a demand shock, falling interest rates cause oil prices to rise. Krichene (2006) concludes that sustained increases in oil prices in 2004–2005 can be explained by an excessively
Thomas K. Lee | U.S. Energy Information Administration | This paper is released to encourage discussion and critical comment. The analysis and conclusions expressed here are those of the authors and not necessarily those of the U.S. Energy Information Administration.

28
expansionary monetary policy and record low interest rates. Krichene (2008) reaches similar conclusions using updated data and LIBOR rather than US interest rates. In addition, Krichene (2008) quantifies the effects of LIBOR and the dollar exchange rate on oil prices with variance decomposition analyses. The results indicate that the effect of LIBOR on oil prices explains up to 20% of the oil price variance at a horizon of three months and about 41% percent at a horizon of 30 months. Similarly, the effect of the US dollar nominal effective exchange rate explains up to 25% of the oil price variance at a horizon of seven months and remains important over longer horizons. Krichene (2008) concludes that expansionary monetary policies in industrial countries and the recent depreciation of the US dollar helped to fuel the recent oil price boom. Anzuini et al. (2010) investigate the empirical relationship between US monetary policy and commodity prices using monthly data during 1970-2009. While numerous studies have used interest rates as an indicator of monetary policy stance, they argue that interest rates alone may not fully represent the impact of a monetary policy shock and, more importantly, that interest rate movements may reflect the endogenous response of monetary policy to the general developments of the economy. Thus, Anzuini et al. (2010) use a methodology that identifies US monetary policy shocks in a VAR system that includes the federal funds rate, the money stock (M2), the consumer price index, the industrial production index and a commodity price index. After identifying a shock, commodity prices are then projected onto the shock in order to single out the price response. They find that an expansionary monetary policy shock drives up commodity prices, including oil prices. However, somewhat in contrast to the conclusions of Akram (2009) and Krichene (2006, 2008), Anzuini et al. (2010) conclude that the effect of monetary policy shocks on oil prices are not large and, hence, a US expansionary monetary policy alone is not likely to cause a major surge in prices. Hamilton (2009a) attributes the most recent rise in oil prices that culminated in summer 2008 mostly to strong world demand and stagnant supply. However, he notes that the rapid decline in short-term US interest rates in the first quarter of 2008 could have exacerbated the boom by encouraging speculative investment in physical commodities. 3.2 Exchange rates and the value of the dollar Breitenfellner and Cuaresma (2008) and IMF (2008) summarize the various channels of a negative causal relation between the US dollar exchange rate and oil prices. First, because oil is priced in US dollars, depreciation of the dollar may increase consumers’ demand for oil in non-dollar regions since it makes oil less expensive in the foreign currency. Second, US dollar depreciation will decrease the foreign currency profits of
Thomas K. Lee | U.S. Energy Information Administration | This paper is released to encourage discussion and critical comment. The analysis and conclusions expressed here are those of the authors and not necessarily those of the U.S. Energy Information Administration.

29
non-US producers, which may lead to price pressures on the supply side. Third, dollar depreciation reduces the returns on dollar-denominated financial assets in foreign currencies and, hence, may increases the attractiveness of investing in commodities like oil to foreign investors. In addition, commodities might become more attractive to US investors as a hedge against inflation if depreciation of the dollar tends to increase expectations of greater inflation. Fourth, depreciation of the dollar could lead to expansionary monetary policies in non-US economies, especially in countries with currencies pegged to the dollar. Lower interest rates and larger money supplies could lead to increased demand for oil. As previously mentioned, studies by Akram (2009) and Krichene (2006, 2008) conclude that changes in the US dollar exchange rate have economically significant consequences for the price of oil, with oil prices responding positively to negative shocks to the value of the dollar, a view that is also shared by industry analysts (see, for example, Diwan (2008), and Deutsche Bank (2008 & 2009)). Using a less recent sample period (1989-1999), Yousefi and Wirjanto (2004, 2005) also find that value of the dollar significantly affects oil prices. More recently, a study by the International Monetary Fund (IMF, 2008) uses a reduced-form price equation to explain oil price movements with the US dollar exchange rate along with total world industrial production, the federal funds rate, and OECD oil inventories. The study concludes that the nominal effective US dollar exchange rate has a significant impact on the nominal crude oil price in both the long and the short-run. In the long-run (12–24 months), a one percent decline in the nominal value of the US dollar is associated with an increase of the nominal oil price of about one percent. The study also finds that the long-run impact of the real effective exchange rate on real oil prices is even stronger. The study estimates that if the dollar exchange rate had remained at its 2002 peak through the end of 2007, nominal oil prices would have been lower by around $25 a barrel at the end of 2007. He, Wang, and Lai (2010) empirically model world demand for oil as a function of global economic activity and the US dollar exchange rate. Using monthly data from 1988-2007 and a vector error correction model, they find a negative causal relationship running from the exchange rate to real oil prices. Their estimates of the long-run relationship between oil prices and the exchange rate indicate that a one percent decline in the value of the dollar leads to a 0.7% increase in the real price of oil. Breitenfellner and Cuaresma (2008) examine the ability of the US dollar/euro exchange rate to forecast nominal oil prices. They find a negative relationship between the two and that the exchange rate significantly improves oil price forecasts. However, their Graunger causality tests are inconclusive with respect to the direction of causality. They note that
Thomas K. Lee | U.S. Energy Information Administration | This paper is released to encourage discussion and critical comment. The analysis and conclusions expressed here are those of the authors and not necessarily those of the U.S. Energy Information Administration.

30
even though the dollar/euro exchange rate possesses significant forecasting ability for oil prices, causality from the exchange rate to oil prices is not necessarily implied because the dollar/euro market may be much more efficient and may impound information more quickly than the world oil market. Their conjecture that oil prices may be less efficient than exchange rates is supported by Kilian and Vega (2008), who find that oil prices do not respond immediately to macroeconomic news announcements. As noted by the CFTC’s Interagency Task Force on Commodity Markets (2008), while important, depreciation of the dollar likely only explains a portion of the overall run-up in oil prices during the recent price boom of 2002-2008. During this period, oil prices measured in all currencies rose sharply. Moreover, from mid-March through June 2008, a period which saw substantial appreciation in the price of oil, the dollar exchange rate was relatively stable.
3.3 Economic growth/activity Hamilton (2009a) argues that the most important principle for understanding short-run changes in the price of oil is that income rather than price is the key determinant of oil demand. As support for this assertion, Hamilton (2009a) cites the fact that, despite large fluctuations in the price of oil, historically US oil consumption has tracked US GDP remarkably well. Additionally, Killian (2009), Kesicki (2010), and Radetzki (2006) point out that many notable commodity price booms of the 19th century, including the most recent one, were preceded by or occurred contemporaneously with high global economic growth. Several studies have developed econometric models of oil supply and demand in which the demand equation is a function of oil prices and global economic activity. Using measures based on GDP, Gately and Huntington (2002), Griffin and Schulman (2005), and Krichene (2006) find that global economic activity impacts crude oil prices. More recently, Kilian (2009) uses a newly developed measure of global economic activity (the Kilian economic index) and proposes a structural model that decomposes the real price of crude oil into three components: supply shocks, shocks to the global demand for all industrial commodities, and demand shocks that are specific to the crude oil market. He finds that a positive shock to aggregate demand in global commodity markets caused by global economic activity results in a large, persistent increase in the real price of oil. He concludes that the most recent oil price boom during 2003-2008 was driven by repeated positive shocks to the demand for industrial commodities including oil. He further concludes that increases in the demand for oil after 2002 were driven primarily by unexpected growth from countries outside of the OECD, a finding that is consistent with
Thomas K. Lee | U.S. Energy Information Administration | This paper is released to encourage discussion and critical comment. The analysis and conclusions expressed here are those of the authors and not necessarily those of the U.S. Energy Information Administration.

31
the notion that much of the recent boom was driven by strong growth in emerging economies such as China and India. He, Wang, and Lai (2010) empirically model world demand for oil as a function of global economic activity and the US dollar exchange rate and find that real prices of crude oil are cointegrated with the Kilian economic index and that the Kilian economic index Granger causes oil prices in the long run. They also find that the adjustment process of crude oil prices to permanent changes in the Kilian economic index takes longer than those to permanent changes in the value of the US dollar. Lippi and Nobili (2009) focus on whether US economic activity impacts oil prices by using changes in US industrial production and the CPI to identify shocks to US aggregate demand and supply. They find that about twenty to thirty percent of the variation in oil prices during their sample period (1973-2007) is due to shocks to US aggregate demand. Kilian and Hicks (2009) explicitly focus on the recent oil price boom and examine whether unexpectedly high economic growth fueled the surge in prices. They adopt a novel approach that identifies revisions to professional GDP forecasts provided by the Economic Intelligence Unit during 2000-2008 as exogenous shocks to real economic activity (and therefore to oil demand). They first document that, starting in mid-2003, professional forecasters were repeatedly surprised by high economic growth in emerging economies. In contrast, forecasters were less surprised by growth in OECD economies. Second, they find significant oil price responses to forecast errors. Unexpected growth in China is associated with a large response that builds slowly and peaks after one year. They also document a significant response to a weighted aggregate of forecast errors for the United States, Germany and Japan. Their decomposition analyses show that unexpected growth in emerging economies as well as advanced economies explains much of the surge and subsequent decline of the real price of oil during 2000-2008. They conclude that unexpected growth in emerging economies played a central role in driving up oil prices but that it was also aided in part by unexpectedly high growth in some OECD economies, especially Japan. Similarly, they conclude that much of the decline in the real price of oil after mid-2008 is explained by large negative growth shocks to emerging and OECD economies. Recent studies by the UK Cabinet Office (2008) and the CFTC’s Interagency Task Force on Commodity Markets (2008) reach conclusions consistent with those of Kilian and Hicks (2009) regarding the impact of economic growth in emerging economies on oil prices during the recent surge. The Cabinet Office (2008) concludes that “The main drivers of global oil demand have been emerging economies like India and China, where growth in recent years has been more than double that of advanced economies. Strong economic performance, combined with a higher oil intensity of GDP in these economies,
Thomas K. Lee | U.S. Energy Information Administration | This paper is released to encourage discussion and critical comment. The analysis and conclusions expressed here are those of the authors and not necessarily those of the U.S. Energy Information Administration.

32
has been responsible for much of the growth in oil demand. Approximately 60% of oil demand growth between 1980 and 2006 was accounted for by China, India, and the Middle East, with OECD countries accounting for 30%.” Similarly, in a study that was released in July 2008, the CFTC’s Interagency Task Force on Commodity Markets concludes “The key driver of oil demand has been robust global economic growth, particularly in emerging market economies. World gross domestic product (GDP) growth (with countries weighted by oil consumption shares) has averaged close to 5 percent per year since 2004, marking the strongest performance in two decades. In addition to the pace of world economic activity, oil demand has been further supported by the composition of growth across countries. China, India, and the Middle East use substantially more oil to produce a dollar’s worth of real output than the United States. These economies are among the fastest growing in the world; together they have accounted for nearly two-thirds of the rise in world oil consumption since 2004.” 4. Speculation in physical and derivatives markets
The 2007-2008 run-up in oil prices and sharp price decline in late 2008 together with the growth in oil derivatives trading by hedge funds and commodity index funds has renewed debate about the impact of speculation on commodity prices and volatility. Papers arguing that at least some oil price movements in recent years have been due to speculation include: Staff Report of US Senate Permanent Subcommittee on Investigations (2006), Masters (2008), Einloth (2009), Kaufmann and Ullman (2009), Sornette et al. (2009), Phillips and Yu (2010), Parsons (2010), and Singleton (2010). Papers arguing that speculation has had little or no impact include: Interagency Task Force on Commodity Markets (hereafter ITFCM) (2008), Gilbert (2008), International Energy Agency (July 2008), IMF (2008), Brunetti and Büyükşahin (2009), Büyükşahin and Harris (2009), Hamilton (2009a), Irwin et al. (2009), Kilian and Murphy (2010), and the OECD Working Party on Agricultural Policies and Markets (2010) (hereafter OECD).
4.1 An oil price bubble?
In a financial bubble, past price increases (which may themselves have been due to fundamentals) lead traders to expect prices to continue to rise because they have risen in the past. Thus, there is a feedback effect in which past price increases lead to further price increases. Some traders may realize that current prices are too high relative to supply-demand fundamentals but buy anyway in the view that they can sell to a “greater fool” before the bubble bursts. Eventually a price decline shatters the perception that prices will rise forever and a large sudden price drop is observed.
Thomas K. Lee | U.S. Energy Information Administration | This paper is released to encourage discussion and critical comment. The analysis and conclusions expressed here are those of the authors and not necessarily those of the U.S. Energy Information Administration.

33
Thus, the fairly persistent rise in the price of oil from 2003 to 2007 followed by the rapid rise in the price of oil in 2007 and 2008 to a high of around $140 a barrel in July 2008 and its sudden collapse to $40 fit the classic bubble pattern. Several studies have looked for other signs of bubble like behavior in oil prices over this period and have concluded that the oil price pattern shows evidence of a bubble. Based on their analyses of the oil price pattern, Phillips and Yu (2010) and Sornette et al. (2009) find evidence of a bubble in oil prices in 2008. Phillips and Yu (2010) date the oil price bubble from March 2008 to August 2008. Sornette et al. (2009) date the bubble from May 2008 through July 2008. There is also a strong view within some oil and financial industry groups that the entry of speculators (perhaps attracted by unrealistic high oil price forecasts) led to the creation of an oil price bubble (Gheit (2008), Guilford (2008), Lehman Brothers (2008), Masters and White (2009), and Steeland (2008)). However, using a variant of the Phillips-Yu procedure, Gilbert (2009) finds no evidence of a bubble. Caballero et al (2008) argue that when the housing bubble burst in early 2008 and financial institutions became suspect, investors switched to commodities in general and oil in particular leading to an oil bubble.
4.2 The market manipulation issue
Discussions in the press of the 2007-2008 oil price run-up and subsequent sharp decline sometimes raise the possibility of market manipulation. Reflecting the widespread belief among economists that such manipulation is highly unlikely and that there is no evidence to support it, there has been almost no research attention to this issue. An exception is Just and Just (2008) who build a theoretical model to show that a large monopolistic producer, i.e., OPEC, could profit from such a strategy. While their model is more involved, they essentially sketch out a classic corner in which the monopolist longs a large number of futures contracts on which it then demands delivery as the futures contracts expire. In order to make delivery, those who shorted the futures contracts are forced to buy from the monopolist in the physical market at prices he dictates. In developing their de novo model, Just and Just (2008) were apparently unaware of the history of and literature on corners. While their model is theoretical and Just and Just do not say this manipulation was actually responsible for the 2007-2008 price runup, it should be noted that their model predicts an increase in inventories, for which (as discussed below in reference to other papers) there is little evidence. Also the CFTC’s large trader reporting system is designed to prevent corners.
4.3 Speculation and futures prices
While the bubble studies look for patterns in oil prices, other studies have looked for a causal link between speculation and oil prices. We find it useful to divide our discussion
Thomas K. Lee | U.S. Energy Information Administration | This paper is released to encourage discussion and critical comment. The analysis and conclusions expressed here are those of the authors and not necessarily those of the U.S. Energy Information Administration.
34
of the evidence on the impact of speculation on oil prices into two categories: 1) tests of the impact of speculation on futures/forward prices and 2) evidence of the impact of speculation on physical or spot prices of oil. We start with the first issue.
The Staff Report of US Senate Permanent Subcommittee on Investigations (2006), Masters (2008), and numerous commentators in the business and financial press point to the rapid growth in recent years in oil derivatives trading by such non-commercial traders as hedge funds, commodity swap dealers, and commodity index funds and conclude that price movements over the same period were likely caused by these speculators. As discussed in the previous section, many papers have documented this rapid growth in non-commercial trading including those who argue that speculation is not responsible for the recent energy price movements, such as the ITFCM (2008), and OECD Working Party on Agricultural Policies and Markets (2010).
At a basic level, few would deny that trading by speculators impacts futures prices since in the typical finance textbook presentation it is speculators who insure that futures prices reflect expected future supply and demand conditions. In the common textbook scenario, if current futures prices are below expected future spot prices, speculators can expect to profit by longing futures thus raising current futures prices toward the expected future spot price level. If current futures prices are above expected future spot prices, speculators can expect to profit by shorting futures. Thus speculators have an incentive to study likely future supply/demand conditions and trade accordingly and it is their trading which insures that current futures prices reflect expected future supply/demand conditions. Hence speculation is crucial to the price discovery role of futures markets.
However, several market observers have alleged that in recent years non-traditional speculation has pushed futures prices away from, not toward, levels reflecting rational analysis of likely future supply/demand conditions. In this regard, considerable attention has focused on commodity index funds, such as the United States Oil Fund or funds mimicking the Standard and Poors - Goldman Sachs Commodity Index, which (as discussed in section 5 below) grew considerably between 2006 and 2008. These have received particular scrutiny since, unlike traditional speculators who hold long positions when they expect future spot prices to rise and short positions when they expect prices to fall, index funds hold only long positions thus potentially putting upward pressure on futures prices if not balanced by other traders with short positions. In particular, the Staff Report of US Senate Permanent Subcommittee on Investigations (2006), Masters (2008), and to some extent Parsons (2010) and JP Morgan (2005, 2007) hypothesize that trading by these firms has pushed futures prices above levels justified by rational expectations of future supply and demand.
Thomas K. Lee | U.S. Energy Information Administration | This paper is released to encourage discussion and critical comment. The analysis and conclusions expressed here are those of the authors and not necessarily those of the U.S. Energy Information Administration.

35
Several strands of evidence have been presented to refute this argument. If futures prices are pushed above levels reflecting rational expectations of future supply and demand by index fund trades, one would expect other (more rational) speculators to expect to make profits by shorting futures and to trade accordingly. As Irwin et al. (2009) point out, while the supply of oil is limited, the supply of futures is not. So increased demand by those wishing to long crude oil futures need not raise the futures price if matched by an increase in those wishing to short the futures. Along these lines, the ITFCM (2008) reports that in 2008 the net long position, i.e., long-short, of the swap dealers category, which includes both index funds and OTC swap dealers declined from 2006 to 2008 and was actually negative in the first five months of 2008. They write, “This suggests that flows from commodity index funds have been offset by other swap dealer activity and thus have not necessarily contributed to the recent price increases in crude oil.” (p. 22).
Büyükşahin and Harris (2009) and Till (2009) argue that while non-commercial trading in energy markets has increased substantially relative to commercial trading, the growth in Working’s “T” index of speculative trading which seeks to relate speculative trading to the needs of hedgers based on their long-short imbalance has been much more moderate and has not been above levels observed in other markets.
Index funds generally hold long positions in the nearby or next nearby futures contract only rolling over from the nearby to the next nearby when days to expiration of the nearby fall below a set minimum. Thus if trading by these funds impacts futures prices, it should be concentrated in the nearby and next nearby contracts. Testing whether the roll trades of these index funds impacts the backwardation/contango pattern at the short end of the futures term structure seems an obvious way to test whether and how much trading by these firms impacts futures prices which has not to our knowledge been pursued.
4.4 Granger causality
The ITFCM (2008), Büyükşahin and Harris (2009), Brunetti and Büyükşahin (2009), Gilbert (2009), Aulerich et al. (2010), and the OECD Working Party on Agricultural Policies and Markets (2010) have employed Granger causality tests to examine whether the positions of non-commercial traders in general or index funds, swap dealers, or hedge funds in particular lead or lag changes in crude oil futures prices. All find no evidence that changes in the long-short positions of hedge funds, swap dealers, or other non-commercial traders lead futures’ price changes. In contrast, they find evidence that futures price changes lead some position changes suggesting that traders are adjusting their positions in response to past price changes. Similar Granger causality tests have been applied to agricultural commodities by Irwin, Sanders, and Merrin (2009), Aulerich,
Thomas K. Lee | U.S. Energy Information Administration | This paper is released to encourage discussion and critical comment. The analysis and conclusions expressed here are those of the authors and not necessarily those of the U.S. Energy Information Administration.

36
Irwin, and Garcia (2010), and Sanders and Irwin (2010). They find no evidence that position changes by various speculator groups Granger cause price changes.
While most studies find no evidence that position changes by any speculator groups Granger-cause changes in the oil futures price, a few find weak evidence of possible Granger causality. Gilbert (2009) finds some evidence that index fund position changes Granger cause changes in prices of oil futures but concludes this impact is minor. Using a slightly different Vector Error Correction Model, Gurrib (2007) finds a small but statistically significant tendency for non-commercial trader positions to lead oil futures prices. At a longer lag he finds a tendency for futures prices to lead position changes. Bryant et al. (2006) cannot reject the hypothesis that long position changes lead futures price changes.
These studies are careful to point out that Granger causality just establishes lead/lag relationships and does not imply causality in an economic/structural sense. Nor, we would emphasize, does a finding of no Granger causality imply that trading by index funds, hedge funds, and others do not cause price changes. Granger causality tests are more appropriate when there is some reason to expect some time lag, e.g., an increase in household income this week may impact consumption spending next week. Or one market, such as the futures market, may tend to lead another, such as the oil spot market, because informed traders trade there first. But there is no reason to expect a delay in the impact of speculator trades on oil futures prices. By the time the position change is observed, the trade has already occurred. Trading by any trading group should impact futures prices at the time of the trade, not the next day or week. Thus a finding that trades by a particular group do not lead price changes establishes that they are not able to anticipate future price changes and trade ahead of them - not that their trading does not impact prices. Indeed Büyükşahin and Harris (2009) report a significant positive correlation between hedge fund position changes and same day changes in the futures price which is what one would expect if their trades impact prices but of course it is also possible that the price changes cause the position changes. In short, neither contemporaneous correlations nor Granger causality tests shed much light on the extent to which futures prices are impacted by speculation. As discussed above, speculation should impact oil futures prices. The more important question is whether or not speculation causes futures prices to reflect rational analysis of likely future supply-demand conditions. Granger-causality tests are silent on that question.
4.5 Speculation and physical oil prices
If speculation affects oil futures and forward prices, the next question is how, if at all, this translates into an effect on physical oil prices. As Hamilton (2009a) puts it, “Masters
Thomas K. Lee | U.S. Energy Information Administration | This paper is released to encourage discussion and critical comment. The analysis and conclusions expressed here are those of the authors and not necessarily those of the U.S. Energy Information Administration.

37
[referring to Masters (2008)] argues that the effect [of commodity index funds and other speculation] was to drive up the futures prices and with it the price of the associated spot commodity itself....The key intellectual challenge for such an explanation is to reconcile the proposed speculative price path with what is happening to the physical quantities of petroleum demanded and supplied.” As Smith (2009), IEA (2008) and others point out, there is no direct connection between the futures and physical markets as actual physical delivery of oil to settle futures contracts is rare. For every trader longing or buying a futures contract, there must be another shorting or selling and neither need have the physical oil. If speculation in energy derivatives impacts the physical or spot prices of oil, it must be through impacting current physical supply and/or demand.
Much like the studies discussed above that test whether non-commercial or index fund position changes Granger-cause futures price changes, a couple of studies have used Granger and other causality tests to test if futures market prices lead or lag spot prices. For the WTI markets, Bekiros and Diks (2008) find that Granger causality runs both ways with futures market prices leading spot prices at times and spot prices leading futures at other times. Kaufmann and Ullman (2009) test for Granger causality among a number of oil spot and futures markets around the world using weekly price data and find a web of relationships with causation flowing in both directions. However, they observe several cases in which futures prices are found to lead spot prices leading them to conclude, “Our results provide support for the role of speculation in the recent rise of crude oil prices.”
In the Granger causality studies, it is not generally clear that the futures and spot prices are observed simultaneously. If observed at different times, there could be a tendency to find futures prices leading spot prices (and/or the reverse) whereas this pattern might not be observed if the prices were recorded simultaneously. For instance, if June 1 prices (whether futures or spot) are observed on European markets eight hours before they are observed on US markets, there will be a tendency to find the European markets leading the US markets since the European prices reflect changes in market conditions since yesterday’s US prices were observed. Even for US prices, observation times may differ. For instance, it is common to use futures prices observed at the end-of-trading in NYC. Spot prices may be observed before or after this.
4.6 Inventories and the futures/spot price nexus
Numerous papers including Hamilton (2009a), Krugman (2008), Irwin et al. (2009), the ITFCM (2008), IMF (2008), IEA (2008), Smith (2009), and Kilian and Murphy (2010) note that if speculation does somehow succeed in raising the current physical price of oil above the price dictated by current supply and demand conditions, then (unless demand
Thomas K. Lee | U.S. Energy Information Administration | This paper is released to encourage discussion and critical comment. The analysis and conclusions expressed here are those of the authors and not necessarily those of the U.S. Energy Information Administration.

38
and supply are completely price inelastic) the quantity supplied should exceed the quantity demanded so that oil inventories should increase. Inconsistent with the view that speculation raised physical oil prices in 2007 and early 2008, the IEA (2008), the IMF (2008), and OECD Working Party on Agricultural Policies and Markets (2010) find no evidence of a speculative increase in crude oil stocks in 2007-2008. The ITFCM (2008) argues that oil inventories were near historical levels in 2006-2008, while Hamilton (2009a) concludes “in late 2007 and the first half of 2008, when the [oil] price increases were most dramatic, inventories were significantly below normal.” Krugman (2008) makes the same point regarding the 2008 price run up but does believe speculation contributed to higher prices in 2009 (Krugman, 2009). In contrast to these, Singleton (2010) argues that the behavior of inventories was consistent with speculation impacting cash prices. His reasoning is explained below after reviewing the theory of the connection between futures and cash prices.
Faced with the evidence that there was no obvious inventory buildup in 2007-2008, proponents of the view that speculation drove oil prices above the level justified by supply and demand, respond with one or more of the following arguments: 1) if demand is highly inelastic only a small movement of oil from the cash market to inventories could lead to a large price increase, 2) we only observe inventories in OECD countries, 3) these surveys are likely to be incomplete, missing much of the oil stored for speculation, 4) speculative inventories cannot be distinguished from working inventories, and 5) the easiest way to store oil is in the ground and high futures prices may have led producers to shut-in production. All of these are discussed in Einloth (2009).
A widely acknowledged exception to the rule that inventories must rise if speculation pushes cash prices above the fundamental level is if demand and supply are perfectly inelastic. Estimates of the short-run elasticity of demand are quite low but not zero. According to Smith (2009) -0.05 is typical. However Pierru and Babusiaux (2009) point out that in econometric estimations, “short-run” generally means one year. They argue that just as the short-run elasticity is lower than the long-run, the very-short-run elasticity is likely much lower than the short-run so that very little increase in inventories might be expected in the first few months.
According to Smith (2009), Hamilton (2009a), Caballero et al. (2008), and Parsons (2010), futures market speculation could affect cash prices without changing inventories by affecting supply. If the futures price sufficiently exceeds the cash price, oil producers could decide to leave the oil in ground, produce less currently, and produce more later. These producers could essentially lock in that future sale price by longing oil futures. However, for this to be profitable the futures price must exceed the current spot price and Hamilton (2009a) concludes that the futures price generally did not exceed the cash price
Thomas K. Lee | U.S. Energy Information Administration | This paper is released to encourage discussion and critical comment. The analysis and conclusions expressed here are those of the authors and not necessarily those of the U.S. Energy Information Administration.

39
in 2007-2008. Likewise, the IEA (2008) and Smith (2009) argue that there was no evidence producers decreased supply in 2007-2008 – indeed that they were producing “flat-out” in early 2008.
4.7 The theoretical connection between futures and spot prices of oil
Many of the papers listed in the previous sections do not consider how or why the futures price would impact the cash price, but instead simply test whether inventory behavior indicates a relationship. Attention is now turned to the theoretical connection between futures and physical prices. The economics literature, as exemplified by Hamilton (2009b) and Smith (2009), and the finance literature as presented in Hull (2008) and McDonald (2006) take slightly different approaches to deriving essentially the same relation. The main difference is that the cash-and-carry model in the finance literature is based on fewer assumptions and suggests a tighter relation between the two markets. In both, the hypothesized relation in essentially the same and the main connection between the futures prices and physical oil prices is through inventories. As Smith (2009) succinctly puts it, “The only avenue by which speculative trading might raise spot prices is if it incites participants in the physical market to hold oil off the market – either by amassing large inventories or by shutting in production.” To elucidate the similarities and differences, we summarize both starting with Hamilton (2009b). Similar models to Hamilton (2009b) are in Hamilton (2009a) and Einloth (2009) and this also appears to be the model underlying Smith (2009).
Hamilton (2009b) points out that expected profits to buying or withdrawing oil from the market at time t, storing it and selling at time t+1 are positive if
Pt < Et(Pt+1)/(1+rt) -SCt +CVt
where Pt is the spot price of physical oil at time t, Et(Pt+1) is the expected oil price at time t+1, rt is the interest rate (assumed for simplicity to be the same for both borrowing and lending from time t to t+1), SCt is the cost of storing one barrel of oil from time t to time t+1, and CVt is the convenience yield afforded by having additional oil in inventory (which will be discussed more below). Thus Pt represents the price received if the oil is sold today and the right hand side of the equation represents the present value of the expected net revenue after storage costs if the oil is instead put in inventory and sold later. If therefore Pt < Et(Pt+1)/(1+rt) -SCt +CVt, oil will be withdrawn and put in inventory raising Pt and lowering Et(Pt+1) so that an equilibrium requirement is
Pt ≥ Et(Pt+1)/(1+rt) -SCt +CVt .
If Pt > Et(Pt+1)/(1+rt) -SCt +CVt, expected profits are higher if the oil is taken out of inventory and sold now which lead to the equilibrium requirement that
Thomas K. Lee | U.S. Energy Information Administration | This paper is released to encourage discussion and critical comment. The analysis and conclusions expressed here are those of the authors and not necessarily those of the U.S. Energy Information Administration.

40
Pt ≤ Et(Pt+1)/(1+rt) -SCt +CVt.
Together the inequalities imply:
Pt = Et(Pt+1)/(1+rt) -SCt +CVt.
To finish the connection to the futures price, Hamilton next argues that the futures price will reflect the expected future spot price, in particular that Ft,t+1 = Et(Pt+1)+Ht where Ft,t+1 is the futures price today of a futures contract which matures at time t+1and Ht is any risk premium. Substituting Et(Pt+1) = Ft,t+1-Ht into the previous equation yields:
Pt = (Ft,t+1-Ht)/(1+rt) -SCt +CVt
connecting spot and futures prices.
In Hamilton’s storage arbitrage model, the profits from storage arbitrage are not riskless. Expected profits to buying, storing, and selling the oil later are positive if Pt < Et(Pt+1)/(1+rt) -SCt +CVt, but, if Pt+1 turns out to be lower than expected, a loss may be incurred. Thus risk aversion may discourage the arbitrage so that Pt may not equal Et(Pt+1)/(1+rt) -SCt +CVt. Also, in this approach, connecting the spot and futures prices requires assuming that speculation will insure Et(Pt+1) = Ft,t+1-Ht which introduces the risk premium Ht into the spot-futures relation. Thus in this model the futures price only affects inventories, and therefore the spot price, to the extent it affects future price expectations. As Smith (2009) puts it, “If participants in the physical market are convinced by speculative trading in the futures market that spot prices will soon rise, their reaction could cause inventories to rise and/or production to rise.” Thus the connection between the futures and spot prices is somewhat problematical, i.e., there are several points at which the spot-futures price connection could break down.
Next consider the cash-and-carry arbitrage model as outlined in finance derivatives texts, such as Hull (2008) and McDonald (2006). While the storage arbitrage outlined in Hamilton (2009b) is risky, with a futures market, riskless arbitrage is possible. If
Pt < Ft,t+1/(1+rt) -SCt +CVt,
arbitrageurs can lock in a riskless profit at time t by: 1) borrowing Pt+SCt-CVt , 2) buying crude for Pt, 3) storing and paying storage costs of SCt, and 4) shorting the futures contract at price Ft,t+1. Over the interim, they collect the convenience yield CVt if any. At time t+1, they can then make delivery on the futures contract receiving Ft,t+1 and repay the loan with [Pt+SCt-CVt](1+r). The riskless profits are:
Ft,t+1-[Pt+SCt-CVt](1+r)..
Thomas K. Lee | U.S. Energy Information Administration | This paper is released to encourage discussion and critical comment. The analysis and conclusions expressed here are those of the authors and not necessarily those of the U.S. Energy Information Administration.
41
Note that since all prices are fixed at time t, this arbitrage is riskless barring default. As arbitrageurs buy oil in the spot market, Pt will tend to rise and as they short the futures at time t, Ft,t+1 will tend to fall until Pt ≥ Ft,t+1/(1+rt) -SCt +CVt and the arbitrage opportunity disappears. We know from news reports that arbitrageurs lease storage and engage in this cash-and-carry arbitrage when the opportunity arises, but we do not know how extensive it is or the quantities involved.
Likewise, if Pt < Ft,t+1/(1+rt) -SCt +CVt, riskless profits can be made by pulling oil out of inventory and selling at time t, which is termed reverse cash-and-carry arbitrage. Together, cash-and-carry and reverse-cash-and-carry ensure:
Pt = Ft,t+1/(1+rt) -SCt +CVt.
Save for the risk premium term, the spot-futures price relation is the same as in Hamilton (2009a, 2009b) but it does not require assuming Ft,t+1 = Et(Pt+1)+Ht and is riskless so risk aversion cannot interfere. While often (as here) expressed as an equality for simplicity, transaction costs, a difference between borrowing and lending rates, and the possibility that storage cost may not be saved when inventories fall mean that the upper bound set by cash-and-carry arbitrage exceeds the lower bound set by reverse-cash-and-carry arbitrage so that the spot price and futures price can fluctuate independently of each other within these limits without creating an arbitrage opportunity. However, large changes in the futures price will set off arbitrage that will cause the physical spot price to change in the same direction. Note also that the change in the spot price is not permanent. Cash-and-carry arbitrage tends to raise the spot price at time t as oil is pulled off the market and put in storage but tends to lower the price at time t+n when the oil is sold.
Einloth (2009) and others point out that CVt-SCt varies negatively with the inventory level. When inventory levels are low, the convenience yield CVt will tend to be high. The reason is that producers, refiners, and marketers hold working inventories as buffers against supply interruptions and fluctuations in demand. When inventory levels are low, they run the risk of a stop-out or shortage. Thus there is an advantage or convenience yield to holding inventory. As inventories rise, the risk of a stop-out declines so also does the convenience yield. If the futures price is sufficiently above the spot price to induce non-oil company arbitrageurs, such as investment banks and trading companies to do cash-and-carry arbitrage, the convenience yield of those inventories is zero (Einloth (2009)). At the same time, as inventories rise and approach storage capacity, the cost of storage, SCt, rises. Thus CVt-SCt, varies negatively with the inventory level and an ever-increasing difference between the futures price and the cash price is required to induce continued cash-and carry arbitrage.
Thomas K. Lee | U.S. Energy Information Administration | This paper is released to encourage discussion and critical comment. The analysis and conclusions expressed here are those of the authors and not necessarily those of the U.S. Energy Information Administration.

42
As discussed above, a number of papers note that if futures speculation raised the cash price above the supply-demand level, inventory buildup should be observed and argue that there was no evidence of such buildup in the 2008 price rise. Einloth (2009) argues that such evidence is not conclusive because 1) if demand is highly inelastic only a small movement of oil from the cash market to inventories could lead to a price increase, 2) we only observe inventories in OECD countries, 3) these surveys may miss much oil stored for speculation, and 4) speculative inventories cannot be distinguished from working inventories. Given the negative relation between CVt-SCt and inventory levels and the relation Pt = Ft,t+1/(1+rt)-SCt+CVt, he argues that a better measure of whether speculation is driving up cash prices is
Ft,t+1/(1+rt)-Pt = CVt-SCt.
Due to the lack of a good measure of the cash price, Pt, he uses Ft,t+2/(1+rt)-Ft,t+1 to approximate Ft,t+1/(1+rt)-Pt. Using this measure Einloth (2009) finds no evidence that speculation caused the 2007-2008 oil price run-up. Krugman (2008) and Parsons (2009) also note that the futures market was in backwardation, i.e., Pt>Ft,t+1, in most of 2007 and 2008. However Singleton (2010) thinks that the futures-spot price pattern does support a role for speculation. Parsons (2009) agrees that the market was in backwardation so that there was no incentive to withdraw oil from the physical market to inventories but nevertheless concludes that there was a price bubble in 2008. While arguing that the futures markets were in backwardation in most of 2007 and early 2008 so that there was little incentive for inventory accumulation, the IEA (2008) notes that inventories rose when the markets were in contango in 2005-2006 and Krugman (2009) attributes part of the price rise in 2009 to cash-and-carry arbitrage caused by Ft,t+1>Pt.
As noted by the IEA (2008) and others, given the central role that inventories play in the futures price - cash price nexus and in the question of how much, if at all, speculation impacts physical oil prices, it is surprising how little research has been done on the relation between the futures-spot spread, Ft,t+1/(1+rt)-Pt, or for simplicity Ft,t+1-Pt and inventories. Einloth (2009) and Singleton (2010) note simple correlations between inventories and Ft,t+1-Pt. However, without controlling for other factors that impact inventories, simple correlations do not establish that inventory levels are responding to Ft,t+1-Pt. Suppose, for instance, that demand falls unexpectedly. In that case, inventories would rise and Pt would fall raising Ft,t+1-Pt. Thus inventory levels and Ft,t+1-Pt move together but not because inventories are responding to Ft,t+1-Pt and their correlation would not constitute evidence that futures speculation impacts cash prices through inventory behavior. Studies that carefully study how oil futures prices impact spot prices through inventory and production controlling for other changes in supply and demand appear warranted.
Thomas K. Lee | U.S. Energy Information Administration | This paper is released to encourage discussion and critical comment. The analysis and conclusions expressed here are those of the authors and not necessarily those of the U.S. Energy Information Administration.

43
5. Recent changes in oil financial markets “In sum, while industry and regulatory economists and analysts do not agree on the extent to which market speculation has affected energy prices, it is beyond dispute that speculation has increased.” Staff Report of US Senate Permanent Subcommittee on Investigations (2006). The past decade has witnessed a number of changes in energy derivatives trading which we review in this section. First, there has been a sharp increase in trading of oil and energy derivatives on organized exchanges. As illustrated in Figure 5.1, according to the Futures Industry Association, the number of energy contracts (including natural gas and refined products) traded on organized exchanges increased from 155 million contracts in 2000 to 724 million in 2010.
Moreover, as illustrated in Figure 5.2, oil derivatives trading on both the NYMEX and ICE exchanges more than doubled between 2006 and 2010.
Thomas K. Lee | U.S. Energy Information Administration | This paper is released to encourage discussion and critical comment. The analysis and conclusions expressed here are those of the authors and not necessarily those of the U.S. Energy Information Administration.
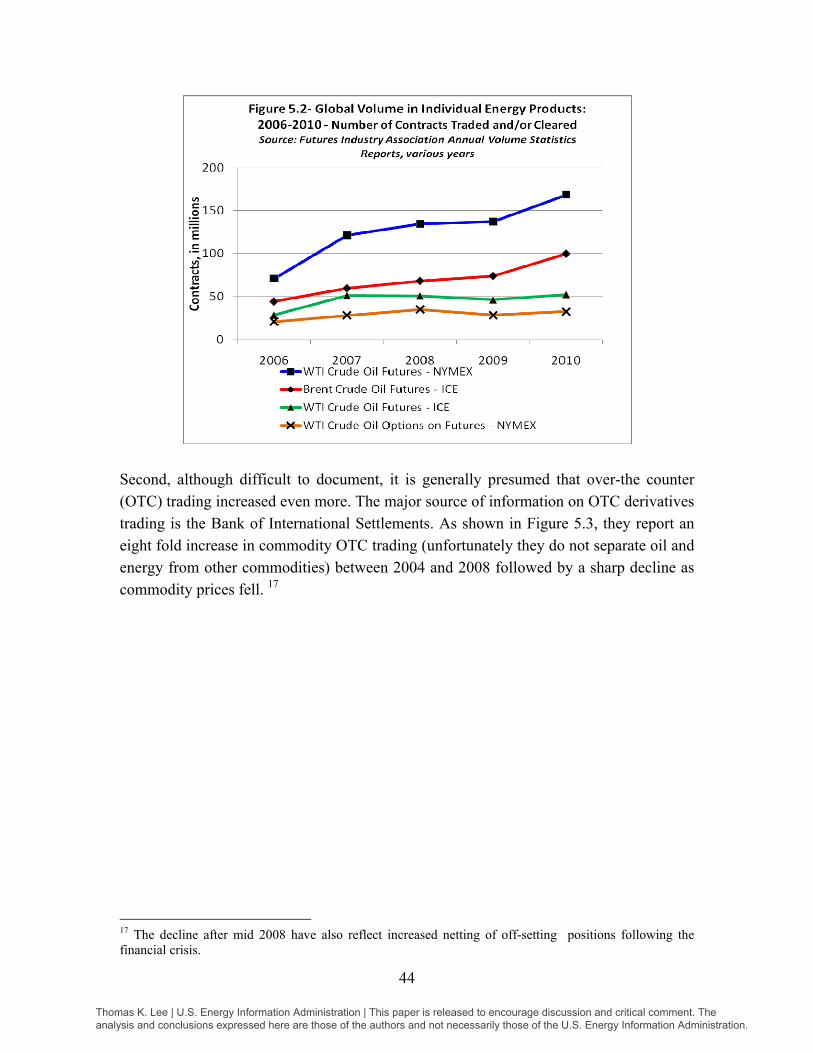
44
Second, although difficult to document, it is generally presumed that over-the counter (OTC) trading increased even more. The major source of information on OTC derivatives trading is the Bank of International Settlements. As shown in Figure 5.3, they report an eight fold increase in commodity OTC trading (unfortunately they do not separate oil and energy from other commodities) between 2004 and 2008 followed by a sharp decline as commodity prices fell. 17
17 The decline after mid 2008 have also reflect increased netting of off-setting positions following the financial crisis.
Thomas K. Lee | U.S. Energy Information Administration | This paper is released to encourage discussion and critical comment. The analysis and conclusions expressed here are those of the authors and not necessarily those of the U.S. Energy Information Administration.
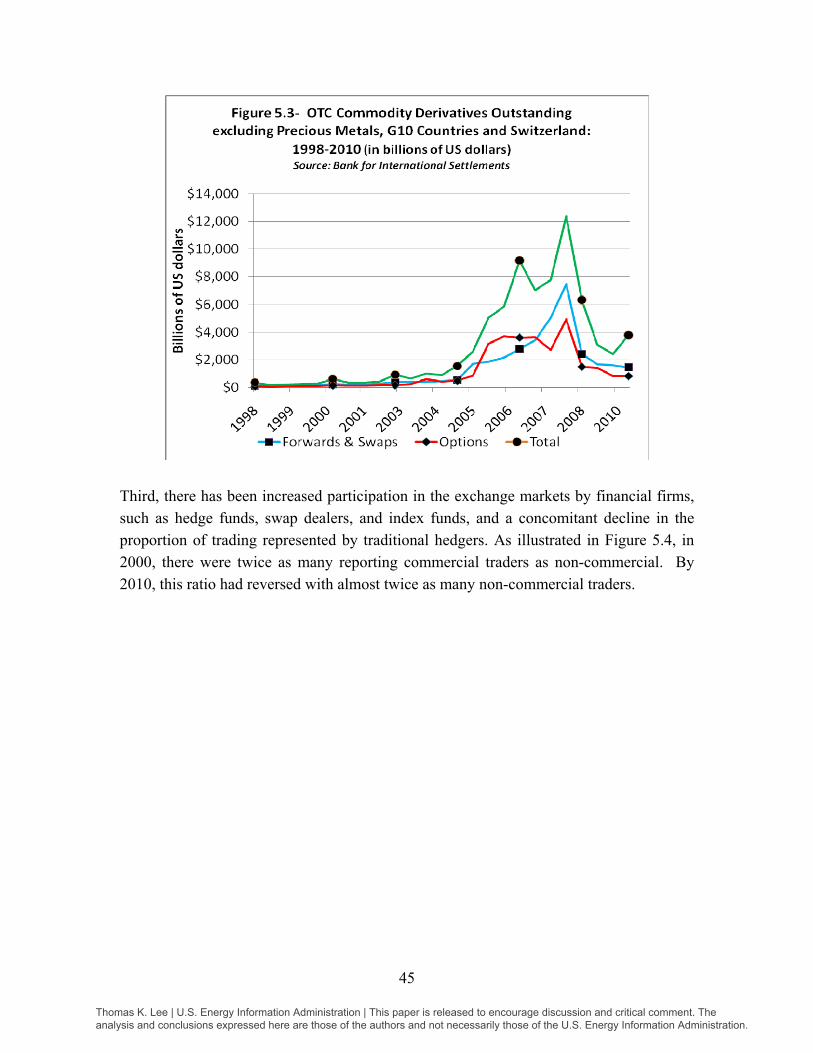
45
Third, there has been increased participation in the exchange markets by financial firms, such as hedge funds, swap dealers, and index funds, and a concomitant decline in the proportion of trading represented by traditional hedgers. As illustrated in Figure 5.4, in 2000, there were twice as many reporting commercial traders as non-commercial. By 2010, this ratio had reversed with almost twice as many non-commercial traders.
Thomas K. Lee | U.S. Energy Information Administration | This paper is released to encourage discussion and critical comment. The analysis and conclusions expressed here are those of the authors and not necessarily those of the U.S. Energy Information Administration.

46
The literature on these three trends and other changes is reviewed in the sections below. A number of commentators discuss these market changes in dollar terms. Since dollar figures reflect changes in oil prices as well as quantities, we report trading measures in barrels or futures contracts (1000 barrels), rather than dollars, whenever available. 5.1 Exchange trading Several studies document the rise in exchange trading including Büyükşahin et al. (2008) and Parsons (2010). According to Büyükşahin et al. (2008), average open interest in the NYMEX WTI futures contract almost quadrupled, from an average of 414 million barrels (MMbls) in 2000 to 1267 MMbls in 2008 based on statistics from the CFTC’s Commitments of Traders report. Combining the NYMEX WTI with the Intercontinental Exchange’s (ICE) WTI and Brent crude contracts, which are the two most active futures markets after the NYMEX WTI contract, Parsons (2010) reports that open interest in these three contracts more than tripled from 517 MMbls in June 2000 to 1669 MMbls in
Thomas K. Lee | U.S. Energy Information Administration | This paper is released to encourage discussion and critical comment. The analysis and conclusions expressed here are those of the authors and not necessarily those of the U.S. Energy Information Administration.

47
June 2007 before falling to 1374 million in December 2008.18 To put these figures in some perspective, in 2008 US annual production of crude oil was approximately 1812 MMbls and US consumption of petroleum products approximately 7136 MMbls (EIA website). In addition to an overall increase in futures trading, there has been an even sharper rise in the number of traders taking spread positions, e.g., simultaneously holding a long position in the December contract and short position in the June contract, rather than only long positions or only short positions at the same point in time. According to Büyükşahin et al (2008), non-commercial spread positions increased from 6% of the futures market open interest in 2000 to 27.5% in 2008 suggesting possibly increased speculation or arbitrage on price differences. Consistent with this interpretation, Büyükşahin et al (2008) find that prices of contracts with short and long expirations became more co-integrated and correlated over the latter part of the decade. The growth in exchange trading of crude oil options has been even sharper and is almost totally concentrated in the last decade. In order to compare options at different strikes and options with futures, options open interest and trading volume figures are generally expressed in “futures equivalent” contracts rather than total contracts. These futures equivalent figures are obtained by weighting each options contract by its estimated delta, which estimates how much the option price will change when the price of the underlying futures contract changes by $1, i.e., the derivative of the options price with respect to the underlying futures price. These delta weights vary from close to zero for far-out-of-the-money options to almost one for far-in-the-money options. According to the figures in Table 5 in Büyükşahin et al. (2008), futures equivalent options open interest in the WTI contract increased from 166 MMbls in 2000 to 1431 MMbls in 2008. Combining the three options contracts, Parsons (2010) calculates that futures equivalents options open interest increased from 207 million barrels in June 2000 to 1627 million barrels in June 2008. In recent years, options open interest has generally exceeded futures open interest for the NYMEX WTI contract. For example, as of August 20, 2010 open interest in WTI contracts on the NYMEX totaled 4255 MMbls for American option contracts and 2270 MMbls for average price options (in contracts, not futures equivalent contracts) while futures open interest totaled 1275 MMbls. While trading and open interest is still heaviest in futures and options contracts with short maturities, open interest has increased somewhat more at the longer maturities. According to the figures in Table 5 in Büyükşahin et al (2008), the proportion of open 18 However, Reid (2008) argues that there was no material increase in total WTI futures open interest from June 2007 through June 2008, when oil prices nearly doubled.
Thomas K. Lee | U.S. Energy Information Administration | This paper is released to encourage discussion and critical comment. The analysis and conclusions expressed here are those of the authors and not necessarily those of the U.S. Energy Information Administration.

48
interest in futures and option contracts expiring in three months or less declined from 45.2% in 2000 to 34.1% in 2008 and the proportion in contracts expiring in more than 3 years increased from 3.4% to 5.9%. 5.2 Over-the-counter trading There has been considerable speculation about but little research on over-the-counter (OTC) trading of energy derivatives – probably due to a lack of reliable data. Most over-the-counter trading reportedly consists of energy swaps. In an example “plain vanilla” oil swap, a swap dealer may agree to “pay” an exploration and production (E&P) oil firm a fixed price at some future date(s) and “receive” a floating price on the future value of some index, such as the NYMEX nearby WTI contract. No oil changes hands – just the difference between the fixed and floating prices. For example, suppose in June a swap dealer and an E&P firm enter a December swap on a notional value of 100,000 barrels with the swap dealer as the fixed price payer and the E&P as the floating price payer at a fixed price of $80 a barrel. If in December the WTI price turns out to be $65 a barrel, the swap dealer pays the E&P firm ($80-$65)100,000=$1,500,000. If the December price turns out to be $90, the E&P firm pays the swap dealer $1,000,000. The main advantages to the E&P firm of a swap versus a futures contract are: 1) the ability to customize, e.g., the floating price may be an average over the month instead of a single day or on a floating price other than the Cushing WTI price, and 2) no margins. The main disadvantages are 1) higher transaction costs, 2) lower liquidity, and 3) limited reversibility. Also reportedly popular are collar swaps, in which payments only take place if the index price rises above a ceiling or falls below a floor. The swap dealer may simultaneously enter into swaps with airlines or commodity index funds in which the swap dealer receives the fixed price and pays the floating price. To the extent the dealer’s long positions with oil producers and short positions with oil consumers and index funds do not balance, it may hedge its net exposure in the futures market. So supposedly, the swap dealers’ futures market positions represent only the OTC mismatch. (See derivatives texts such as Hull (2008) or McDonald (2006)). Until the CFTC started surveying larger swap dealers along with commodity index funds in June 2008, there was no hard data on OTC energy trading specifically. The Bank of International Settlements (BIS) publishes semi-annual estimates of global OTC commodities trading. For instance, they estimate the total notional amount of OTC commodity contracts outstanding at $2944 billion in December 2009 (which is down sharply from an estimated $13,229 billion in June 2008). Unfortunately, the BIS does not separate out crude oil or energy trading from agricultural commodities and metals. Also
Thomas K. Lee | U.S. Energy Information Administration | This paper is released to encourage discussion and critical comment. The analysis and conclusions expressed here are those of the authors and not necessarily those of the U.S. Energy Information Administration.

49
as Parsons (2010) notes, they provide little information on how this information is obtained and compiled. In 2008 the CTFC began surveying large swap dealers and commodity index funds and reporting results quarterly in its “Index Investment Data” report. The survey is described in the CFTC “Staff Report on Commodity Swap Dealers and Index Traders with Commission Recommendations (2008).19 Unfortunately, as discussed more below, the report does not distinguish between swap dealer and commodity index fund positions and does not separate exchange and off-exchange positions. For December 2009, the CFTC reports that combined long swap and futures positions of swap dealers and commodity index funds were 626 million barrels while short positions totaled 175 million barrels (CFTC Index Investment Data report, December 2009). The total notional dollar amount of these long and short positions was $65.0 billion. Despite their coverage differences, it is interesting to compare the CFTC’s $65 billion figure for US crude oil positions in December 2009 with the BIS’s $2944 billion figure for global commodity positions at the same time. The former is only 2.2% of the latter. Of course the BIS figure is global while the CFTC’s is for the US only. Also the BIS figure covers commodities in total while the CFTC is for crude oil only. For comparison, crude oil open interest accounted for 31.1% of total open interest for all commodities in the CFTC survey and crude oil’s weight in the S&P - Goldman Sachs Commodity index in December 2009 was 38.3% (Commodities Market Attributes - December 2009 at www.spgsci.standardandpoors.com). On the other hand, the CFTC figure includes futures and option exchange positions while the BIS estimate is for OTC positions only. Hopefully, implementation of the Dodd-Frank Wall Street Reform and Consumer Protection Act will lead to considerably more information on OTC energy trading. 5.3 Changes in trader composition It is widely acknowledged that over the last decade or so energy futures and options trading by swap dealers, hedge funds, and commodity index funds has increased so that traditional hedgers and speculators now represent smaller proportions of the market. However, until recently hard data on these trends has not been available so the set of papers exploring these trends is recent and relatively small: Masters (2008), Masters and White (2008a and 2008b), Büyükşahin et al. (2008), CFTC Staff Report on Commodity Swap Dealers and Index Traders (2008), Parsons (2010), OECD Working Party on Agricultural Policies and Markets (2010), and Stoll and Whaley (2010). 19 http://www.cftc.gov/ucm/groups/public/@newsroom/documents/file/indexinvestordataexplanatoryno.pdf.
Thomas K. Lee | U.S. Energy Information Administration | This paper is released to encourage discussion and critical comment. The analysis and conclusions expressed here are those of the authors and not necessarily those of the U.S. Energy Information Administration.

50
5.3.1 The Commitments of Traders report Since virtually all data on who is trading energy futures and options comes from the CFTC’s weekly Commitments of Traders (COT) report, it seems useful to first review the evolution of this report. The COT report is drawn from the CFTC’s Large Trader Reporting System which (for market oversight) requires brokers to daily report open interest positions of traders whose positions exceed set levels -- currently 350 contracts for crude oil. Based on these filings, the CFTC has long reported aggregate open interest levels at the Tuesday close for “commercial” and “non-commercial” traders where traders are identified as commercial if they report that they are “commercially engaged in business activities hedged by the use of futures or options markets.” Although it is generally recognized that this distinction is not perfect, commercials have commonly been regarded and referred to as “hedgers” and the non-commercials as “speculators.” Prior to the 1990s, commercials were generally traders involved in the physical product markets. At the urging of Congress, in 1991 the CFTC began recognizing investment banks and trading firms who were hedging some or all of their OTC swap and derivative positions as hedgers and hence began classifying them as commercials. A problem is that, like many other firms, their hedging activities are not (and probably cannot) be separated from their speculative trades so all their positions are classified as commercial. Based on a closer look at the firms in the commercial and non-commercial sets in 1993-1997, Ederington and Lee (2002) and Dewally et al. (2010) concluded that many of the energy traders in the commercial category were, in fact, primarily speculators. In 2008 the CFTC staff undertook a closer look at the commercial and non-commercial classifications in light of the growth in trading by swap dealers and index traders, and concluded: “Today this classification by trading entity is less precise in describing the type of trading activity conducted by these entities than it was 25 years ago when the CFTC first began to use these classification categories” (CFTC Staff Report on Commodity Swap Dealers and Index Traders (2008)). Recently, the CFTC has moved to improve the informativeness of the COT reports. In 2006, they began issuing a “Supplemental Report” which splits out futures and options holdings by commodity index traders (who are described and discussed below) for 12 agricultural commodities, but not energy, In September 2009 they began issuing a “Disaggregated” COT for most markets including energy, which breaks the commercial and non-commercial categories into two more informative sub-categories. The commercial category is now broken into: 1) traders with a position in the physical market, such as oil firms, pipelines, airlines, and chemical companies, designated as “producer/merchant/processor/user”, and 2) “swap dealers”. The non-commercial
Thomas K. Lee | U.S. Energy Information Administration | This paper is released to encourage discussion and critical comment. The analysis and conclusions expressed here are those of the authors and not necessarily those of the U.S. Energy Information Administration.

51
category is separated into: 1) “managed money”, which primarily consists of hedge funds and commodity index funds, and 2) “other reportables”, which includes individuals and floor traders. The total long and short open interest percentages (futures and options combined) accounted for by each on July 27, 2010 are reported in the Table II below along with the residual which consists of small traders who are not required to report. Note that those involved in the physical production, distribution, or consumption of crude oil only account for 20.6% of total short open interest and only 12.6% of total long open interest. However, these traditional hedgers may have an indirect impact since they may hedge their positions with swap dealers who in turn hedge their positions in the futures market. Table II: Percentage of Open Interest in Oil Futures and Options by Trader Category, July 27, 2010 Percent of Open Interest Trader Category Long Short Producer/Merchant/Processor/User 12.6% 20.6% Swap Dealers 41.4% 38.3% Managed Money 18.4% 14.1% Other Reportables 24.3% 23.6% Non-Reporting Traders 3.4% 3.4% Total 100.0% 100.0%
While a definite improvement over the legacy COT report, it is unfortunate that the Disaggregated COT continues to lump together commodity index funds and hedge funds in the “managed money” category since their investment objectives and hypothesized impacts on oil prices are so different. As discussed below, commodity index funds are passive investors who take only long positions while hedge funds may take long, short, or spread positions depending on their market expectations and strategies. 5.3.2 Other energy trader reports Three papers provide more detailed data on energy futures and options traders than is available from the published CFTC reports. Using data from a study for the DOE, Ederington and Lee (2002) and Dewally et al. (2010), separated large traders in energy futures over the June 1993 - March 1997 period into eleven categories. The eleven and the percentage of crude oil futures open interest accounted for by each (shown in parentheses) were: refiners (26.0%), independent producers (i.e., E&P firms) (2.6%),
Thomas K. Lee | U.S. Energy Information Administration | This paper is released to encourage discussion and critical comment. The analysis and conclusions expressed here are those of the authors and not necessarily those of the U.S. Energy Information Administration.

52
pipelines/marketers (10.4%), end users (0.5%), commercial banks (11.6%), investment banks (29.9%), hedge funds (5.7%), other trading firms (5.1%), individuals (2.1%), floor traders (5.0%), and unclassified (1.0%). Unfortunately, this dataset has not been extended to the current period and the make-up of the market has reportedly changed considerably since 1997. In addition to the broad classifications reported in the COT reports, the CFTC assigns traders to more specialized subcategories. These subcategory figures are not normally available but are provided for 2000, 2004, and 2008 in Büyükşahin et al. (2008). The percentage of futures and option open interest accounted for by each trader category in 2000 and 2008 as calculated from their Table 5 are reported below in Table III. Table III: Percentage of Open Interest in Oil Futures and Options by Trader Category, 2000 vs. 2008 % of Open Interest Trader Category 2000 2008 Manufacturers 11.2% 1.6% Producers 5.0% 0.7% Dealers/Merchants 21.8% 12.7% Commodity Swap Dealers 36.0% 35.1% Other Commercial 0.9% 0.1% Hedge Funds 5.9% 22.6% Floor Brokers/Traders 9.3% 11.1% Non-Registered 5.8% 16.1% Unclassified Commercial 4.2% 0.0%
Particularly noteworthy is the decline in trading by refiners and independent producers from a combined 28.6% in the Dewally et al. (2010) 1993-97 sample to 16.2% in 2000 and only 2.3% in 2008 in the Büyükşahin et al. (2008) samples. This probably does not mean that refiners and independent producers were trading or hedging less in 2008 but that they were trading and hedging through swap dealers instead of through the futures and options markets directly. FAS133 requires firms to report their derivatives positions and Credit Suisse regularly compiles figures on hedging for publicly traded exploration and production firms from annual reports. According to the Credit Suisse 2008 report, 29 E&P firms hedged 43% of their estimated 2008 crude oil production or 178 million barrels using crude oil derivatives (Credit Suisse, 2008).20 The producers’ figure for exchange traded futures and options (which would include hedges for 2009 and beyond 20 The Credit Suisse (2008) Hedging Summary is not available in the public domain and we thank Christopher Hoffman at Credit Suisse for providing it to us.
Thomas K. Lee | U.S. Energy Information Administration | This paper is released to encourage discussion and critical comment. The analysis and conclusions expressed here are those of the authors and not necessarily those of the U.S. Energy Information Administration.
53
as well) reported in Büyükşahin et al. (2008) is less than 1% of this at 1.6 million barrels. Hence, it seems clear that E&P firms are primarily hedging through swap dealers and this seems likely to be the case for refiners and possibly pipelines as well. 5.4 Trader Categories of Special Interest As documented in Büyükşahin et al. (2008) and the CFTC’s Supplemental COT report, “traditional” hedgers, defined as those producing, transporting, distributing, or consuming crude oil now account for only a minor portion of the trading on futures and options exchanges. Based on derivatives positions reported on individual oil firm balance sheets we know that their positions in the OTC market are much larger -- though to our knowledge a total figure has never been compiled. Swap dealers are the main OTC market markers and account for a large proportion of trading on futures and options markets. In addition, trading by hedge funds has risen in recent years and commodity index funds are a major newcomer. We now discuss the evidence on swap dealers, hedge funds, and commodity index funds in order. 5.4.1 Swap dealers Commodity swap dealers are the primary market makers in the OTC energy markets and, as just seen in the previous section, account for approximately 35% of the open interest in exchange traded futures and options. Numerous papers, including the Staff Report of US Senate Permanent Subcommittee on Investigations (2006), Masters (2008), Büyükşahin et al. (2008), CFTC Staff Report on Commodity Swap Dealers and Index Traders (2008), Parsons (2010), and the OECD Working Party on Agricultural Policies and Markets (2010) discuss the rise and/or importance of swap dealers but the only papers to present original data on their activities are Büyükşahin et al (2008) and the CFTC Staff Report on Commodity Swap Dealers and Index Traders (2008) so we focus on those. It is interesting to compare their two sets of figures since both present data for roughly the same 2008 period. In the usual description of swap dealer market making activity, swap dealers enter agreements with oil producers in which the swap dealers pay a fixed price and receive a floating price and then enter agreements with petroleum consumers and commodity index funds in which they pay the floating price and receive the fixed price. To the extent the two sides of their swap agreements do not balance, they supposedly hedge their net exposure using futures or options markets. This description implies that swap dealers’ futures market positions should only be a fraction of their gross OTC positions. However, according to the CFTC Staff Report on Commodity Swap Dealers and Index Traders
Thomas K. Lee | U.S. Energy Information Administration | This paper is released to encourage discussion and critical comment. The analysis and conclusions expressed here are those of the authors and not necessarily those of the U.S. Energy Information Administration.

54
(2008), gross OTC and exchange crude oil positions of 43 major swap dealers and commodity index funds were equivalent to only 398,000 NYMEX futures contracts in March 2008 and 363,000 futures contracts in June 2008. Since this figure includes both swap dealer and commodity index fund positions and their NYMEX and ICE positions as well as their OTC holdings, the implication is that swap dealer OTC positions totaled considerably less than 398,000 NYMEX futures equivalent contracts in March 2008 and 363,000 in June 2008. In comparison, Büyükşahin et al. (2008) report that swap dealers’ open interest positions in NYMEX futures averaged 440,227 contracts from January to August 2008. They further report that swap dealer positions in NYMEX options averaged another 947,952 contracts in futures equivalent terms over the same period. In other words, the CFTC survey seems to indicate that swap dealers’ gross OTC positions were only a fraction of their futures and option markets positions reported by Büyükşahin et al (2008) while the latter should be only a fraction of the former if swap dealers were solely using the futures and option markets to hedge their OTC positions. This difference between the figures in Büyükşahin et al. (2008) and the CFTC Survey seems to suggest that either: 1) the CFTC survey missed major swap dealers (which seems unlikely), 2) swap dealers underreported their OTC crude oil positions to the CFTC (perhaps reporting net and not gross positions as asked), and/or 3) swap dealers trade extensively in the crude oil futures and options markets for their own account. The third possibility seems likely. According to anecdotal reports, many swap dealers engage in cash-and-carry and reverse-cash-and-carry arbitrage, put-call parity arbitrage, and crack and calendar spread trading. Consistent with this, Büyükşahin et al. (2008) find that since 2002 long and short maturity futures have become more correlated and co-integrated and that this increased co-integration is associated with increased market activity by swap dealers and hedge funds implying that the swap dealers engage in cash-and-carry arbitrage and/or calendar spread trading. It is possible that swap dealers engage in speculation as well. As will be discussed in section 5.4.3, the CFTC figure of 363,000 contracts in June 2008 also appears inconsistent with estimations of commodity index fund holdings by Masters and White (2008a) based on other CFTC data. It is hoped that the OTC activity reporting required by the Dodd-Frank Wall Street Reform and Consumer Protection Act will shed more light on this activity. 5.4.2 Hedge funds According to Dewally et. al (2010) hedge funds accounted for 5.7% of futures market open interest in 1993-97. According to Büyükşahin et al. (2008), hedge funds accounted for 5.9% of futures and option open interest in 2000 but this ballooned to 22.6% in 2008. However, it is possible that part of the growth in hedge fund trading between 2000 and
Thomas K. Lee | U.S. Energy Information Administration | This paper is released to encourage discussion and critical comment. The analysis and conclusions expressed here are those of the authors and not necessarily those of the U.S. Energy Information Administration.
55
2008 that they report is in fact due to the growth of commodity index funds since Büyükşahin et. al do not have a separate commodity index fund category and the CFTC’s Disaggregated Commitments of Traders reports combine the two. Dewally et al. (2010) found that over the 1993-97 period, hedge funds had the highest trading profits of the eleven trader groups they examined. However, they concluded that these profits were due to the risk-transfer and liquidity services hedge funds provided hedgers by taking the other side of hedgers’ positions in the futures market, not to an ability to forecast future market movements. Dewally et al. (2010) further found that in 1993-97, hedge funds rarely held spread positions, i.e., they tended to be either all long or all short. That has clearly changed. Recent Disaggregated Commitments of Traders reports report sizable spread positions by futures traders in the “managed money” category which includes both hedge funds and commodity index funds. Since commodity index funds only hold long positions, the spread positions must be held by hedge funds. Consistent with this spread trading activity, Büyükşahin et al (2008) find that the increased hedge fund activity from 2000 to 2008 coincides with increased correlation and co-integration between long and short maturity futures. 5.4.3 Commodity index funds Although it is difficult to obtain hard statistics, by all accounts, trading by commodity index funds has grown considerably over the last decade. These are primarily institutional mutual funds which take passive long positions in commodity futures. Since futures require no up-front investment, they also hold U.S. Treasury bills. According to Stoll and Whaley (2010), a majority of these funds seek to mimic the return on the S&P-GSCI index, in which crude oil futures prices have a 35.4% weight (as of August 13, 2010). A minority seek to replicate the return on other indices, such as the Dow-Jones UBSCI index, which assigns a 13.9% weight (2010) to crude oil. These funds take long positions in commodity futures and swaps, increasing their long positions when money flows into the fund and reducing them when funds flow out. They generally take positions in only the nearby and second shortest contracts rolling from the nearby to the next contract between the fifth and ninth business days of the month which is when the indices roll. The United States Oil Fund functions in the same manner but invests solely in crude oil futures. This exchange traded fund is smaller than the funds based on the two commodity indices and is marketed to individuals rather than institutions. Since these funds take only long positions, there has been considerable debate over whether their trading tends to push futures and forward prices for oil above expected future spot prices. As noted above, according to the CFTC Staff Report on Commodity Swap Dealers and
Thomas K. Lee | U.S. Energy Information Administration | This paper is released to encourage discussion and critical comment. The analysis and conclusions expressed here are those of the authors and not necessarily those of the U.S. Energy Information Administration.
56
Index Traders (2008), gross combined crude oil positions of 43 major swap dealers and commodity index funds were equivalent to approximately 363,000 futures contracts in June 2008. Unfortunately, for crude oil, the CFTC has not separated commodity index fund positions from swap dealer holdings. However, they do report commodity index fund holdings for twelve agricultural commodities in their “Supplemental” COT reports and from these it is possible to estimate index fund investment in crude oil futures. If, for instance, the weights of commodities X and Y in an index are x% and y% respectively and the CFTC reports that index fund investments in commodity X total $A, then the implied investment in commodity Y is $A(y%/x%). For crude oil, these calculations are complicated by the fact that there are two different indices with different crude oil weights and the proportions of funds indexing each is not known precisely. In addition, the reported relative proportions for the twelve commodities included in the Supplemental COT reports do not perfectly match the indices’ weights. Nonetheless, using this procedure, Masters and White (2008a) estimate that commodity index fund investment in crude oil derivatives (including swaps) exceeded 675,000 futures equivalent contracts in June 2008. In other words, using data from the CFTC’s Supplemental COT report, Masters and White estimate that in June 2008, index fund investment in crude oil derivatives was more than double that reported by the CFTC in its Staff Report on Commodity Swap Dealers and Index Traders (2008) for swap dealers and index funds combined. To put the Masters and White 675,000 contract figure in context, Büyükşahin et al. (2008) calculate that futures open interest averaged approximately 1,267,000 contracts over the Jan-August 2008 period and futures plus options 2,698,000 contracts. Commodity index fund investing and its impact are explored by Stoll and Whaley (2010). They conclude that the institutions putting money into commodity index funds are not speculating but seeking to diversify their portfolios because the correlation between returns on commodity investments and stock and bond returns is fairly low. When commodity index funds roll from the nearby to the next contract, they short the nearby contract and long the next contract. Thus if other traders do not step in to offset so that this trading impacts oil futures prices, one would expect possibly lower returns over the roll period on the nearby contract than on the second nearby contract. Commodity index funds may also have an indirect effect on futures markets since they also enter into OTC swap agreements with dealers who may in turn take futures and options market positions. Stoll and Whaley (2010) find that commodity index rolls have little impact on most agricultural commodity prices but they do find evidence that crude oil futures prices are impacted. Stoll and Whaley estimate that over the January 2006 - July 2009 period rolls of funds based on the S&P-GSCI index from the nearby to the second contract caused open interest in the second crude oil contract to increase by an average of 53.4% and that
Thomas K. Lee | U.S. Energy Information Administration | This paper is released to encourage discussion and critical comment. The analysis and conclusions expressed here are those of the authors and not necessarily those of the U.S. Energy Information Administration.
57
this caused a 0.26% difference in five day returns between the nearby and second nearby contracts - an annualized difference of 13.5%. While this indicates that commodity index funds do impact the relative price difference between these two oil futures contracts in the very short run, it does not mean that index fund trading affects the general level of oil futures prices as Masters and While (2008a and 2008b) and others allege. 6. Price discovery and transparency in the oil market In this section, the overarching theme is the relation between information and prices and how changes in information are manifested in prices. We begin by focusing on the relation between spot prices and the information contained in futures prices (sections 6.1 and 6.2). Thereafter, we shift our focus to the relation between non-price fundamental information and prices. 6.1 Where does price discovery occur in the oil market?
Futures markets are felt to be important aggregators of information about commodity prices ultimately contributing to the efficient allocation of commodity resources. Black (1976) goes so far as to argue that this price discovery role of futures markets dominates its role as a facilitator of risk sharing. The theory of efficient price formation argues that true and accurate prices are most likely to arise in unfettered market places. Price discovery is the process of uncovering an asset's full information or permanent value. The issue of where price discovery occurs, in the spot or in the futures market, is important in the crude oil market as it has direct implications for whether excessive speculative activity in the futures market can influence spot market prices. Early works on the subject were devoted to tests of causality between futures price changes and spot prices changes. Several subsequent measures of price discovery have been proposed in the literature and have survived over time. These measures attempt to parse out the relative contributions to price discovery of multiple markets on which assets or derivatives of those assets are traded. The foundation for these models is the condition that a true underlying, but unobservable value exists for the asset in question. These measures are due to Garbade and Silber (1983), Hasbrouck (1995), Gonzalo and Granger (1995), Harris, McInish, Shoesmith and Wood (1995), and are reviewed in Baillie, Booth, Tse and Zabotina (2002). Figuerola-Ferretti and Gonzalo (2010) present a theoretical justification for the Gonzalo and Granger measure within the context of an equilibrium model of commodity spot and futures prices. Here we review several studies which focus on the relation between crude oil spot and futures prices.
Thomas K. Lee | U.S. Energy Information Administration | This paper is released to encourage discussion and critical comment. The analysis and conclusions expressed here are those of the authors and not necessarily those of the U.S. Energy Information Administration.

58
6.2 Empirical results on price discovery and the relation between spot and futures prices of crude oil Tests of linear causality in a bivariate model of spot price changes and futures price changes indicate that crude oil futures price changes lead spot price changes but spot price changes do not influence futures price changes (Schwarz and Szakmary, 1994), examining daily data for 1/1/1984-5/15/1991; Silvapulle and Moosa (1999), examining daily data for 1/2/1985-7/11/1996). However, some authors have also tested for non-linear causality and conclude that bidirectional causality is present, that is futures price changes influence spot price changes, but spot price changes also influence futures price changes (Silvapulle and Moosa (1999); Bekiros and Diks (2008), examining daily data for the period 10/21/1991-10/30/2007). Caporale, Ciferri and Girardi (2010) (examining daily data 1/2/1990-12/31/2008 and using the methods developed in Harris et al. (1995, 2002) conclude “On average, futures markets tend to dominate the spot market in terms of price discovery for the shortest maturities, but the relative contribution of the two markets turns out to be unstable, especially for the most deferred contracts.” Bekiros and Diks (2008) reach a similar conclusion. The authors find bidirectional causality is present. However neither market leads or lags the other on a consistent basis over time. In a related study Figuerola-Ferretti and Gonzalo (2010) (examining daily data for the period 1988:06 – 2008:12) test whether price discovery for crude oil futures occurs on the NYMEX or on the London International Petroleum Exchange (IPE) and find that NYMEX is the main contributor to price discovery between the two markets. They conclude the result is consistent with price discovery occurring on the market that provides greater liquidity. The authors do not, however, explore whether price discovery occurs on the futures market or the spot market. Kaufman and Ullman (2009) extend this literature by taking a global perspective. They model and test for causal relations between oil prices determined in multiple spot markets across the globe as well as futures prices for the WTI futures, futures prices for Brent oil and futures prices for the Dubai contract. Their results show that a complex network of linkages exists between markets as regards price discovery but that surprisingly there is no direct link between the WTI spot market and the NYMEX futures market. They conclude there are two ‘gateway’ prices that in turn influence all other prices, 1) the Dubai–Fateh spot price and 2) the far month (5 month) NYMEX futures contract. The authors argue that the importance of the Dubai-Fateh price stems from both demand (developing Asian nations, including China and India) as well as supply (due to a shift towards more production by OPEC nations). Essentially they find the Dubai spot price influences the Brent and Bonny spot prices which in turn influence both the WTI spot price and the nearby WTI futures price.
Thomas K. Lee | U.S. Energy Information Administration | This paper is released to encourage discussion and critical comment. The analysis and conclusions expressed here are those of the authors and not necessarily those of the U.S. Energy Information Administration.
59
6.2.1 Anecdotal evidence on links In January 2010 Saudi Arabia changed the benchmark it uses to price export oil sales to the U.S. from the WTI spot to the Argus Sour Crude Index (ASCI), in part because the ASCI is viewed as being more representative of the U.S. Gulf Coast sour crude market. The ASCI is determined by Argus using NYMEX futures prices as well as spot prices at three physical locations on the U.S. Gulf Coast. In addition, from a world price perspective, the BWAVE price, a weighted average of futures prices for Brent crude, is the price basis used by many Middle East countries for pricing exports to Europe.21 6.2.2 The influence of speculators on price discovery Haigh, Hranaiova and Overdahl (2005) utilizing proprietary data from the Commodity Futures Trading Commission on managed money traders conclude that despite the growth in their share of open interest, MMT participants are relatively inactive, that MMT traders are providing liquidity to the large hedgers and not the other way around. They also find a significantly negative relationship between MMT position changes and price changes (conditional on other participants trading) in the crude oil market. They conclude that this class of traders does not exert undue collective influence on the oil market and thus is not hindering the price discovery process. 6.2.3 Predictive accuracy of futures prices and tests of unbiasedness A companion issue on the relation between futures prices and spot prices is the question of whether futures prices are accurate predictors of future spot prices and whether they are unbiased predictors. A recent empirical study by Alquist and Kilian (2010) (examining data from 1983:03-2007:02) concludes that the current spot price generally is a better predictor of the future spot price at the 1, 3, 6, 9 and 12 month forecast horizons when compared with the predictive accuracy of the futures price on a mean squared prediction error basis. They attribute the forecasting superiority of the simple no-change in spot price model to the fact that futures prices are more variable than spot prices. Wu and McCallum (2005) also find that the futures price is a poor predictor but that a model of the futures-spot spread beats a suite of alternatives, followed by the simplest Hotelling model of a an increasing price (at the constant interest rate). Wu and McCallum study monthly prices over the period 1980-2005.
21 See footnote 3.
Thomas K. Lee | U.S. Energy Information Administration | This paper is released to encourage discussion and critical comment. The analysis and conclusions expressed here are those of the authors and not necessarily those of the U.S. Energy Information Administration.

60
Regarding the question of futures prices being unbiased predictors, define htS + as the spot
rate at date t+h and ( )hfF the futures price at time t for delivery at t+h. In separate tests,
Alquist and Kilian also find that generally the futures price is an unbiased predictor of the
spot price in tests of the model ( )( ) htth
ttht sfss ++ ε+−β+α=− where lower case letters
denote natural log transforms, and ht+ε is a mean zero error. Unbiasedness is implied by
the null hypothesis 1,0 =β=α . Quoting the authors “The reason that ( )htF (the futures
price) is an inferior predictor to tS (the spot price) is not so much that it is different on
average from tS , but that it fluctuates relative to tS .” (p.562). Alquist and Kilian
attribute the additional volatility of the futures price to shifts in the marginal convenience yield. The authors are not alone in finding that oil futures prices are unbiased predictors of spot prices, which is also found by Cherenko, Schwarz and Wright (2004) examining data from 1989:04-2003:12; Chinn, LeBlanc and Coibion (2005) examining data from 1990:01-2004:10 and Chinn and Coibion (2010) examining data from 1990:01-2009:10. Wu and McCallum also cannot reject the hypothesis that futures prices are unbiased estimates of the spot price. Coppola (2008), building on the equilibrium no arbitrage relation between spot and futures prices, estimates a vector error correction model and finds evidence that the long-run no arbitrage relation between spot and futures prices of oil is not violated.
6.3 Information and energy market transparency The availability of information on production and consumption of oil worldwide is, of course, paramount to the proper functioning of the oil spot market and oil futures market (see, for example, Krapels (2008), Lukken (2008) and Newsome (2008)). The Joint Oil Data Initiative was set up in 2001. The partner organizations are: APEC. EuroStat, IEA, IEF, OLADE, OPEC, UNSD. The organization collects data from over 90 countries including the United States. Countries provide data on a voluntary basis. The website for the organization states: “The objective of the Joint Oil Data Initiative is to increase oil data transparency. This involves assessing the current availability of monthly oil data, both in terms of geographical coverage and in terms of product and flow availability. One of the final objectives is to provide a complete, timely and comprehensive database allowing a freely accessible, reliable and accurate assessment of the global oil situation.“ The data are monthly. (http://www.jodidata.org/faq.shtm). The potential benefit of the JODI program is timeliness as participating countries submit (in principle) data on a monthly basis. Similar data however are also available, and have been for some time, from the Oil and Gas Journal for a nominal fee as well as national agencies such as the
Thomas K. Lee | U.S. Energy Information Administration | This paper is released to encourage discussion and critical comment. The analysis and conclusions expressed here are those of the authors and not necessarily those of the U.S. Energy Information Administration.

61
EIA. No study we are aware of has attempted to measure whether the initiation of JODI has produced more informational efficiency in the oil market. As mentioned earlier, the empirical evidence suggests that price changes in futures markets influence price changes in spot markets. A key ingredient in the formation of prices is information. New unexpected information about fundamentals pertaining to supply and demand provides an information ‘shock’ which can potentially influence both the level of prices as well as the volatility of prices. 6.3.1 Weekly Petroleum Status Report announcements (by EIA) The EIA Weekly Petroleum Status Report provides information on oil inventory and hence inventory changes. Such information reveals changes in supply and demand conditions due to the physical balance ‘equation’ in which production minus demand must equal the change in inventory. 6.3.2 Price level changes Chang, Daouk and Wang (2009) study the ability of market participants to forecast oil storage changes announced by the U.S. Energy Information Administration. The authors examine the relation between forecast errors and price changes where the forecast error equals a consensus forecasts assembled by Bloomberg minus the actual EIA announcements occurring at 10:30 AM on Wednesday for supply changes in crude oil, gasoline, and distillates. High frequency changes in the price of the nearby NYMEX WTI oil contract during the period 2003:06-2005:03 are studied. The authors document a sharp spike in the price at the time of the announcement. Prices then drift down for roughly 10 minutes and then show no upward or downward drift during the remainder of the day. These results are similar to those documented by Choiu-Wei, Linn and Zhu (2010) and Gay, Simkins and Turac (2009) for EIA announcements of the Weekly Natural Gas Storage Report. 6.3.3 Price volatility changes Fotak, Linn and Zhu (2008) examine the effect of Weekly Petroleum Status Report announcements on the intraday volatility of oil futures prices using data on the nearby NYMEX oil futures contract. The authors study the period January 15, 1999-Jan 31, 2008. The authors report sharp spikes in volatility around the time the WPSR is released after accounting for the sign and size of the surprise in the oil inventory announcement, where surprise is measured as the actual minus a statistical forecast of inventory.
Thomas K. Lee | U.S. Energy Information Administration | This paper is released to encourage discussion and critical comment. The analysis and conclusions expressed here are those of the authors and not necessarily those of the U.S. Energy Information Administration.

62
However, the authors also find that volatility in general has fallen over time. The authors’ results are similar in nature to results reported by Linn and Zhu (2004) who document the volatility response in the natural gas market to surprises about the change in natural gas in storage as revealed by the Weekly Natural Gas Storage Report. Interestingly in a follow on study of the natural gas market, Fotak, Linn and Zhu (2008) find that the volatility response has become smaller, essentially vanishing, in recent years. This does not appear to be true in the oil market. Some attribute the smaller response to the natural gas storage report to better and more complete information on physical natural gas now available from commercial sources such as Bentek Energy. 6.3.4 Oil rig count Despite the attention paid to the weekly release of changes in the number of oil rigs in operation by Baker Hughes, no study that we could find examines the impact of the announcement of the number of oil rigs in use on oil spot or futures prices. 6.3.5 Impacts of other oil-related announcements The strategic petroleum reserve (SPR) was established in 1977 by the United States to act as a backstop against major petroleum supply interruptions. According to Department of Energy statistics the SPR is currently filled to capacity (727 million barrels), however the Energy Policy Act of 2005 authorized an increase to 1 billion barrels however decisions on expansion sites have not been concluded. Several authors have suggested the reserve is simply too small to be an effective tool for moderating price (Taylor and Van Doren, 2005; Considine, 2006) while others disagree pointing to various emergency events such as the 1990-1991 Persian Gulf War (Medlock and Jaffe, 2009). Demirer and Kutan (2010) study how spot oil and futures prices react to announcements regarding additions to and releases from the reserve and find no statistically significant reactions. There study is an examination of only very short term price reactions.
6.3.6 News on macroeconomic conditions Kilian and Vega (2009) examine the relation between energy prices and macroeconomic news using daily spot oil prices for the period 1983-2008 and a wide range of announcements on macroeconomic variables, for example the unemployment rate and the employment report issued by BLS and durable goods orders issued by BC. The authors study whether surprises in macroeconomic announcements (measured as the actual value of the variable being announced minus a consensus forecast) influence changes in daily oil prices. The authors find no evidence that the price of WTI crude oil and the U.S.
Thomas K. Lee | U.S. Energy Information Administration | This paper is released to encourage discussion and critical comment. The analysis and conclusions expressed here are those of the authors and not necessarily those of the U.S. Energy Information Administration.

63
retail price of gasoline respond significantly to any of the U.S. macroeconomic news announcements they study. The authors do not examine intraday price responses to such announcements. Similar results are reported by Roache and Rossi (2009) in a study spanning the period 1997:01-2009:06. 6.3.7 News on monetary policy
Short run effects Kilian and Vega (2009) include announcements of the target federal funds rate in the collection of macroeconomic announcements they study. They find no short term (daily) impact of announcement surprises pertaining to this variable and oil price changes. Roache and Rossi (2009) find similar results. Longer run effects In contrast to the finding by Kilian and Vega of no short-run effects of monetary policy announcements, evidence presented in Barsky and Kilian (2002, 2004) and Anzuini, Lombardi and Pagano (2010) suggests that monetary policy shocks may have longer term, albeit not large, effects on oil prices and oil market variables. Anzuini et al. for instance examine the impact of monetary policy shocks within the context of a structural vector autoregression model of real and monetary variables estimated using monthly U.S. data from 1970:01-2009:09. The authors investigate the impact of a 100 basis point drop in the federal funds rate (the monetary policy tool) and find that oil prices respond sharply, with the peak of the response occurring about 6 months following the shock. However, they conclude, similar to Barsky and Kilian that while monetary policy shifts do have an impact on oil prices the effect is small. 6.4 Summary Section 6 has as its overarching theme the relation between information and prices and how changes in information are manifested in prices. The first part of the section focused on the relation between spot prices and the information contained in futures prices (sections 6.1 and 6.2) and the second part focused on the relation between non-price fundamental information and prices. Several pieces of evidence emerge: 1. Price discovery tends to occur in the futures market, although some evidence suggests that from a global perspective that the Dubai spot price has an important impact on prices around the globe, 2. Price discovery occurs on the market that provides the greatest liquidity, 3. Speculators do not confound the price discovery process and 4. Futures
Thomas K. Lee | U.S. Energy Information Administration | This paper is released to encourage discussion and critical comment. The analysis and conclusions expressed here are those of the authors and not necessarily those of the U.S. Energy Information Administration.

64
prices are unbiased predictors of spot prices but are not the least mean squared error predictors, 5. Both the level of front month contract oil futures prices as well as the volatility of those prices respond to the Weekly Petroleum Status Report and the response depends upon deviations between the actual ‘status’ data for oil and what industry observers had expected, 6. Prices do not respond in the short run to macroeconomic announcements, including monetary policy variables, but do appear to respond over longer terms to monetary policy announcements, 7. Prices do not respond to announcements about the rig count. 7. Conclusions This paper documents the findings of a study undertaken to identify gaps in current information and analysis pertaining to price formation, volatility and the role of hedging and speculation in the global oil market. The recent behavior of oil prices has attracted much attention and generated considerable debate and research about the forces that drove price changes. One view is that recent oil price behavior was due to fundamental supply and demand factors. The principal alternative hypothesis attributes the run up in prices to excess speculation and possibly manipulation. The empirical evidence suggests that these arguments are not mutually exclusive. Our survey uncovers considerable evidence based on several research studies to suggest that fundamental factors, namely stagnant supply, unexpected economic growth from China and other countries such as India, low interest rates and a weak U.S. dollar, were at least associated with and may have contributed to the sharp oil price run-up and subsequent decline in the 2007-08 period. There is also some evidence to suggest that the price run-up and decline may have been exacerbated by the formation and collapse of an oil price bubble, perhaps triggered by fundamental factors in both the oil market and the broader global economy. There is considerable evidence pointing to a major increase in oil derivatives trading and a significant change in the composition of derivatives traders (such as the growth of swap dealers, hedge funds, and commodity index funds) over the past decade. In our view, the contribution, if any, of these traders and of speculation in oil derivatives to the 2007-08 oil market turbulence remains undetermined. A number of studies argue that if futures speculation raises the cash price above the supply-demand level, a buildup in oil inventories should be observed. Extant research finds no evidence of such a buildup during the 2007-08 oil price rise. However, there has been no substantive research on how oil inventories respond to the futures-spot price spread, which should be the mechanism connecting financial market speculation and physical oil prices if the latter
Thomas K. Lee | U.S. Energy Information Administration | This paper is released to encourage discussion and critical comment. The analysis and conclusions expressed here are those of the authors and not necessarily those of the U.S. Energy Information Administration.

65
are determined by supply and demand. According to standard financial market theory, arbitrageurs have an incentive to buy oil in the spot market and put it in storage when the futures price exceeds the spot price by enough to cover storage costs, and to sell oil from inventories when the futures price is below the spot price. This provides an avenue for futures market speculation to impact physical oil prices. While a few researchers have calculated simple correlations between the futures-spot spread and inventory levels (or spot prices and inventories), none (to our knowledge) have controlled for other factors that impact inventory levels and prices, such as supply and demand shocks which would impact both oil prices and inventory levels. Additionally, none have explored which futures prices matter and which inventories are impacted, or investigated whether inventory levels adjust immediately to the desired level or with a lag. A link between financial market speculation and physical oil prices, if any, cannot be established without a careful examination of these questions. Finally, the Granger causality tests which have been conducted to date to test whether open interest position changes by speculators lead or lag futures price changes provide evidence on whether or not various types of speculators are able to forecast future changes in futures prices but shed little light on how speculation impacts oil futures prices.
Empirical evidence on the nearby NYMEX WTI oil futures contract prices indicates that (a) prices exhibit mean reversion to a stochastically changing mean; (b) volatility has become larger over time and itself exhibits randomness; (c) volatility at any date is conditionally related to volatility in the recent past; (d) there is long-memory in volatility; and (e) oil prices exhibit jumps and this leads to the result that the distribution of oil price changes exhibits ‘fat tails’. The afore-mentioned conclusions are drawn without any formal attempt to explain the findings. The issue of what factors drive oil futures price volatility has important policy implications and warrants additional research. Anecdotal evidence suggests that the contemporaneous correlation between oil futures price changes (returns) and U.S. common stock returns is positive and has increased dramatically in recent years. The factors driving this closer association warrant further attention and may, in turn, be related to those driving volatility, for instance speculation and the increased activities of hedge funds and commodity index funds.
The domestic (U.S.) evidence on the link between the market prices of oil futures contracts and spot prices tends to support the proposition that on average price discovery occurs in the futures market. However, some limited evidence suggests that feedback between the spot and futures market is present but that neither market leads or lags the other on a consistent basis. Further, albeit confined to a single study, there is evidence of complex links between global spot and futures markets suggesting, in fact, that there is no
Thomas K. Lee | U.S. Energy Information Administration | This paper is released to encourage discussion and critical comment. The analysis and conclusions expressed here are those of the authors and not necessarily those of the U.S. Energy Information Administration.

66
direct link between domestic U.S. oil futures prices and domestic U.S. spot market prices. Further study of where price discovery occurs is important to parse out what is going on. This is particularly important if activities in the futures market can be influenced by factors other than demand-supply fundamentals.
Related evidence on volatility spillover across global spot and futures markets suggests that the key markets for volatility transmission to other markets are the WTI and Brent spot and futures markets; however, interestingly the extant evidence does not suggest volatility spillover from the WTI futures to the WTI spot, or vice versa. The importance of volatility and the dearth of current evidence on volatility spillovers across oil markets calls for a comprehensive investigation of this issue. While NYMEX oil futures prices are generally found to be unbiased predictors of future spot prices, the best out-of-sample forecast for 1, 3, 6, 9 and 12 month forecast horizons, in a mean-squared error sense, is the current spot price. This arises because futures prices are more volatile.
Price levels for the nearby WTI futures contract as well as the volatility of futures prices respond to unexpected changes in oil inventories based upon forecasts of the change and the actual change as reported in the Weekly Petroleum Status Report evaluated at the immediate time-of-day of the report’s release. Interestingly, there is no evidence of short-term price responses to a wide range of macroecomonic announcements including announcements about monetary policy choice variables.
Reduced form models of short-term oil price changes have become the standard amongst traders of oil futures and options on oil futures. The model that has emerged as the working standard, based upon the fit of computed futures and options on futures prices, is a process in which prices revert over time to a stochastically changing mean. As the foregoing discussion illustrates, the effect of financial trading in oil derivatives and spot markets on oil price levels and volatility is the area where there is the greatest dearth of research. Filling this gap is essential to gaining a complete understanding of the determinants of oil prices and providing a scientific basis for policy formulation. Recent changes in the nature of the oil market, especially the dramatic growth of the financial oil market relative to the physical oil market, suggests that a commensurate ramp-up in data collection on the financial oil market and making this data more widely available to researchers is required in order to complete the oil market data picture and enable research on the effects of financial market trading on the level and volatility of oil prices. This includes (a) more disaggregate data on the trading patterns in the energy futures
Thomas K. Lee | U.S. Energy Information Administration | This paper is released to encourage discussion and critical comment. The analysis and conclusions expressed here are those of the authors and not necessarily those of the U.S. Energy Information Administration.

67
markets; (b) data on OTC trading and positions in energy derivatives; (c) more accurate data on oil storage, especially oil stored on-shore and off-shore for investment, trading and other non-operational purposes.
Thomas K. Lee | U.S. Energy Information Administration | This paper is released to encourage discussion and critical comment. The analysis and conclusions expressed here are those of the authors and not necessarily those of the U.S. Energy Information Administration.

References Adams, F. G., Shachmurove, Y., 2007, Modeling and Forecasting Energy Consumption in China: Implications for Chinese Energy Demand and Imports in 2020, Energy Economics 30, 1263-1278. Agnolucci, P., 2009, Volatility in Crude Oil Futures: A Comparison of the Predictive Ability of GARCH and Implied Volatility Models, Energy Economics 31, 316-321. Akram, Q. F., 2009, Commodity Prices, Interest Rates and the Dollar, Energy Economics 31, 838-851. Alquist, R., Kilian, L., 2010, What Do We Learn from the Price of Crude Oil Futures? Journal of Applied Econometrics 25, 539-573. Andersen, T., Bondarenko, O., 2007, Construction and Interpretation of Model-Free Implied Volatility, In Volatility as an Asset Class, edited by Israel Nelken, 141-184. London, UK: Risk Publications. Anzuini, A., Lombardi, M. J., Pagano, P., 2010, The Impact of Monetary Policy Shocks on Commodity Prices, Working Paper, European Central Bank. Askari, H., Krichene, N., 2008, Oil Price Dynamics (2002-2006), Energy Economics 30, 2134-2153. Aulerich, N. M., Irwin, S. H., Garcia, P., 2010, The Price Impact of Index Funds in Commodity Futures Markets: Evidence from the CFTC’s Daily Large Trader Reporting System, Working Paper, University of Illinois at Urbana-Champaign and US Commodity Futures Trading Commission. Baillie, R. T., Booth, G. G., Tse, Y., Zabotina, T., 2002, Price Discovery and Common Factor Models, Journal of Financial Markets 5, 309-321. Bakanova, A., 2010, The Information Content of Implied Volatility in the Crude Oil Market. Working Paper, University of Lugano and Swiss Finance Institute. Barsky, R. B., Kilian, L., 2002, Do We Really Know that Oil Caused the Great Stagflation? A Monetary Alternative, NBER Macroeconomics Annual 16, 137-198. Barsky, R. B., Kilian, L., 2004, Oil and the Macroeconomy since the 1970s, Journal of Economic Perspectives 18, 115-134. Baumeister, C., Peersman, G., 2009, Sources of the Crude Oil Market Volatility Puzzle, Working Paper, Bank of Canada and Ghent University.
Thomas K. Lee | U.S. Energy Information Administration | This paper is released to encourage discussion and critical comment. The analysis and conclusions expressed here are those of the authors and not necessarily those of the U.S. Energy Information Administration.

69
Bekiros, S. D., Diks, C. G. H., 2008, The Relationship Between Crude Oil and Futures Prices: Cointegration, Linear and Nonlinear Causality, Energy Economics 30, 2673-2685. Bernard, J., Khalaf, L., Kichian, M., McMahon, S., 2008, Oil Prices: Heavy Tails, Mean Reversion and the Convenience Yield, Working Paper, University of Laval and Bank of Canada. Bessembinder, H., Coughenour, J. F., Seguin, P. J., Smoller, M. M., 1995, Mean Reversion in Equilibrium Asset Prices: Evidence from the Futures Term Structure, Journal of Finance 50, 361-375. Brennan, M., Schwartz, E., 1985, Evaluating Natural Resource Investments, The Journal of Business 58, 135-157 Black, F., 1976, The Pricing of Commodity Contracts, Journal of Financial Economics 3, 167-179. Breitenfellner, A., Cuaresma, J., 2008, Crude Oil Prices and USD/EUR Exchange Rate, Monetary Policy & The Economy Q4/08, 102-128. Brennan, M., 1958, The Supply of Storage, American Economic Review 48, 50-72. Brennan, M., Schwartz, E.. 1985, Evaluating Natural Resource Investments, Journal of Business 58, 135-157. Brown, S., Yucel, M., 2008, What Drives Natural Gas Prices, Energy Journal 29, 45-60. Brunetti, C., Büyükşahin, B., 2009, Is Speculation Destabilizing? Working Paper, John Hopkins University, US Commodity Futures Trading Commission, and International Energy Agency. Bryant, H. L., Bessler, D. A., Haigh, M. S., 2006, Causality in Futures Markets, Journal of Futures Markets 26, 1039-1057. Büyükşahin, B., Haigh, M. S., Harris, J. H., Overdahl, J. A., Robe, M. A., 2008, Fundamentals, Trader Activity and Derivative Pricing, Working Paper, US Commodity Futures Trading Commission. Büyükşahin, B., Haigh, M., Robe, M., 2010, Commodities and Equities: Ever a “Market of One?” Journal of Alternative Investments12, 76-95. Büyükşahin, B., Harris, J. H., 2009, The Role of Speculators in the Crude Oil Futures Markets, Working Paper, US Commodity Futures Trading Commission.
Thomas K. Lee | U.S. Energy Information Administration | This paper is released to encourage discussion and critical comment. The analysis and conclusions expressed here are those of the authors and not necessarily those of the U.S. Energy Information Administration.

70
Caballero, R., Farhi, E., Gourinchas, P., 2008, Financial “Whac-a-Mole”: Bubbles, Commodity Prices and Global Imbalances, Working Paper, MIT, Harvard University, and National Bureau of Economic Research. Cabinet Office, 2008. The Rise and Fall in Oil Prices: Analysis of Fundamental and Financial Drivers, London. http://webarchive.nationalarchives.gov.uk/20090113232320/http://cabinetoffice.gov.uk/reports/oil.aspx. Caporale , G., Ciferri, D., Girardi, A., 2010, Time-Varying Spot and Futures Oil Price Dynamics, Working Paper, Center for Empirical Finance, Brunel University. Carlson, M., Khokher, Z., Titman, S., 2007, Equilibrium Exhaustible Resource Price Dynamics, Journal of Finance 62, 1663-1702. CBOE, 2009, The CBOE volatility index – VIX, Chicago Board Options Exchange, Chicago, IL. http://www.cboe.com/micro/vix/vixwhite.pdf Chakravorty, U., Roumasset, J., and Tse, K., 1997, Endogenous Substitution Among Energy Resources and Global Warming, The Journal of Political Economy 105, 1201—1234. Chambers, M., Baileym R., 1996, A Theory of Commodity Price Fluctuations, Journal of Political Economy 104, 924–957. Chang, C., Daouk, H., Wang, A., 2009, Do Investors Learn About Analyst Accuracy? A Study of the Oil Futures Market, Journal of Futures Markets 29, 414-429. Chang, C., McAleer, M., Tansuchat, R., 2010, Analyzing and Forecasting Volatility Spillovers, Asymmetries and Hedging in Major Oil Markets, Energy Economics 32, 1445-1455. Chen, S., 2009, Revisiting the Inflationary Effects of Oil Prices, Energy Journal 30, 141-154. Chernenko, S., Schwarz, K., Wright, J., 2004, The Information Content of Forward and Futures Prices: Market Expectations and the Price of Risk, International Finance Discussion Papers No. 808, Board of Governors of the Federal Reserve System. Chinn, M., Coibion, O., 2010, The Predictive Content of Commodity Futures, Working Paper, University of Wisconsin, Madison and National Bureau of Economic Research. Chinn, M., Leblanc, M., Coibion, O., 2005, The Predictive Content of Energy Futures: An Update on Petroleum, Natural Gas, Heating Oil and Gasoline, Working Paper, National Bureau of Economic Research.
Thomas K. Lee | U.S. Energy Information Administration | This paper is released to encourage discussion and critical comment. The analysis and conclusions expressed here are those of the authors and not necessarily those of the U.S. Energy Information Administration.
71
Chiou-Wei, S., Linn, S., Zhu, Z., 2010, Fundamental News and the Behavior of Commodity Prices: Price Discovery and Spike in U.S. Natural Gas Prices, Working Paper, University of Oklahoma. Chong, J., Miffre, J., 2010, Conditional Correlation and Volatility in Commodity Futures and Traditional Asset Markets, Journal of Alternative Investments 12, 61-075. Clewlow, L., Strickland, C., 2000, Energy Derivatives: Pricing and Risk Management, Lacima Publications, London. Cologni, A., Manera, M., Oil Prices, Inflation and Interest Rates in a Structural Cointegrated VAR Model for the G-7 Countries, Energy Economics 30, 856-888. Commodity Futures Trading Commission (CFTC), 2008, Staff Report on Commodity Swap Dealers & Index Traders with Commission Recommendations. http://www.cftc.gov /ucm/groups/public/@newsroom/documents/file/cftcstaffreportonswapdealers09.pdf. Commodity Futures Trading Commission (CFTC), December 2009, Index Investment Data.http://www.cftc.gov/ucm/groups/public/@marketreports/documents/file/indexinvestment 1209.pdf. Considine, T. J., 2006, Is The Strategic Petroleum Reserve Our Ace in The Hole? Energy Journal 27, 91-112. Coppola A., 2008, Forecasting Oil Price Movements: Exploiting the Information in the Futures Market, Journal of Futures Markets 28, 34-56. Cortazar, G., Milla, C., Severino, F., 2008, A Multicommodity Model of Futures Prices: Using Futures Prices of One Commodity to Estimate the Stochastic Process of Another, Journal of Futures Markets 28, 537-560. Cortazar, G., Naranjo, L., 2006, An N-Factor Gaussian Model of Oil Futures Prices, Journal of Futures Markets 26, 243-268. Cortazar, G., Schwartz, E. S., 2003, Implementing a Stochastic Model for Oil Futures Prices, Energy Economics 25, 215-238. Credit Suisse, 2008, Hedging Summary, Credit Suisse International. [Not available from public sources. Obtained directly from Credit Suisse.] Cunado, J., Gil-Alana, L. A., de Gracia, F. P., 2010, Persistence in Some Energy Futures Markets, Journal of Futures Markets 30, 490-507. Dargay, J., Gately, D., 2010, World Oil Demand’s Shift toward Faster Growing and Less Price-Responsive Products and Regions, Energy Policy 38, 6261-6277.
Thomas K. Lee | U.S. Energy Information Administration | This paper is released to encourage discussion and critical comment. The analysis and conclusions expressed here are those of the authors and not necessarily those of the U.S. Energy Information Administration.

72
Das, S., Sundaram, R., 1999, Of Smiles and Smirks: A Term Structure Perspective, Journal of Financial and Quantitative Analysis 34, 211-239. Deaton, A., Laroque, G., 1992, On the Behavior of Commodity Prices, Review of Economic Studies 59, 1–23. Deaton, A., Laroque, G., 1996, Competitive Storage and Commodity Price Dynamics. Journal of Political Economy 104, 896–923. Dees, S., Gastauil, A., Kaufmann, R., Mann, M., 2008, Assessing the Factors Behind Oil Price Changes, Working Paper, European Central Bank. Dees, S., Karadeloglou, P., Kaufmann, R., Sanchez, M., 2007, Modelling the World Oil Market: Assessment of A Quarterly Econometric Model, Energy Policy 35, 178-191. Demirer, R., Kutan, A., 2010, The Behavior of Crude Oil Spot and Futures Prices around OPEC and SPR Announcements: An Event Study Perspective, Energy Economics 32, 1467-1476. Dewally, M., Ederington, L. H., Fernando, C. S., 2010, Determinants of Trading Profits of Individual Traders: Risk Premia or Information? Working Paper, Towson University and University of Oklahoma. Deutsche Bank, 2008, Commodities Outlook, Global Market Research, Deutsche Bank AG.http://www.deutsche-bank.de/medien/en/downloads/Commodities_outlook_11_jan.pdf. Deutsche Bank, 2009, Commodities Outlook, Global Market Research, Deutsche Bank AG. http://www.foxexchange.com/public/fox/advisors/sa_materials/commo_outlook.pdf. Diwan, R., 2008, Testimony Before the US House of Representatives Sub-Committee on Oversight and Investigation, US House of Representatives Committee on Energy and Commerce, Washington DC, June 23. http://archives.energycommerce.house.gov/cmte_mtgs/110-oi-hrg.062308.EnergySpec.shtml. Dixit, A., Pindyck, R, 1994, Investment under Uncertainty, Princeton University Press, Princeton, NJ. Duffie, D., Gray, S., Hoang, P., 2004, Volatility in Energy Prices, in V. Kaminski, ed.: Managing Energy Price Risk, 3rd ed., Risk Publications, London, 539-571. Dvir, E., Rogoff, K., 2010, The Three Epochs of Oil, Working Paper, Harvard University and National Bureau of Economic Research.
Thomas K. Lee | U.S. Energy Information Administration | This paper is released to encourage discussion and critical comment. The analysis and conclusions expressed here are those of the authors and not necessarily those of the U.S. Energy Information Administration.

73
Ederington, L. H., 2002, Who Trades Futures and How: Evidence from the Heating Oil Futures Market, Journal of Business 75, 353-373. EIA, 2009, Energy Price Volatility and Forecast Uncertainty, Short-Term Energy Outlook Supplement, U.S. Energy Information Administration. http://www.eia.doe.gov/emeu/steo/pub/special/2009_sp_05.html. Einloth, J., 2009, Speculation and Recent Volatility in the Price of Oil, Working Paper, Division of Insurance and Research, Federal Deposit Insurance Corporation. Engle, R. F., Lee, G. G. J., 1999, A Permanent and Transitory Component Model of Stock Return Volatility, in R.F. Engle and H. White (eds.), Cointegration, Causality, and Forecasting: A Festschrift in Honor of Clive W.J. Granger, 475-497. Oxford, UK: Oxford University Press. Erb, C. B., Harvey, C. R., 2006, The Strategic and Tactical Value of Commodity Futures, Financial Analysts Journal, 62, 69–97. Evans, T., The Growth in NYMEX Trade, Citi Futures Perspective, Energy Market Analysis, Citigroup. http://archives.energycommerce.house.gov/Investigations/EnergySpeculationBinder_062308/9.pdf. Ewing, B., Malik, F., Ozfidan, O., 2002, Volatility Transmission in the Oil and Natural Gas Markets, Energy Economics 24, 525-538. Eydeland, A., Wolyniec, K., 2003, Energy and Power Risk Management, John Wiley & Sons, Hoboken, NJ. Fattouh, B., 2005, The Causes of Crude Oil Price Volatility, Middle East Economic Survey XLVIII. Fattouh, B., 2007, The Drivers of Oil Prices: The Usefulness and Limitations of Non-Structural Model, The Demand-Supply Framework and Informal Approaches, Working Paper, Oxford Institute for Energy Studies, University of Oxford. Figuerola-Ferretti, I., Gonzalo, J., 2010, Modelling and Measuring Price Discovery on the NYMEX and IPE Crude Oil Markets, Journal of Econometrics 158, 95-107. Fong, W. M., See, K. H., 2002, A Markov Switching Model of the Conditional Volatility of Crude Oil Futures Prices, Energy Economics 24, 71–95. Fotak, V., Linn, S., Zhu, Z., 2008, Natural Gas Price Volatility. Natural Gas and Electricity 24, 8-13.
Thomas K. Lee | U.S. Energy Information Administration | This paper is released to encourage discussion and critical comment. The analysis and conclusions expressed here are those of the authors and not necessarily those of the U.S. Energy Information Administration.

74
Frankel, J. A., 2006, Commodity Prices, Monetary Policy, and Currency Regimes, Working Paper, National Bureau of Economic Research. Garbade, K. D., Silber, W. L., 1983, Price Movements and Price Discovery in Futures and Cash Markets, Review of Economics and Statistics 65, 289-297. Gately, D., Huntington, H., 2002, The Asymmetric Effects of Changes in Price and Income on Energy and Oil Demand, Energy Journal 23, 19-37. Gaudet, G., 2007, Natural Resource Economics under the Rule of Hotelling Canadian Journal of Economics 40, 1033-1059. Gay, G, Simkins, B., Turac, M., 2009, Analysts Forecasts and Price Discovery in Futures Markets: The Case of Natural Gas Storage, Journal of Futures Markets 29, 451-477. Geman, H., Ohana, S., 2008, Mean-Reversion and Structural Breaks in Crude Oil, Copper and Shipping, In Risk Management in Commodity Markets, ed. H. Geman, 183-205. Geman, H., 2007, Mean Reversion Versus Random Walk in Oil and Natural Gas Prices, In Advances in Mathematical Finance, ed. Michael C. Fu, Robert A. Jarrow, Ju-Yi Yen, and Robert J. Elliott, 219-228. Boston: Birkhauser. Gheit, F., 2008, Testimony Before the US House of Representatives Sub-Committee on Oversight and Investigation, US House of Representatives Committee on Energy and Commerce, Washington DC, June 23. http://archives.energycommerce.house.gov/cmte_mtgs/110-oi-hrg.062308.EnergySpec.shtml. Gibson, R., Schwartz, E. S., 1990, Stochastic Convenience Yield and the Pricing of Oil Contingent Claims, Journal of Finance 45, 959-976. Gilbert, C. L., 2008, Commodity Speculation and Commodity Investment, Working Paper, University of Trento and University of London. Gilbert, C. L., 2009, Speculative Influences on Commodity Futures Prices, 2006-2008, Working Paper, University of Trento. Gonzalo, J., Granger, C.W.J., 1995, Estimation Of Common Long-Memory Components In Cointegrated Systems. Journal of Business & Economic Statistics 13, 27–36. Gorton, G., Rouwenhorst, K. G., 2006, Facts And Fantasies about Commodity Futures, Financial Analysts Journal, 62, 47–68.
Thomas K. Lee | U.S. Energy Information Administration | This paper is released to encourage discussion and critical comment. The analysis and conclusions expressed here are those of the authors and not necessarily those of the U.S. Energy Information Administration.

75
Greenberger, M., 2008, Testimony Before the US House of Representatives Sub-Committee on Oversight and Investigation, US House of Representatives Committee on Energy and Commerce, Washington DC, June 23. http://archives.energycommerce.house.gov/cmte_mtgs/110-oi-hrg.062308.EnergySpec.shtml. Griffin, J., Schulman, G., 2005, Price Asymmetry in Energy Demand Models: A Proxy for Energy-Saving Technical Change, Energy Journal 26, 1–21. Gronwald, M, 2009, Jumps in Oil Prices: Evidence and Implications, Working Paper, Institute for Economic Research, University of Munich. Guera, S., 2008, Long Run Relationship between Oil Prices and Aggregate Oil Investment: Empirical Evidence, Working Paper, United States Association of Energy Economists. Guilford, G., 2008, Testimony Before the US House of Representatives Sub-Committee on Oversight and Investigation, US House of Representatives Committee on Energy and Commerce, Washington DC, June 23. http://archives.energycommerce.house.gov/cmte_mtgs/110-oi-hrg.062308.EnergySpec.shtml. Gurrib, I., 2007, The Impact of Speculators' Activity on Crude Oil Futures Prices, Working Paper, Prince Sultan University. Haigh, M. S., Hranaiova, J., Overdahl, J. A., 2005, Price Dynamics, Price Discovery and Large Futures Trader Interactions in the Energy Complex, Working Paper, US Commodity Futures Trading Commission. Hamilton, J. D., 2008, Oil and the Macroeconomy, in S. Durlauf and L. Blume (eds.), The New Palgrave Dictionary of Economics, 2nd edition, Palgrave Macmillan. Hamilton, J. D., 2009a, Causes and Consequences of the Oil Shock of 2007-08, Working Paper, National Bureau of Economic Research. Hamilton, J. D., 2009b, Understanding Crude Oil Prices, Energy Journal 30, 179-206. Harris F., McInish, T., Shoesmith, G., Wood, R., 1995, Cointegration, Error Correction, and Price Discovery on Informationally Linked Security Markets, Journal of Financial and Quantitative Analysis 30, 563-579. Hartley, P., Medlock, K., Rosthall, E., 2008, The Relationship of Natural Gas to Oil Prices, Energy Journal 29, 47-65. Hasbrouck, J., 1995, One Security, Many Markets: Determining the Contributions to Price Discovery, Journal of Finance, 50, 1175-1199.
Thomas K. Lee | U.S. Energy Information Administration | This paper is released to encourage discussion and critical comment. The analysis and conclusions expressed here are those of the authors and not necessarily those of the U.S. Energy Information Administration.

76
He, Y., Wang, S., Lai, K., 2010, Global Economic Activity and Crude Oil Prices: A Cointegration Analysis, Energy Economics 32, 868–876. Herrera, A. M., Pesavento, E., 2009, Oil Price Shocks, Systematic Monetary Policy, and the Great Moderation, Macroeconomic Dynamics 13, 107–137. Horan, S. M., Peterson, J. H., Mahar, J., 2004. Implied Volatility of Oil Futures Options Surrounding OPEC Meetings, Energy Journal 25, 103-125. Hotelling, H., 1931, The Economics of Exhaustible Resources, Journal of Political Economy 39, 137-175. Huang, R. D., Masulis, R. W., Stoll, H. R., 1996, Energy Shocks and Financial Markets, Journal of Futures Markets, 16, 1-27. Hubbert, M, 1956, Nuclear Energy and the Fossil Fuels, Shell Development Company Exploration and Research Division, Publication 95. http://www.hubbertpeak.com/hubbert/1956/1956.pdf. Hull, J. C., 2008, Options, Futures and Other Derivative Securities, Englewood Cliffs, NJ: Prentice-Hall. IMF, 2008, World Economic Outlook: Housing and the Business Cycle, International Monetary Fund. http://www.imf.org/external/pubs/ft/weo/2008/01/pdf/text.pdf. Interagency Task Force on Commodity Markets (ITFCM), 2008, Interim Report on Crude Oil. http://www.cftc.gov/ucm/groups/public/@newsroom/documents/file/itfinterimreporton crudeoil0708.pdf. International Energy Agency (IEA), 2008, Medium Term Oil Market Report, July. http://omrpublic.iea.org/omrarchive/mtomr2008.pdf. Irwin, S., Sanders, D., Merrin, R., 2009, Devil or Angel: The Role of Speculation in the Recent Commodity Price Boom (and Bust), Journal of Agricultural and Applied Economics, 41, 377–391. Jiang, G. J., Tian, Y. S., 2005, Model-Free Implied Volatility and its Information Content, Review of Financial Studies 18, 1305-1342. Jones, C. M., Kaul, G., 1996, Oil and the Stock Markets, Journal of Finance 51, 463-491. JP Morgan, 2005, Energy Markets Grow Up: How the Changing Balance of Participation Influences Oil Price, Working Document of the National Petroleum Council Global Oil & Gas Study. http://www.npc.org/Study_Topic_Papers/31-Macro-MarketsGrowUp.pdf.
Thomas K. Lee | U.S. Energy Information Administration | This paper is released to encourage discussion and critical comment. The analysis and conclusions expressed here are those of the authors and not necessarily those of the U.S. Energy Information Administration.
77
JP Morgan, 2007, Energy Markets Grow Up Part II: Who Trades Energy Now and How Much does it Matter? Working Document of the National Petroleum Council Global Oil & Gas Study. http://www.npc.org/Study_Topic_Papers/32-MacroMarketsGrowUp2.pdf. Just, D., Just, R., 2008, Monopoly Power, Futures Market Manipulation, and the Oil Price, Journal of Agricultural & Food Industrial Organization 6, 1-27. Kaldor, N., 1939, Speculation and Economic Stability, Review of Economic Studies 7, 1–27. Kang, S. H., Kang, S. M., Yoon, S. M., 2009, Forecasting Volatility of Crude Oil Markets, Energy Economics, 31, 119–125. Kat, H., Oomen, R., 2007a, What Every Investor Should Know About Commodities Part I, Journal of Investment Management 5, First Quarter, 4–28. Kat, H., Oomen, R., 2007b, What Every Investor Should Know About Commodities Part II: Multivariate Return Analysis, Journal of Investment Management 5, Third Quarter, 40–64. Kaufmann, R. K., Bradford, A., Belanger, L. H., Mclaughlin, J. P., Miki, Y., 2008a, Determinants of OPEC Production: Implications for OPEC Behavior, Energy Economics 30, 333-351. Kaufmann, R. K., Dees, S., Gasteuil, A., Mann, M., 2008b, Oil Prices: The Role of Refinery Utilization, Futures Market and non-linearities, Energy Economics 30, 2609-2622. Kaufmann, R. K., Dees, S., Karadeloglou, P., Sanchez, M., 2004, Does OPEC Matter? An Econometric Analysis of Oil Prices. Energy Journal 25, 67–90. Kaufmann, R. K., Ullman, B., 2009, Oil Prices, Speculation, and Fundamentals: Interpreting Causal Relations among Spot and Futures Prices, Energy Economics 31, 550–558. Kesicki, F., 2010, The Third Oil Price Surge - What's Different this Time? Energy Policy 38, 1596-1606. Kilian, L., 2009, Not All Oil Price Shocks Are Alike: Disentangling Demand and Supply Shocks in the Crude Oil Market, American Economic Review 99, 1053-1069. Kilian, L., Hicks, B., 2009, Did Unexpectedly Strong Economic Growth Cause the Oil Price Shock of 2003-2008? Working Paper, Center for Economic Policy Research and University of Michigan at Ann Arbor.
Thomas K. Lee | U.S. Energy Information Administration | This paper is released to encourage discussion and critical comment. The analysis and conclusions expressed here are those of the authors and not necessarily those of the U.S. Energy Information Administration.

78
Kilian, L., Murphy, D., 2010, The Role of Inventories and Speculative Trading in the Global Market for Crude Oil, Working Paper, Center for Economic Policy Research and University of Michigan at Ann Arbor. Kilian, L., Vega, C., 2009, Do Energy Prices Respond to U.S. Macroeconomic News? A Test of the Hypothesis of Predetermined Energy Prices, Review of Economics and Statistics, forthcoming. Kogan, L., Livdan, D. Yaron, A., 2009, Oil Futures Prices in a Production Economy with Investment Constraints, Journal of Finance 64, 1345-1375. Krapels, E. N., 2008, Testimony Before the US House of Representatives Sub-Committee on Oversight and Investigation, US House of Representatives Committee on Energy and Commerce, Washington DC, June 23. http://archives.energycommerce.house.gov/cmte_mtgs/110-oi-hrg.062308.EnergySpec.shtml. Krichene, N., 2007, An Oil and Gas Model, Working Paper, International Monetary Fund. Krichene, N., 2006, World Crude Oil Markets: Monetary Policy and the Recent Oil Shock, Working Paper, International Monetary Fund. Krichene, N., 2008, Recent Inflationary Trends in World Commodities Markets, Working Paper, International Monetary Fund. Krugman, P. 2009, Oil speculation, NYTimes.com, July 8. http://krugman.blogs.nytimes.com/2009/07/08/oil-speculation/. Krugman, P., 2008, Speculation and Signatures, NYTimes.com, June 24. http://krugman.blogs.nytimes.com/2008/06/24/speculation-and-signatures/. Lautier, D., Riva, F., 2008, The Determinants of Volatility on the American Crude Oil Futures Market, OPEC Energy Review June, 105-122. Lee, T., Zyren, J., 2007, Volatility Relationship Between Crude Oil and Petroleum Products, Atlantic Economic Journal 35, 97-112. Lee., T., Zyren, J., 2009, Effectiveness of Monetary Policy: Market Reactions and Volatility Interactions, Credit, Currency, or Derivatives: Instruments of Global Financial Stability or Crisis? (J. Choi and M. Papaioannou, eds.), International Finance Review 10, 355-387. Lee, Y., Hu, H., Chiou, J., 2010, Jump Dynamics with Structural Breaks for Crude Oil Prices, Energy Economics 32, 343-350.
Thomas K. Lee | U.S. Energy Information Administration | This paper is released to encourage discussion and critical comment. The analysis and conclusions expressed here are those of the authors and not necessarily those of the U.S. Energy Information Administration.

79
Lehman Brothers, 2008, Oil Dot-Com, Energy Special Report, Fixed Income Research, Commodities, Lehman Brothers Inc. http://archives.energycommerce.house.gov/Investigations/EnergySpeculationBinder_062308/11.pdf. Lin, C., 2009, Insights from a Simple Hotelling Model of the World Oil Market, Natural Resources Research 18, 19-28. Linn, S., Zhu, Z., 2004, Natural Gas Prices and the Gas Storage Report: Public News and Volatility in Energy Futures Markets, Journal of Futures Markets 24, 283-313. Lippi F., Nobili, A., 2008, Oil and the Macroeconomy: A Structural VAR Analysis with Sign Restrictions, Working Paper, Center for Economic Policy Research, University of Sassari, and Bank of Italy. Litzenberger, R. H., Rabinowitz, N., 1995, Backwardation in Oil Futures Markets: Theory and Empirical Evidence, Journal of Finance 50, 1517–1545. Lizardo, R. A., Mollick, A. V., Oil Price Fluctuations and U.S. Dollar Exchange Rates, Energy Economics 32, 399-408. Lukken, W., 2008, Testimony Before the US House of Representatives Sub-Committee on Oversight and Investigation, US House of Representatives Committee on Energy and Commerce, Washington DC, June 23. http://archives.energycommerce.house.gov/cmte_mtgs/110-oi-hrg.062308.EnergySpec.shtml. Masters, M. W., 2008, Testimony before the Committee on Homeland Security and Governmental Affairs, US Senate, Washington DC, May 20. http://hsgac.senate.gov/public/_files/052008Masters.pdf. Masters, M. W., White, A., 2008a, The Accidental Hunt Brothers: How Institutional Investors are Driving Up Food and Energy Prices, Masters Capital Management and White Knight Research and Trading. http://www.fpma.org/upload_library/200808HuntBrothersPartII.pdf. Masters, M. W., White, A., 2008b, The Accidental Hunt Brothers – Act 2: Index Speculators Have Been a Major Cause of the Recent Drop in Oil Prices, Masters Capital Management and White Knight Research and Trading. http://www.fpma.org/upload_ library/200808 HuntBrothersPartII.pdf. Masters, M. W., White, A., 2009, The 2008 Commodities Bubble: Assessing the Damage to the United States and its Citizens, Masters Capital Management and White Knight Research and Trading. http://media.mcclatchydc.com/smedia/2009/05/20/16/Hall-2008-Commodities.source.prod_affiliate.91.pdf.
Thomas K. Lee | U.S. Energy Information Administration | This paper is released to encourage discussion and critical comment. The analysis and conclusions expressed here are those of the authors and not necessarily those of the U.S. Energy Information Administration.

80
McDonald, R. L. 2006. Derivatives Markets. Reading, MA: Addison-Wesley. Medlock, K., Jaffe, A., 2009, Who is In The Oil Futures Market and How Has It Changed? Working Paper, James A. Baker III Institute for Public Policy, Rice University. Newsome, J., 2008, Testimony Before the US House of Representatives Sub-Committee on Oversight and Investigation, US House of Representatives Committee on Energy and Commerce, Washington DC, June 23. http://archives.energycommerce.house.gov/cmte_mtgs/110-oi-hrg.062308.EnergySpec.shtml. New York Mercantile Exchange (NYMEX), 2005, A Review of Recent Hedge Fund Participation in NYMEX Natural Gas and Crude Oil Futures Markets, Staff Report, New York Mercantile Exchange, March 1. http://www.cftc.gov/files/opa/press05/oparlevinwrittenmaterials.pdf. Organization for Economic Co-operation and Development (OECD) Working Party on Agricultural Policies and Markets, 2010, Speculation and Financial Fund Activity: Draft Report Annex I. http://www.oecd.org/officialdocuments/publicdisplaydocumentpdf/?cote=TAD/CA/APM/WP%282010%298/ANN1&docLanguage=En. Parsons, J. E., 2010, Black Gold & Fool’s Gold: Speculation in the Oil Futures Market, Economia 10, 81-116. Phillips, P., Yu, J., 2010, Dating the Timeline of Financial Bubbles, Working Paper, Yale University and Singapore Management University. Pierru, A., Babusiaux, D., 2010, Speculation without Oil Stockpiling as a Signature: A Dynamic Perspective, Working Paper, MIT, Center for Energy and Environmental Policy Research. Pindyck R. S., 1978, The Optimal Exploration and Production of Nonrenewable Resources, Journal of Political Economy 86, 841–61. Pindyck, R. S., 1980, Uncertainty and Exhaustible Resource Markets, Journal of Political Economy 88, 1203–1225. Pindyck, R. S., 1999, The Long-Run Evolution of Energy Prices, Energy Journal 20, 1-27. Pindyck, R. S., 2001, The Dynamics of Commodity Spot and Futures Markets: A Primer, Energy Journal 22, 1-29. Pindyck, R. S., 2004, Volatility and Commodity Price Dynamics, Journal of Futures Markets 24, 1029–1047.
Thomas K. Lee | U.S. Energy Information Administration | This paper is released to encourage discussion and critical comment. The analysis and conclusions expressed here are those of the authors and not necessarily those of the U.S. Energy Information Administration.

81
Radetzky, M., 2006, The Anatomy of Three Commodity Booms, Resources Policy 31, 56-64. Regnier, E., 2007, Oil and Energy Price Volatility, Energy Economics 29, 405-427. Reid, B., 2008, Testimony Before the US House of Representatives Sub-Committee on Oversight and Investigation, US House of Representatives Committee on Energy and Commerce, Washington DC, June 23. http://archives.energycommerce.house.gov/cmte_mtgs/110-oi-hrg.062308.EnergySpec.shtml. Ringlund, G. B., Rosendahl, K. E., Skjerpen, T., 2008, Does Oil rig Activity React to Oil Price Changes? An Empirical Investigation, Energy Economics 30, 371-396. Roache, S., Rossi, M., 2009, The Effects of Economic News on Commodity Prices: Is Gold Just Another Commodity? Working Paper, International Monetary Fund. Sadorsky, P., 1999, Oil Price Shocks and Stock Market Activity, Energy Economics 2, 449-469. Sadorsky, P., 2006, Modeling and Forecasting Petroleum Futures Volatility, Energy Economics 28, 467–488. Sanders, D. R., Irwin, S. H., 2010, Bubbles, Froth, and Facts: The Impact of Index Funds on Commodity Futures Prices, Working Paper, University of Illinois at Urbana-Champaign. Sauter, R., Awerbuch, S., 2003, Oil Price Volatility and Economic Activity: A Survey and Literature Review, Working Paper, International Energy Agency. Schwartz, E. S., Smith, J. E., 2000, Short-Term Variations and Long-Term Dynamics in Commodity Prices, Management Science 46, 893-911. Schwartz, E., 1997, The Stochastic Behavior of Commodity Prices: Implication for Valuation and Hedging, Journal of Finance 52, 922-973. Schwarz, T. V., Szakmary, A. C., 1994, Price Discovery in Petroleum Markets: Arbitrage Cointegration and the Time Interval of Analysis, Journal of Futures Markets 14, 147–167. Silvapulle P., Moosa, I. A., 1999, The Relationship between Spot and Futures Prices: Evidence from the Crude Oil Market, Journal of Futures Markets 19, 157-193. Singleton, K., 2010, The 2008 Boom/Bust in Oil Prices, Working Paper, Stanford University.
Thomas K. Lee | U.S. Energy Information Administration | This paper is released to encourage discussion and critical comment. The analysis and conclusions expressed here are those of the authors and not necessarily those of the U.S. Energy Information Administration.
82
Slade ME, Thille H. 1997. Hotelling confronts CAPM: a test of the theory of exhaustible resources, Canadian Journal of Economics 30, 685–708. Slade, M., Thille, H., 2009, Whither Hotelling: Tests of the Theory of Exhaustible Resources, Annual Review of Resource Economics 1, 239-260. Smith, J. L., 2005, Inscrutable OPEC? Behavioral Tests of the Cartel Hypothesis, Energy Journal 26, 51-82. Smith, J. L., 2009, World Oil: Market or Mayhem? Journal of Economic Perspectives 23, 145-164. Smith, J. L., 2010, On the Portents of Peak Oil (And Other Indicators of Resource Scarcity), Working Paper, Southern Methodist University. Sornette, D., Woodard, R., and Zhou, W., 2009, The 2006-2008 Oil Bubble: Evidence of Speculation, and Prediction, Physica A 388, 1571–1576. Staff Report of US Senate Permanent Subcomittee on Investigations, 2006, The Role of Market Speculation in Rising Oil and Gas Prices: A Need to Put the Cop Back on the Beat, Committee on Homeland Security and Governmental Affairs, United States Senate. http://hsgac.senate.gov/public/_files/SenatePrint10965MarketSpecReportFINAL.pdf. Steenland, D., 2008, Testimony Before the US House of Representatives Sub-Committee on Oversight and Investigation, US House of Representatives Committee on Energy and Commerce, Washington DC, June 23. http://archives.energycommerce.house.gov/cmte_mtgs/110-oi-hrg.062308.EnergySpec.shtml. Stoll, H. R., Whaley, R. E., 2010, Commodity Index Investing and Commodity Futures Prices, Journal of Applied Finance 20, 7-46 Szakmary, A., Ors, E., Kim, J., Davidson, W., 2003, The Predictive Power of Implied Volatility: Evidence From 35 Futures Markets, Journal of Banking & Finance 27, 2151-75. Taylor, J., Van Doren, P. V., 2005, The Case Against The Strategic Petroleum Reserve, Cato Institute: Policy Analysis No. 555, 1-21. Till, H, 2009, Has There Been Excessive Speculation in the US Oil Futures Markets? Working Paper, EDHEC-Risk Institute. Trolle, A. B., Schwartz, E. S., 2009, Unspanned Stochastic Volatility and the Pricing of Commodity Derivatives, Review of Financial Studies 22, 4423-4461.
Thomas K. Lee | U.S. Energy Information Administration | This paper is released to encourage discussion and critical comment. The analysis and conclusions expressed here are those of the authors and not necessarily those of the U.S. Energy Information Administration.

83
Villar, J., Joutz, F., 2006, The Relationship Between Crude Oil and Natural Gas Prices, Working Paper, US Energy Information Administration. Wirl, F., Kujundzic, A., 2004. The Impact of OPEC Conference Outcomes on World Oil Prices 1984-2001, Energy Journal 25 45-62. Working, H., 1949, The Theory of the Price of Storage, American Economic Review 39, 1254–1262. Wu, T., McCallum, A., 2005, Do Oil Futures Prices Help Predict Future Oil Prices? FRBSF Economic Letter, Federal Reserve Bank of San Francisco, Issue Dec. 30. Yan, S., 2002, Valuation of Commodity Derivatives in a New Multi-Factor Model, Review of Derivatives Research 5, 251-271. Yang J., Bessler, D. A., Leatham, D. J., 2001, Asset Storability and Price Discovery in Commodity Futures Markets: A New Look, Journal of Futures Markets 21, 279-300. Yousefi, A., Wirjanto, T. S., 2004, The Empirical Role of the Exchange Rate on the Crude-oil Price Formation, Energy Economics 26, 783–799. Yousefi, A., Wirjanto, T. S., 2005, A Stylized Exchange Rate Pass-Through Model of Crude Oil Price Formation, OPEC Review 29, 177–187.
Thomas K. Lee | U.S. Energy Information Administration | This paper is released to encourage discussion and critical comment. The analysis and conclusions expressed here are those of the authors and not necessarily those of the U.S. Energy Information Administration.