faculdade de engenharia da universidade do portopro09003/papers/lopesmargarido...subject code:...
TRANSCRIPT
Faculdade de Engenharia da Universidade do Porto
Student: Isabel de Jesus Lopes Margarido Professor: João Pascoal Faria
Subject: Estudo Livre Year: 2009/2010
Subject code: EL
Date: 2010-08-06
Pages: 80
Status: Approved
Access: Access List
Version: 1.0
TECHNICAL REPORT: REQUIREMENTS
DEFECTS CLASSIFICATION LIST

Title: Requirements Defects Classification List
Student: Isabel Margarido Number: 090546003
Professor: João Pascoal Faria Subject: Estudo Livre
2010-08-06 2/81
Approval:
Version Revision Name Signature Date
1.0 0.12 João Pascoal Faria 2010-08-12
Authors and Contributors
Name Contact Description Date
Isabel de Jesus Lopes Margarido [email protected] Author 2010-04-09
Access List
Internal Access
Professor of the EL discipline.
External Access
N/A
Revision History
Version Revision Date Description
-- 0.0 2010-04-09 Initial draft.
-- 0.1 2010-04-23 Chapter 2: Structure of the bibliographic review.
Chapter 3: Attributes of the defects classification lists.
-- 0.2 2010-04-26 Chapter 2: Bibliographic review ready for revision.
-- 0.3 2010-04-29 Chapter 2: Classification of the existent classification lists adequate for the defects in
the requirements.
Chapter 3: Analysis of the existent defects classification lists and creation of the first version of our classification list for the defects in the requirements.
-- 0.4 2010-05-13 Review the report to originate a paper.
Annex A: Defects classifiers per author.
-- 0.6 2010-07-30 Moving from the Springer format to a technical report template.
Reorganisation of the chapters according with the template and the paper. Chapter 3: Results.
-- 0.7 2010-07-31 Chapter 3: Experiments using requirements defects classifications. Annexes B and C: forms and instructions used in our experiment.
-- 0.12 2010-08-06 Abstract.
Chapter 3: Experiment design, results analysis and discussion.
Annex D: Requirements document. Annex E and F: Data collected on the two experiments and some auxiliary tables and
graphics to assist the data analysis.

Title: Requirements Defects Classification List
Student: Isabel Margarido Number: 090546003
Professor: João Pascoal Faria Subject: Estudo Livre
2010-08-06 3/81
Abstract
Requirements defects are one of the common causes of failures and requirements defects are
amongst the most common types of defects. The classification of the defects of the requirements
specifications allows the analysis of their root causes; supports the creation of checklists to improve
requirements reviews; and reduces risks associated with requirements. Other researchers used
different taxonomies to classify requirements’ defects but, to the best of our knowledge, none of
them tested the quality properties of the defect classifiers list. We performed a literature review to
assemble a list of classifiers applicable to requirements defects, following the recommendations of
other authors. To demonstrate that the list had all the properties of a good classification scheme, we
tested it in a couple of experiments involving students with knowledge of requirements engineering.
The assembled list of classifiers is not orthogonal and we suspect that no defects classifiers list is. In
the light of our observations we give recommendations to industry and other researchers on the
design of experiments and treatment of classification results.
Keywords
Defects Classification, Requirements Review, Requirements Quality, Software Requirements.
Conventions
Although this research reports the individual work of its author, Isabel Lopes Margarido, to obtain a
positive classification in the Estudo Livre (EL) discipline, such work would not be possible without the
guidance and collaboration of the teacher and co-author, Dr. João Pascoal Faria. Therefore in this
document the term applied to mention the author’s work is we.
In this document we apply the IEEE convention to our references.

Title: Requirements Defects Classification List
Student: Isabel Margarido Number: 090546003
Professor: João Pascoal Faria Subject: Estudo Livre
2010-08-06 4/81
Index
Abstract ................................................................................................................................................................. 3
Keywords ................................................................................................................................................................ 3
Conventions ........................................................................................................................................................... 3
Index of Figures ...................................................................................................................................................... 6
Index of Tables........................................................................................................................................................ 7
1 Introduction .................................................................................................................................................... 9
1.1 Executive Summary .............................................................................................................................. 9
1.2 Context and Motivation......................................................................................................................... 9
1.3 Derive Hypothesis ............................................................................................................................... 10
1.4 Acronyms ........................................................................................................................................... 10
1.5 Document Structure ........................................................................................................................... 11
2 Defects Classifiers ......................................................................................................................................... 13
2.1 Requirements Discovered During Testing ............................................................................................ 14
2.2 Code Defects Classifications .............................................................................................................. 14
2.2.1 ODC, 1992 ....................................................................................................................................................................14
2.2.2 HP Scheme, 1992 ........................................................................................................................................................15
2.3 Quality Based Classifiers .................................................................................................................... 16
2.3.1 Software Requirements Problems, 1976 .....................................................................................................................16
2.3.2 Evaluation of Software Requirements, 1981 ...............................................................................................................16
2.3.3 Software Inspections, 1989 .........................................................................................................................................17
2.3.4 Survey Requirements Specifications, 1991 .................................................................................................................17
2.3.5 NASA Requirements Faults, 2003 and 2006 ...............................................................................................................18
2.3.6 DPPI, 2010 ...................................................................................................................................................................20
2.4 Functional and Quality Based Classifiers ............................................................................................. 20
2.4.1 User Requirements Documents, 1992 .........................................................................................................................20
2.4.2 Requirements Inspections, 1995 .................................................................................................................................21
Title: Requirements Defects Classification List
Student: Isabel Margarido Number: 090546003
Professor: João Pascoal Faria Subject: Estudo Livre
2010-08-06 5/81
2.4.3 Software Requirements Errors, 2007 and 2009 ..........................................................................................................22
3 Defects Classification .................................................................................................................................... 24
3.1 Validation of Defects Classification ..................................................................................................... 26
3.1.1 Checklist and Error Abstraction ....................................................................................................................................27
3.1.2 Scenario, Ad Hoc and Checklist....................................................................................................................................28
3.1.3 Empirical Software Engineering....................................................................................................................................30
3.2 Validation Method .............................................................................................................................. 30
3.2.1 Purpose .........................................................................................................................................................................30
3.2.2 Variables .......................................................................................................................................................................31
3.2.3 Threats to Internal Validity ............................................................................................................................................31
3.2.4 Threats to External Validity ...........................................................................................................................................32
3.2.5 Data Validation .............................................................................................................................................................32
3.2.6 Design and Instrumentation .........................................................................................................................................33
3.3 Results Analysis ................................................................................................................................. 35
3.3.1 Experiment 1 .................................................................................................................................................................35
3.3.2 Experiment 2 .................................................................................................................................................................41
3.3.3 Summary of Results ......................................................................................................................................................48
3.4 Results Discussion ............................................................................................................................. 49
4 Conclusions and Future Research .................................................................................................................. 52
References ........................................................................................................................................................... 53
Annex A: Defects Classifiers in the Literature ......................................................................................................... 54
Annex B: First Experiment Form ............................................................................................................................. 55
Annex C: Second Experiment Instructions and Form ............................................................................................... 57
Annex D: Requirements Document ........................................................................................................................ 60
Annex E: Data of the First Experiment .................................................................................................................... 66
Annex F: Data of the Second Experiment ................................................................................................................ 74

Title: Requirements Defects Classification List
Student: Isabel Margarido Number: 090546003
Professor: João Pascoal Faria Subject: Estudo Livre
2010-08-06 6/81
Index of Figures
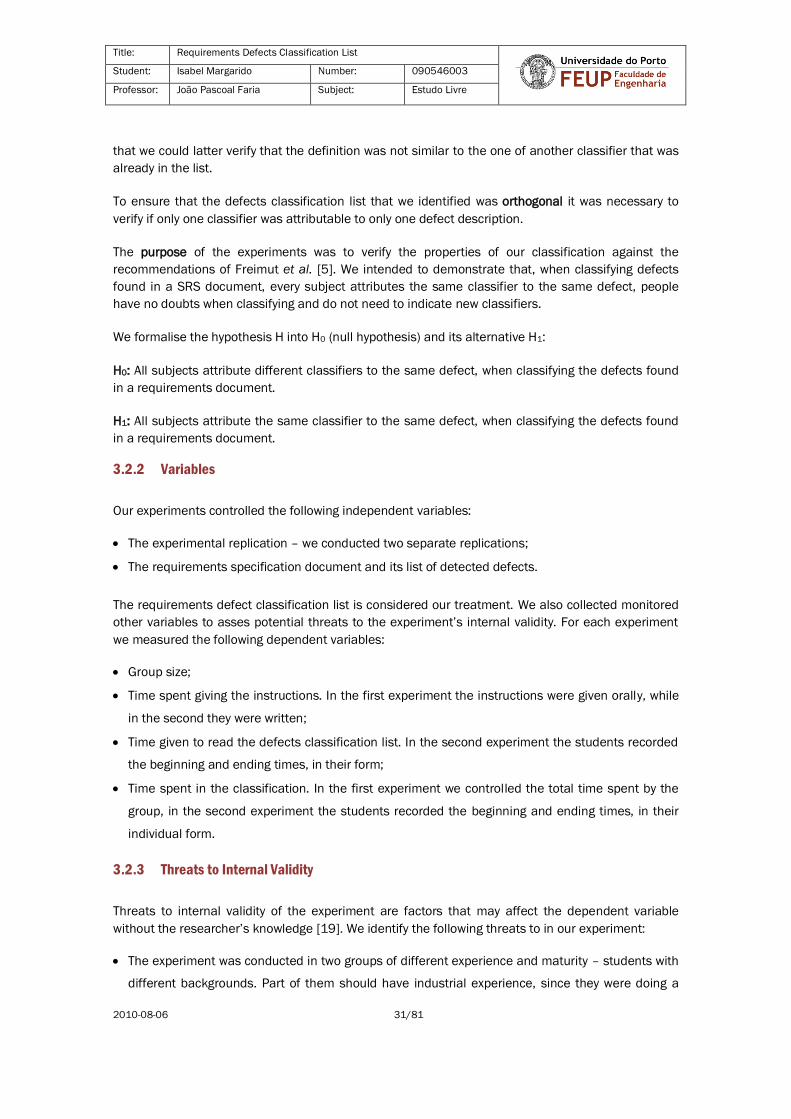
Fig. 1. HP defects classification scheme [5]. ......................................................................................... 15 Fig. 2. Experiments’ sequence of actions. ............................................................................................. 35 Fig. 3. Defects classification done by the first group. ............................................................................. 37 Fig. 4. Experiment 1: Classifiers used with Inconsistent. ........................................................................ 37 Fig. 5. Experiment 1: Classifiers used with Typo..................................................................................... 38 Fig. 6. Experiment 1: Classifiers used with Missing or Incomplete. ......................................................... 38 Fig. 7. Experiment 1: Classifiers used with Infeasible or Non-verifiable. ................................................. 39 Fig. 8. Experiment 1: Classifiers used with Ambiguous or Unclear. ......................................................... 39 Fig. 9. Experiment 1: Classifiers used with Not relevant. ........................................................................ 40 Fig. 10. Experiment1: Classifiers used with Incorrect. ............................................................................ 40 Fig. 11. Defects classification done by the second group. ...................................................................... 44 Fig. 12. Experiment 2: classifiers used with Missing or Incomplete. ....................................................... 44 Fig. 13. Experiment 2: classifiers used with Incorrect. ........................................................................... 45 Fig. 14. Experiment 2: classifiers used with Typo. .................................................................................. 46 Fig. 15. Experiment 2: classifiers used in the defects 2, 5, 11, 15 and 16. ............................................. 46 Fig. 16. Experiment 2: classifiers used with Infeasible or Non-verifiable. ................................................ 47 Fig. 17. Experiment 2: classifiers used with Ambiguous or Unclear. ....................................................... 47 Fig. 18. Experiment 2: classifiers used with Not relevant or Extraneous. ................................................. 47 Fig. 19. Experiment 2: classifiers used with Inconsistent. ...................................................................... 48 Fig. 20. Experiment 1: Bars chart representing the frequency in number of times and percentage that a
classifier is used per defect. ................................................................................................................. 69 Fig. 21. Experiment 2: Bars chart representing the frequency, in number of times and percentage, that a
classifier is used per defect. ................................................................................................................. 77
Title: Requirements Defects Classification List
Student: Isabel Margarido Number: 090546003
Professor: João Pascoal Faria Subject: Estudo Livre
2010-08-06 7/81
Index of Tables
Table 1. List of acronyms. ..................................................................................................................... 10 Table 2. Top 10 higher-severity problem factors. ................................................................................... 13 Table 3. Percentage of the requirements defects occurrence. ................................................................ 16 Table 4. Requirements defects metrics. ................................................................................................ 17 Table 5. Requirements defect classification (version used on the first experiment). ................................ 25 Table 6. Experiment steps respectively followed by the experimental and control groups. ....................... 28 Table 7. Relationships between the fault detection methods [19]. ......................................................... 29 Table 8. Duration of the 1st experiment steps. ....................................................................................... 35 Table 9. Requirements defect classification – final version. ................................................................... 41 Table 10. Duration of the 2nd experiment steps. .................................................................................... 43 Table 11. Summary of results per classifier. Comparison of the 2nd experiment observations with the 1st. 49 Table 12. Defects classifiers per author. When the authors’ name is coloured it indicates that they
introduced a classifier. ......................................................................................................................... 54 Table 13. Experiment 1: Classification of the defects (rows) by each one of the MESG students (columns).
When the student had a doubt the classifications appears in orange. When the answer cannot be perfectly
read the classification appears in red. When a student identified new classifiers the answer appears in
blue. .................................................................................................................................................... 66 Table 14. Experiment 1: Frequencies of usage of the classifiers of the first experiment. .......................... 67 Table 15. Experiment 1: Frequencies of the students’ classification matching our classification for the
same defects. Subjects are presented in the columns and defects in the rows. If the student’s
classification matches ours the cell presents the word ‘yes’ otherwise it presents the text ‘no’. ............... 70 Table 16. Experiment 1: Frequencies of the students’ classification matching our classification of the same
defects, after removing the ones that had no more than 20% of matches with the expected classification.
........................................................................................................................................................... 71 Table 17. Experiment 1: Classifiers also used when the classifier Typo was the mostly used. Each table
indicates the defect where Typo was the most used one, and presents the frequency of usage of each one
of the other classifiers. The last table compiles the data of the other ones.............................................. 72 Table 18. Experiment 1: Classifiers also used when the classifier Inconsistent was the mostly used. ....... 72 Table 19. Experiment 1: Classifiers also used when the classifier Missing or Incomplete was the mostly
used. ................................................................................................................................................... 72 Table 20. Experiment 1: Classifiers also used when the classifier Ambiguous or Unclear was the mostly
used. ................................................................................................................................................... 73 Table 21. Experiment 1: Classifiers also used when the classifier Infeasible or Non-verifiable was the
mostly used. ........................................................................................................................................ 73 Table 22. Experiment 1: Classifiers also used when the classifier Not relevant or Incorrect were the mostly
used. Each classifier was the most used in one particular defect; therefore we present the two tables
together and do not need a summary table for each one. Not relevant was the most frequently used
classifier in the defect 12, while Incorrect was the most used classifier in the defect 22. ........................ 73 Table 23. Experiment 2: Classification of the defects (rows) by each one of the LCINF students (columns).
When the student had a doubt the classifications appears in orange. When a student identified new
classifiers the answer appears in blue. When the student did not provide a classifier, indicated a doubt or
a new classifier the field appears in dark grey. ...................................................................................... 74 Table 24. Experiment 2: Frequencies of usage of the classifiers of the second experiment. ..................... 75 Table 25. Experiment 2: Frequencies of the students’ classification matching our classification, in the
same defects. Subjects are presented in the columns and defects in the rows. If the student’s
classification matches ours the cell presents the word ‘yes’ otherwise presents the text ‘no’. .................. 78 Table 26. Experiment 2: Frequencies of the students’ classification matching our classification, in the
same defects, without subject 4 and defects 27 and 29. ....................................................................... 78 Table 27. Experiment 2: Classifiers also used when the classifier Missing or Incomplete was the mostly
used. Each table indicates the defect where Missing or Incomplete was the most used one, and presents

Title: Requirements Defects Classification List
Student: Isabel Margarido Number: 090546003
Professor: João Pascoal Faria Subject: Estudo Livre
2010-08-06 8/81
the frequency of usage of each one of the other classifiers. The last table compiles the data of the previous
ones. ................................................................................................................................................... 79 Table 28. Experiment 2: Classifiers also used when the classifier Incorrect Information was the mostly
used. ................................................................................................................................................... 80 Table 29. Classifiers also used when the classifier Typo was the mostly used. ........................................ 80 Table 30. Experiment 2: Classifiers also used when the classifier Infeasible or Non-verifiable was the
mostly used. ........................................................................................................................................ 81 Table 31. Experiment 2: Classifiers also used when the classifier Ambiguous or Unclear was the mostly
used. ................................................................................................................................................... 81 Table 32. Experiment 2: Classifiers also used when the classifier Not relevant or Extraneous or Inconsistent
were the mostly used. Each classifier was the most used in one particular defect; therefore we present the
two tables together and do not need a summary table for each one. Not relevant or Extraneous was the
most frequently used classifier in the defect 12, while Inconsistent was the most used classifier in the
defect 1. .............................................................................................................................................. 81

Title: Requirements Defects Classification List
Student: Isabel Margarido Number: 090546003
Professor: João Pascoal Faria Subject: Estudo Livre
2010-08-06 9/81
1 Introduction
1.1 Executive Summary
The intent of this document is to report the work done under the scope of ES, Free Study, about
requirements defects classification lists.
The present work includes a literature review to assemble of a list of classifiers, applicable to defects
found in requirements; the design of experiments to test our hypothesis, regarding the quality
properties of the defects classifiers; the presentation of the obtained results; and a critical analysis
of the data and conclusions about the obtained results.
1.2 Context and Motivation
In this technical report we consider that a defect is a fault, which is a characteristic of the software
system that can lead to a system error. The defect is the result of a human error [1]. Programmers
do errors that result in faults and manifest as failures. Failures are detected by exercising/executing
the software. However, not all errors result into failures; the program might handle the errors. A
defect is different from a problem report. The problem report is a description of the failure and the
defect is the problem that occurs in the artefact that is being verified, validated or tested.
Chen and Huang (2009) analysed the impact of software development defects on software
maintainability. They reveal a top 10 of higher-severity problems. The second to the 4th places, and
the 6th place are occupied by documentation problems such as untrustworthy documentation, non
documented changes, lack of traceability and lack of integrity/consistency. In the top 10 two system
requirements problems occupy the 7th and the 10th places, those problems are continuously
changing requirements and lack of consideration for software quality problems. [2] The
documentation problems that the authors mention are problems that also characterise software
requirements defects. Such work demonstrates the impact of the software requirements defects in
the maintenance phase of a software project, when the product is already deployed in production
environment and the defect affects the client, in case of a failure. Therefore it is important to impede
the existence of propagation of error resultant from requirements defects to posterior phases,
including the maintenance.
Hamill and Goseva-Popstojanova (2009) obtained results that show that the most common types of
defects in a software development project are requirement defects, coding defects and data
problems. They demonstrated that the sources of more failures are requirements defects (32.65%)
and code defects (32.58%). Their results come from an open-source project and a NASA mission
with multiple software applications. [3]
The Orthogonal Defect Classification (ODC) fault classification, described by Chillarage et al. in 1992,
is more adequate to classify defects found on code rather than defects detected on requirements
[4], [5]. Analysing the description of the ODC classifiers, the one that seems suitable to classify
requirements defects is the documentation, which is clearly vague and insufficient to understand the
type of defect of the requirement and, consequently, cannot support the analysis of its root cause.
Title: Requirements Defects Classification List
Student: Isabel Margarido Number: 090546003
Professor: João Pascoal Faria Subject: Estudo Livre
2010-08-06 10/81
Considering that requirements defects are one of the common causes of failures and requirements
defects are amongst the most common types of defects we consider that it is relevant to analysed
them. With our research we assemble a generic taxonomy for requirements defects classification
and elicit desired characteristics for requirements. We test the properties of the classifiers list and
conclude that we cannot guarantee that it is orthogonal. As future research work we will used the
taxonomy to build a requirements checklist, and will test both in the industry, to verify if the tools
reduce the number of defects in the subsequent software development phases.
1.3 Derive Hypothesis
Problem statement: requirements defects need to have an adequate defects classification list. There
are several lists in the literature but none of them is indicated as being the most adequate. And, to
the best of our knowledge, their quality properties were not validated.
Method: We did a literature review to analyse the defects classification lists that have been used. In
our research we were focused in classification lists that were most adequate to classify defects
found in requirements. We analysed the classifiers that we gathered, and from the ones that were
more specific to be used in the context of requirements we did a triage to build a list. Considering a
list of qualities for the defects classifications we gave the definitions for the classifiers and tested
them with the collaboration of master science and pre-graduated students.
Purpose:
Verify the properties of the proposed classification against the recommendations of Fermut et al.
[5];
Demonstrate that, when classifying defects found in requirements, every subject attributes the
same classifier to the same defect, people have no doubts when classifying and do not need to
indicate new classifiers.
Hypothesis:
When creating a defects classification list following the quality rules:
Null Hypothesis (H0): All subjects attribute different classifiers to the same defect, when classifying
the defects found in a requirements document.
Alternative Hypothesis (H1): All subjects attribute the same classifier to the same defect, when
classifying the defects found in a requirements document.
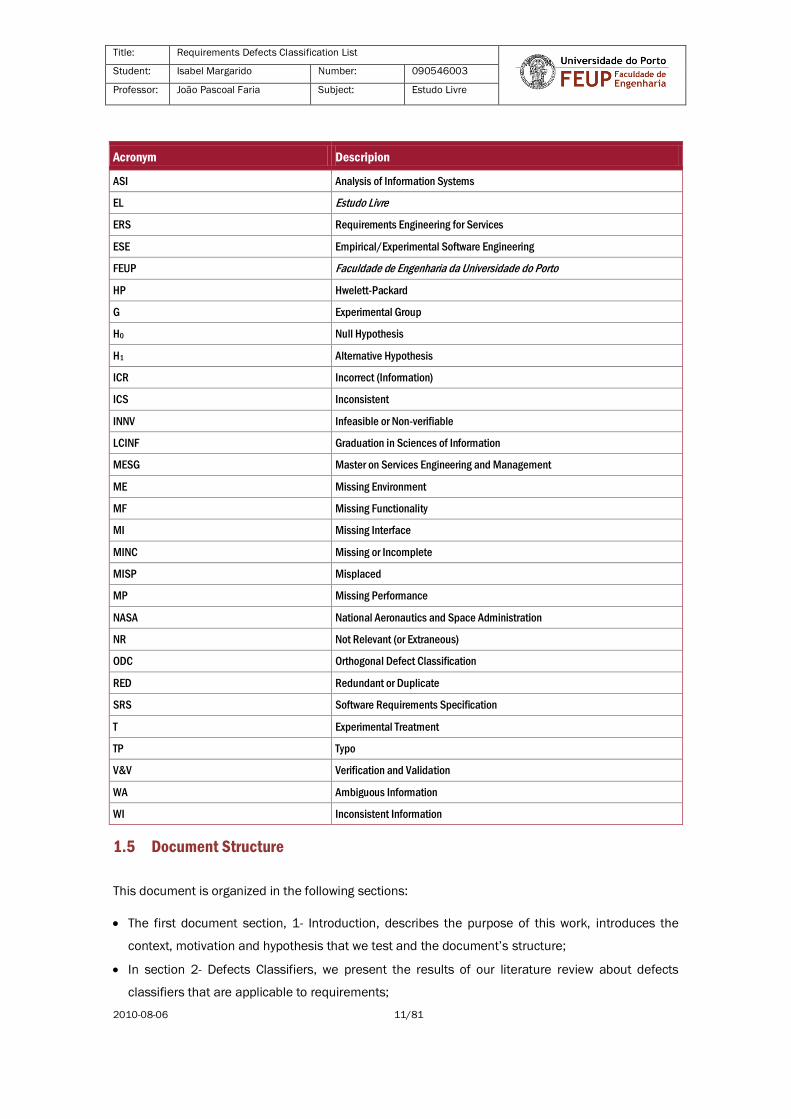
1.4 Acronyms
In the following table acronyms are presented.
Table 1. List of acronyms.
Acronym Descripion
AMU Ambiguous or Unclear
Title: Requirements Defects Classification List
Student: Isabel Margarido Number: 090546003
Professor: João Pascoal Faria Subject: Estudo Livre
2010-08-06 11/81
Acronym Descripion
ASI Analysis of Information Systems
EL Estudo Livre
ERS Requirements Engineering for Services
ESE Empirical/Experimental Software Engineering
FEUP Faculdade de Engenharia da Universidade do Porto
HP Hwelett-Packard
G Experimental Group
H0 Null Hypothesis
H1 Alternative Hypothesis
ICR Incorrect (Information)
ICS Inconsistent
INNV Infeasible or Non-verifiable
LCINF Graduation in Sciences of Information
MESG Master on Services Engineering and Management
ME Missing Environment
MF Missing Functionality
MI Missing Interface
MINC Missing or Incomplete
MISP Misplaced
MP Missing Performance
NASA National Aeronautics and Space Administration
NR Not Relevant (or Extraneous)
ODC Orthogonal Defect Classification
RED Redundant or Duplicate
SRS Software Requirements Specification
T Experimental Treatment
TP Typo
V&V Verification and Validation
WA Ambiguous Information
WI Inconsistent Information
1.5 Document Structure
This document is organized in the following sections:
The first document section, 1- Introduction, describes the purpose of this work, introduces the
context, motivation and hypothesis that we test and the document’s structure;
In section 2- Defects Classifiers, we present the results of our literature review about defects
classifiers that are applicable to requirements;

Title: Requirements Defects Classification List
Student: Isabel Margarido Number: 090546003
Professor: João Pascoal Faria Subject: Estudo Livre
2010-08-06 12/81
Section 3- Defects Classification, includes the quality properties of a classification scheme and
the list of classifiers that we assembled from our literature review and considering the mentioned
properties. We present two experiments that we conducted, the obtained results that we analyse
and draw conclusions and recommendations from our observations;
Finally, in section 4- Conclusions and Future Research, we summarise our results and
recommendations and propose future research work.

Title: Requirements Defects Classification List
Student: Isabel Margarido Number: 090546003
Professor: João Pascoal Faria Subject: Estudo Livre
2010-08-06 13/81
2 Defects Classifiers
In 2009 Chen and Huang performed an e-mail survey involving 400 software engineers and project
managers of company members of the Chinese Information Service Industry Association of Taiwan,
in a total of 137 projects. In their work they present the top 10 higher-severity problem factors, as we
summarise in Table 2.
Table 2. Top 10 higher-severity problem factors.
Number Software Development Factors Problem Dimension
1 Inadequacy of source code comments Programming Quality
2 Documentation is obscure or untrustworthy Documentation Quality
3 Changes are not adequately documented Documentation Quality
4 Lack of traceability Documentation Quality
5 Lack of adherence to programming standards Programming Quality
6 Lack of integrity/consistency Documentation Quality
7 Continually changing system requirements System Requirements
8 Frequent turnover within the project team Personnel Resources
9 Improper usage of programming techniques Programming Quality
10 Lack of consideration for software quality requirements System Requirements
In their literature review several authors refer that:
A significant percentage of defects are caused by incorrect requirements specifications, incorrect
requirements translation or incomplete requirements (Apfelbaum and Doyle, 1997 and
Monkevich, 1999) and
Half of the problems rooted in requirements are due to ambiguous, poorly written, unclear,
incorrect, the other half are consequence of requirements that were omitted (Mogyorodi, 2001).
[2]
Card stated in 1998 that “Classifying or grouping problems helps to identify clusters in which
systematic errors are likely to be found. [6]”
The objectives of having an adequate taxonomy to classify defects requirements are the following:
Have an indirect indicator of the defects quality, to quantify the detected defects per classifier,
support the identification of the root causes of the errors that are identified in the requirements;
Have a support to build requirements checklist to improve the requirements document revision in
the requirements phase;
Reduce risks associated with requirements: incomplete, communication and non-acceptance.

Title: Requirements Defects Classification List
Student: Isabel Margarido Number: 090546003
Professor: João Pascoal Faria Subject: Estudo Livre
2010-08-06 14/81
In the following chapters we present several authors work related with the requirements defects
classification or that include requirements classification taxonomies.
2.1 Requirements Discovered During Testing
Lutz and Mikulski (2003) indicate the impact of requirements defects when discovered in the testing
phase, their causes and propose guidelines to distinguish and respond to each situation. The defects
identified are the following:
Incomplete requirements, resolved by changes to the software. These problems are found during the
testing phase when undocumented requirements are found to be implemented. The requirements
are missing or incomplete.
Unexpected requirements interactions, resolved by changes to the operational procedures. During
testing, unexpected interactions among existing requirements are found. The requirements
sequence needed to be reviewed and the interleaved processes caused incorrect behaviour or did
not achieve the required precondition for correct execution of the software.
Requirements confusion by the testers, resolved by changes to the documentation. During testing
misunderstandings regarding the requirements descriptions are revealed. The software behaviour is
unexpected even though it works and the requirements are correct. The requirements need to be
better described.
Requirements confusion by the testers, resolved by a determination that no change was needed.
Results from a misunderstanding of the requirements but the indication of failure was done where
the software in fact behaved correctly. [7]
The defects mentioned above result from introducing changes in the requirements without
documenting the alterations. The changes might be on the requirements, or the need for further
specification, which implies changes in the software. This work enhances the importance of updating
the requirements during the project.
2.2 Code Defects Classifications
The code defects classifications that we present in this subchapter are from 1992 and are
applicable from the design phase to the acceptance testing phase of the development lifecycle.
There are two classification schemes: one from the IBM, the ODC and the other is the HP defect
classification scheme.
2.2.1 ODC, 1992
The ODC defect classification is applied in all the development phases and has no reference to the
requirements phase, it only considers design, unit test, integration test and system test. The defect
types are the following:
Function;
Interface;
Checking;

Title: Requirements Defects Classification List
Student: Isabel Margarido Number: 090546003
Professor: João Pascoal Faria Subject: Estudo Livre
2010-08-06 15/81
Assignment;
Timing/Serialisation;
Build/Package/Merge;
Documentation;
Algorithm.
For each defect it is necessary to indicate if it is incorrect or missing. [8]
Such classifiers do not seem completely adequate for requirements defects classification, except for
Documentation which is too generic to give further information on the defect.
2.2.2 HP Scheme, 1992
The Hwelett-Packard (HP) defect classification scheme was defined by Grady in 1992 [9]. In the HP
scheme the defect is classified by mode, type and origin, as we illustrate in Fig. 1 [5].
Fig. 1. HP defects classification scheme [5].
The defects originated in the specifications/requirements phase would be:
Missing/Unclear/Wrong/Changed/Better Way Requirements/Specifications;
Missing/Unclear/Wrong/Changed/Better Way Functionality;
Missing/Unclear/Wrong/Changed/Better Way HW Interface;
Missing/Unclear/Wrong/Changed/Better Way SW Interface;
Missing/Unclear/Wrong/Changed/Better Way User Interface;
Missing/Unclear/Wrong/Changed/Better Way Function Description.
The Requirements/Specifications type seems to be redundant when classifying defects originated in
the requirements/specification phase. We consider that any other of the above mentioned
requirements classifiers would be more relevant, to characterise a requirement defect.

Title: Requirements Defects Classification List
Student: Isabel Margarido Number: 090546003
Professor: João Pascoal Faria Subject: Estudo Livre
2010-08-06 16/81
2.3 Quality Based Classifiers
In this report we consider that the quality based defect classifiers reflect the quality attributes that a
requirement specification shall have. In this sub-chapter we present the lists of classifiers used by
other authors from 1976 through 2010.
2.3.1 Software Requirements Problems, 1976
In 1976, Bell and Thayer [10] do a research to verify the relevance of the software requirement
defects and analyse two distinct projects. In certain projects, if a requirement defect is not identified
and fixed the system might not respond to a known threat, resulting in the system failure. In their
work, they conclude that requirements defects have impact on software development projects. Even
analysing two distinct projects, the problems on both are similar.
Bell and Thayer aggregate defects in distinct categories, as presented in table 3. The percentage of
defects occurrence is relative to the bigger project that they analysed.
Table 3. Percentage of the requirements defects occurrence.
Category Percentage
Not in current baseline 1.5%
Out of scope 7.2%
Missing/Incomplete/Inadequate 21.0%
Incorrect 34.8%
Inconsistent/Incompatible 9.1%
New/Changed Requirement 7.2%
Unclear 9.3%
Typos 9.9%
2.3.2 Evaluation of Software Requirements, 1981
Basili and Weiss (1981) do a categorisation of defects found on requirements documentation and
include a set of questions to be asked while reviewing the requirements document that had a
defined structure, has recommended by Heninger (1980) [11]. The questions used in Basili and
Weiss work can be used to build a verification checklist.
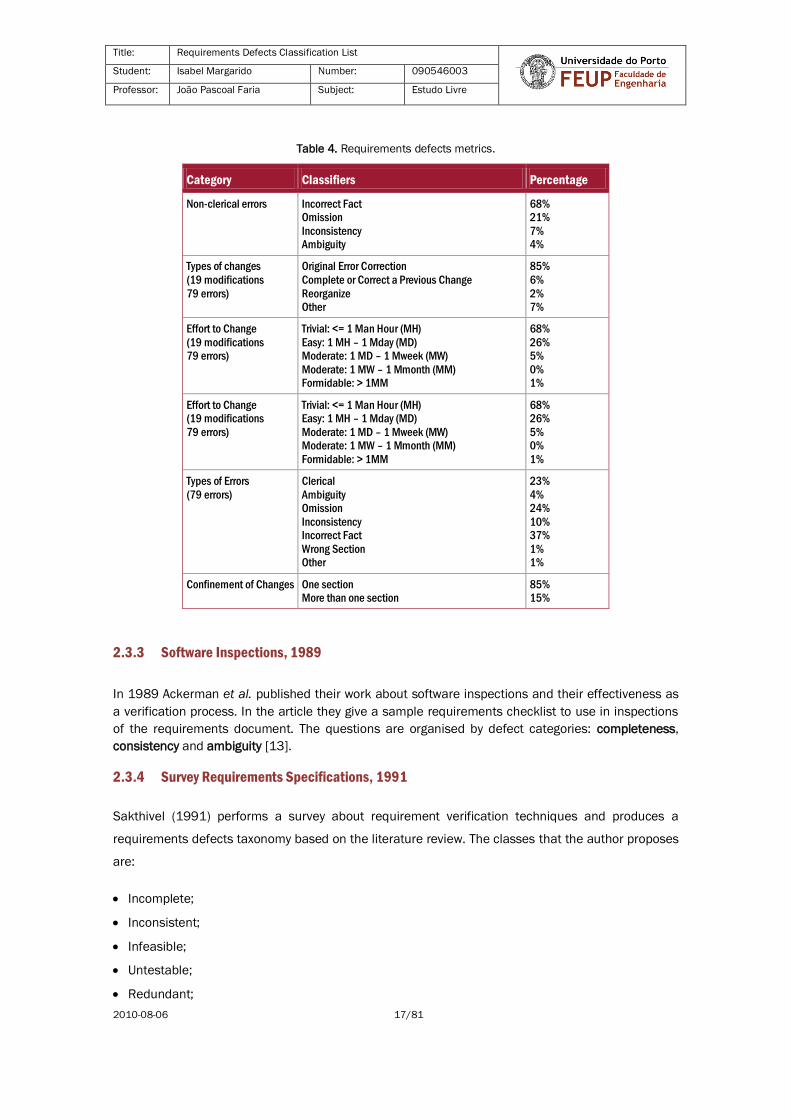
Table 4 includes the requirements measures by category.
We consider that the Types of Changes category is useful for requirements change management and
relevant for requirements stability control. The types of errors are a defect classification.
Walia and Craver adopted the Wrong Section and Other classifiers, in their taxonomy [12].
Title: Requirements Defects Classification List
Student: Isabel Margarido Number: 090546003
Professor: João Pascoal Faria Subject: Estudo Livre
2010-08-06 17/81
Table 4. Requirements defects metrics.
Category Classifiers Percentage
Non-clerical errors Incorrect Fact Omission
Inconsistency Ambiguity
68% 21%
7% 4%
Types of changes
(19 modifications
79 errors)
Original Error Correction
Complete or Correct a Previous Change
Reorganize Other
85%
6%
2% 7%
Effort to Change
(19 modifications 79 errors)
Trivial: <= 1 Man Hour (MH)
Easy: 1 MH – 1 Mday (MD) Moderate: 1 MD – 1 Mweek (MW)
Moderate: 1 MW – 1 Mmonth (MM) Formidable: > 1MM
68%
26% 5%
0% 1%
Effort to Change (19 modifications
79 errors)
Trivial: <= 1 Man Hour (MH) Easy: 1 MH – 1 Mday (MD)
Moderate: 1 MD – 1 Mweek (MW) Moderate: 1 MW – 1 Mmonth (MM)
Formidable: > 1MM
68% 26%
5% 0%
1%
Types of Errors
(79 errors)
Clerical
Ambiguity Omission
Inconsistency Incorrect Fact
Wrong Section Other
23%
4% 24%
10% 37%
1% 1%
Confinement of Changes One section More than one section
85% 15%
2.3.3 Software Inspections, 1989
In 1989 Ackerman et al. published their work about software inspections and their effectiveness as
a verification process. In the article they give a sample requirements checklist to use in inspections
of the requirements document. The questions are organised by defect categories: completeness,
consistency and ambiguity [13].
2.3.4 Survey Requirements Specifications, 1991
Sakthivel (1991) performs a survey about requirement verification techniques and produces a
requirements defects taxonomy based on the literature review. The classes that the author proposes
are:
Incomplete;
Inconsistent;
Infeasible;
Untestable;
Redundant;
Title: Requirements Defects Classification List
Student: Isabel Margarido Number: 090546003
Professor: João Pascoal Faria Subject: Estudo Livre
2010-08-06 18/81
Incorrect.
For each class the author presents different defects and gives an example. [14]
2.3.5 NASA Requirements Faults, 2003 and 2006
In 2003 Hayes built the requirements fault taxonomy for National Aeronautics and Space
Administration (NASA) [15]. The taxonomies were developed for Critical/Catastrophic High-Risk
systems, including the International Space Station (ISS) project. On their research work they
examined the requirements faults of six systems.
In her article [15] Hayes indicates that ODC refers to design and code while their approach
emphasises requirements. In the research work performed, the adopted taxonomy was the Nuclear
Regulatory Commission (NRC) requirement fault taxonomy from NUREG/CR-6316 (1995). Hayes
states that subfaults are useful only for clarification. The fault taxonomy was the following:
1.1 Incomplete decomposition;
1.2 Omitted requirement;
1.3 Improper translation;
1.4 Operational environment incompatibility;
1.5 Incomplete requirement description;
1.6 Infeasible requirement;
1.7 Conflicting requirement;
1.8 Incorrect assignment of resources;
1.9 Conflicting inter-system specification;
1.10 Incorrect or missing external constants;
1.11 Incorrect or missing description of initial system state;
1.12 Over-specification of requirements;
1.13 Incorrect input or output descriptions.
Such taxonomy suffered a few changes to become sufficiently generic.
The ISS project categorisation of requirements defects was the following:
Incompleteness (20.9%);
Omitted/Missing (32.9%);
Incorrect (23.9%);
Ambiguous (0.61%);
Infeasible (0.14%);
Inconsistent (0.47%);
Title: Requirements Defects Classification List
Student: Isabel Margarido Number: 090546003
Professor: João Pascoal Faria Subject: Estudo Livre
2010-08-06 19/81
Over-specification (0.63%);
Not Traceable (0.14%);
Unachievable (-);
Non-Verifiable (0.05%);
Misplaced (0.07%);
Intentional Deviation (0.07%);
Redundant or Duplicate (0.05%).
The percentage of occurrence of each category is indicated in parenthesis. The category
Unachievable was tailored in the ISS project and reserved for future use.
In 2006 Hayes et al. publish further work, performing a trend analysis of historical profiles of three
ISS computer software configuration items (CI) and building a prototype common cause tree. The
historical data was from the period of time between 1998 and 2004. The three CIs are referred to as
CI A, B and C respectively. CI A has 430 requirements; CI B consists of 339 in the first release, 850
in the second and 875 by the time that the article was produced; CI C had 339 for the first release.
176 defects were analysed, from 20% of the three CIs fault reports [16].
The requirements defects taxonomy presented in 2003 was re-used in 2006 to classify the defects
found on the requirements of these ISS CIs and the percentage of each category was the following:
Incompleteness (23.30%);
Omitted/Missing (10.80%);
Incorrect (30.11%);
Ambiguous (13.07%);
Infeasible (0%);
Inconsistent (13.07%);
Over-specification (1.14%);
Not Traceable (2.27%)
Unachievable (0.57%);
Non Verifiable (0%);
Misplaced (1.14%);
Intentional Deviation (2.27%);
Redundant/Duplicate (2.27%).
As it happened in the previous work, the negligible occurrences of a defect led to the tailoring of the
taxonomy. Therefore in the tailored taxonomy for the ISS CIs Infeasible, Non Verifiable and
Unachievable were reserved for the future.
The total number of requirements analysed in the 2006 work was bigger.
We consider that the NASA requirements taxonomy is related with characteristics of quality for the
requirements.

Title: Requirements Defects Classification List
Student: Isabel Margarido Number: 090546003
Professor: João Pascoal Faria Subject: Estudo Livre
2010-08-06 20/81
2.3.6 DPPI, 2010
Kalinowski et al. (2010) were aware that Defect Causal Analysis (DCA) reduces defect rates by over
50%, reducing rework effort and improving quality and performance. The authors observe on their
bibliographic review that DCA did not include an approach to integrate a learning mechanism
regarding cause-effect relations in the DCA meetings. The authors improve a framework they
previously proposed in 2008, named defect prevention based process improvement (DPPI). DPPI is a
framework for conducting, measuring and controlling DCA so it may be used in process
improvement. [17]
The authors map the Capability Maturity Model Integration (CMMI) Causal Analysis and Resolution
(CAR) process area with the DPPI activities. They consider that the DPPI framework may be adapted
to all sort of problems [17]; however CAR also refers to the analysis of processes and organisational
problems.
The paper states the necessity of collecting metrics for DCA and the importance of context when
collecting such metrics, the stability of the inspection and the technology/similarity of projects where
the inspection occurs needs to be considered.
The authors applied their approach to a Web-based software project that lasted for 3 years with
more than 10 iterations and 200 use cases. 1400 defects were detected and removed from
functional specifications. In their approach the defect classification for requirements that is used is
the following:
Incorrect fact (35.3%);
Omission (23.5%);
Extraneous Information (17.6%);
Ambiguity (11.8%);
Inconsistent Information (5.9%);
Other Defect type (5.9%).
In parenthesis we present the percentage of occurrence of each defect.
2.4 Functional and Quality Based Classifiers
In this subchapter we present the defect classification taxonomies that are both functional and
quality based. In our research we consider that the functional based defect classifiers represent a
function of the requirement in the product (e.g. interface, performance, environment, functional).
2.4.1 User Requirements Documents, 1992
Schneider et al. (1992) identify two classes of requirement defects to use when reviewing user
requirements documents. The number of occurrences of each defect is indicated in parenthesis:
Class 1 Faults. Missing Information
Missing Functionality or Missing Feature (MF) (34);

Title: Requirements Defects Classification List
Student: Isabel Margarido Number: 090546003
Professor: João Pascoal Faria Subject: Estudo Livre
2010-08-06 21/81
Missing Interface (MI) (11);
Missing Performance (MP) (7);
Missing Environment (ME) (9).
Class 2 Faults. Wrong Information
Ambiguous Information (WA) (15);
Inconsistent Information (WI) (23) [18].
These classifiers were part of the defects classifiers used in the work of Walia and Carver (2007)
[12].
2.4.2 Requirements Inspections, 1995
In 1995 Porter et al. compare requirements inspection methods. They perform an experiment where
two Software Requirement Specification (SRS) documents are inspected with a combination of Ad
Hoc, Checklist or Scenario inspection methods.
The checklist used was organised in categories, resembling a defect classification:
Omission
Missing Functionality;
Missing Performance;
Missing Environment;
Missing Interface;
Commission
Ambiguous Information;
Inconsistent Information;
Incorrect or Extra Functionality;
Wrong Section.
The scenario also includes categories:
Data Type Consistency;
Incorrect Functionality;
Ambiguities or Missing Functionality [19].
The taxonomy used by Porter et al. is the same as the one used by Schneider et al. [18] , uses the
Wrong Section introduced by Basili and Weiss [11], and introduces Incorrect or Extra Functionality
and Data Type Consistency.
The authors concluded, from the obtained results, that the scenarios are the most effective
inspection method for requirements reviews, followed by the ad hoc and finally by the checklist [19].
Title: Requirements Defects Classification List
Student: Isabel Margarido Number: 090546003
Professor: João Pascoal Faria Subject: Estudo Livre
2010-08-06 22/81
2.4.3 Software Requirements Errors, 2007 and 2009
In 2007 Walia and Carver produced a technical report about a systematic literature review they
performed, with the purpose of identifying and classifying requirements errors. By the analysis of
149 papers about sources of requirements defects they developed a taxonomy of software
requirements errors. Part of their work consisted in finding error-fault-taxonomies. They found ODC,
the Hewlet-Packard (HP) defect classification Scheme, the NASA’s requirement fault taxonomy, and
other fault classifications and requirements fault categories/classifications applicable to the
requirements document (Schneider et al. [18], Basili and Weiss [11], Bell and Thayer [10], Sakthivel
[14], Ackerman et al. [13], Porter et al. [19]). [14]
In 2007 Walia et al. repeat a previous experiment done in 2006, involving software engineering
students performing a requirements document review using a defect checklist and later on repeating
the revision after being trained in the error abstraction process. The repetition of the experiment was
done in order to include a control group. The objective of the work was to show the importance of
requirements defects taxonomy. The results of the experiment showed that:
The error abstraction process led to more defects found without losses of efficiency;
The subjects that participated in the experiment were in favour of the requirement error
taxonomy; however, since they were not involved in the elaboration of the requirements
document, or had no contact with its developers, the abstracting and classification of errors was
difficult.
The authors used the following taxonomy to classify requirements defects:
General (GN);
Missing functionality (MF);
Missing performance (MP);
Missing interface (MI);
Missing environment (ME);
Ambiguous information (AI);
Inconsistent information (II);
Incorrect or extra functionality (IF);
Wrong section (WS);
Other faults (OF).
The percentage of each defect is not indicated in the paper but the graphic information shows that
the most frequent defects were Ambiguous information, followed by Missing functionality, Missing
interface and Wrong section. [20]
We consider that the taxonomy used by Walia and Carver is related with function characteristics:
functional, performance, interface, etc.

Title: Requirements Defects Classification List
Student: Isabel Margarido Number: 090546003
Professor: João Pascoal Faria Subject: Estudo Livre
2010-08-06 23/81
In 2009 Walia and Carver [12] published further information from the literature review they
performed in 2007 [14]. The authors developed requirements error classes, namely:
Communication;
Participation;
Domain knowledge;
Specific application;
Process execution;
Other human cognition;
Inadequate method of achieving goals and objectives;
Management;
Requirement elicitation;
Requirement analysis;
Requirement traceability;
Requirement organisation;
No use of standard for documenting and specification [12].
From the analysis of the descriptions of errors of each class we verified that some of them could be
adapted to become defects classifiers as others could be adapted to become desirable properties of
requirements, information that should be included in a checklist to support the requirements
documentation revision. The requirements defects classification is further discussed on section 3.
Title: Requirements Defects Classification List
Student: Isabel Margarido Number: 090546003
Professor: João Pascoal Faria Subject: Estudo Livre
2010-08-06 24/81
3 Defects Classification
To build a defects classification taxonomy it is necessary to consider some of the recommendations
given by Freimut et al. (2005) [5] regarding the quality properties of a good classification scheme:
The attributes of the classification scheme need to be clearly and meaningfully defined;
The values of the attributes need to be clearly defined;
Needs to be complete (every defect is classifiable by using the scheme) and orthogonal (only one
attribute value may characterise the defect, being impossible to select two attributes for the same
defect);
Contain a small number of attribute values, the authors recommend 5 to 9 attributes, since this is
the number of items that human short-memory can retain, according with Chillarege et al. [8];
Aggregate attribute values whenever they are less significant, i.e. when they rarely occur, and
when detailed categories may be aggregated into a single category. The aggregation reduces
ambiguity [10].
In our bibliographic review we collected several different taxonomies and the frequency of the
defects classifiers of the researchers’ experiments. Table 12, in Annex A, summarises our work. The
authors are identified by the initial or the first two letters of their surname. They are ordered
chronologically by year of the first publication. For each defect classifier we indicate the authors who
used it. When an author uses a classifier, the following information may appear:
‘Yes’ if we have no further information;
The percentage of occurrence of a defect using the most statistically significant experiment done
(with more data points);
The quantity of defects;
‘Inadequate’ when we consider that the classifier is not useful for requirements defects;
‘/incorrect’, indicating that the authors also used the ‘incorrect’ prefix;
‘/u/w/c/b’ indicating the authors also used the prefixes ‘Unclear’, ‘Wrong’, ‘Changed’ and ‘Better
Way;
‘Formal Spec.’ (Formal Specification) when we consider that such defect classifier would only be
applicable if the requirements were specified in formal language.
We analysed the frequency with each classifier was used and its adequacy to classify a requirement
defect. We excluded the classifiers that were in the following conditions:
Merged (Inadequate and Incompatible);
Inadequate to classify requirements defects or only applicable in formal requirements
specifications;

Title: Requirements Defects Classification List
Student: Isabel Margarido Number: 090546003
Professor: João Pascoal Faria Subject: Estudo Livre
2010-08-06 25/81
Important to perform requirements changes management, namely the classifiers: Not in current
baseline, New and Changes Requirements;
Detailing the interface that was missing (Hardware, Software and User);
Over detailed (Missing/Incorrect Checking and Assignment, Data Type Inconsistency).
We consider that the information that is useful to do requirements change’s management shall be
used as an extra problem report field, after the first approval of the requirements document with the
client.
Since Unachievable and Infeasible are very similar and the authors that used both classifiers
recorded 0% of defects in the infeasible classifier we merged them. We considered that General and
Other could also be merged. We merged Out of Scope and Intentional Deviation because a deviation
turns a requirement out of the scope of the project; the classifiers were not used by the same author
and if the organisation considers it relevant it can switch the terms.
We then analysed the classifiers used by more than one author, 17 classifiers. The Incorrect or Extra
Functionality was already included in Incorrect and Redundant classifiers, so we excluded it. Than we
considered that the classifiers detailing what was missing would be redundant if we considered
generically that the requirement, or a detail important for the requirement, was missing. The details
of what was precisely missing should be given in the problem description.
The most used classifiers were reduced to 11, along with the not eliminated 4, we had 15 classifiers.
In the NASA taxonomy Infeasible, Unachievable and Non Verifiable were the less frequent defects. In
the work that included more data points the classifiers became ‘reserved for future use’ [16]. We
opted to merge them with Unstestable/Non Verifiable – if a requirement would be infeasible it would
not be testable since it could not be implemented.
The Over-specification is either Out of the scope of the project or out of the scope of a requirements
specification, when the specification is giving details of the design. Extraneous information may also
be considered out of the scope. For these reasons we merged the three classifiers in one and named
it Not relevant.
Finally we merged Incomplete and Missing, in order to have one classifier for both possible
situations, and named it Missing or Incomplete. We did the same with Unclear and Ambiguous,
choosing to maintain Ambiguous, since it is mentioned in the IEEE 830 standard [21]. We later opted
to include in the same classifier, because they have different meanings, so the classifier became
Ambiguous or Unclear.
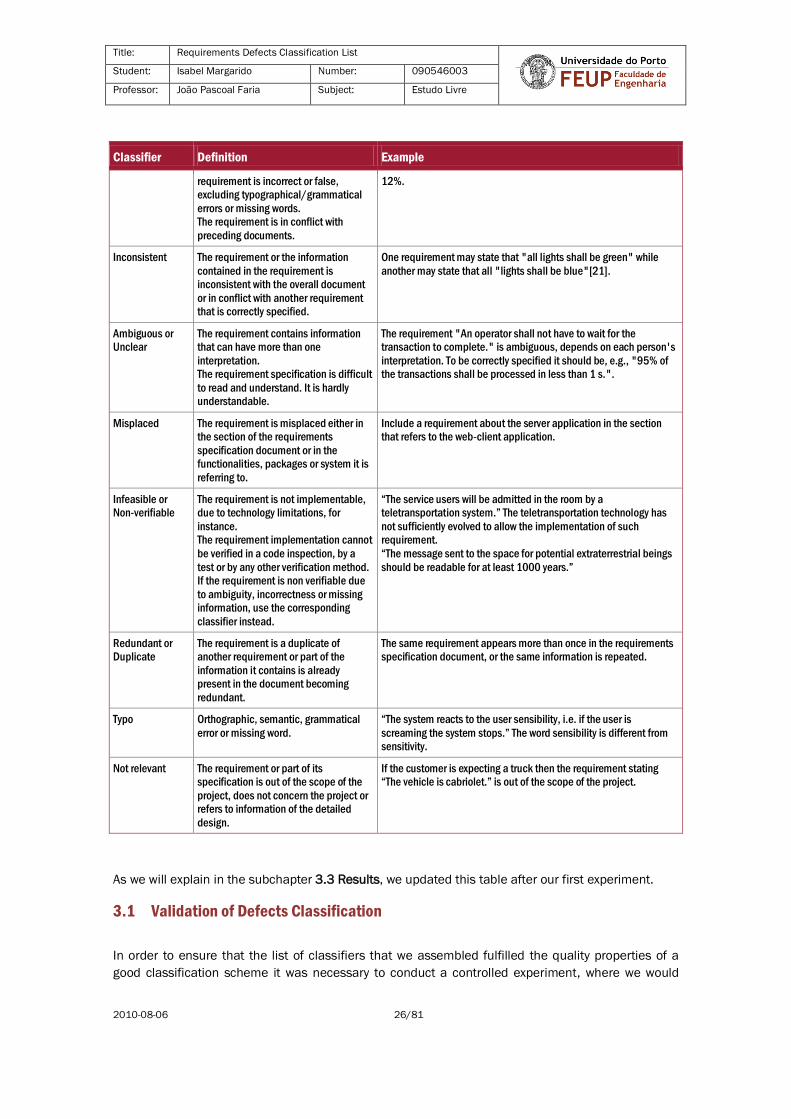
We assembled 9 classifiers which we detail in Table 5.
Table 5. Requirements defect classification (version used on the first experiment).
Classifier Definition Example
Missing or
Incomplete
The requirement is not present in the
requirements document.
Information relevant to the requirement is missing, therefore the requirement is
incomplete.
"The system will allow authentication of authorised users." The way
to access the system is not detailed. Is it by using a login and
corresponding password? Using a card? And what happens when a non-authorised user tries to access it?
If the requirement includes the expression To be Defined (TBD) it is incomplete.
Incorrect The information contained in the Stating that "The Value Added Tax is 20%" when the correct value is
Title: Requirements Defects Classification List
Student: Isabel Margarido Number: 090546003
Professor: João Pascoal Faria Subject: Estudo Livre
2010-08-06 26/81
Classifier Definition Example
requirement is incorrect or false, excluding typographical/grammatical
errors or missing words. The requirement is in conflict with
preceding documents.
12%.
Inconsistent The requirement or the information
contained in the requirement is inconsistent with the overall document
or in conflict with another requirement that is correctly specified.
One requirement may state that "all lights shall be green" while
another may state that all "lights shall be blue"[21].
Ambiguous or Unclear
The requirement contains information that can have more than one
interpretation. The requirement specification is difficult
to read and understand. It is hardly understandable.
The requirement "An operator shall not have to wait for the transaction to complete." is ambiguous, depends on each person's
interpretation. To be correctly specified it should be, e.g., "95% of the transactions shall be processed in less than 1 s.".
Misplaced The requirement is misplaced either in the section of the requirements
specification document or in the functionalities, packages or system it is
referring to.
Include a requirement about the server application in the section that refers to the web-client application.
Infeasible or Non-verifiable
The requirement is not implementable, due to technology limitations, for
instance. The requirement implementation cannot
be verified in a code inspection, by a
test or by any other verification method. If the requirement is non verifiable due
to ambiguity, incorrectness or missing information, use the corresponding
classifier instead.
“The service users will be admitted in the room by a teletransportation system.” The teletransportation technology has
not sufficiently evolved to allow the implementation of such requirement.
“The message sent to the space for potential extraterrestrial beings
should be readable for at least 1000 years.”
Redundant or Duplicate
The requirement is a duplicate of another requirement or part of the
information it contains is already present in the document becoming
redundant.
The same requirement appears more than once in the requirements specification document, or the same information is repeated.
Typo Orthographic, semantic, grammatical
error or missing word.
“The system reacts to the user sensibility, i.e. if the user is
screaming the system stops.” The word sensibility is different from sensitivity.
Not relevant The requirement or part of its specification is out of the scope of the
project, does not concern the project or refers to information of the detailed
design.
If the customer is expecting a truck then the requirement stating “The vehicle is cabriolet.” is out of the scope of the project.
As we will explain in the subchapter 3.3 Results, we updated this table after our first experiment.
3.1 Validation of Defects Classification
In order to ensure that the list of classifiers that we assembled fulfilled the quality properties of a
good classification scheme it was necessary to conduct a controlled experiment, where we would
Title: Requirements Defects Classification List
Student: Isabel Margarido Number: 090546003
Professor: João Pascoal Faria Subject: Estudo Livre
2010-08-06 27/81
verify the existence of such characteristics. We would give our requirements defects classification
list to other people use in the classification of defects found in a requirements document review.
Other researchers did experiments with requirements reviews. We present some of those
experiments in this subchapter.
3.1.1 Checklist and Error Abstraction
In 2007 Walia and Craver conducted an experiment involving students in the revision of a
requirements specification document using a checklist and error abstraction process. The
experiment was done with an experimental group (8 students of an Empirical Software Engineering,
ESE, discipline) and a control group (9 students of a Verification and Validation, V&V, discipline). The
steps of the experiment are summarised in Table 6.
The control group followed the steps we enunciate bellow:
Step 1 (training 1): The subjects received a description of a fault checklist and fault classes and
were taught how to use it on a requirements specification document to locate faults and how to
document the faults.
Step 2: The subjects inspected the SRS document using a checklist to find faults.
Step 3 (training 2): The subjects were informed that the SRS had remaining faults and that they
should find them in a second inspection.
Step 4: The subjects re-inspected the document using the same checklist used in step 2 and
produced a new fault list.
Step 5: The subjects provided feedback about the conduction of inspections using a checklist.
The experimental group followed the steps 1 and 2 in the same conditions of the control group and
had new steps to the rest of the experiment:
Step 3 (training 2): The students received training on the error abstraction process and on how to
use the error-fault form.
Step 4: The students used the knowledge they acquired on step 3 to extract the errors from the
faults on their individual fault lists and to document them.
Step 5 (training 3): The researchers trained the students on requirement error classification by
explaining the taxonomy in detail. The training taught them how to classify errors and use error
information in the re-inspection of the SRS.
Step 6: The students abstracted and classified the errors they obtained in step 4 and recorded
additional errors found while using the error taxonomy.
Step 7: The subjects used the information about the errors that they gathered during step 6 to re-
inspect the SRS.
Step 8: The students provided feedback about the error abstraction process and the requirement
error taxonomy.

Title: Requirements Defects Classification List
Student: Isabel Margarido Number: 090546003
Professor: João Pascoal Faria Subject: Estudo Livre
2010-08-06 28/81
Table 6. Experiment steps respectively followed by the experimental and control groups.
Step Experimental Group Control Group
1 Training 1: fault checklists and abstractions Training1: fault checklists and abstractions
2 First inspection First Inspection
3 Training 2: error abstraction process Training 2: remaining faults exist in the SRS
4 Error Abstraction Second Inspection
5 Training 3: requirement error classification
taxonomy, use error information during re-inspection
6 Abstract and classify errors
7 Second Inspection
8 Survey Survey
The authors applied concepts of ESE to design and conduct the experiments and used statistics to
analyse the results. [20]
If the intention of this experiment is to know which method is more effective in error detection, and
whether the training helps to find more defects in a SRS document, this experiment does not provide
that information. The entire review process was a learning process and the document to inspect was
always the same, therefore there would always be new defects found on the next step, as long as
they still existed in the document. In order to analyse the benefits of each method there should be
different groups with the same background analysing the same document but each group having
their own experimental conditions:
Group 1: receive training in fault checklists and abstractions and do the inspection;
Group 2: receive training in the error abstraction, requirement error taxonomy and how to use
error information during an inspection and do the inspection;
Group 3: do the inspection.
Using these groups it would be possible to conclude about the effectiveness of each method by
counting the number of defects found using each technique in a certain period of time.
3.1.2 Scenario, Ad Hoc and Checklist
In 1995 Porter et al. compared inspection methods, namely Scenario, Ad Hoc and Checklist, in a
SRS review.
The methods were designed to assess a well-defined population of faults. The Checklist was a
refinement of a fault taxonomy (mentioned in the subchapter 2.4.2 Requirements Inspections,
1995). The Scenarios were derived from the Checklist by replacing the checklist items with
procedures to implement them. The Ad Hoc method implied the usage of the fault taxonomy in the
classification of the detected faults. The relationships of the fault detection methods are presented
in Table 9.

Title: Requirements Defects Classification List
Student: Isabel Margarido Number: 090546003
Professor: João Pascoal Faria Subject: Estudo Livre
2010-08-06 29/81
Table 7. Relationships between the fault detection methods [19].
Ad Hoc Checklist Scenario
Omission Omission Data Type Inconsistencies
MF
MP ME
MI
Missing Functionality
Missing Performance Missing Environment
Missing Interface
1a. Are all data objects mentioned in the overview listed in...
2a. Is the object’s specification consistent with its description...
....
Incorrect Functionality
Commission Commission 1a. Are all values written to each output data object...
1b. Identify at least one function that uses each output data object.
... AI II
IF WS
Ambiguous interface Inconsistent Information
Incorrect or Extra Functionality Wrong Section
Missing or Ambiguous Functionality
1a. Indentify the required precision, response time...
2a. Does a sequence of events exist for which multiple... ....
The reviewer responsibilities are defined by the detection techniques that he/she uses. The fault key
encodes which reviewers are responsible for each fault. The Ad Hoc reviewers search for all faults,
the checklist reviewers are responsible for a subset of the Ad Hoc fault and the Scenario reviewers
The experiment was conducted with graduate students that would inspect two requirements
documents in teams of three, assuming different roles (moderator, recorder and reader), in a total of
eight teams.
The experiment was conducted following the steps:
Step 1 (training): The subjects were given lectures on software requirements specifications, tabular
requirement notifications, inspection procedures, fault classification scheme and filling out the data
collection forms. The subjects did a training exercise, inspecting a requirements document different
from the other two used in the experiment.
Step 2: Half of the teams inspected one of the SRS while the other half inspected the other SRS
document. The detected faults were documented in the fault report. Each team member identified
the method used: Checklist (indicating the category), Ad Hoc or Scenario.
Step 3: The teams had a collection meeting, arranged by the moderator. During the meeting the
reader paraphrased the requirements and the each team member identified any issues found during
the preparation phase or discussed new issues. The recorder documented the issues in a common
fault report form and the method used in the meeting. The data collected included information about
the method used in the detection of the faults: Ad Hoc, each one of the types of faults (of the fault
taxonomy) using Ad Hoc or Checklist.
Step 4: The process of preparation and collection meeting were repeated but the groups swapped
documents.
Title: Requirements Defects Classification List
Student: Isabel Margarido Number: 090546003
Professor: João Pascoal Faria Subject: Estudo Livre
2010-08-06 30/81
The authors also applied concepts of ESE to design and conduct the experiments and used statistics
to analyse the results. [19]
It was not our intention to validate the effectiveness of a defect classification list in an inspection;
therefore we considered that the method used by Porter et al. was too complex to validate the
classifiers that we assembled.
3.1.3 Empirical Software Engineering
In our experiment we used the knowledge ESE. We designed the plan of our experiment using a
similar format to the one used in the plans of Walia and Craver [20] and Porter et al. [19]. We
considered the guidelines for ESE given by Kitchenham [22] and recommendations of Goulão [23].
To formulate the hypothesis we followed the recommendation of using a null hypothesis and its
alternative hypothesis. The null hypothesis (Hoij) assumes that there is no observable pattern in the
experiment and the variations found are mere coincidences. We intend to reject that hypothesis. The
alternative hypothesis (H1ij)1 is that the variations observed in the experiment set are not
coincidental. If we reject the null hypothesis we can accept the alternative, otherwise we cannot
accept the alternative. [23]
In ESE the term used to designate the method we intend to validate is treatment, and that will be the
term that we use in the report of our results.
3.2 Validation Method
The validation method that we would chose in our experiments needed to guarantee that our
classification list obeyed the recommendations of Freimut et al. [5].
In the following subchapters we present the experiments’ design.
3.2.1 Purpose
In the definition of the classification list we tried to clearly and meaningfully define attributes and the
attributes values. We also aggregated the less significant values, to reduce ambiguity and to
guarantee a small number of attributes, in our case we assembled 9 classifiers. With that we were
ensuring four of the recommendations given by Freimut et al. [5].
At first we had a classifier named Other in our list, which we removed because we realised it was the
preferable to ensure that the clearly defined attributes values were sufficient to classify any defect
found in a requirements document. One of the recommendations for a good classification schema is
that it is complete, and an attributed named Other makes the list always complete.
To verify that the classification list was complete we added a field, in the defects classification form,
where the subjects would indicate if they believed that the defect should be classified with a
classifier that was not in the list. They should indicate the name and definition of the classifier, so
1 The 0 stands for null and 1 for alternative. The i stands for experimental purpose identifier and the j is the number in the hypothesis counter.
Title: Requirements Defects Classification List
Student: Isabel Margarido Number: 090546003
Professor: João Pascoal Faria Subject: Estudo Livre
2010-08-06 31/81
that we could latter verify that the definition was not similar to the one of another classifier that was
already in the list.
To ensure that the defects classification list that we identified was orthogonal it was necessary to
verify if only one classifier was attributable to only one defect description.
The purpose of the experiments was to verify the properties of our classification against the
recommendations of Freimut et al. [5]. We intended to demonstrate that, when classifying defects
found in a SRS document, every subject attributes the same classifier to the same defect, people
have no doubts when classifying and do not need to indicate new classifiers.
We formalise the hypothesis H into H0 (null hypothesis) and its alternative H1:
H0: All subjects attribute different classifiers to the same defect, when classifying the defects found
in a requirements document.
H1: All subjects attribute the same classifier to the same defect, when classifying the defects found
in a requirements document.
3.2.2 Variables
Our experiments controlled the following independent variables:
The experimental replication – we conducted two separate replications;
The requirements specification document and its list of detected defects.
The requirements defect classification list is considered our treatment. We also collected monitored
other variables to asses potential threats to the experiment’s internal validity. For each experiment
we measured the following dependent variables:
Group size;
Time spent giving the instructions. In the first experiment the instructions were given orally, while
in the second they were written;
Time given to read the defects classification list. In the second experiment the students recorded
the beginning and ending times, in their form;
Time spent in the classification. In the first experiment we controlled the total time spent by the
group, in the second experiment the students recorded the beginning and ending times, in their
individual form.
3.2.3 Threats to Internal Validity
Threats to internal validity of the experiment are factors that may affect the dependent variable
without the researcher’s knowledge [19]. We identify the following threats to in our experiment:
The experiment was conducted in two groups of different experience and maturity – students with
different backgrounds. Part of them should have industrial experience, since they were doing a

Title: Requirements Defects Classification List
Student: Isabel Margarido Number: 090546003
Professor: João Pascoal Faria Subject: Estudo Livre
2010-08-06 32/81
Master Science degree course, named Master on Services Engineering and Management2
(MESG). The second group comprised undergraduate students graduating in Sciences of
Information3 (LCINF);
The dimension of the two groups was different, compromising the comparison of the results;
The treatment applied was changed from one experiment to the other in order to verify an
improvement of results;
It was difficult to impede subjects from interacting during the execution of the exercise – in the
first experiment we observed the subjects during the exercise. Since it was done during a class we
could not avoid that some of them talked during the experiment. In the second experiment the
subjects did the experiment after finishing their exam, therefore the exchange of thoughts did not
occur;
It is difficult to ensure that the subjects read the entire classification table before commencing the
exercise. In the first experiment, that we observed, we noticed that only few students read the
examples in the classifiers list, from their laughs when reading the more ludicrous ones;
It was difficult to guarantee that the students read the defect in its context (by reading the
requirements document) when doing the exercise.
3.2.4 Threats to External Validity
Threats to external validity of the experiment limit the ability to generalise the results of the
conducted experiments to the industry [19]. The threats to external validity of our experiments are
similar to two of the ones reported by Miller et al. [24] and Porter et al. [19].
This experiment was conducted using students as subjects. They might not be completely
representative of software professionals.
The specification document may not be representative of industrial problems due to its small
dimension and low complexity.
3.2.5 Data Validation
To analyse the data obtained during our experiments, and validate our observations, we used the
SPSS Statistics tool4 and applied the ESE knowledge.
2 http://gnomo.fe.up.pt/~mesg/ – last accessed on 2010-08-03. 3 https://www.fe.up.pt/si/cursos_geral.formview?p_cur_sigla=LCINF – last accessed on 2010-08-03. 4 http://www.spss.com/ – last accessed on 2010-08-03.

Title: Requirements Defects Classification List
Student: Isabel Margarido Number: 090546003
Professor: João Pascoal Faria Subject: Estudo Livre
2010-08-06 33/81
3.2.6 Design and Instrumentation
Initially we intended to conduct an experiment with one single group, to validate the defects
classification that we presented in Table 5. However, we refined our classification list and repeated
the experiment in another group, as we further explain in this subchapter and in the following one.
1st Experiment
The group that participated in the first experiment was a class of the Requirements Engineering for
Services5 (ERS) discipline, lectured on the MESG master science course at Faculty of Engineering of
the University of Porto (FEUP). The subjects had learnt how to develop a requirements specification
document and were familiar with inspections and defects classifications.
The experiment was conducted during a class of the ERS discipline that was interrupted to do the
experiment.
The instruments used in the experiment were the following:
The list of requirements defects classifiers of Table 5;
A requirements specification document with the defects signalled. The document may be found in
Annex D;
A form (Annex C) where the students would find:
o A field to indicate if they had doubts while reading the classifiers list;
o All the defects signalled in the SRS document;
o For each defect one of the three fields presented should be used:
Indicate the most adequate classifier (to be chosen in the classifiers list);
Indicate if they were vacillating between two or more classifiers. To be used
only if the doubts persisted after re-reading the definitions of each one of
them;
Indicate a new classifier name and corresponding definition. To use in case
that none of the classifiers from the list was adequate to classify the
defect.
Our experiment was conducted by following the steps:
Step 1: Without distributing the material to use in the experiment, to ensure the students’ attention
we did a presentation of the experiment. We explained them our experiment goals, what material
they were going to receive and gave them some recommendations such as: not talking with each
other during the experiment, read the entire table with the classifiers before beginning the
5 https://www.fe.up.pt/si/disciplinas_geral.FormView?P_CAD_CODIGO=ESG0014&P_ANO_LECTIVO=2010/2011
&P_PERIODO=2S – last accessed on 2010-08-03

Title: Requirements Defects Classification List
Student: Isabel Margarido Number: 090546003
Professor: João Pascoal Faria Subject: Estudo Livre
2010-08-06 34/81
classification of defects and read the requirement where the defect occurred, before classifying it
(which had the same number as the number of the comment that appeared in the SRS).
Step 2: We distributed the defects classification list and gave the students 3 minutes to read them.
Step 3: We distributed the SRS document and the form where they classified the defects. We
intended to give them 30 minutes to classify the defects.
The results of this experiment are presented in the following subchapter. From the results of the first
experiment we decided it was necessary to do a second one.
2nd Experiment
The group that participated in the second experiment had a discipline named Analysis of Information
Systems II6 (ASI II), lectured on the third year of the LCINF graduation course at FEUP. The subjects
were familiar with the requirements specification document, inspections and defects classifications.
The experiment was done in different conditions from the first one, and the instruments were
changed to allow the conduction of the experiment in the new environment. The students did the
exercise after the exam of a discipline.
The instruments of the same experiment were maintained but a couple of changes were introduced
(Annex C):
An instructions sheet was added;
The requirements defects classification list was refined and the sheet included fields to indicate
the beginning and ending times of the reading;
The defects classification form also included fields to indicate the beginning and ending times of
the classification exercise;
A field was added to the defects classification form, where the students should, after doing the
classification, suggest improvements to do in the experiment or in the taxonomy.
The steps of the experiment were given by the instructions sheet and the order in which the
documents were delivered to the students:
Step 1: Read the instructions sheet;
Step 2: Record the start time, read the classifiers list, definitions and examples and record the stop
time;
Step 3: Read the SRS and classify the defects that were presented in the defects classification form.
The experiment sequence for both experimental groups is illustrated in Fig. 2.
6 https://www.fe.up.pt/si/disciplinas_geral.FormView?P_CAD_CODIGO=ESG0014&P_ANO_LECTIVO=2010/2011
&P_PERIODO=2S – last accessed on 2010-08-03
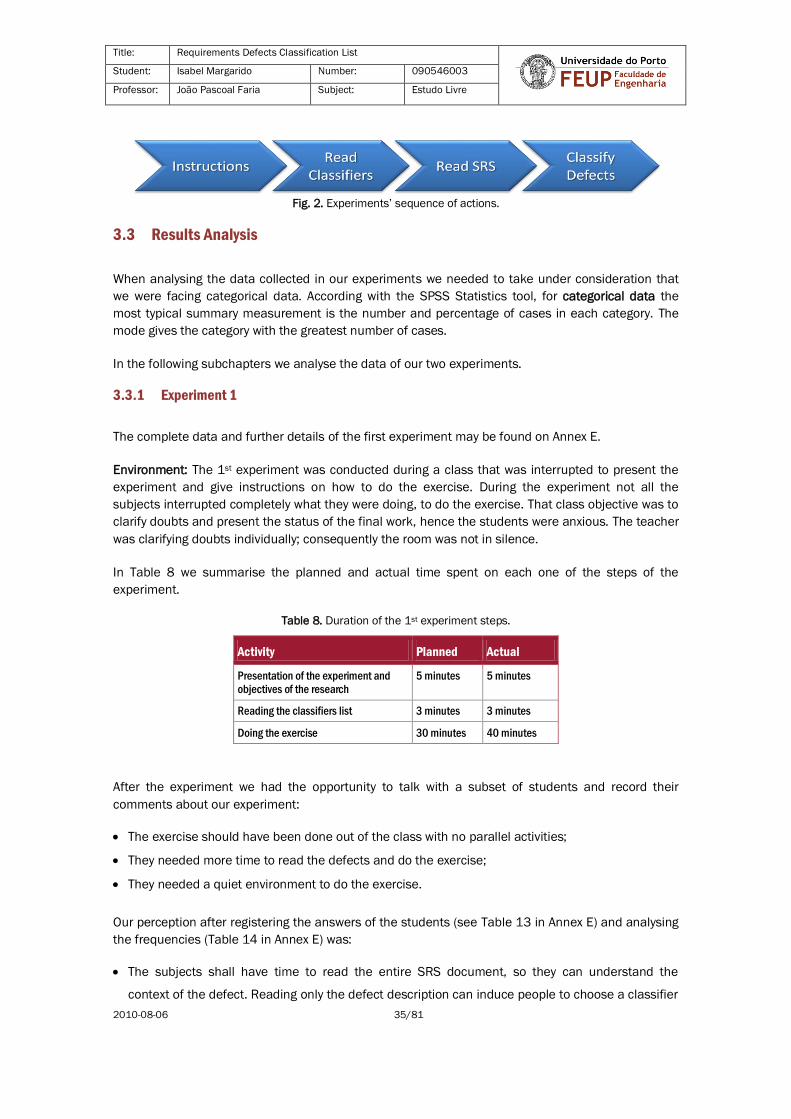
Title: Requirements Defects Classification List
Student: Isabel Margarido Number: 090546003
Professor: João Pascoal Faria Subject: Estudo Livre
2010-08-06 35/81
Fig. 2. Experiments’ sequence of actions.
3.3 Results Analysis
When analysing the data collected in our experiments we needed to take under consideration that
we were facing categorical data. According with the SPSS Statistics tool, for categorical data the
most typical summary measurement is the number and percentage of cases in each category. The
mode gives the category with the greatest number of cases.
In the following subchapters we analyse the data of our two experiments.
3.3.1 Experiment 1
The complete data and further details of the first experiment may be found on Annex E.
Environment: The 1st experiment was conducted during a class that was interrupted to present the
experiment and give instructions on how to do the exercise. During the experiment not all the
subjects interrupted completely what they were doing, to do the exercise. That class objective was to
clarify doubts and present the status of the final work, hence the students were anxious. The teacher
was clarifying doubts individually; consequently the room was not in silence.
In Table 8 we summarise the planned and actual time spent on each one of the steps of the
experiment.
Table 8. Duration of the 1st experiment steps.
Activity Planned Actual
Presentation of the experiment and objectives of the research
5 minutes 5 minutes
Reading the classifiers list 3 minutes 3 minutes
Doing the exercise 30 minutes 40 minutes
After the experiment we had the opportunity to talk with a subset of students and record their
comments about our experiment:
The exercise should have been done out of the class with no parallel activities;
They needed more time to read the defects and do the exercise;
They needed a quiet environment to do the exercise.
Our perception after registering the answers of the students (see Table 13 in Annex E) and analysing
the frequencies (Table 14 in Annex E) was:
The subjects shall have time to read the entire SRS document, so they can understand the
context of the defect. Reading only the defect description can induce people to choose a classifier

Title: Requirements Defects Classification List
Student: Isabel Margarido Number: 090546003
Professor: João Pascoal Faria Subject: Estudo Livre
2010-08-06 36/81
which name is similar to an expression used in the description of the defect. For example, the
defects 27 and 29 occur because previous requirements mentioned information that in the
diagrams do not appear, so the diagrams contradict previous information. Since the word used in
the description is ‘Falta = Is missing’, some students classified the defect as Missing or
Incomplete instead of Inconsistent;
A subset of subjects did not read the definitions of the classifiers. Some did the classification
following their own interpretation of the classifier name, instead of using the definition;
It would be preferable if the students left a seat between each other.
We analysed the proximity of the students’ answers to the expected classifications. The data analysis
tables are presented in Annex E, Table 15 and Table 16. We observed there were four defects that
had very few answers (inferior to 20%) matching the expected classifier:
Defect 10: The defect is about a requirement identifier (ID) that is repeated. In our perspective the
defect would be classified as a typo, a mistake in the number of the ID that was not verified before
the revision. The students interpreted the defect as being a duplicate, and incorrectly classified it as
Redundant or Duplicate. If the defect was classifiable that way, than the requirement would be the
same as the one with the same identifier, which is not true;
Defect 13: The defect reports the usage of an inappropriate term to designate an element that is
specific of the business. Most of the students classified the defect as a Typo which we consider
inappropriate. Therefore we also ignore this defect from further analysis by now.
Defects 27 and 29: Both defects should receive the same classifier that is given to defect 28. The
reported situation is similar in the three defects, because all the diagrams, in the section of the
document where the defects occur, miss elements that were already mentioned in previous
requirements. The students classified the defect 28 correctly, as being Inconsistent. However, the
other two were classified mainly with Missing or Incomplete. We suppose that such classification
was done by influence of the expression “is missing” that appears in the description of the defect.
More important than verifying the matches between the students’ answers and the classifiers that
we used, was to verify if there were classifiers that could be easily confounded, or that could
correctly classify the same defect. So we had to analyse the classifications and clusters of classifiers
used for each defect (we ignored defects 10, 13, 27 and 29).
In Fig. 3 we present the results obtained in the first experiment. There were 29 defects to classify,
represented on the x axis. The classifiers are represented in the y axis, where we also included the
indication of a doubt between classifiers or the suggestion of a new classifier. The golden circle in
the graphic represents the classifier that we expected that the students would use and the red circle
is the answer given by the students. The size of the circle gives the number of the students that used
a certain classifier.
From the pictogram we can verify that the subjects classified almost unanimously (17 or 18
students) the defects 2, 3, 5, 7, 11, 12, 18, 22, 25 and 29. We could state that those classifiers
were clear to them. However, that conclusion would not be correct. For example, the classifier
Missing or Incomplete, used to classify defect 3 was used almost as frequently as Inconsistent, to
classify the defect 8. This indicates that the usage of a single classifier by all users depends on the
defect description.

Title: Requirements Defects Classification List
Student: Isabel Margarido Number: 090546003
Professor: João Pascoal Faria Subject: Estudo Livre
2010-08-06 37/81
Fig. 3. Defects classification done by the first group.
We decided to analyse the defects, one by one, to verify which classifiers were the most used to
classify each defect. Since there seemed to be no ideal classifier for certain defects we considered
that the most used one would be the most adequate to classify the defect. We then made clusters of
defects, grouped by the most used classifier, and analysed per classifier, which other classifiers
were the most commonly used with it. The tables of clusters may be found in Annex E: tables from
17 to 22. We wanted to know which ones could be confounded more easily.
Figures 4 to 10 present the each classifier and the ones most commonly used with it.
Fig. 4. Experiment 1: Classifiers used with Inconsistent.
From the misclassification of defects 27 and 29 we noticed that the Inconsistent classifier was not
clearly defined, so the subjects did not use it when expected. Fig. 4 indicates that even when

Title: Requirements Defects Classification List
Student: Isabel Margarido Number: 090546003
Professor: João Pascoal Faria Subject: Estudo Livre
2010-08-06 38/81
Inconsistent was the most used classifier to classify a group of defects, others could also be. We can
see that 6 out of the 8 remaining classifiers were also used to classify a defect that was considered
Inconsistent.
From Fig. 5 we can see that other classifiers used when a defect is mostly classified as Typo are
Incorrect, Missing or Incomplete and Not relevant. From this result we suspected that the students
considered that Incorrect and Missing or Incomplete where applicable to defects due to erroneous
usage of the language or words that were missing. We considered that the usage of Not relevant was
because the subject was classifying the work of the reviewer and not the defect, so we can ignore it.
Fig. 5. Experiment 1: Classifiers used with Typo.
Analysing Fig. 6 we verify that when the classifier Missing or Incomplete is used there are also other
classifiers being used. Some of those classifiers are Inconsistent, Ambiguous or Unclear and
Incorrect. The percentage of those classifiers used, is lower than 10% in the cases of Ambiguous or
Unclear and Incorrect, when Missing or Incomplete was the most used to classify the defects. But if
we observe the defects 19 and 20 in the pictogram of the Fig. 3 we verify that the difference
between them is not very significant.
Fig. 6. Experiment 1: Classifiers used with Missing or Incomplete.
Fig. 7 indicates that Infeasible or Non-verifiable is confused with 7 other classifiers.

Title: Requirements Defects Classification List
Student: Isabel Margarido Number: 090546003
Professor: João Pascoal Faria Subject: Estudo Livre
2010-08-06 39/81
Fig. 7. Experiment 1: Classifiers used with Infeasible or Non-verifiable.
We were expecting that the classifier Ambiguous or Unclear would be used only once (defect 7), but
in fact it was also used to classify defects 23 and 24. In both defects there were other classifiers
being frequently used, indicating a difficulty in understanding the defect.
Defect 23 and 24 represent a situation where information is not present in the SRS and therefore
the project team needs to contact the client to gather further details on the project. The students
interpreted Ambiguous or Unclear as a classifier that would be applicable to information, when the
definition indicates that it is applicable to the language used. The classifier was used along with
Missing or Incomplete and Redundant or Duplicate. The other classifiers used represent less than
2%.
Fig. 8. Experiment 1: Classifiers used with Ambiguous or Unclear.
Looking at Fig. 9 and Fig. 10 we can see that when mostly used the classifier was Not relevant or
Incorrect the students were practically unanimous in their choice, therefore we will not further
analyse those two classifiers.
We could do an aggregation of similar classifiers and update our requirements defects classification
list. However, we verified that the classifiers that were being confused are among the ones that
occur more often in other authors’ experiments and in the one we did.

Title: Requirements Defects Classification List
Student: Isabel Margarido Number: 090546003
Professor: João Pascoal Faria Subject: Estudo Livre
2010-08-06 40/81
We noticed that students used two classifiers that we considered that were not applicable to the
defects list: Redundant or Duplicate and Misplaced. We realised what was the problem when the
subjects used Redundant or Duplicate to classify the defect 10; but we cannot deduct why those
were used in the other defects. In some of the situations it denotes that the student did not read the
defect text attentively and was mislead by an expression or word.
The usage of Misplaced was also unexpected. By reviewing the defects’ description there is no
denotation of misplaced information. We cannot understand why the defect chosen, apparently the
word misplaced was not clear to the subjects that used it (9 and 15).
We also observed that Incorrect could be easily interpreted as applicable to information and wording,
albeit the definitions distinguished defects of spelling (Typo) from defects of wrong information
(Incorrect). We decided to add information to the name of the classifier Incorrect to avoid the
confusion.
Fig. 9. Experiment 1: Classifiers used with Not relevant.
Fig. 10. Experiment1: Classifiers used with Incorrect.
There were 4 students having doubts between classifiers. We counted 8 occurrences.
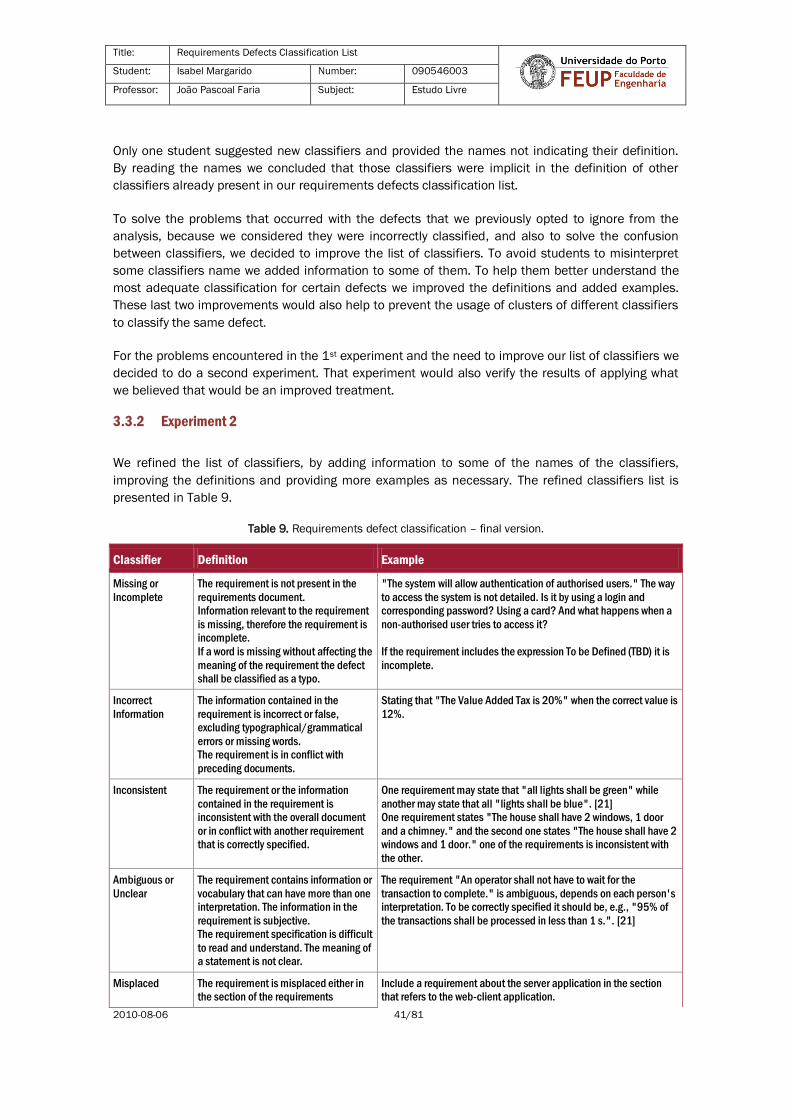
Title: Requirements Defects Classification List
Student: Isabel Margarido Number: 090546003
Professor: João Pascoal Faria Subject: Estudo Livre
2010-08-06 41/81
Only one student suggested new classifiers and provided the names not indicating their definition.
By reading the names we concluded that those classifiers were implicit in the definition of other
classifiers already present in our requirements defects classification list.
To solve the problems that occurred with the defects that we previously opted to ignore from the
analysis, because we considered they were incorrectly classified, and also to solve the confusion
between classifiers, we decided to improve the list of classifiers. To avoid students to misinterpret
some classifiers name we added information to some of them. To help them better understand the
most adequate classification for certain defects we improved the definitions and added examples.
These last two improvements would also help to prevent the usage of clusters of different classifiers
to classify the same defect.
For the problems encountered in the 1st experiment and the need to improve our list of classifiers we
decided to do a second experiment. That experiment would also verify the results of applying what
we believed that would be an improved treatment.
3.3.2 Experiment 2
We refined the list of classifiers, by adding information to some of the names of the classifiers,
improving the definitions and providing more examples as necessary. The refined classifiers list is
presented in Table 9.
Table 9. Requirements defect classification – final version.
Classifier Definition Example
Missing or
Incomplete The requirement is not present in the
requirements document. Information relevant to the requirement
is missing, therefore the requirement is incomplete.
If a word is missing without affecting the
meaning of the requirement the defect shall be classified as a typo.
"The system will allow authentication of authorised users." The way
to access the system is not detailed. Is it by using a login and corresponding password? Using a card? And what happens when a
non-authorised user tries to access it?
If the requirement includes the expression To be Defined (TBD) it is
incomplete.
Incorrect
Information The information contained in the
requirement is incorrect or false, excluding typographical/grammatical
errors or missing words. The requirement is in conflict with
preceding documents.
Stating that "The Value Added Tax is 20%" when the correct value is
12%.
Inconsistent The requirement or the information
contained in the requirement is inconsistent with the overall document
or in conflict with another requirement that is correctly specified.
One requirement may state that "all lights shall be green" while
another may state that all "lights shall be blue". [21] One requirement states "The house shall have 2 windows, 1 door
and a chimney." and the second one states "The house shall have 2 windows and 1 door." one of the requirements is inconsistent with
the other.
Ambiguous or
Unclear The requirement contains information or
vocabulary that can have more than one interpretation. The information in the
requirement is subjective. The requirement specification is difficult
to read and understand. The meaning of a statement is not clear.
The requirement "An operator shall not have to wait for the
transaction to complete." is ambiguous, depends on each person's interpretation. To be correctly specified it should be, e.g., "95% of
the transactions shall be processed in less than 1 s.". [21]
Misplaced The requirement is misplaced either in the section of the requirements
Include a requirement about the server application in the section that refers to the web-client application.

Title: Requirements Defects Classification List
Student: Isabel Margarido Number: 090546003
Professor: João Pascoal Faria Subject: Estudo Livre
2010-08-06 42/81
Classifier Definition Example
specification document or in the functionalities, packages or system it is
referring to.
Infeasible or
Non-verifiable The requirement is not implementable,
due to technology limitations, for instance.
The requirement implementation cannot be verified in a code inspection, by a
test or by any other verification method. If the requirement is non-verifiable due
to ambiguity, incorrectness or missing information, use the corresponding
classifier instead.
“The service users will be admitted in the room by a teleportation
system.” The teleportation technology has not sufficiently evolved to allow the implementation of such requirement.
“The message sent to the space for potential extraterrestrial beings
should be readable for at least 1000 years.”
Redundant or
Duplicate The requirement is a duplicate of
another requirement or part of the information it contains is already
present in the document becoming redundant.
The same requirement appears more than once in the requirements
specification document, or the same information is repeated.
Typo or Formatting
Orthographic, semantic, grammatical error or missing word. Misspelled words
due to hurry. Formatting problems can be classified
in this category.
“The system reacts to the user sensibility, i.e. if the user is screaming the system stops.” The word sensibility is different from
sensitivity.
When a picture is out of the print area.
Not relevant or Extraneous
The requirement or part of its specification is out of the scope of the
project, does not concern the project or
refers to information of the detailed design. The requirement has
unnecessary information.
If the customer is expecting a truck then the requirement stating “The vehicle is cabriolet.” is out of the scope of the project.
A requirement that should have been removed is still in the document.
Environment: The 2nd experiment was conducted after an exam. As the students finished their exams
they would use the documents that they received to do the exercise. We expected the 31 students to
be subjects in our experiment, but we were not present to control, and only 6 of them did it. The
environment was not the ideal to motivate the students to stay and do the exercise, but was more
adequate to avoid exchanges of information between them.
In this experiment the only information about it that was given orally was that:
Two researchers requested their support in an experiment;
After the exam they should read the instructions carefully;
Read the documents in the order they received them;
Do the exercise;
Deliver all the documents in the end.
The complete data and further details of this second experiment can be found on Annex F.
In Table 10 we summarise the planned and actual time spent in each one of the steps of the
experiment. Each student recorded the time used; therefore the times indicated in the table are the
mean times.
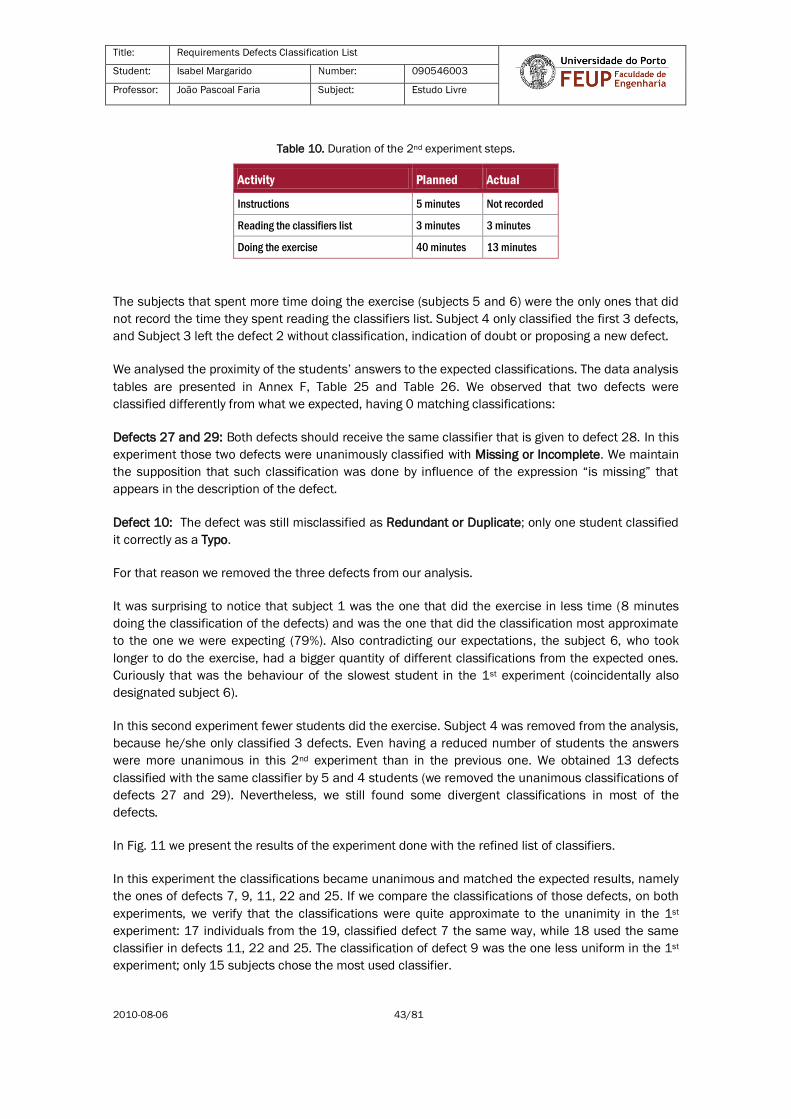
Title: Requirements Defects Classification List
Student: Isabel Margarido Number: 090546003
Professor: João Pascoal Faria Subject: Estudo Livre
2010-08-06 43/81
Table 10. Duration of the 2nd experiment steps.
Activity Planned Actual
Instructions 5 minutes Not recorded
Reading the classifiers list 3 minutes 3 minutes
Doing the exercise 40 minutes 13 minutes
The subjects that spent more time doing the exercise (subjects 5 and 6) were the only ones that did
not record the time they spent reading the classifiers list. Subject 4 only classified the first 3 defects,
and Subject 3 left the defect 2 without classification, indication of doubt or proposing a new defect.
We analysed the proximity of the students’ answers to the expected classifications. The data analysis
tables are presented in Annex F, Table 25 and Table 26. We observed that two defects were
classified differently from what we expected, having 0 matching classifications:
Defects 27 and 29: Both defects should receive the same classifier that is given to defect 28. In this
experiment those two defects were unanimously classified with Missing or Incomplete. We maintain
the supposition that such classification was done by influence of the expression “is missing” that
appears in the description of the defect.
Defect 10: The defect was still misclassified as Redundant or Duplicate; only one student classified
it correctly as a Typo.
For that reason we removed the three defects from our analysis.
It was surprising to notice that subject 1 was the one that did the exercise in less time (8 minutes
doing the classification of the defects) and was the one that did the classification most approximate
to the one we were expecting (79%). Also contradicting our expectations, the subject 6, who took
longer to do the exercise, had a bigger quantity of different classifications from the expected ones.
Curiously that was the behaviour of the slowest student in the 1st experiment (coincidentally also
designated subject 6).
In this second experiment fewer students did the exercise. Subject 4 was removed from the analysis,
because he/she only classified 3 defects. Even having a reduced number of students the answers
were more unanimous in this 2nd experiment than in the previous one. We obtained 13 defects
classified with the same classifier by 5 and 4 students (we removed the unanimous classifications of
defects 27 and 29). Nevertheless, we still found some divergent classifications in most of the
defects.
In Fig. 11 we present the results of the experiment done with the refined list of classifiers.
In this experiment the classifications became unanimous and matched the expected results, namely
the ones of defects 7, 9, 11, 22 and 25. If we compare the classifications of those defects, on both
experiments, we verify that the classifications were quite approximate to the unanimity in the 1st
experiment: 17 individuals from the 19, classified defect 7 the same way, while 18 used the same
classifier in defects 11, 22 and 25. The classification of defect 9 was the one less uniform in the 1st
experiment; only 15 subjects chose the most used classifier.

Title: Requirements Defects Classification List
Student: Isabel Margarido Number: 090546003
Professor: João Pascoal Faria Subject: Estudo Livre
2010-08-06 44/81
Fig. 11. Defects classification done by the second group.
The classification of defect 18 became more divergent in this experiment, than in the previous one.
The most used classifier was used by 89% of the subjects in the 1st experiment, and only by 60% in
this 2nd experiment.
Once again we analysed which classifiers were mostly used to classify each defect. Afterwards we
made clusters of defects that were grouped by the most used classifier. Subsequently we analysed,
per classifier, which other classifiers were the most commonly used with it. The tables of clusters
may be found in Annex F: tables 27 to 32.
Fig. 12. Experiment 2: classifiers used with Missing or Incomplete.
In Fig. 12 we verify that when Missing or Incomplete was the most used classifier, any other
classifier could also be used. This result is similar to the one obtained in the first experiment. In the
first one the percentage of usage of this classifier was higher and Typo was never confounded with
Missing or Incomplete.
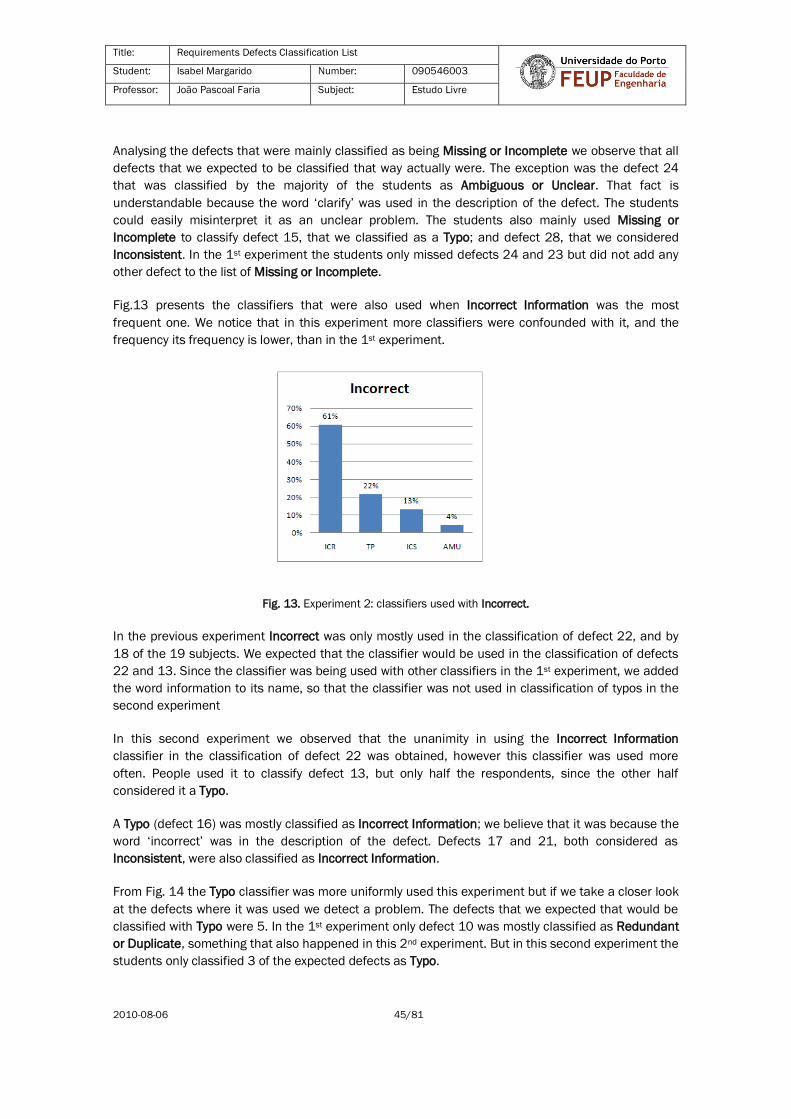
Title: Requirements Defects Classification List
Student: Isabel Margarido Number: 090546003
Professor: João Pascoal Faria Subject: Estudo Livre
2010-08-06 45/81
Analysing the defects that were mainly classified as being Missing or Incomplete we observe that all
defects that we expected to be classified that way actually were. The exception was the defect 24
that was classified by the majority of the students as Ambiguous or Unclear. That fact is
understandable because the word ‘clarify’ was used in the description of the defect. The students
could easily misinterpret it as an unclear problem. The students also mainly used Missing or
Incomplete to classify defect 15, that we classified as a Typo; and defect 28, that we considered
Inconsistent. In the 1st experiment the students only missed defects 24 and 23 but did not add any
other defect to the list of Missing or Incomplete.
Fig.13 presents the classifiers that were also used when Incorrect Information was the most
frequent one. We notice that in this experiment more classifiers were confounded with it, and the
frequency its frequency is lower, than in the 1st experiment.
Fig. 13. Experiment 2: classifiers used with Incorrect.
In the previous experiment Incorrect was only mostly used in the classification of defect 22, and by
18 of the 19 subjects. We expected that the classifier would be used in the classification of defects
22 and 13. Since the classifier was being used with other classifiers in the 1st experiment, we added
the word information to its name, so that the classifier was not used in classification of typos in the
second experiment
In this second experiment we observed that the unanimity in using the Incorrect Information
classifier in the classification of defect 22 was obtained, however this classifier was used more
often. People used it to classify defect 13, but only half the respondents, since the other half
considered it a Typo.
A Typo (defect 16) was mostly classified as Incorrect Information; we believe that it was because the
word ‘incorrect’ was in the description of the defect. Defects 17 and 21, both considered as
Inconsistent, were also classified as Incorrect Information.
From Fig. 14 the Typo classifier was more uniformly used this experiment but if we take a closer look
at the defects where it was used we detect a problem. The defects that we expected that would be
classified with Typo were 5. In the 1st experiment only defect 10 was mostly classified as Redundant
or Duplicate, something that also happened in this 2nd experiment. But in this second experiment the
students only classified 3 of the expected defects as Typo.

Title: Requirements Defects Classification List
Student: Isabel Margarido Number: 090546003
Professor: João Pascoal Faria Subject: Estudo Livre
2010-08-06 46/81
Fig. 14. Experiment 2: classifiers used with Typo.
If we compare exactly the same defects that were clustered as Typo in the 1st experiment (Error!
eference source not found.) with the results of the same cluster in this second experiment, we notice
that Not Relevant is no longer in the group, and the percentage of classifications with Typo is slightly
inferior.
Fig. 15. Experiment 2: classifiers used in the defects 2, 5, 11, 15 and 16.
In both experiments Infeasible or Non-verifiable was mostly used to classify the defects that we
expected. In this second experiment, by observing Fig. 16. Experiment 2: classifiers used with
Infeasible or Non-verifiable.
, we verify an improvement in its usage. Missing or Incomplete and Not Relevant are no longer being
used in the classification of the same defects and the percentage of usage of Infeasible or Non-
verifiable increased.
The classifier Ambiguous or Unclear was expected to classify defect 7. In the 1st experiment it was
used in two more defects, in the other hand, in the 2nd experiment it was used in only one more
defect. The classifier was used by all the subjects to classify defect 7, contributing to the
improvement in the frequency of its usage that we can see in Fig. 17.
In both experiments Not relevant or Extraneous was the classifier used to classify defect 12, as
expected. In the second experiment the percentage of its usage diminished and more classifiers
were used in the same defect. The classifiers are presented in Fig. 18.

Title: Requirements Defects Classification List
Student: Isabel Margarido Number: 090546003
Professor: João Pascoal Faria Subject: Estudo Livre
2010-08-06 47/81
Fig. 16. Experiment 2: classifiers used with Infeasible or Non-verifiable.
Fig. 17. Experiment 2: classifiers used with Ambiguous or Unclear.
Fig. 18. Experiment 2: classifiers used with Not relevant or Extraneous.

Title: Requirements Defects Classification List
Student: Isabel Margarido Number: 090546003
Professor: João Pascoal Faria Subject: Estudo Livre
2010-08-06 48/81
Inconsistent was not correctly understood in none of the experiments, therefore it was not used in
the classification of the defects that we expected (1, 17, 21, 27, 28 and 29). The classifier was used
unanimously by all the students that classified defect 1 and one of the subjects had doubts. Even if
we notice that there was an improvement in the classification of defect 1 (see the graphic in Fig. 19)
in the 1st experiment it was also mostly used to additionally classify the defects 17, 21 and 28.
Fig. 19. Experiment 2: classifiers used with Inconsistent.
3.3.3 Summary of Results
With our results we rejected the null hypothesis:
H0: All subjects attribute different classifiers to the same defect, when classifying the defects found
in a requirements document.
However we could not validate our alternative hypothesis:
H1: All subjects attribute the same classifier to the same defect, when classifying the defects found
in a requirements document.
We verified that in the 2nd experiment, for certain defects, the test demonstrated the alternative
hypothesis. Students could attribute the same classifier to the same defect unanimously, in certain
defects, even if they used a classifier that we did not expect. We verified that the maturity,
knowledge and other factors of the environment can influence the classification process and that
certain defects generate doubts in the classification.
In Table 11 we summarise the results obtained for each one of the classifiers, in the second
experiment. We classify the results as better (+), worst (-) or equal (=), when compared with the data
obtained in the 1st experiment.
To calculate the balance per classifier and the final balance, we counted the number of positive and
negative signs. The sign that appears more frequently gives us the overall result of the experiment.
When the number of positives and negatives is the same, they cancel each other and we can
conclude that the balance is equal.

Title: Requirements Defects Classification List
Student: Isabel Margarido Number: 090546003
Professor: João Pascoal Faria Subject: Estudo Livre
2010-08-06 49/81
Table 11. Summary of results per classifier. Comparison of the 2nd experiment observations with the 1st.
Classifier Observations Result Balance
Missing or Incomplete Better used to classify the defects that we expected +
Extra defects were also classified -
Lower percentage of usage - -
Incorrect Information Used to classify the two defects that we expected +
Used to classify extra defects -
Lower percentage of usage - -
Typo Lower quantity of other classifiers being confounded with it +
Mostly used in fewer defects than expected - =
Infeasible or Non-
verifiable
Improved percentage of occurrence +
Used in fewer unexpected defects + 2+
Ambiguous or Unclear Only used in one extra defect +
Unanimously used to classify the defect we were expecting +
Increased percentage of its usage + 3+
Not Relevant or Extraneous Diminished the percentage of its usage in the classification of the expected defect
-
An extra classifier added when this one is the mainly used - 2-
Inconsistent Unanimous choice in the classification of expected defect +
Diminished the number of defects that we expected it to be the most used
classifier
- =
Final Balance.......................................................................................................................................... 9+ and 8- +
We do not analyse classifiers Misplaced and Redundant or Duplicate because there were no defects
of such type in the SRS document.
As we can observe in the summary that the overall balance of the 2nd experiment was positive. But
we also have to take into consideration that the results were better for two classifiers and negative
for three.
We also consider a positive improvement to have defects that were unanimously classified in the
second experiment, even if the overall approximation of the expected classifications diminished.
3.4 Results Discussion
The two experiments we did are not totally comparable:
To verify an improvement in the treatment we should use the same group, however we would
need to use a different requirements document and that would introduce differences;
The first group was actually developing a requirements document while the second one knew the
concepts in theory;

Title: Requirements Defects Classification List
Student: Isabel Margarido Number: 090546003
Professor: João Pascoal Faria Subject: Estudo Livre
2010-08-06 50/81
The groups have different number of subjects, so the results in percentage might not be
comparable;
Some of the 1st group members had already worked in the industry;
The groups might not represent software engineering professionals, even though we considered
that in any industry requirements documents and consequent reviews are necessary.
Designing our experiment with the Campbell and Stanley notation [23] we can realise the differences
in the experiments:
1st experiment: G1 T1 O
2nd experiment: G2 T2 O
G1 and G2 represent the Experimental Groups 1 and 2, respectively. O stands for Observation and T
for Treatment.
The group 1 was observed when received a treatment. In the second experiment the treatment
changed and group 2 was observed. Having different groups to which we apploied different
treatments induce us to consider that the results may not be comparable.
From our results we verify that the classifiers are used differently by different people, not for being
wrong, but because they are expressed in natural language, as the defects are, and that introduces
ambiguities in the classification process.
In our experiments we gave the students a document that had already all the defects identified, and
they were not involved in the requirements elicitation and specification process. We believe that the
fact that they were not the ones identifying the defects increases the error of misinterpretation of the
defect, therefore increasing the number of different classifications.
The fact of being out of the project where the requirements were developed also increases the
difficulty of doing the review of the requirements and classification of the defects that were found.
This problem was reported in the experiment of Walia and Craver [20], where the students indicated
that they felt that it was more difficult to abstract and classify errors, because they were not involved
in the development of the requirements and did not have access to the developers. They were
referring to the errors themselves, but we may consider that such problem might possibly occur in
the classification of defects also.
To diminish the quantity of different classifications by different people we recommend that people
are trained in the usage of the defects classification. The training shall orient in the distinction of the
classifiers, clarify the definitions, give practical examples and include classification exercises.
Even with the training: the situation of using a classification scheme during training is different from
using it when working. From our results we can deduce that some of the classifications were done
interpreting the name of the classifiers, instead of considering their definition. In the industry it is
possible that the same situation occurs. To prevent that situation, if the defects report is done using
a tool, the form needs to have tool tips. That way, when using the classifiers, people can remember
their definition, if necessary. However, this solution is also fallible. People might be looking at the
definition only in case of doubt and that does not eliminate the interpretation of the classifier name,
if the person has no doubts.
Title: Requirements Defects Classification List
Student: Isabel Margarido Number: 090546003
Professor: João Pascoal Faria Subject: Estudo Livre
2010-08-06 51/81
We agree with Card (2005) when he states that a defect taxonomy should be created in such a way
that it supports the specific analysis interests of the organisation that is going to use it, namely in the
implementation of defect causal analysis [25]. With our work we contribute with a list of the
taxonomies that are used to classify requirements defects. We also assembled a list of classifiers
most commonly used and that has a subset of the quality properties of classification schemes.
When choosing a classification for requirements’ defect, the organisations need to be aware of the
problems of using them. People may interpret the classifiers differently. Consequently, doing
retrospective analysis of defects simply based on the type of defects might be misleading.
We identified some improvements we need to introduce in our experiment design in our future
research work:
The document review, and consequently the defects identification, shall be done by the subjects;
The experiment needs to be conducted in the industry environment;
In the experiment, use a document from a project of that organisation, and use the project
members as subjects;
We need to add a control group that will do the revision without a defects classification list. So
that we may compare results (quantity of defects detected, performance and similarity of the
classifiers used).

Title: Requirements Defects Classification List
Student: Isabel Margarido Number: 090546003
Professor: João Pascoal Faria Subject: Estudo Livre
2010-08-06 52/81
4 Conclusions and Future Research
In this work we reviewed the literature that mentioned classifiers for requirements defects and
assembled a list of classifiers, following the recommendations of Freimut et al. [5]. We evaluated the
quality properties of our list by doing two experiments where students had to classify the defects that
were identified in a SRS document using our requirements defects classification list.
With this experiment we concluded that even refining the defects classification list, and improving
the proximity of the classifications done by different subjects, it is possible that different people do
not classify defects the same way. This is an indicator that maybe if organisations want to analyse
root causes of problems, by analysing the most frequent types of defects, they may be drawing
wrong conclusions, because the classification of the defect depends on the person that classified it.
In this technical report we propose a defect classification to be applied to requirements defects, with
the objective of supporting: root causes of problems analysis and resolution, the creation of
verification checklists to improve inspections and prevent risks related with requirements defects.
We alert the industry for the fact that if root cause analysis is done, by analysing classes of defects, it
is important to review the classifications, because different people may classify defects differently.
We understand that our experiment needs to be repeated in a situation where different individuals
do the revision of the requirements document, detect and classify the defects. We believe that the
classification will be more accurate when done by the person who is reviewing the document.
Perhaps on those circumstances the classification of the defects will be more unanimous, than the
ones we have obtained until now.
As future research work we will reproduce the experiment with individuals from the industry. We will
use the defects classification to create a checklist, to be used in requirements inspections. We will
verify if these tools reduce the defects in the subsequent software development phases.

Title: Requirements Defects Classification List
Student: Isabel Margarido Number: 090546003
Professor: João Pascoal Faria Subject: Estudo Livre
2010-08-06 53/81
References
[1] I. Sommerville, Software Engineering, 7th ed.: Pearson Education Limited, 2004. [2] J.-C. Chen and S.-J. Huang, "An empirical analysis of the impact of software development problem
factors on software maintainability," Journal of Systems and Software, vol. 82, pp. 981-992 June 2009 2009.
[3] M. Hamill and G.-P. Katerina, "Common Trends in Software Fault and Failure Data," IEEE Trans. Softw.
Eng., vol. 35, pp. 484-496, 2009. [4] K. Henningsson and C. Wohlin, "Assuring Fault Classification Agreement - An Empirical Evaluation,"
presented at the International Symposium on Empirical Software Engineering, Redondo Beach, California, 2004.
[5] B. Freimut, et al., "An Industrial Case Study of Implementing and Validating Defect Classification for Process Improvement and Quality Management," presented at the Proceedings of the 11th IEEE
International Software Metrics Symposium, 2005. [6] D. N. Card, "Learning from Our Mistakes with Defect Causal Analysis," IEEE Softw., vol. 15, pp. 56-63,
1998. [7] R. R. Lutz and C. Mikulski, "Requirements discovery during the testing of safety-critical software,"
presented at the Proceedings of the 25th International Conference on Software Engineering, Portland, Oregon, 2003.
[8] R. Chillarege, et al., "Orthogonal Defect Classification-A Concept for In-Process Measurements," IEEE Transactions on Software Engineering, vol. 18, pp. 943-956, November 1992 1992.
[9] R. B. Grady, Practical software metrics for project management and process improvement: Prentice-Hall, Inc., 1992.
[10] T. E. Bell and T. A. Thayer, "Software requirements: Are they really a problem?," presented at the Proceedings of the 2nd international conference on Software engineering, San Francisco, California,
United States, 1976. [11] V. R. Basili and D. M. Weiss, "Evaluation of a software requirements document by analysis of change
data," presented at the Proceedings of the 5th international conference on Software engineering, San Diego, California, United States, 1981.
[12] G. S. Walia and J. C. Carver, "A systematic literature review to identify and classify software requirement errors," Information and Software Technology, vol. 51, pp. 1087-1109 July 2009 2009.
[13] A. F. Ackerman, et al., "Software Inspections: An Effective Verification Process," IEEE Software, vol. 6, pp. 31-36, May 1989.
[14] G. S. Walia and J. C. Carver, "Development of Requirement Error Taxonomy as a Quality Improvement Approach: A Systematic Literature Review," Department of Computer Science and Engineering MSU-
070404, 2007.
[15] J. H. Hayes, "Building a Requirement Fault Taxonomy: Experiences from a NASA Verification and Validation Research Project," presented at the Proceedings of the International Symposium on
Software Reliability Engineering, Denver, CO, 2003. [16] J. H. Hayes, et al., "Case History of International Space Station Requirement Faults," presented at the
Proceedings of the 11th IEEE International Conference on Engineering of Complex Computer Systems, Standford, California, 2006.
[17] M. Kalinowski, et al., "Title," unpublished|. [18] G. M. Schneider, et al., "An experimental study of fault detection in user requirements documents,"
ACM Trans. Softw. Eng. Methodol., vol. 1, pp. 188-204, 1992. [19] A. A. Porter, et al., "Comparing Detection Methods for Software Requirements Inspections: A
Replicated Experiment," IEEE Transactions on Software Engineering, vol. 21, pp. 563-575, June 1995 1995.
[20] G. S. Walia, et al., "Requirement Error Abstraction and Classification: A Control Group Replicated Study," presented at the Proceedings of the The 18th IEEE International Symposium on Software
Reliability, 2007. [21] IEEE, "IEEE Recommended Practice for Software Requirements Specifications," ed: IEEE, 1998.
[22] B. A. Kitchenham, et al., "Preliminary guidelines for empirical research in software engineering," IEEE Trans. Softw. Eng., vol. 28, pp. 721-734, 2002.
[23] M. C. P. A. Goulão, "Component-Based Software Engineering: a Quantitative Approach," Doctoral, Departamento de Informática, Universidade Nova de Lisboa, Faculdade de Ciências e Tecnologia,
Lisboa, 2008. [24] J. Miller, et al., "Further Experiences with Scenarios and Checklists," Empirical Softw. Engg., vol. 3, pp.
37-64, 1998. [25] M. Kalinowski, et al., "Guidance for Efficiently Implementing Defect Causal Analysis," presented at the
Brazilian Software Quality Symposium,VII SBSQ Florianópolis, Brazil, 2008.
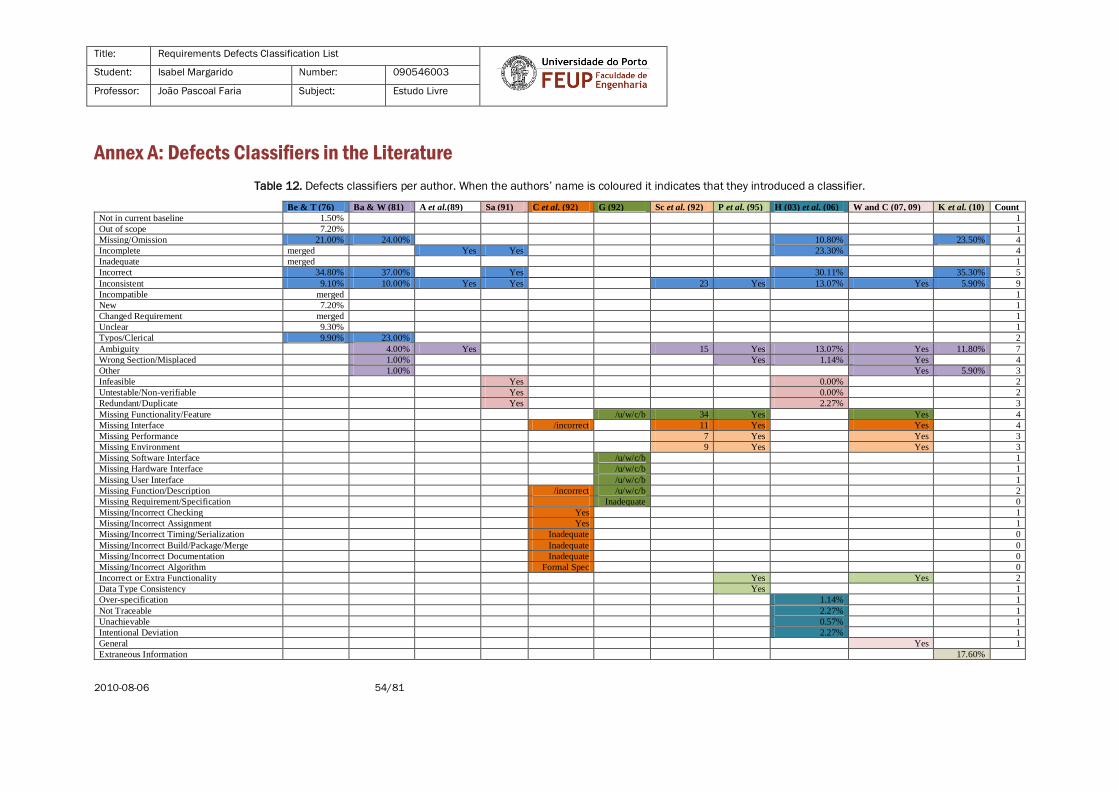
Title: Requirements Defects Classification List
Student: Isabel Margarido Number: 090546003
Professor: João Pascoal Faria Subject: Estudo Livre
2010-08-06 54/81
Annex A: Defects Classifiers in the Literature
Table 12. Defects classifiers per author. When the authors’ name is coloured it indicates that they introduced a classifier.
Be & T (76) Ba & W (81) A et al.(89) Sa (91) C et al. (92) G (92) Sc et al. (92) P et al. (95) H (03) et al. (06) W and C (07, 09) K et al. (10) Count
Not in current baseline 1.50%
1
Out of scope 7.20%
1
Missing/Omission 21.00% 24.00%
10.80%
23.50% 4
Incomplete merged
Yes Yes
23.30%
4
Inadequate merged
1
Incorrect 34.80% 37.00%
Yes
30.11%
35.30% 5
Inconsistent 9.10% 10.00% Yes Yes
23 Yes 13.07% Yes 5.90% 9
Incompatible merged
1
New 7.20%
1
Changed Requirement merged
1
Unclear 9.30%
1
Typos/Clerical 9.90% 23.00%
2
Ambiguity
4.00% Yes
15 Yes 13.07% Yes 11.80% 7
Wrong Section/Misplaced
1.00%
Yes 1.14% Yes
4
Other
1.00%
Yes 5.90% 3
Infeasible
Yes
0.00%
2
Untestable/Non-verifiable
Yes
0.00%
2
Redundant/Duplicate
Yes
2.27%
3
Missing Functionality/Feature
/u/w/c/b 34 Yes
Yes
4
Missing Interface
/incorrect
11 Yes
Yes
4
Missing Performance
7 Yes
Yes
3
Missing Environment
9 Yes
Yes
3
Missing Software Interface
/u/w/c/b
1
Missing Hardware Interface
/u/w/c/b
1
Missing User Interface
/u/w/c/b
1
Missing Function/Description
/incorrect /u/w/c/b
2
Missing Requirement/Specification
Inadequate
0
Missing/Incorrect Checking
Yes
1
Missing/Incorrect Assignment
Yes
1
Missing/Incorrect Timing/Serialization
Inadequate
0
Missing/Incorrect Build/Package/Merge
Inadequate
0
Missing/Incorrect Documentation
Inadequate
0
Missing/Incorrect Algorithm
Formal Spec
0
Incorrect or Extra Functionality
Yes
Yes
2
Data Type Consistency
Yes
1
Over-specification
1.14%
1
Not Traceable
2.27%
1
Unachievable
0.57%
1
Intentional Deviation
2.27%
1
General
Yes
1
Extraneous Information
17.60%
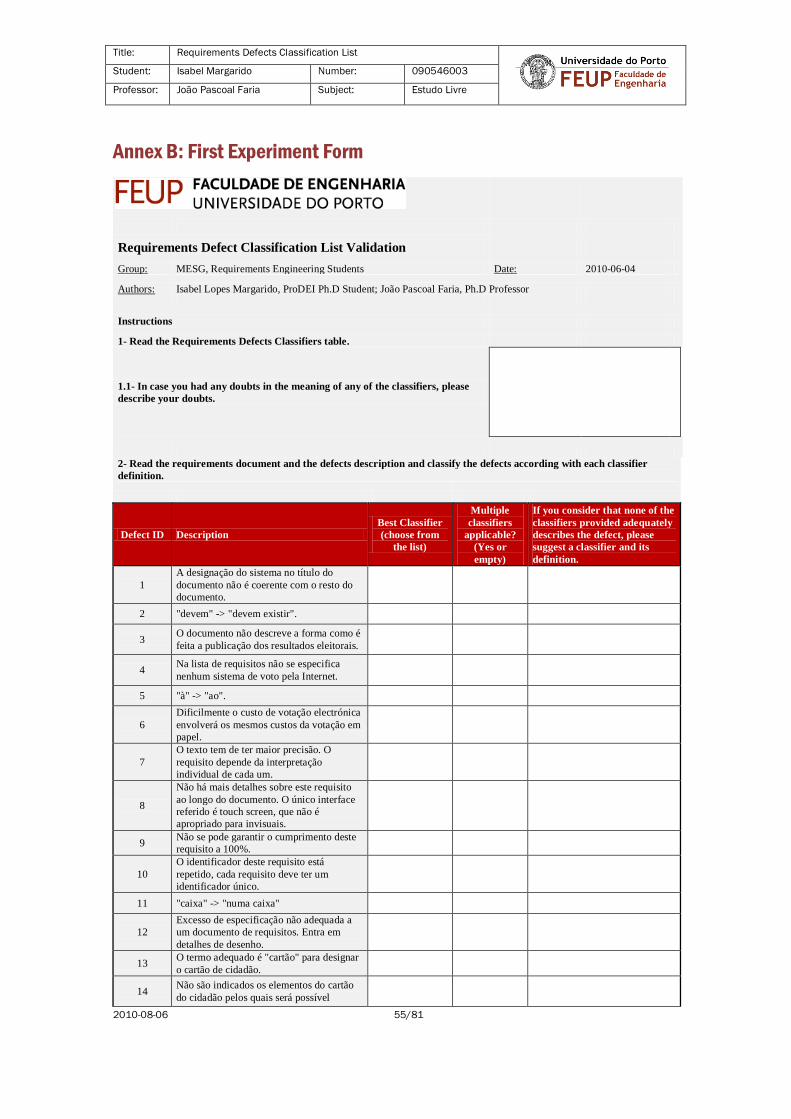
Title: Requirements Defects Classification List
Student: Isabel Margarido Number: 090546003
Professor: João Pascoal Faria Subject: Estudo Livre
2010-08-06 55/81
Annex B: First Experiment Form
Requirements Defect Classification List Validation
Group: MESG, Requirements Engineering Students Date: 2010-06-04
Authors: Isabel Lopes Margarido, ProDEI Ph.D Student; João Pascoal Faria, Ph.D Professor
Instructions
1- Read the Requirements Defects Classifiers table.
1.1- In case you had any doubts in the meaning of any of the classifiers, please
describe your doubts.
2- Read the requirements document and the defects description and classify the defects according with each classifier
definition.
Defect ID Description
Best Classifier
(choose from
the list)
Multiple
classifiers
applicable?
(Yes or
empty)
If you consider that none of the
classifiers provided adequately
describes the defect, please
suggest a classifier and its
definition.
1
A designação do sistema no título do
documento não é coerente com o resto do
documento.
2 "devem" -> "devem existir".
3 O documento não descreve a forma como é
feita a publicação dos resultados eleitorais.
4 Na lista de requisitos não se especifica
nenhum sistema de voto pela Internet.
5 "à" -> "ao".
6
Dificilmente o custo de votação electrónica
envolverá os mesmos custos da votação em
papel.
7
O texto tem de ter maior precisão. O
requisito depende da interpretação
individual de cada um.
8
Não há mais detalhes sobre este requisito
ao longo do documento. O único interface
referido é touch screen, que não é
apropriado para invisuais.
9 Não se pode garantir o cumprimento deste
requisito a 100%.
10
O identificador deste requisito está
repetido, cada requisito deve ter um
identificador único.
11 "caixa" -> "numa caixa"
12
Excesso de especificação não adequada a
um documento de requisitos. Entra em
detalhes de desenho.
13 O termo adequado é "cartão" para designar
o cartão de cidadão.
14 Não são indicados os elementos do cartão
do cidadão pelos quais será possível

Title: Requirements Defects Classification List
Student: Isabel Margarido Number: 090546003
Professor: João Pascoal Faria Subject: Estudo Livre
2010-08-06 56/81
efectuar pesquisas.
15 Falta texto nesta frase. Pretendia-se dizer "a
uma lista de eleitores"?
16 A sigla está incorrecta, deveria estar escrito
"PME".
17 O termo usado anteriormente era
encerramento.
18
No documento não há informação sobre
como é que o Caderno Eleitoral Electrónico
é carregado no sistema.
19 Então além do nº de eleitor é necessário
guardar a freguesia de recenseamento.
20 Então além do nº de eleitor é necessário
guardar a cidade de recenseamento.
21 Foi referido voto pela Internet e não por
correspondência.
22 O número de círculos eleitorais existentes
não é 12.
23 Confirmar se isto também se aplica no caso
de votação para o parlamento europeu.
24 Clarificar se residentes no estrangeiro
podem votar nas eleições autárquicas.
25 Falta informação sobre como é que o SIE
recebe os resultados das mesas de voto.
26
Tem também de relacionar a informação
recebida com os dados do caderno eleitoral
para determinar a abstenção.
27
Falta indicar que o eleitor também pode
apresentar o cartão do cidadão (requisito
RPME2).
28
Apenas se refere cartão magnético, mas o
requisito RPVE3 refere a possibilidade
doutros dispositivos.
29 Falta morada para recenseados no
estrangeiro (requisito RCEE3).
3- Please save this file adding -your name initials as in defects-classification-list-validation-im.xlsx and send it by e-mail to
Thank you for your collaboration!
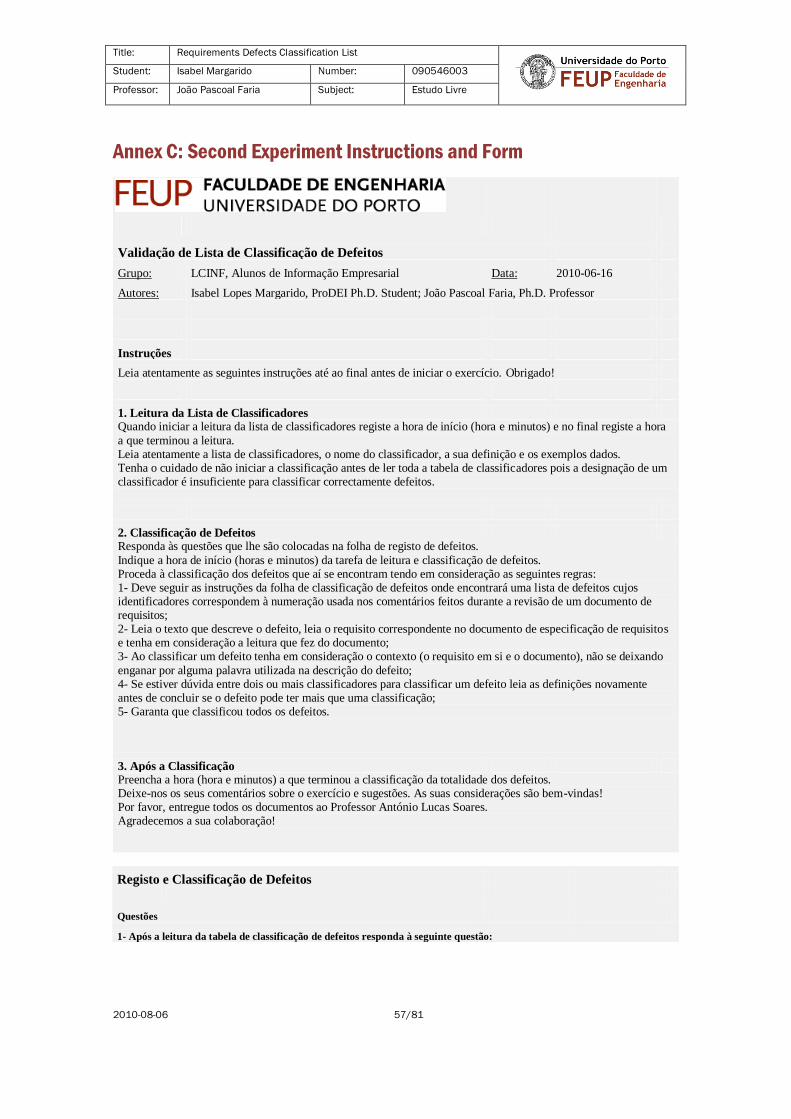
Title: Requirements Defects Classification List
Student: Isabel Margarido Number: 090546003
Professor: João Pascoal Faria Subject: Estudo Livre
2010-08-06 57/81
Annex C: Second Experiment Instructions and Form
Validação de Lista de Classificação de Defeitos
Grupo: LCINF, Alunos de Informação Empresarial Data: 2010-06-16
Autores: Isabel Lopes Margarido, ProDEI Ph.D. Student; João Pascoal Faria, Ph.D. Professor
Instruções
Leia atentamente as seguintes instruções até ao final antes de iniciar o exercício. Obrigado!
1. Leitura da Lista de Classificadores Quando iniciar a leitura da lista de classificadores registe a hora de início (hora e minutos) e no final registe a hora
a que terminou a leitura. Leia atentamente a lista de classificadores, o nome do classificador, a sua definição e os exemplos dados. Tenha o cuidado de não iniciar a classificação antes de ler toda a tabela de classificadores pois a designação de um classificador é insuficiente para classificar correctamente defeitos.
2. Classificação de Defeitos Responda às questões que lhe são colocadas na folha de registo de defeitos.
Indique a hora de início (horas e minutos) da tarefa de leitura e classificação de defeitos. Proceda à classificação dos defeitos que aí se encontram tendo em consideração as seguintes regras: 1- Deve seguir as instruções da folha de classificação de defeitos onde encontrará uma lista de defeitos cujos identificadores correspondem à numeração usada nos comentários feitos durante a revisão de um documento de requisitos; 2- Leia o texto que descreve o defeito, leia o requisito correspondente no documento de especificação de requisitos e tenha em consideração a leitura que fez do documento; 3- Ao classificar um defeito tenha em consideração o contexto (o requisito em si e o documento), não se deixando
enganar por alguma palavra utilizada na descrição do defeito; 4- Se estiver dúvida entre dois ou mais classificadores para classificar um defeito leia as definições novamente antes de concluir se o defeito pode ter mais que uma classificação; 5- Garanta que classificou todos os defeitos.
3. Após a Classificação Preencha a hora (hora e minutos) a que terminou a classificação da totalidade dos defeitos. Deixe-nos os seus comentários sobre o exercício e sugestões. As suas considerações são bem-vindas! Por favor, entregue todos os documentos ao Professor António Lucas Soares. Agradecemos a sua colaboração!
Registo e Classificação de Defeitos
Questões
1- Após a leitura da tabela de classificação de defeitos responda à seguinte questão:
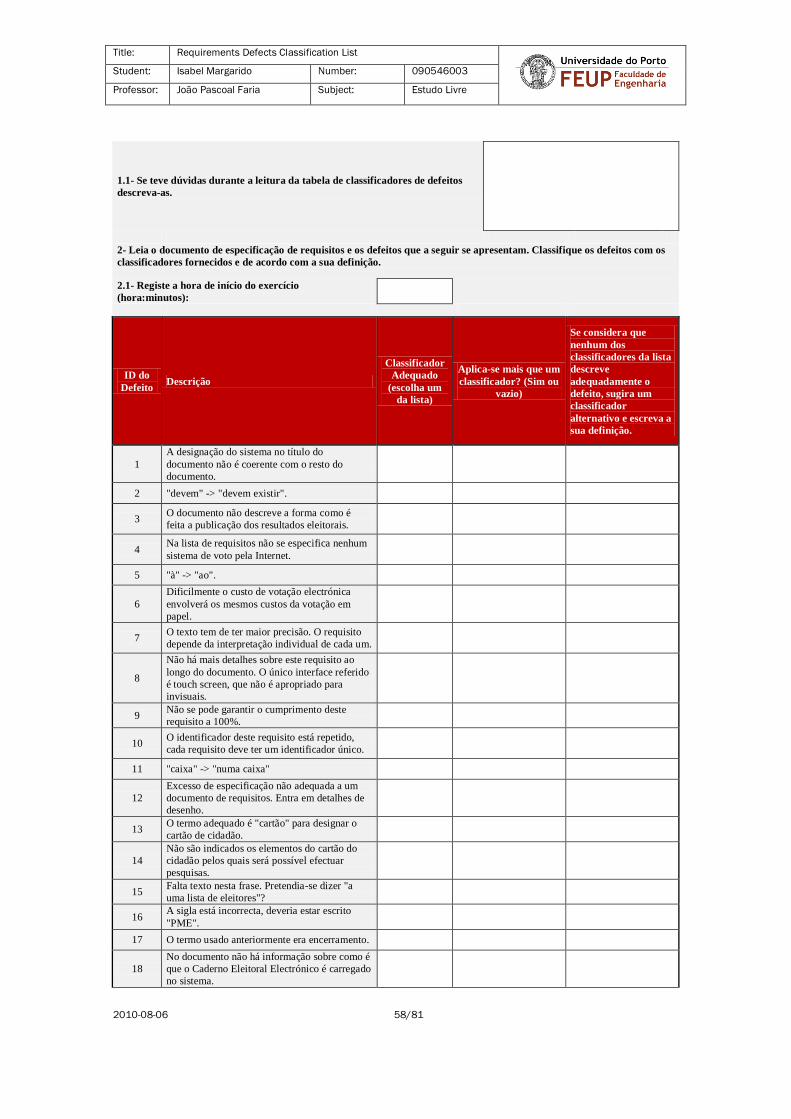
Title: Requirements Defects Classification List
Student: Isabel Margarido Number: 090546003
Professor: João Pascoal Faria Subject: Estudo Livre
2010-08-06 58/81
1.1- Se teve dúvidas durante a leitura da tabela de classificadores de defeitos
descreva-as.
2- Leia o documento de especificação de requisitos e os defeitos que a seguir se apresentam. Classifique os defeitos com os
classificadores fornecidos e de acordo com a sua definição.
2.1- Registe a hora de início do exercício
(hora:minutos):
ID do
Defeito Descrição
Classificador
Adequado
(escolha um
da lista)
Aplica-se mais que um
classificador? (Sim ou
vazio)
Se considera que
nenhum dos
classificadores da lista
descreve
adequadamente o
defeito, sugira um
classificador
alternativo e escreva a
sua definição.
1
A designação do sistema no título do
documento não é coerente com o resto do
documento.
2 "devem" -> "devem existir".
3 O documento não descreve a forma como é
feita a publicação dos resultados eleitorais.
4 Na lista de requisitos não se especifica nenhum
sistema de voto pela Internet.
5 "à" -> "ao".
6
Dificilmente o custo de votação electrónica
envolverá os mesmos custos da votação em
papel.
7 O texto tem de ter maior precisão. O requisito
depende da interpretação individual de cada um.
8
Não há mais detalhes sobre este requisito ao
longo do documento. O único interface referido
é touch screen, que não é apropriado para
invisuais.
9 Não se pode garantir o cumprimento deste
requisito a 100%.
10 O identificador deste requisito está repetido,
cada requisito deve ter um identificador único.
11 "caixa" -> "numa caixa"
12
Excesso de especificação não adequada a um
documento de requisitos. Entra em detalhes de
desenho.
13 O termo adequado é "cartão" para designar o
cartão de cidadão.
14
Não são indicados os elementos do cartão do
cidadão pelos quais será possível efectuar
pesquisas.
15 Falta texto nesta frase. Pretendia-se dizer "a
uma lista de eleitores"?
16 A sigla está incorrecta, deveria estar escrito
"PME".
17 O termo usado anteriormente era encerramento.
18
No documento não há informação sobre como é
que o Caderno Eleitoral Electrónico é carregado
no sistema.
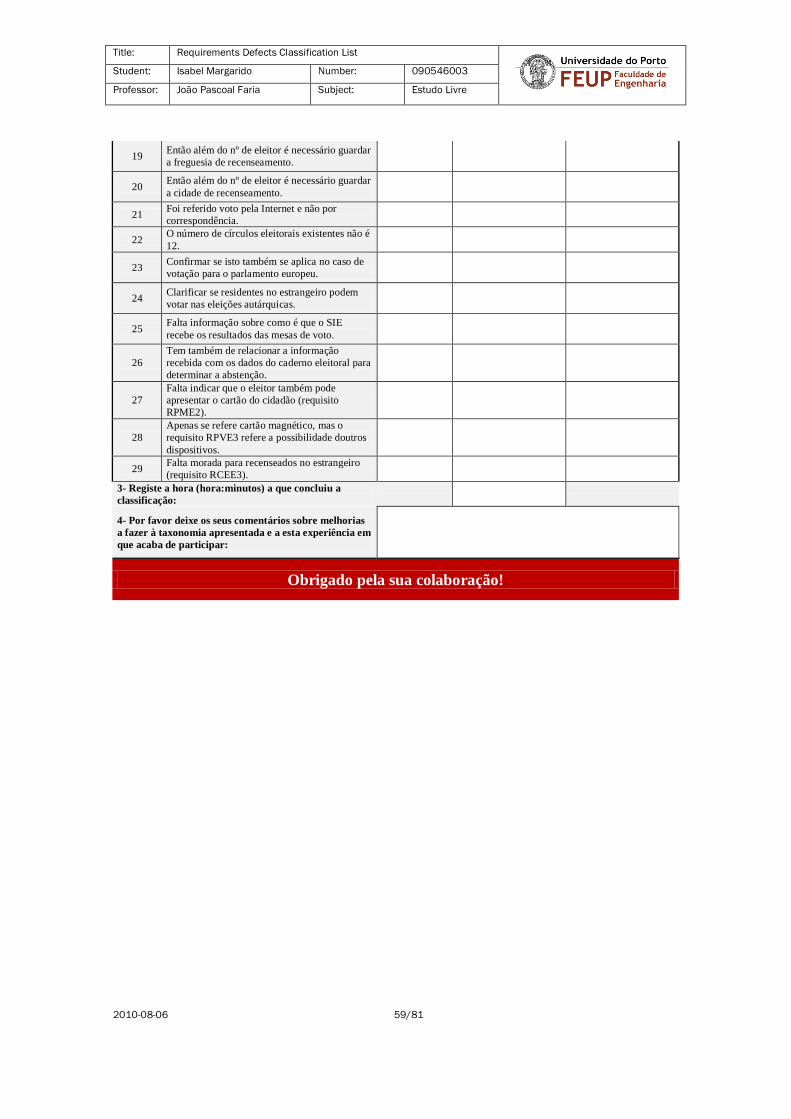
Title: Requirements Defects Classification List
Student: Isabel Margarido Number: 090546003
Professor: João Pascoal Faria Subject: Estudo Livre
2010-08-06 59/81
19 Então além do nº de eleitor é necessário guardar
a freguesia de recenseamento.
20 Então além do nº de eleitor é necessário guardar
a cidade de recenseamento.
21 Foi referido voto pela Internet e não por
correspondência.
22 O número de círculos eleitorais existentes não é
12.
23 Confirmar se isto também se aplica no caso de
votação para o parlamento europeu.
24 Clarificar se residentes no estrangeiro podem
votar nas eleições autárquicas.
25 Falta informação sobre como é que o SIE
recebe os resultados das mesas de voto.
26
Tem também de relacionar a informação
recebida com os dados do caderno eleitoral para
determinar a abstenção.
27
Falta indicar que o eleitor também pode
apresentar o cartão do cidadão (requisito
RPME2).
28
Apenas se refere cartão magnético, mas o
requisito RPVE3 refere a possibilidade doutros
dispositivos.
29 Falta morada para recenseados no estrangeiro
(requisito RCEE3).
3- Registe a hora (hora:minutos) a que concluiu a
classificação:
4- Por favor deixe os seus comentários sobre melhorias
a fazer à taxonomia apresentada e a esta experiência em
que acaba de participar:
Obrigado pela sua colaboração!

Title: Requirements Defects Classification List
Student: Isabel Margarido Number: 090546003
Professor: João Pascoal Faria Subject: Estudo Livre
2010-08-06 60/81
Annex D: Requirements Document
Especificação de Requisitos de um Sistema Nacional de
Voto Electrónico
Versão 1.0, 22 de Maio de 2010
1 Introdução
1.1 Objectivo e destinatários do documento
Este documento descreve os requisitos para um Sistema Nacional de Votação Electrónica (SNVE).
Foi elaborado a pedido e em articulação com os responsáveis da Comissão Nacional de Eleições
(CNE), principais destinatários do documento, pretendo-se que possa também ser parte integrante
de um caderno de encargos a elaborar.
1.2 Âmbito do sistema
O SNVE destina-se a ser utilizado em todos os actos eleitorais sob responsabilidade da CNE.
O seu principal objectivo é reduzir a abstenção através da possibilidade de “voto em mobilidade”,
permitindo que os cidadãos votem em qualquer local de voto. Para garantir a não coercibilidade do
voto e evitar fraudes, pretende-se que o voto continue a ser presencial.
1.3 Contexto e arquitectura geral do sistema
Em cada local de voto, devem Postos de Votação Electrónica (PVE), para os eleitores votarem
electronicamente, e um Posto da Mesa Eleitoral (PME), destinado aos membros da mesa eleitoral,
para identificar os eleitores e assinalar quem já votou. O PME tem acesso remoto a um Caderno
Eleitoral Electrónico (CEE), com os eleitores recenseados (ver fig.1).
No final do acto eleitoral, os resultados eleitorais são agregados e publicados através de um
Sistema de Informação Eleitoral (SIE).
Para os eleitores residentes no estrangeiro, que tradicionalmente votam por correspondência, e
apenas para esses, deve existir a possibilidade de votar pela Internet.

Title: Requirements Defects Classification List
Student: Isabel Margarido Number: 090546003
Professor: João Pascoal Faria Subject: Estudo Livre
2010-08-06 61/81
Figura 1. Arquitectura geral do SNVE.
1.4 Definições, acrónimos e abreviaturas
CEE Caderno Eleitoral Electrónico
PME Posto da Mesa Eleitoral
PVE Posto de Votação Electrónica
SIE Sistema de Informação Eleitoral
SNVE Sistema Nacional de Voto Electrónico
1.5 Referências
[1] http://www.cne.pt/ - sítio Web da Comissão Nacional de Eleições
[2] http://pt.wikipedia.org/wiki/C%C3%ADrculo_eleitoral – dados dos círculos eleitorais
1.6 Estrutura do documento
O capítulo 2 descreve requisitos do sistema. Os anexos apresentam modelos do sistema.
2 Requisitos do sistema
2.1 Requisitos gerais
RG1. O SVE deve ser aplicável nas eleições legislativas, presidenciais, autárquicas e
europeias, bem como nos referendos.
RG2. O SVE deve permitir o “voto em mobilidade”, isto é, deve permitir que um cidadão
vote em qualquer local de voto, e não apenas no local em que está recenseado.
RG3. Para garantir a não coercibilidade do voto, a votação deve ser presencial.
RG4. O sistema deve ter um custo semelhante à da votação tradicional em papel.
RG5. O sistema deve garantir o anonimato do voto.
RG6. O sistema deve garantir a unicidade do voto.
RG7. O sistema deve permitir a recontagem de votos por não especialistas informáticos.
RG8. O sistema deve ser fácil de usar pelo cidadão comum, de forma rápida, sem erros e
sem necessidade de aprendizagem.
Posto de Votação Electrónica (PVE)
Eleitor Mesa Eleitoral
Sede da CNE
Caderno Eleitoral Electrónico (CEE)
Local de Voto
Posto da Mesa Eleitoral (PME)
identificação e autorização
voto
abertura e encerramento
Responsáveis da CNE
monitorização
Sistema de Informação Eleitoral (SIE)
resultados parcelares
resultados finais
configuração
Público, Comunicação
Social, Candidatos

Title: Requirements Defects Classification List
Student: Isabel Margarido Number: 090546003
Professor: João Pascoal Faria Subject: Estudo Livre
2010-08-06 62/81
RG9. O sistema deve ser acessível a pessoas com deficiências visuais.
RG10. O sistema deve ser totalmente confiável, não se admitindo quebras ou erros de funcionamento, perda de dados ou problemas de segurança.
2.2 Requisitos relativos aos Postos de Votação Electrónica
RPVE1. Os eleitores devem realizar o seu voto em postos de votação electrónica (PVE)
existentes nos locais de voto.
RPVE1. Para garantir o anonimato do voto, durante o acto eleitoral, os PVEs não devem
ter qualquer tipo de comunicação com outros sistemas (inclusive com o PME).
RPVE2. Para promover a usabilidade, a interacção dos eleitores com os PVEs deve
realizar-se por intermédio de ecrãs sensíveis ao toque (touchscreen).
RPVE3. Para garantir a unicidade do voto, o eleitor deve receber da mesa eleitoral um
elemento físico (cartão, dispositivo, etc.) que lhe permite efectuar um voto no
PVE.
RPVE4. Para permitir a recontagem de votos por não especialistas informáticas, o PVE
deve imprimir um talão de voto em papel, verificável pelo eleitor.
RPVE5. Os talões de voto devem ser guardados caixa selada que só pode ser aberta
pelos membros da mesa no final do acto eleitoral.
RPVE6. Os talões de voto devem ter a dimensão de 5cm x 5cm.
RPVE7. Os PVE devem dispor de uma operação de abertura, a realizar por um membro
da mesa no início do dia das eleições, de forma segura.
RPVE8. Os PVE devem dispor de uma operação de encerramento, a realizar por um
membro da mesa no final do dia das eleições, de forma segura.
RPVE9. Após o fecho, o PVE deve disponibilizar os resultados da votação para consulta
no ecrã e por um ficheiro assinado digitalmente exportável para dispositivo
amovível.
RPVE10. Os PVE devem poder ser reutilizáveis em múltiplos actos eleitorais, devendo
poder ser carregados de forma segura com as opções de voto antes de cada
acto eleitoral.
2.3 Requisitos relativos ao Posto da Mesa Eleitoral
RPME1. Em cada local de voto existirá um computador destinado aos membros da mesa
eleitoral - Posto da Mesa Eleitoral (PME) - com acesso remoto ao CEE.
RPME2. O PME deve permitir pesquisar o eleitor com base nos elementos de
identificação constantes no cartão de eleitor e bilhete de identidade ou carta de cidadão.
RPME3. Para garantir a unicidade do voto, o sistema deve dar uma mensagem de alerta
no caso do eleitor seleccionado já ter votado, indicando também o local de voto.
RPME4. O PME deve permitir indicar que o eleitor seleccionado vai iniciar o seu voto,
acrescentando-o a uma eleitores que estão a votar. Deve permitir depois indicar
a conclusão de um eleitor da lista.
RPME5. O PVE deve dispor de operações de abertura e encerramento do acto eleitoral.
RPME6. Após o fecho, o PME deve disponibilizar o total de eleitores votantes nesse local.
Title: Requirements Defects Classification List
Student: Isabel Margarido Number: 090546003
Professor: João Pascoal Faria Subject: Estudo Livre
2010-08-06 63/81
2.4 Requisitos relativos ao Caderno Eleitoral Electrónico
RCEE1. O Caderno Eleitoral Electrónico (CEE), com os dados dos eleitores recenseados,
deve residir num servidor localizado na sede da CNE.
RCEE2. Para cada eleitor recenseado no território nacional, o CEE contém o nº de eleitor
(único na freguesia de recenseamento), nome, nº de bilhete de identidade e
data de nascimento.
RCEE3. Para cada eleitor recenseado no estrangeiro, o CEE contém o nº de eleitor (único
na cidade de recenseamento), nome, nº de bilhete de identidade, data de
nascimento e morada completa (para voto por correspondência).
2.5 Requisitos relativos ao Sistema de Informação Eleitoral
RSIE1. O Sistema de Informação Eleitoral (SIE), com dados gerais dos actos eleitorais,
deve residir num servidor Windows Server 2008 localizado na sede da CNE.
RSIE2. Antes das eleições, o SIE deve permitir registar as listas ou opções de voto
existentes, organizadas por círculos eleitorais.
RSIE3. No caso das eleições legislativas, existem 12 círculos eleitorais: um por cada
distrito do continente, um por cada região autónoma, um para os cidadãos
residentes na Europa e um outro para os que residem fora da Europa.
RSIE4. No caso de referendos e eleições presidenciais, há um único círculo eleitoral.
RSIE5. No caso das eleições autárquicas, cada concelho representa um círculo eleitoral
para a eleição da Câmara Municipal e Assembleia Municipal; cada freguesia
representa um círculo eleitoral para a eleição da Assembleia de Freguesia.
RSIE6. O SIE recebe os resultados das mesas de voto (número de votos em cada lista
ou opção) e apura os resultados finais.

Title: Requirements Defects Classification List
Student: Isabel Margarido Number: 090546003
Professor: João Pascoal Faria Subject: Estudo Livre
2010-08-06 64/81
Apêndice A. Modelos de processos e de dados
Membro da MesaEleitor
Dirige-se à mesa e apresenta cartão de eleitor e BI
Procura eleitor no caderno eleitoral electrónico
Comunica impedimento
[não encontra ou já votou]
Entrega cartão magnético para votar
[encontra e ainda não votou]
Dirige-se a um posto de votação electrónica livre
Vota no posto de votação electrónica
Dirige-se à mesa e devolve o cartão magnético
Devolve cartão de eleitor e BI ao eleitor
Assinala no caderno eleitoral electrónico que eleitor já votou
Assinala no caderno eleitoral electrónico que eleitor vai votar
Verifica identidade
Figura 2. Processo de votação electrónica (diagrama de actividades UML).

Title: Requirements Defects Classification List
Student: Isabel Margarido Number: 090546003
Professor: João Pascoal Faria Subject: Estudo Livre
2010-08-06 65/81
código de distrito
nome
Distrito
código de concelho
nome
Concelho
código de frequesia
nome
Freguesia 1* 1*
número de eleitor
número de bilhete de identidade
nome
data de nascimento
Eleitor
1
*
país
cidade
ConsuladoLocal de Recenseamento
Figura 3. Modelo de dados do CEE (diagrama de classes UML).
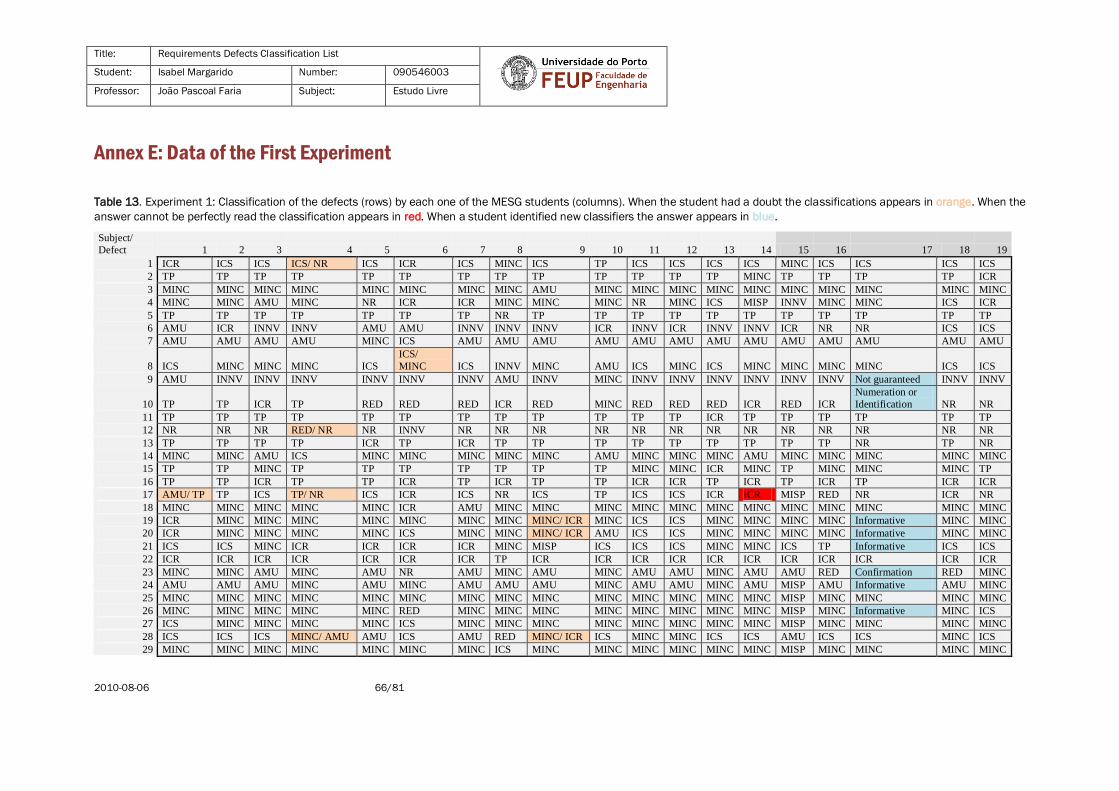
Title: Requirements Defects Classification List
Student: Isabel Margarido Number: 090546003
Professor: João Pascoal Faria Subject: Estudo Livre
2010-08-06 66/81
Annex E: Data of the First Experiment
Table 13. Experiment 1: Classification of the defects (rows) by each one of the MESG students (columns). When the student had a doubt the classifications appears in orange. When the
answer cannot be perfectly read the classification appears in red. When a student identified new classifiers the answer appears in blue.
Subject/
Defect 1 2 3 4 5 6 7 8 9 10 11 12 13 14 15 16 17 18 19
1 ICR ICS ICS ICS/ NR ICS ICR ICS MINC ICS TP ICS ICS ICS ICS MINC ICS ICS ICS ICS
2 TP TP TP TP TP TP TP TP TP TP TP TP TP MINC TP TP TP TP ICR
3 MINC MINC MINC MINC MINC MINC MINC MINC AMU MINC MINC MINC MINC MINC MINC MINC MINC MINC MINC
4 MINC MINC AMU MINC NR ICR ICR MINC MINC MINC NR MINC ICS MISP INNV MINC MINC ICS ICR
5 TP TP TP TP TP TP TP NR TP TP TP TP TP TP TP TP TP TP TP
6 AMU ICR INNV INNV AMU AMU INNV INNV INNV ICR INNV ICR INNV INNV ICR NR NR ICS ICS
7 AMU AMU AMU AMU MINC ICS AMU AMU AMU AMU AMU AMU AMU AMU AMU AMU AMU AMU AMU
8 ICS MINC MINC MINC ICS
ICS/
MINC ICS INNV MINC AMU ICS MINC ICS MINC MINC MINC MINC ICS ICS
9 AMU INNV INNV INNV INNV INNV INNV AMU INNV MINC INNV INNV INNV INNV INNV INNV Not guaranteed INNV INNV
10 TP TP ICR TP RED RED RED ICR RED MINC RED RED RED ICR RED ICR
Numeration or
Identification NR NR
11 TP TP TP TP TP TP TP TP TP TP TP TP ICR TP TP TP TP TP TP
12 NR NR NR RED/ NR NR INNV NR NR NR NR NR NR NR NR NR NR NR NR NR
13 TP TP TP TP ICR TP ICR TP TP TP TP TP TP TP TP TP NR TP NR
14 MINC MINC AMU ICS MINC MINC MINC MINC MINC AMU MINC MINC MINC AMU MINC MINC MINC MINC MINC
15 TP TP MINC TP TP TP TP TP TP TP MINC MINC ICR MINC TP MINC MINC MINC TP
16 TP TP ICR TP TP ICR TP ICR TP TP ICR ICR TP ICR TP ICR TP ICR ICR
17 AMU/ TP TP ICS TP/ NR ICS ICR ICS NR ICS TP ICS ICS ICR ICR MISP RED NR ICR NR
18 MINC MINC MINC MINC MINC ICR AMU MINC MINC MINC MINC MINC MINC MINC MINC MINC MINC MINC MINC
19 ICR MINC MINC MINC MINC MINC MINC MINC MINC/ ICR MINC ICS ICS MINC MINC MINC MINC Informative MINC MINC
20 ICR MINC MINC MINC MINC ICS MINC MINC MINC/ ICR AMU ICS ICS MINC MINC MINC MINC Informative MINC MINC
21 ICS ICS MINC ICR ICR ICR ICR MINC MISP ICS ICS ICS MINC MINC ICS TP Informative ICS ICS
22 ICR ICR ICR ICR ICR ICR ICR TP ICR ICR ICR ICR ICR ICR ICR ICR ICR ICR ICR
23 MINC MINC AMU MINC AMU NR AMU MINC AMU MINC AMU AMU MINC AMU AMU RED Confirmation RED MINC
24 AMU AMU AMU MINC AMU MINC AMU AMU AMU MINC AMU AMU MINC AMU MISP AMU Informative AMU MINC
25 MINC MINC MINC MINC MINC MINC MINC MINC MINC MINC MINC MINC MINC MINC MISP MINC MINC MINC MINC
26 MINC MINC MINC MINC MINC RED MINC MINC MINC MINC MINC MINC MINC MINC MISP MINC Informative MINC ICS
27 ICS MINC MINC MINC MINC ICS MINC MINC MINC MINC MINC MINC MINC MINC MISP MINC MINC MINC MINC
28 ICS ICS ICS MINC/ AMU AMU ICS AMU RED MINC/ ICR ICS MINC MINC ICS ICS AMU ICS ICS MINC ICS
29 MINC MINC MINC MINC MINC MINC MINC ICS MINC MINC MINC MINC MINC MINC MISP MINC MINC MINC MINC

Title: Requirements Defects Classification List
Student: Isabel Margarido Number: 090546003
Professor: João Pascoal Faria Subject: Estudo Livre
2010-08-06 67/81
Table 13 presents the attribute values that the students that participated in the first experiment gave to classify each one of the 29 defects of the SRS document. To
decode the acronyms used please refer to subchapter 1.4 Acronyms. We signalled the subjects 15 to 19 in dark grey because we noticed they were talking about the
exercise during the experiment. Although when we analyse their data we cannot detect which information was shared.
Table 14. Experiment 1: Frequencies of usage of the classifiers of the first experiment.
Classifier
Defect Expected
Missing or
Incomplete Incorrect Inconsistent
Ambiguous or
Unclear Misplaced
Infeasible or
Non-verifiable
Redundant or
Duplicate Typo Not relevant Doubt New
1 Inconsistent 2 10.53% 2 10.53% 13 68.42% 0 0.00% 0 0.00% 0 0.00% 0 0.00% 1 5.26% 0 0.00% 1
2 Typo 1 5.26% 1 5.26% 0 0.00% 0 0.00% 0 0.00% 0 0.00% 0 0.00% 17 89.47% 0 0.00%
3
Missing or
Incomplete 18 94.74% 0 0.00% 0 0.00% 1 5.26% 0 0.00% 0 0.00% 0 0.00% 0 0.00% 0 0.00%
4
Missing or
Incomplete 9 47.37% 3 15.79% 2 10.53% 1 5.26% 1 5.26% 1 5.26% 0 0.00% 0 0.00% 2 10.53%
5 Typo 0 0.00% 0 0.00% 0 0.00% 0 0.00% 0 0.00% 0 0.00% 0 0.00% 18 94.74% 1 5.26%
6
Infeasible or
Non-
verifiable 0 0.00% 4 21.05% 2 10.53% 3 15.79% 0 0.00% 8 42.11% 0 0.00% 0 0.00% 2 10.53%
7
Ambiguous
or Unclear 1 5.26% 0 0.00% 1 5.26% 17 89.47% 0 0.00% 0 0.00% 0 0.00% 0 0.00% 0 0.00%
8
Missing or
Incomplete 9 47.37% 0 0.00% 7 36.84% 1 5.26% 0 0.00% 1 5.26% 0 0.00% 0 0.00% 0 0.00% 1
9
Infeasible or
Non-
verifiable 1 5.26% 0 0.00% 0 0.00% 2 10.53% 0 0.00% 15 78.95% 0 0.00% 0 0.00% 0 0.00% 1
10 Typo 1 5.26% 4 21.05% 0 0.00% 0 0.00% 0 0.00% 0 0.00% 8 42.11% 3 15.79% 2 10.53% 1
11 Typo 0 0.00% 1 5.26% 0 0.00% 0 0.00% 0 0.00% 0 0.00% 0 0.00% 18 94.74% 0 0.00%
12 Not relevant 0 0.00% 0 0.00% 0 0.00% 0 0.00% 0 0.00% 1 5.26% 0 0.00% 0 0.00% 17 89.47% 1
13 Incorrect 0 0.00% 2 10.53% 0 0.00% 0 0.00% 0 0.00% 0 0.00% 0 0.00% 15 78.95% 2 10.53%
14
Missing or
Incomplete 15 78.95% 0 0.00% 1 5.26% 3 15.79% 0 0.00% 0 0.00% 0 0.00% 0 0.00% 0 0.00%
15 Typo 7 36.84% 1 5.26% 0 0.00% 0 0.00% 0 0.00% 0 0.00% 0 0.00% 11 57.89% 0 0.00%
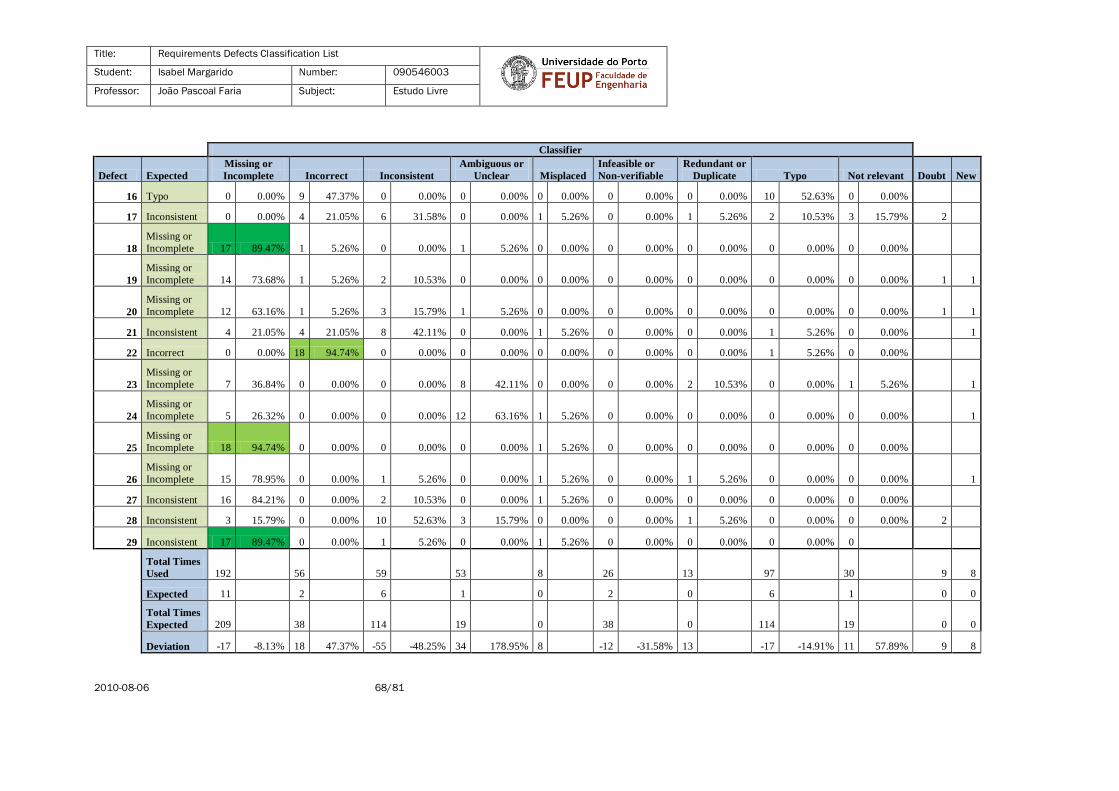
Title: Requirements Defects Classification List
Student: Isabel Margarido Number: 090546003
Professor: João Pascoal Faria Subject: Estudo Livre
2010-08-06 68/81
Classifier
Defect Expected
Missing or
Incomplete Incorrect Inconsistent
Ambiguous or
Unclear Misplaced
Infeasible or
Non-verifiable
Redundant or
Duplicate Typo Not relevant Doubt New
16 Typo 0 0.00% 9 47.37% 0 0.00% 0 0.00% 0 0.00% 0 0.00% 0 0.00% 10 52.63% 0 0.00%
17 Inconsistent 0 0.00% 4 21.05% 6 31.58% 0 0.00% 1 5.26% 0 0.00% 1 5.26% 2 10.53% 3 15.79% 2
18
Missing or
Incomplete 17 89.47% 1 5.26% 0 0.00% 1 5.26% 0 0.00% 0 0.00% 0 0.00% 0 0.00% 0 0.00%
19
Missing or
Incomplete 14 73.68% 1 5.26% 2 10.53% 0 0.00% 0 0.00% 0 0.00% 0 0.00% 0 0.00% 0 0.00% 1 1
20
Missing or
Incomplete 12 63.16% 1 5.26% 3 15.79% 1 5.26% 0 0.00% 0 0.00% 0 0.00% 0 0.00% 0 0.00% 1 1
21 Inconsistent 4 21.05% 4 21.05% 8 42.11% 0 0.00% 1 5.26% 0 0.00% 0 0.00% 1 5.26% 0 0.00% 1
22 Incorrect 0 0.00% 18 94.74% 0 0.00% 0 0.00% 0 0.00% 0 0.00% 0 0.00% 1 5.26% 0 0.00%
23
Missing or
Incomplete 7 36.84% 0 0.00% 0 0.00% 8 42.11% 0 0.00% 0 0.00% 2 10.53% 0 0.00% 1 5.26% 1
24
Missing or
Incomplete 5 26.32% 0 0.00% 0 0.00% 12 63.16% 1 5.26% 0 0.00% 0 0.00% 0 0.00% 0 0.00% 1
25
Missing or
Incomplete 18 94.74% 0 0.00% 0 0.00% 0 0.00% 1 5.26% 0 0.00% 0 0.00% 0 0.00% 0 0.00%
26
Missing or
Incomplete 15 78.95% 0 0.00% 1 5.26% 0 0.00% 1 5.26% 0 0.00% 1 5.26% 0 0.00% 0 0.00% 1
27 Inconsistent 16 84.21% 0 0.00% 2 10.53% 0 0.00% 1 5.26% 0 0.00% 0 0.00% 0 0.00% 0 0.00%
28 Inconsistent 3 15.79% 0 0.00% 10 52.63% 3 15.79% 0 0.00% 0 0.00% 1 5.26% 0 0.00% 0 0.00% 2
29 Inconsistent 17 89.47% 0 0.00% 1 5.26% 0 0.00% 1 5.26% 0 0.00% 0 0.00% 0 0.00% 0
Total Times
Used 192 56 59 53 8 26 13 97 30 9 8
Expected 11 2 6 1 0 2 0 6 1 0 0
Total Times
Expected 209 38 114 19 0 38 0 114 19 0 0
Deviation -17 -8.13% 18 47.37% -55 -48.25% 34 178.95% 8 -12 -31.58% 13 -17 -14.91% 11 57.89% 9 8

Title: Requirements Defects Classification List
Student: Isabel Margarido Number: 090546003
Professor: João Pascoal Faria Subject: Estudo Livre
2010-08-06 69/81
Table 14 presents the number and percentage of times that a classifier is used per each one of the
29 defects. The column expected presents the classifier that we considered most appropriate to
classify each defect. We present a summary area, where we indicate:
The total number of times that a classifier was used;
The number of times it would be used if the person used the classifier that we expected;
The number of times that the classifier would be used, if the 19 students used the expected
classifier;
The deviation from the expected frequency of usage (when negative it indicates that the students
used the classifier fewer times than they were expected).
Fig. 20. Experiment 1: Bars chart representing the frequency in number of times and percentage that a
classifier is used per defect.
0% 20%
40% 60%
80% 100%
1
3
5
7
9
11
13
15
17
19
21
23
25
27
29
13
0 0
2 0
2 1 7
0 0 0 0 0
1 0 0 6
0 2
3 8
0 0 0 0
1 2
10
1
2
1 18
9
0 0 1
9
1 1
0 0 0
15
7
0 0 17 14 12
4
0 7 5 18
15 16
3 17
2
1
0
3
0 4 0
0
0 4
1 0
2
0
1
9 4 1 1
1 4
18 0
0 0
0 0
0 0
1
17 0
0
18
0
0
0
0 3 18
0 15 0
11 10
2 0 0
0 1
1
0 0
0 0
0
0 0
0 0
1
1 0
3 17 1
2 0 0
0
0 3
0 0
0 1 0
1 0
0
8 12 0
0 0
3 0
0 0 0
1 0
0 0
0
0 0 0
0
0 0 0 0
1 0 0 0
1 0
0 1 1
1 1
0 1
0 0 0
2 1
2 0
0
0 2 0
17 2
0 0 0
3 0 0 0
0 0
1 0 0
0 0
0 0
0 0 0
1 0
8 0 1
15 0
0 1
0 0 0 0
0 0 0 0
0 0
0 0 0
0 0
0 0
0 0 0 0 0 0 0
0 0
8 0 0
0 0 0 0
1 0
0 0
0 0
2 0 0
1 0
1 0
1
1
1
2
1 1
2
Inconsistent Missing or Incomplete Incorrect
Typo Ambiguous or Unclear Misplaced
Not relevant Infeasible or Non-verifiable Redundant or Duplicate
Doubt

Title: Requirements Defects Classification List
Student: Isabel Margarido Number: 090546003
Professor: João Pascoal Faria Subject: Estudo Livre
2010-08-06 70/81
Fig. 20 is another representation of the results. It gives the number of times that each classifier was used to classify each defect (y axis), and the percentage that it
was used (x axis). For example, 13 students classified the first defect as Inconsistent which represents about 70% of the students’ answers. We also compared the
students’ answers with the classifiers that we were expecting (Table 15). For 62% of the defects more than 50% of the students classified the defects as we expected.
Table 15. Experiment 1: Frequencies of the students’ classification matching our classification for the same defects. Subjects are presented in the columns and defects in the rows. If
the student’s classification matches ours the cell presents the word ‘yes’ otherwise it presents the text ‘no’.
1 2 3 4 5 6 7 8 9 10 11 12 13 14 15 16 17 18 19 Same
1 no yes yes no yes no yes no yes no yes yes yes yes no yes yes yes yes 13 68.42%
2 yes yes yes yes yes yes yes yes yes yes yes yes yes no yes yes yes yes no 17 89.47%
3 yes yes yes yes yes yes yes yes no yes yes yes yes yes yes yes yes yes yes 18 94.74%
4 yes yes no yes no no no yes yes yes no yes no no no yes yes no no 9 47.37%
5 yes yes yes yes yes yes yes no yes yes yes yes yes yes yes yes yes yes yes 18 94.74%
6 no no yes yes no no yes yes yes no yes no yes yes no no no no no 8 42.11%
7 yes yes yes yes no no yes yes yes yes yes yes yes yes yes yes yes yes yes 17 89.47%
8 no yes yes yes no no no no yes no no yes no yes yes yes yes no no 9 47.37%
9 no yes yes yes yes yes yes no yes no yes yes yes yes yes yes no yes yes 15 78.95%
10 yes yes no yes no no no no no no no no no no no no no no no 3 15.79%
11 yes yes yes yes yes yes yes yes yes yes yes yes no yes yes yes yes yes yes 18 94.74%
12 yes yes yes no yes no yes yes yes yes yes yes yes yes yes yes yes yes yes 17 89.47%
13 no no no no yes no yes no no no no no no no no no no no no 2 10.53%
14 yes yes no no yes yes yes yes yes no yes yes yes no yes yes yes yes yes 15 78.95%
15 yes yes no yes yes yes yes yes yes yes no no no no yes no no no yes 11 57.89%
16 yes yes no yes yes no yes no yes yes no no yes no yes no yes no no 10 52.63%
17 no no yes no yes no yes no yes no yes yes no no no no no no no 6 31.58%
18 yes yes yes yes yes no no yes yes yes yes yes yes yes yes yes yes yes yes 17 89.47%
19 no yes yes yes yes yes yes yes no yes no no yes yes yes yes no yes yes 14 73.68%
20 no yes yes yes yes no yes yes no no no no yes yes yes yes no yes yes 12 63.16%
21 yes yes no no no no no no no yes yes yes no no yes no no yes yes 8 42.11%
22 yes yes yes yes yes yes yes no yes yes yes yes yes yes yes yes yes yes yes 18 94.74%
23 yes yes no yes no no no yes no yes no no yes no no no no no yes 7 36.84%
24 no no no yes no yes no no no yes no no yes no no no no no yes 5 26.32%
25 yes yes yes yes yes yes yes yes yes yes yes yes yes yes no yes yes yes yes 18 94.74%
26 yes yes yes yes yes no yes yes yes yes yes yes yes yes no yes no yes no 15 78.95%
27 yes no no no no yes no no no no no no no no no no no no no 2 10.53%
28 yes yes yes no no yes no no no yes no no yes yes no yes yes no yes 10 52.63%
29 no no no no no no no yes no no no no no no no no no no no 1 5.26%
Same 19 23 18 20 18 13 19 16 18 18 16 17 19 16 16 18 15 16 18
65.52% 79.31% 62.07% 68.97% 62.07% 44.83% 65.52% 55.17% 62.07% 62.07% 55.17% 58.62% 65.52% 55.17% 55.17% 62.07% 51.72% 55.17% 62.07%

Title: Requirements Defects Classification List
Student: Isabel Margarido Number: 090546003
Professor: João Pascoal Faria Subject: Estudo Livre
2010-08-06 71/81
We observed that there were four defects that very few students classified the same way as we did (10,13, 27 and 29). The corresponding rows are signalled in Table
15 with bright grey. For that reason we repeated the analysis without those defects. The results are presented in Table 16. We observed an improvement in the overall
individual results of the students. The percentage of defects classified by the students as we expected augmented to 72%.
Table 16. Experiment 1: Frequencies of the students’ classification matching our classification of the same defects, after removing the ones that had no more than 20% of matches with
the expected classification.
1 2 3 4 5 6 7 8 9 10 11 12 13 14 15 16 17 18 19 Same
1 no yes yes no yes no yes no yes no yes yes yes yes no yes yes yes yes 13 68.42%
2 yes yes yes yes yes yes yes yes yes yes yes yes yes no yes yes yes yes no 17 89.47%
3 yes yes yes yes yes yes yes yes no yes yes yes yes yes yes yes yes yes yes 18 94.74%
4 yes yes no yes no no no yes yes yes no yes no no no yes yes no no 9 47.37%
5 yes yes yes yes yes yes yes no yes yes yes yes yes yes yes yes yes yes yes 18 94.74%
6 no no yes yes no no yes yes yes no yes no yes yes no no no no no 8 42.11%
7 yes yes yes yes no no yes yes yes yes yes yes yes yes yes yes yes yes yes 17 89.47%
8 no yes yes yes no no no no yes no no yes no yes yes yes yes no no 9 47.37%
9 no yes yes yes yes yes yes no yes no yes yes yes yes yes yes no yes yes 15 78.95%
11 yes yes yes yes yes yes yes yes yes yes yes yes no yes yes yes yes yes yes 18 94.74%
12 yes yes yes no yes no yes yes yes yes yes yes yes yes yes yes yes yes yes 17 89.47%
14 yes yes no no yes yes yes yes yes no yes yes yes no yes yes yes yes yes 15 78.95%
15 yes yes no yes yes yes yes yes yes yes no no no no yes no no no yes 11 57.89%
16 yes yes no yes yes no yes no yes yes no no yes no yes no yes no no 10 52.63%
17 no no yes no yes no yes no yes no yes yes no no no no no no no 6 31.58%
18 yes yes yes yes yes no no yes yes yes yes yes yes yes yes yes yes yes yes 17 89.47%
19 no yes yes yes yes yes yes yes no yes no no yes yes yes yes no yes yes 14 73.68%
20 no yes yes yes yes no yes yes no no no no yes yes yes yes no yes yes 12 63.16%
21 yes yes no no no no no no no yes yes yes no no yes no no yes yes 8 42.11%
22 yes yes yes yes yes yes yes no yes yes yes yes yes yes yes yes yes yes yes 18 94.74%
23 yes yes no yes no no no yes no yes no no yes no no no no no yes 7 36.84%
24 no no no yes no yes no no no yes no no yes no no no no no yes 5 26.32%
25 yes yes yes yes yes yes yes yes yes yes yes yes yes yes no yes yes yes yes 18 94.74%
26 yes yes yes yes yes no yes yes yes yes yes yes yes yes no yes no yes no 15 78.95%
28 yes yes yes no no yes no no no yes no no yes yes no yes yes no yes 10 52.63%
Same 17 22 18 19 17 12 18 15 18 18 16 17 19 16 16 18 15 16 18
68.00% 88.00% 72.00% 76.00% 68.00% 48.00% 72.00% 60.00% 72.00% 72.00% 64.00% 68.00% 76.00% 64.00% 64.00% 72.00% 60.00% 64.00% 72.00%
Better Better Better Better Better Better Better Better Better Better Better Better Better Better Better Better Better Better Better

Title: Requirements Defects Classification List
Student: Isabel Margarido Number: 090546003
Professor: João Pascoal Faria Subject: Estudo Livre
2010-08-06 72/81
Aware that the proximity to our classification is not an indicator of the correctness of the answer, we
realised that it would be important to analyse if there were groups of classifiers that were more used
in the classification of the same defect. For that purpose we created a table of classifiers used per
each defect and analysed the frequency of usage of each classifier. Those tables were grouped by
the most used classifier (tables 17 to 22). We did not consider the previously mentioned four defects
(10, 13, 27 and 29).
Table 17. Experiment 1: Classifiers also used when the classifier Typo was the mostly used. Each table indicates
the defect where Typo was the most used one, and presents the frequency of usage of each one of the other
classifiers. The last table compiles the data of the other ones.
2
5
11
Classifier # %
Classifier # %
Classifier # %
TP 17 89%
TP 18 95%
TP 18 95%
MINC 1 5%
NR 1 5%
ICR 1 5%
ICR 1 5%
MINC 0 0%
MINC 0 0%
ICS 0 0%
ICR 0 0%
ICS 0 0%
AMU 0 0%
ICS 0 0%
AMU 0 0%
MISP 0 0%
AMU 0 0%
MISP 0 0%
INNV 0 0%
MISP 0 0%
INNV 0 0%
RED 0 0%
INNV 0 0%
RED 0 0%
NR 0 0%
RED 0 0%
NR 0 0%
15
16
Classifier # %
Classifier # %
Classifier # %
TP 89 78%
TP 11 58%
TP 10 53%
ICR 14 12%
MINC 7 37%
ICR 9 47%
MINC 8 7%
ICR 1 5%
MINC 0 0%
NR 3 3%
ICS 0 0%
ICS 0 0%
Total 114
AMU 0 0%
AMU 0 0%
MISP 0 0%
MISP 0 0%
INNV 0 0%
INNV 0 0%
RED 0 0%
RED 0 0%
NR 0 0%
NR 0 0%
Table 18. Experiment 1: Classifiers also used when the classifier Inconsistent was the mostly used.
1
17
21
28
Classifier # %
Classifier # %
Classifier # %
Classifier # %
Classifier # %
ICS 37 53%
ICS 13 68%
ICS 6 32%
ICS 8 42%
ICS 10 53%
ICR 10 14%
MINC 2 11%
ICR 4 21%
MINC 4 21%
MINC 3 16%
MINC 9 13%
ICR 2 11%
NR 3 16%
ICR 4 21%
AMU 3 16%
TP 4 6%
TP 1 5%
TP 2 11%
MISP 1 5%
RED 1 5%
AMU 3 4%
AMU 0 0%
MISP 1 5%
TP 1 5%
ICR 0 0%
NR 3 4%
MISP 0 0%
RED 1 5%
AMU 0 0%
MISP 0 0%
RED 2 3%
INNV 0 0%
MINC 0 0%
INNV 0 0%
INNV 0 0%
MISP 2 3%
RED 0 0%
AMU 0 0%
RED 0 0%
TP 0 0%
Total 70
NR 0 0%
INNV 0 0%
NR 0 0%
NR 0 0%
Table 19. Experiment 1: Classifiers also used when the classifier Missing or Incomplete was the mostly used.
3
4
8
14
18
Classifier # %
Classifier # %
Classifier # %
Classifier # %
Classifier # %
MINC 18 95%
MINC 9 47%
MINC 9 47%
MINC 15 79%
MINC 17 89%
AMU 1 5%
ICR 3 16%
ICS 7 37%
AMU 3 16%
ICR 1 5%
ICR 0 0%
ICS 2 11%
AMU 1 5%
ICS 1 5%
AMU 1 5%
ICS 0 0%
NR 2 11%
INNV 1 5%
ICR 0 0%
ICS 0 0%
MISP 0 0%
AMU 1 5%
ICR 0 0%
MISP 0 0%
MISP 0 0%
INNV 0 0%
MISP 1 5%
MISP 0 0%
INNV 0 0%
TP 0 0%
RED 0 0%
INNV 1 5%
RED 0 0%
RED 0 0%
INNV 0 0%
TP 0 0%
RED 0 0%
TP 0 0%
TP 0 0%
RED 0 0%
NR 0 0%
TP 0 0%
NR 0 0%
NR 0 0%
NR 0 0%

Title: Requirements Defects Classification List
Student: Isabel Margarido Number: 090546003
Professor: João Pascoal Faria Subject: Estudo Livre
2010-08-06 73/81
19
20
25
26
Classifier # %
Classifier # %
Classifier # %
Classifier # %
Classifier # %
MINC 127 77%
MINC 14 74%
MINC 12 63%
MINC 18 95%
MINC 15 79%
ICS 16 10%
ICS 2 11%
ICS 3 16%
MISP 1 5%
ICS 1 5%
AMU 8 5%
ICR 1 5%
ICR 1 5%
ICR 0 0%
MISP 1 5%
ICR 6 4%
AMU 0 0%
AMU 1 5%
ICS 0 0%
RED 1 5%
MISP 3 2%
MISP 0 0%
MISP 0 0%
AMU 0 0%
ICR 0 0%
INNV 2 1%
INNV 0 0%
INNV 0 0%
INNV 0 0%
AMU 0 0%
NR 2 1%
RED 0 0%
RED 0 0%
RED 0 0%
INNV 0 0%
RED 1 1%
TP 0 0%
TP 0 0%
TP 0 0%
TP 0 0%
Total 165
NR 0 0%
NR 0 0%
NR 0 0%
NR 0 0%
Table 20. Experiment 1: Classifiers also used when the classifier Ambiguous or Unclear was the mostly used.
7
23
24
Classifier # %
Classifier # %
Classifier # %
Classifier # %
AMU 37 67%
AMU 17 89%
AMU 8 42%
AMU 12 63%
MINC 13 24%
MINC 1 5%
MINC 7 37%
MINC 5 26%
RED 2 4%
ICS 1 5%
RED 2 11%
MISP 1 5%
MISP 1 2%
ICR 0 0%
NR 1 5%
ICR 0 0%
ICS 1 2%
MISP 0 0%
ICR 0 0%
ICS 0 0%
NR 1 2%
INNV 0 0%
ICS 0 0%
INNV 0 0%
Total 55
RED 0 0%
MISP 0 0%
RED 0 0%
TP 0 0%
INNV 0 0%
TP 0 0%
NR 0 0%
TP 0 0%
NR 0 0%
Table 21. Experiment 1: Classifiers also used when the classifier Infeasible or Non-verifiable was the mostly
used.
6
9
Classifier # %
Classifier # %
Classifier # %
INNV 23 62%
INNV 8 42%
INNV 15 79%
AMU 5 14%
ICR 4 21%
AMU 2 11%
ICR 4 11%
AMU 3 16%
MINC 1 5%
ICS 2 5%
ICS 2 11%
ICR 0 0%
NR 2 5%
NR 2 11%
ICS 0 0%
MINC 1 3%
MINC 0 0%
MISP 0 0%
Total 37
MISP 0 0%
RED 0 0%
RED 0 0%
TP 0 0%
TP 0 0%
NR 0 0%
Table 22. Experiment 1: Classifiers also used when the classifier Not relevant or Incorrect were the mostly used.
Each classifier was the most used in one particular defect; therefore we present the two tables together and do
not need a summary table for each one. Not relevant was the most frequently used classifier in the defect 12,
while Incorrect was the most used classifier in the defect 22.
12
22
Classifier # %
Classifier # %
NR 17 89%
ICR 18 95%
INNV 1 5%
TP 1 5%
MINC 0 0%
MINC 0 0%
ICR 0 0%
ICS 0 0%
ICS 0 0%
AMU 0 0%
AMU 0 0%
MISP 0 0%
MISP 0 0%
INNV 0 0%
RED 0 0%
RED 0 0%
TP 0 0%
NR 0 0%
Total 18
Total 19

Title: Requirements Defects Classification List
Student: Isabel Margarido Number: 090546003
Professor: João Pascoal Faria Subject: Estudo Livre
2010-08-06 74/81
Annex F: Data of the Second Experiment
Table 23. Experiment 2: Classification of the defects (rows) by each one of the LCINF students (columns). When
the student had a doubt the classifications appears in orange. When a student identified new classifiers the
answer appears in blue. When the student did not provide a classifier, indicated a doubt or a new classifier the
field appears in dark grey.
Subject/
Defect 1 2 3 4 5 6
1 ICS ICS ICS AMU ICS TP - other
2 TP TP ICS TP TP
3 MINC MINC MINC ICR MINC MINC
4 MINC ICR MINC MINC NR
5 TP TP ICR TP TP
6 INNV AMU INNV ICR ICS
7 AMU AMU AMU AMU AMU
8 MINC INNV MINC MINC AMU
9 INNV INNV INNV INNV INNV
10 TP RED RED RED RED
11 TP TP TP TP TP
12 NR MISP NR ICS NR
13 TP ICR ICR TP TP - other
14 MINC MINC MINC MINC AMU
15 TP MINC MINC MINC TP
16 ICR ICR ICR TP TP
17 TP NR ICR
Inconsistency
of terms ICS
18 MINC ICS MINC MINC MISP
19 MINC RED MINC RED ICS
20 MINC RED MINC RED ICS
21 ICS ICS ICR ICR ICR
22 ICR ICR ICR ICR ICR
23 MINC MINC AMU MINC
24 MINC AMU AMU AMU AMU
25 MINC MINC MINC MINC MINC
26 MINC ICS MINC MINC MINC
27 MINC MINC MINC MINC MINC
28 MINC ICS MINC MINC AMU
29 MINC MINC MINC MINC MINC
Table 23 presents the attribute values that the students that participated in the second experiment
gave to classify each one of the 29 defects of the SRS document. We maintained the previously used
acronyms even if some classifiers had bigger names.
Table 24 presents the number and percentage of times that a classifier is used per each one of the
29 defects. The column expected presents the classifier that we considered most appropriate for
each one of the defects. We present a summary area, where we indicate: the total number of times
that a classifier was used; the number of times it would be used, if the person used the classifiers
we expected; the number of times that the classifier would be used, if the 6 students used the
expected classifier; the deviation from the expected usage (when negative it indicates that the
students used the classifier fewer times than they were expected).

Title: Requirements Defects Classification List
Student: Isabel Margarido Number: 090546003
Professor: João Pascoal Faria Subject: Estudo Livre
2010-08-06 75/81
Table 24. Experiment 2: Frequencies of usage of the classifiers of the second experiment.
Classifier
Defect Expected
Missing or
Incomplete Incorrect Inconsistent
Ambiguous or
Unclear Misplaced
Infeasible or
Non-verifiable
Redundant or
Duplicate Typo Not relevant Doubt New Unanswered
1 Inconsistent 0 0.00% 0 0.00% 4 66.67% 1 16.67% 0 0.00% 0 0.00% 0 0.00% 0 0.00% 0 0.00% 1
2 Typo 0 0.00% 0 0.00% 1 16.67% 0 0.00% 0 0.00% 0 0.00% 0 0.00% 4 66.67% 0 0.00% 1
3
Missing or
Incomplete 5 83.33% 1 16.67% 0 0.00% 0 0.00% 0 0.00% 0 0.00% 0 0.00% 0 0.00% 0 0.00%
4
Missing or
Incomplete 3 50.00% 1 16.67% 0 0.00% 0 0.00% 0 0.00% 0 0.00% 0 0.00% 0 0.00% 1 16.67% 1
5 Typo 0 0.00% 1 16.67% 0 0.00% 0 0.00% 0 0.00% 0 0.00% 0 0.00% 4 66.67% 0 0.00% 1
6
Infeasible or
Non-verifiable 0 0.00% 1 16.67% 1 16.67% 1 16.67% 0 0.00% 2 33.33% 0 0.00% 0 0.00% 0 0.00% 1
7
Ambiguous or
Unclear 0 0.00% 0 0.00% 0 0.00% 5 83.33% 0 0.00% 0 0.00% 0 0.00% 0 0.00% 0 0.00% 1
8
Missing or
Incomplete 3 50.00% 0 0.00% 0 0.00% 1 16.67% 0 0.00% 1 16.67% 0 0.00% 0 0.00% 0 0.00% 1
9
Infeasible or
Non-verifiable 0 0.00% 0 0.00% 0 0.00% 0 0.00% 0 0.00% 5 83.33% 0 0.00% 0 0.00% 0 0.00% 1
10 Typo 0 0.00% 0 0.00% 0 0.00% 0 0.00% 0 0.00% 0 0.00% 4 66.67% 1 16.67% 0 0.00% 1
11 Typo 0 0.00% 0 0.00% 0 0.00% 0 0.00% 0 0.00% 0 0.00% 0 0.00% 5 83.33% 0 0.00% 1
12 Not relevant 0 0.00% 0 0.00% 1 16.67% 0 0.00% 1 16.67% 0 0.00% 0 0.00% 0 0.00% 3 50.00% 1
13 Incorrect 0 0.00% 2 33.33% 0 0.00% 0 0.00% 0 0.00% 0 0.00% 0 0.00% 2 33.33% 0 0.00% 1 1
14
Missing or
Incomplete 4 66.67% 0 0.00% 0 0.00% 1 16.67% 0 0.00% 0 0.00% 0 0.00% 0 0.00% 0 0.00% 1
15 Typo 3 50.00% 0 0.00% 0 0.00% 0 0.00% 0 0.00% 0 0.00% 0 0.00% 2 33.33% 0 0.00% 1
16 Typo 0 0.00% 3 50.00% 0 0.00% 0 0.00% 0 0.00% 0 0.00% 0 0.00% 2 33.33% 0 0.00% 1
17 Inconsistent 0 0.00% 1 16.67% 1 16.67% 0 0.00% 0 0.00% 0 0.00% 0 0.00% 1 16.67% 1 16.67% 1
18
Missing or
Incomplete 3 50.00% 0 0.00% 1 16.67% 0 0.00% 1 16.67% 0 0.00% 0 0.00% 0 0.00% 0 0.00% 1
19
Missing or
Incomplete 2 33.33% 0 0.00% 1 16.67% 0 0.00% 0 0.00% 0 0.00% 2 33.33% 0 0.00% 0 0.00% 1
20
Missing or
Incomplete 2 33.33% 0 0.00% 1 16.67% 0 0.00% 0 0.00% 0 0.00% 2 33.33% 0 0.00% 0 0.00% 1
21 Inconsistent 0 0.00% 3 50.00% 2 33.33% 0 0.00% 0 0.00% 0 0.00% 0 0.00% 0 0.00% 0 0.00% 1
22 Incorrect 0 0.00% 5 83.33% 0 0.00% 0 0.00% 0 0.00% 0 0.00% 0 0.00% 0 0.00% 0 0.00% 1
23
Missing or
Incomplete 3 50.00% 0 0.00% 0 0.00% 1 16.67% 0 0.00% 0 0.00% 0 0.00% 0 0.00% 0 0.00% 2
24
Missing or
Incomplete 1 16.67% 0 0.00% 0 0.00% 4 66.67% 0 0.00% 0 0.00% 0 0.00% 0 0.00% 0 0.00% 1
25 Missing or 5 83.33% 0 0.00% 0 0.00% 0 0.00% 0 0.00% 0 0.00% 0 0.00% 0 0.00% 0 0.00% 1

Title: Requirements Defects Classification List
Student: Isabel Margarido Number: 090546003
Professor: João Pascoal Faria Subject: Estudo Livre
2010-08-06 76/81
Classifier
Defect Expected
Missing or
Incomplete Incorrect Inconsistent
Ambiguous or
Unclear Misplaced
Infeasible or
Non-verifiable
Redundant or
Duplicate Typo Not relevant Doubt New Unanswered
Incomplete
26
Missing or
Incomplete 4 66.67% 0 0.00% 1 16.67% 0 0.00% 0 0.00% 0 0.00% 0 0.00% 0 0.00% 0 0.00% 1
27 Inconsistent 5 83.33% 0 0.00% 0 0.00% 0 0.00% 0 0.00% 0 0.00% 0 0.00% 0 0.00% 0 0.00% 1
28 Inconsistent 3 50.00% 0 0.00% 1 16.67% 1 16.67% 0 0.00% 0 0.00% 0 0.00% 0 0.00% 0 0.00% 1
29 Inconsistent 5 83.33% 0 0.00% 0 0.00% 0 0.00% 0 0.00% 0 0.00% 0 0.00% 0 0.00% 0 0.00% 1
Total Times
Used 51 18 15 15 2 8 8 21 5 2 0
Expected 11 2 6 1 0 2 0 6 1 0 0
Total Times
Expected 66 12 36 6 0 12 0 36 6 0 0
Deviation -15 -22.73% 6 50.00%
-
21 -58.33% 9 150.00% 2 -4 -33.33% 8
-
15 -41.67%
-
1 -16.67% 2 0
Fig. 21. Experiment 2: Bars chart representing the frequency, in number of times and percentage, that a classifier is used per defect. It is another representation of the results,
that gives the number of times that each classifier was used to classify each defect (y axis), and the percentage that it was used (x axis). For example, 13 students
classified the first defect as Inconsistent which represents about 70% of the students’ answers.

Title: Requirements Defects Classification List
Student: Isabel Margarido Number: 090546003
Professor: João Pascoal Faria Subject: Estudo Livre
2010-08-06 77/81
Fig. 21. Experiment 2: Bars chart representing the frequency, in number of times and percentage, that a
classifier is used per defect.

Title: Requirements Defects Classification List
Student: Isabel Margarido Number: 090546003
Professor: João Pascoal Faria Subject: Estudo Livre
2010-08-06 78/81
Table 25. Experiment 2: Frequencies of the students’ classification matching our classification, in the same
defects. Subjects are presented in the columns and defects in the rows. If the student’s classification matches
ours the cell presents the word ‘yes’ otherwise presents the text ‘no’.
1 2 3 4 5 6 Same
ICS 1 yes yes yes no yes no 4 66.67%
TP 2 yes yes no no yes yes 4 66.67%
MINC 3 yes yes yes no yes yes 5 83.33%
MINC 4 yes no yes no yes no 3 50.00%
TP 5 yes yes no no yes yes 4 66.67%
INNV 6 yes no yes no no no 2 33.33%
AMU 7 yes yes yes no yes yes 5 83.33%
MINC 8 yes no yes no yes no 3 50.00%
INNV 9 yes yes yes no yes yes 5 83.33%
TP 10 yes no no no no no 1 16.67%
TP 11 yes yes yes no yes yes 5 83.33%
NR 12 yes no yes no no yes 3 50.00%
ICR 13 no yes yes no no no 2 33.33%
MINC 14 yes yes yes no yes no 4 66.67%
TP 15 yes no no no no yes 2 33.33%
TP 16 no no no no yes yes 2 33.33%
ICS 17 no no no no no yes 1 16.67%
MINC 18 yes no yes no yes no 3 50.00%
MINC 19 yes no yes no no no 2 33.33%
MINC 20 yes no yes no no no 2 33.33%
ICS 21 yes yes no no no no 2 33.33%
ICR 22 yes yes yes no yes yes 5 83.33%
MINC 23 yes yes no no yes no 3 50.00%
MINC 24 yes no no no no no 1 16.67%
MINC 25 yes yes yes no yes yes 5 83.33%
MINC 26 yes no yes no yes yes 4 66.67%
ICS 27 no no no no no no 0 0.00%
ICS 28 no yes no no no no 1 16.67%
ICS 29 no no no no no no 0 0.00%
Same 23 14 17 0 16 13
79.31% 48.28% 58.62% 0.00% 55.17% 44.83%
Table 26. Experiment 2: Frequencies of the students’ classification matching our classification, in the same
defects, without subject 4 and defects 27 and 29.
1 2 3 5 6 Same
ICS 1 yes yes yes yes no 4 80.00%
TP 2 yes yes no yes yes 4 80.00%
MINC 3 yes yes yes yes yes 5 100.00%
MINC 4 yes no yes yes no 3 60.00%
TP 5 yes yes no yes yes 4 80.00%
INNV 6 yes no yes no no 2 40.00%
AMU 7 yes yes yes yes yes 5 100.00%
MINC 8 yes no yes yes no 3 60.00%
INNV 9 yes yes yes yes yes 5 100.00%
TP 10 yes no no no no 1 20.00%
TP 11 yes yes yes yes yes 5 100.00%
NR 12 yes no yes no yes 3 60.00%
ICR 13 no yes yes no no 2 40.00%
MINC 14 yes yes yes yes no 4 80.00%
TP 15 yes no no no yes 2 40.00%
TP 16 no no no yes yes 2 40.00%
ICS 17 no no no no yes 1 20.00%
MINC 18 yes no yes yes no 3 60.00%
MINC 19 yes no yes no no 2 40.00%
MINC 20 yes no yes no no 2 40.00%
ICS 21 yes yes no no no 2 40.00%
ICR 22 yes yes yes yes yes 5 100.00%
MINC 23 yes yes no yes no 3 60.00%
MINC 24 yes no no no no 1 20.00%

Title: Requirements Defects Classification List
Student: Isabel Margarido Number: 090546003
Professor: João Pascoal Faria Subject: Estudo Livre
2010-08-06 79/81
1 2 3 5 6 Same
MINC 25 yes yes yes yes yes 5 100.00%
MINC 26 yes no yes yes yes 4 80.00%
ICS 28 no yes no no no 1 20.00%
Same 23 14 17 16 13
85.19% 51.85% 62.96% 59.26% 48.15%
Better Better Better Better Better
In this experiment we had fewer participants than in the first one. The percentage of defects that
received the expected classification from more than 50% of the students is 38%, smaller than the
percentage obtained in the 1st experiment.
Analysing Table 25 we observe that defects 27 and 28 were incorrectly classified by all the subjects.
For that reason we removed them from the analysis. We also removed subject 4 from the analysis,
because the student only classified 3 defects. The result of the removal of the subject was that 6
defects had 100% of students using the expected classifications, something that did not occur on
the 1st experiment. The removal of the defects that were not correctly classified by any of the
students resulted in an improvement in the number the individual classifications matching the ones
that we were expecting.
We also verified that the percentage of defects that were classified as we expected by more than
50% of the students increased to 55%. The number is still inferior than the result obtained in the 1st
experiment.
Aware that the proximity to our classification is not an indicator of correctness of the answer, we
found it was important to analyse if there were groups of classifiers that were frequently used to
classify the same defect. For that purpose we created a table of classifiers used per each defect and
analysed the frequency of usage of each classifier. Those tables were grouped by the most used
classifier (tables 27 to 31). We did not consider the previously removed defects (27 and 29) or the
data of the subject 4.
Table 27. Experiment 2: Classifiers also used when the classifier Missing or Incomplete was the mostly used.
Each table indicates the defect where Missing or Incomplete was the most used one, and presents the
frequency of usage of each one of the other classifiers. The last table compiles the data of the previous ones.
3
4
8
14
Classifier # %
Classifier # %
Classifier # %
Classifier # %
MINC 5 100%
MINC 3 60%
MINC 3 60%
MINC 4 80%
ICR 0 0%
ICR 1 20%
AMU 1 20%
AMU 1 20%
ICS 0 0%
NR 1 20%
INNV 1 20%
ICR 0 0%
AMU 0 0%
ICS 0 0%
ICR 0 0%
ICS 0 0%
MISP 0 0%
AMU 0 0%
ICS 0 0%
MISP 0 0%
INNV 0 0%
MISP 0 0%
MISP 0 0%
INNV 0 0%
RED 0 0%
INNV 0 0%
RED 0 0%
RED 0 0%
TP 0 0%
RED 0 0%
TP 0 0%
TP 0 0%
NR 0 0%
TP 0 0%
NR 0 0%
NR 0 0%
15
18
19
20
Classifier # %
Classifier # %
Classifier # %
Classifier # %
MINC 3 60%
MINC 3 60%
MINC 2 40%
MINC 2 40%
TP 2 40%
ICS 1 20%
RED 2 40%
RED 2 40%
ICR 0 0%
MISP 1 20%
ICS 1 20%
ICS 1 20%
ICS 0 0%
ICR 0 0%
ICR 0 0%
ICR 0 0%
AMU 0 0%
AMU 0 0%
AMU 0 0%
AMU 0 0%
MISP 0 0%
INNV 0 0%
MISP 0 0%
MISP 0 0%
INNV 0 0%
RED 0 0%
INNV 0 0%
INNV 0 0%
RED 0 0%
TP 0 0%
TP 0 0%
TP 0 0%
NR 0 0%
NR 0 0%
NR 0 0%
NR 0 0%

Title: Requirements Defects Classification List
Student: Isabel Margarido Number: 090546003
Professor: João Pascoal Faria Subject: Estudo Livre
2010-08-06 80/81
23
25
26
28
Classifier # %
Classifier # %
Classifier # %
Classifier # %
Classifier # %
MINC 40 68%
MINC 3 60%
MINC 5 100%
MINC 4 80%
MINC 3 60%
ICS 5 8%
AMU 1 20%
ICR 0 0%
ICS 1 20%
ICS 1 20%
AMU 4 7%
ICR 0 0%
ICS 0 0%
ICR 0 0%
AMU 1 20%
RED 4 7%
ICS 0 0%
AMU 0 0%
AMU 0 0%
ICR 0 0%
TP 2 3%
MISP 0 0%
MISP 0 0%
MISP 0 0%
MISP 0 0%
ICR 1 2%
INNV 0 0%
INNV 0 0%
INNV 0 0%
INNV 0 0%
MISP 1 2%
RED 0 0%
RED 0 0%
RED 0 0%
RED 0 0%
INNV 1 2%
TP 0 0%
TP 0 0%
TP 0 0%
TP 0 0%
NR 1 2%
NR 0 0%
NR 0 0%
NR 0 0%
NR 0 0%
Total 59
Table 28. Experiment 2: Classifiers also used when the classifier Incorrect Information was the mostly used.
13
16
17
Classifier # %
Classifier # %
Classifier # %
ICR 2 40%
ICR 3 60%
ICR 1 20%
TP 2 40%
TP 2 40%
ICS 1 20%
MINC 0 0%
MINC 0 0%
TP 1 20%
ICS 0 0%
ICS 0 0%
NR 1 20%
AMU 0 0%
AMU 0 0%
MINC 0 0%
MISP 0 0%
MISP 0 0%
AMU 0 0%
INNV 0 0%
INNV 0 0%
MISP 0 0%
RED 0 0%
RED 0 0%
INNV 0 0%
NR 0 0%
NR 0 0%
RED 0 0%
21
22
Classifier # %
Classifier # %
Classifier # %
ICR 14 61%
ICR 3 60%
ICR 5 100%
TP 5 22%
ICS 2 40%
MINC 0 0%
ICS 3 13%
MINC 0 0%
ICS 0 0%
AMU 1 4%
AMU 0 0%
AMU 0 0%
MINC 0 0%
MISP 0 0%
MISP 0 0%
NR 0 0%
INNV 0 0%
INNV 0 0%
RED 0 0%
RED 0 0%
RED 0 0%
MISP 0 0%
TP 0 0%
TP 0 0%
Total 23
NR 0 0%
NR 0 0%
Table 29. Classifiers also used when the classifier Typo was the mostly used.
2
5
11
Classifier # %
Classifier # %
Classifier # %
Classifier # %
TP 13 93%
TP 4 80%
TP 4 80%
TP 5 100%
ICR 1 7%
MINC 0 0%
ICR 1 20%
MINC 0 0%
MINC 0 0%
ICR 0 0%
MINC 0 0%
ICR 0 0%
ICS 0 0%
ICS 0 0%
ICS 0 0%
ICS 0 0%
AMU 0 0%
AMU 0 0%
AMU 0 0%
AMU 0 0%
MISP 0 0%
MISP 0 0%
MISP 0 0%
MISP 0 0%
INNV 0 0%
INNV 0 0%
INNV 0 0%
INNV 0 0%
RED 0 0%
RED 0 0%
RED 0 0%
RED 0 0%
NR 0 0%
NR 0 0%
NR 0 0%
NR 0 0%
Total 14

Title: Requirements Defects Classification List
Student: Isabel Margarido Number: 090546003
Professor: João Pascoal Faria Subject: Estudo Livre
2010-08-06 81/81
Table 30. Experiment 2: Classifiers also used when the classifier Infeasible or Non-verifiable was the mostly
used.
6
9
Classifier # %
Classifier # %
Classifier # %
INNV 7 70%
INNV 2 40%
INNV 5 100%
ICR 1 10%
ICR 1 20%
MINC 0 0%
ICS 1 10%
ICS 1 20%
ICR 0 0%
AMU 1 10%
AMU 1 20%
ICS 0 0%
MINC 0 0%
MINC 0 0%
AMU 0 0%
MISP 0 0%
MISP 0 0%
MISP 0 0%
RED 0 0%
RED 0 0%
RED 0 0%
TP 0 0%
TP 0 0%
TP 0 0%
NR 0 0%
NR 0 0%
NR 0 0%
Total 10
Table 31. Experiment 2: Classifiers also used when the classifier Ambiguous or Unclear was the mostly used.
7
24
Classifier # %
Classifier # %
Classifier # %
AMU 9 90%
AMU 5 100%
AMU 4 80%
MINC 1 10%
MINC 0 0%
MINC 1 20%
ICR 0 0%
ICR 0 0%
ICR 0 0%
ICS 0 0%
ICS 0 0%
ICS 0 0%
MISP 0 0%
MISP 0 0%
MISP 0 0%
INNV 0 0%
INNV 0 0%
INNV 0 0%
RED 0 0%
RED 0 0%
RED 0 0%
TP 0 0%
TP 0 0%
TP 0 0%
NR 0 0%
NR 0 0%
NR 0 0%
Total 10
Table 32. Experiment 2: Classifiers also used when the classifier Not relevant or Extraneous or Inconsistent
were the mostly used. Each classifier was the most used in one particular defect; therefore we present the two
tables together and do not need a summary table for each one. Not relevant or Extraneous was the most
frequently used classifier in the defect 12, while Inconsistent was the most used classifier in the defect 1.
12
1
Classifier # %
Classifier # %
NR 3 60%
ICS 4 80%
ICS 1 20%
MINC 0 0%
MISP 1 20%
ICR 0 0%
MINC 0 0%
AMU 0 0%
ICR 0 0%
MISP 0 0%
AMU 0 0%
INNV 0 0%
INNV 0 0%
RED 0 0%
RED 0 0%
TP 0 0%
TP 0 0%
NR 0 0%