fatigue lifetime estimation of wind turbine blades in a
TRANSCRIPT

DTU Vindenergi30. september 2020
Fatigue lifetime estimation of wind turbine blades in a wind farm using damage extrapolation
Shadan Mozafari, Anand NatarajanDTU Wind Energy
1

DTU Vindenergi30. september 2020
Problem introduction and Necessity:• Fatigue is common in blades
• Higher turbulence in windfarms: Higher fatigue probability
• Higher failure probability: Higher risk and financial loss
Needed:• Computationally fast quantification of reliability levels of turbine
components as compared to target design level
2

DTU Vindenergi30. september 2020
Outline:Case 1:• Using fitting to 10 minute interval damaging instead of linear damage
assumption through lifetime.
Case 2:• Using longtime simulations and their truncations for fatigue lifetime
estimation and comparing the results with 10min simulations.
Case 3:• Using SCADA data for deriving lognormal distribution of turbulence
intensity (TI) and comparing the probability of failure in some mean windspeeds with the case of 90% quantile TI (by which the blade is designedbased on)
3
DTU Vindenergi30. september 2020
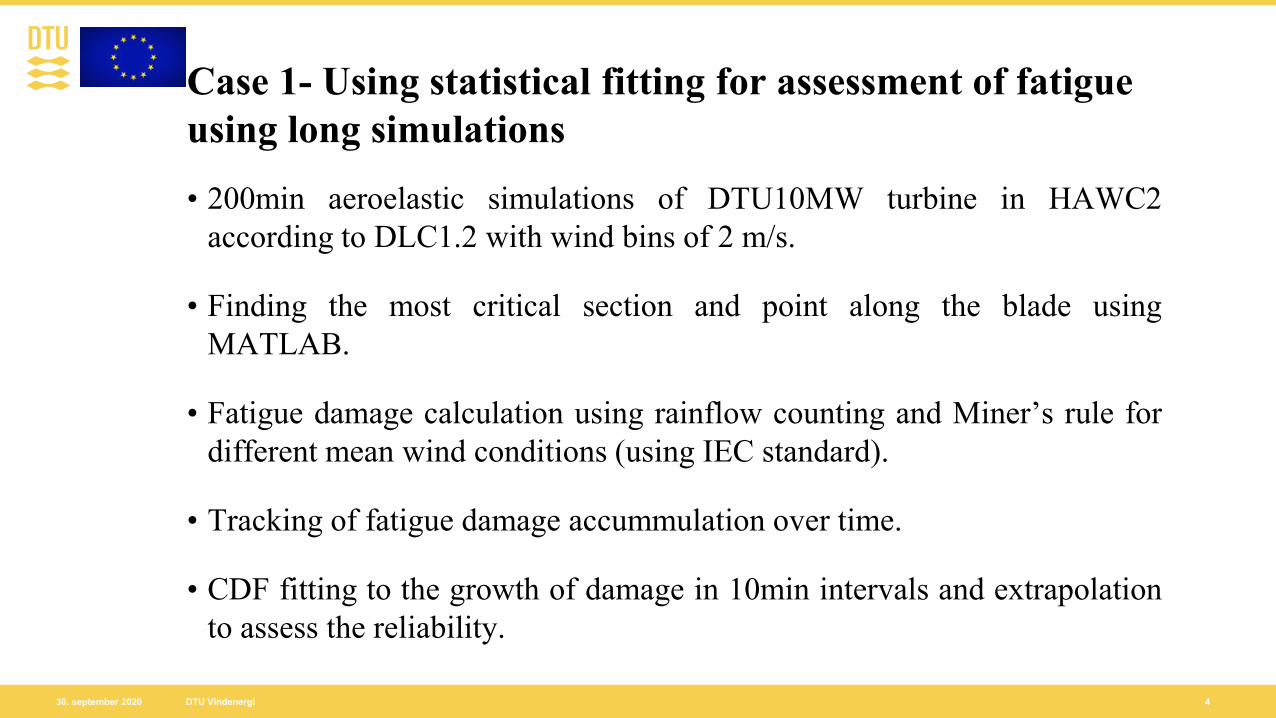
Case 1- Using statistical fitting for assessment of fatigue using long simulations
4
• 200min aeroelastic simulations of DTU10MW turbine in HAWC2according to DLC1.2 with wind bins of 2 m/s.
• Finding the most critical section and point along the blade usingMATLAB.
• Fatigue damage calculation using rainflow counting and Miner’s rule fordifferent mean wind conditions (using IEC standard).
• Tracking of fatigue damage accummulation over time.
• CDF fitting to the growth of damage in 10min intervals and extrapolationto assess the reliability.

DTU Vindenergi30. september 2020
Investigation of effects of turbulence convergence over time duration
5
Actual turbulence magnitudes in different realizations (seeds) of wind time series with a given turbulence level input
Variations of turbulence levels for different simulation time durations at a fixed mean wind speed

DTU Vindenergi30. september 2020 6
Tracking Damage equivalent load (DEL) over time Damage equivalent load is calculated
considering Neq=1e8 and tracked over time
The changes of DEL with time is not linear over time
Change of DEL based on resultant moment with time

DTU Vindenergi30. september 2020 7
Fitting of CDF of damage data
• The variable is considered the change of damage through time in 10 minute intervals
• Goodness of fit in the tail of the data is important
• Different fits are also investigated using MLE
• The best fit for all the wind speeds is Generalized Extreme Value
Parameters Estimated magnitude
ξ -0.3792
𝜎𝜎 2.8727e-9
𝜇𝜇 4.2654e-7
Parameters for GEV fitting on data in MWS of 10m/s
Fitting of CDF of different distributions to the CDF of data. (Sample from 10m/s is shown)

DTU Vindenergi30. september 2020
Calculations of probability of failure
• Mean wind speed (v), Rayleigh distribution (considering class 𝑙𝑙, Vref=50)CDF(v) = 1-exp(-𝜋𝜋 𝑣𝑣
20
2), PDF(v) = 𝑣𝑣
100∗exp −𝑣𝑣2
200
• Reliability (R)=1-Probability of failure (𝑃𝑃𝑓𝑓)• 𝑃𝑃𝑓𝑓=∑(𝑃𝑃𝑣𝑣−1<𝑣𝑣<𝑣𝑣+1) ∗ 𝑃𝑃𝐷𝐷>𝐷𝐷𝑐𝑐𝑐𝑐𝑐𝑐𝑐𝑐𝑐𝑐 |v• 𝑃𝑃𝑓𝑓=∑(𝐶𝐶𝐶𝐶𝐶𝐶𝑣𝑣+1 − 𝐶𝐶𝐶𝐶𝐶𝐶𝑣𝑣−1) ∗ (1 − 𝐶𝐶𝐶𝐶𝐶𝐶𝐷𝐷=D_crtcl24|𝑣𝑣 ) = 1.133e−05
• D_crtcl is the threshold of damage in 10 minutes derived by iteration with the starting point as below:
• Constant damage in 10min causing failure in 24 year ~ 2.52745e-07 • Constant damage in 10min causing failure in 25 years ~ 2.01035e-07
8

DTU Vindenergi30. september 2020
Methodology
• The fittings to GEV corresponds to type 2 and type 3 (Weibull and Frechet distribution)
• Once the distribution is known for 10 minute damage, we will start to find the criticaldamage in 10 minutes by below procedure:
Mean damage based on linear assumption is considered as the starting point of iterations
Back calculating to perform iterations
The first point on the fit starting from linear based critical point would be the new critical pointon the fit
• Calculation of the probability of failure based on probability of the critical damage tohappen
9
DTU Vindenergi30. september 2020
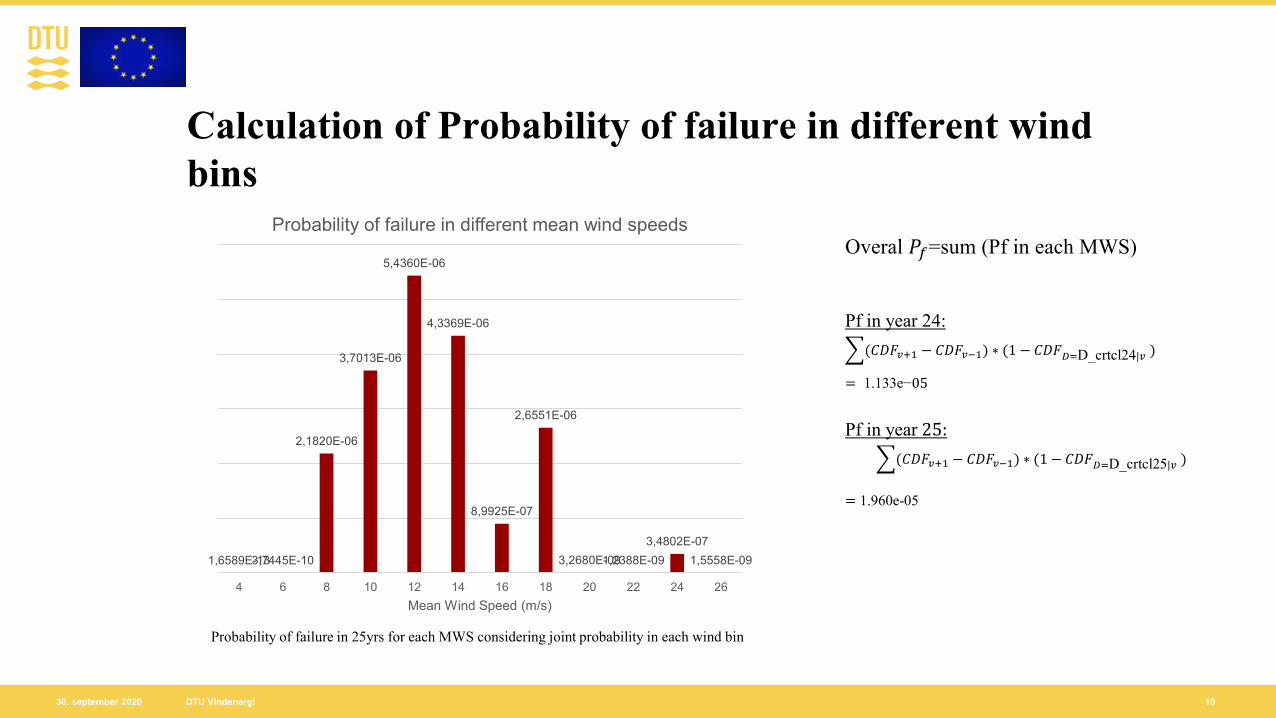
Calculation of Probability of failure in different wind bins
10
Probability of failure in 25yrs for each MWS considering joint probability in each wind bin
Overal 𝑃𝑃𝑓𝑓=sum (Pf in each MWS)
Pf in year 24:�(𝐶𝐶𝐶𝐶𝐶𝐶𝑣𝑣+1 − 𝐶𝐶𝐶𝐶𝐶𝐶𝑣𝑣−1) ∗ (1 − 𝐶𝐶𝐶𝐶𝐶𝐶𝐷𝐷=D_crtcl24|𝑣𝑣 )
= 1.133e−05
Pf in year 25:�(𝐶𝐶𝐶𝐶𝐶𝐶𝑣𝑣+1 − 𝐶𝐶𝐶𝐶𝐶𝐶𝑣𝑣−1) ∗ (1 − 𝐶𝐶𝐶𝐶𝐶𝐶𝐷𝐷=D_crtcl25|𝑣𝑣 )
= 1.960e-05
1,6589E-133,7445E-10
2,1820E-06
3,7013E-06
5,4360E-06
4,3369E-06
8,9925E-07
2,6551E-06
3,2680E-091,2388E-093,4802E-07
1,5558E-09
4 6 8 10 12 14 16 18 20 22 24 26Mean Wind Speed (m/s)
Probability of failure in different mean wind speeds

DTU Vindenergi30. september 2020
Reliability after 25 years of lifetime
• Target reliability index of β =3.3 (Pf=5e-4) is recommended by standards.
• Annual probability of failure in year 25th is calculated by calculation ofprobability of failure in year 24th and year 25th
• ∆𝑃𝑃𝑃𝑃 = 𝑃𝑃𝑓𝑓 𝑡𝑡 −𝑃𝑃𝑓𝑓 𝑡𝑡−1(1−𝑃𝑃𝑓𝑓 𝑡𝑡 )
= 8.30016E−06< 5e-4 Accepted
11

DTU Vindenergi30. september 2020
Case 2- Comparison of the results of 10min and longer time simulations• Number of 150 simulations of 10min duration for 10m/s and 14m/s
• Fatigue assessment for those wind speeds•• comparing with the probability of failure using longer time durations
12
Parameters Estimated magnitude Std error
ξ -0.3754 0.05706
𝜎𝜎 2.8727e-8 1.8973e-9
𝜇𝜇 4.2654e-7 2.5908e-9
Fitting generalized extreme value to the data from 150 simulations in mean wind speed of 10m/s
Estimated parameters for the GEV fit in 10/sMWS (m/s) Pf estimated using
10min simulations
Pf estimatedusing 200min simulations
Difference (%)
4 1.69E-13 1.66E-13 2.15%
10 4.01E-06 3.70E-06 8.28%
14 3.99E-06 4.34E-06 -7.95%
26 1.64E-09 1.56E-09 5.64%
Difference between probabilities of failure

DTU Vindenergi30. september 2020
Case 3- Comparing the probability of failure using 90% percentile of turbulence with lognormal distribution
• 10 random turbulence Intensities from lognormal distribution in MWS of 10m/s
• Fatigue damage calculated and averaged over 15 seeds
• Comparing the fatigue assessment (averaged through different turbulences) with 90% percentile (used in IEC standard)
• Assumptions of lognormal distribution for turbulence• 𝜇𝜇𝜎𝜎 = from SCADA data • 𝜎𝜎𝜎𝜎 = 1.4*Iref (Iref = 0.1)
13

DTU Vindenergi30. september 2020
Changes of damage and probability of failure in 10m/s and 14m/s using turbulence distribution
14
Turbulence intensity 0.0962 0.0877 0.0948 0.0888 0.0942 0.1007 0.1015 0.0962 0.0971 0.0996
Changes in 𝐶𝐶10min (%)compared to Damage in 90%
quantile TI for 10m/s-1.86 -5.90 -2.64 -3.96 -7.64 -3.41 11.56 -3.03 0.16 0.02
𝑃𝑃𝑃𝑃 = ∬ 𝐶𝐶𝐶𝐶𝐶𝐶𝑣𝑣+1 − 𝐶𝐶𝐶𝐶𝐶𝐶𝑉𝑉−1 ∗ 𝐶𝐶𝐶𝐶𝐶𝐶𝑇𝑇𝑇𝑇+𝛿𝛿 − 𝐶𝐶𝐶𝐶𝐶𝐶𝑇𝑇𝑇𝑇−𝛿𝛿 ∗ (1 − 𝐶𝐶𝐶𝐶𝐶𝐶𝐷𝐷=D_crtcl25|𝑣𝑣 ) .dv. dI
Turbulence intensity 0.0727 0.0822 0.0876 0.1009 0.1003 0.0846 0.0945 0.0817 0.0916 0.1061
Changes in 𝐶𝐶10min (%) compared to Damage in 90% quantile
TI for 10m/s-0.98 -2.04 -3.02 2.18 2.29 -2.10 -0.98 -1.57 -1.04 1.02
Changes in 𝑃𝑃𝑓𝑓(%)compared to𝑃𝑃𝑓𝑓in 90% quantile TI for
10m/s-8.23 -6.19 -4.29 4.92 4.61 -7.75 -9.88 -6.26 -10.55 1.06
𝑃𝑃𝑓𝑓=∬(𝑃𝑃𝑣𝑣<𝑣𝑣<𝑣𝑣+1) ∗ 𝑃𝑃𝑇𝑇𝑇𝑇−𝛿𝛿<𝑇𝑇𝑇𝑇<𝑇𝑇𝑇𝑇+𝛿𝛿 |v ∗ 𝑃𝑃𝐷𝐷>𝐷𝐷𝑐𝑐𝑐𝑐𝑐𝑐𝑐𝑐𝑐𝑐 |v,TI .dv. dI

DTU Vindenergi30. september 2020
Results and discussions:• Maximum of 8% difference in probability of failure is seen in MWS of 10m/s
when using simulations with different lengths.
• Maximum of 7.75% difference in 𝑃𝑃𝑓𝑓 is seen in MWS of 14m/s when considering turbulence intensities from log normal distribution.
• Due to the standard error of 5% in estimated parameters for the fitting, the above percentages are not accountable.
• Maximum of 11.56% in fatigue damage is seen in mean wind speeds of 10m/s when considering turbulence intensities from log normal distribution.
15

DTU Vindenergi30. september 2020 16
Acknowledgement
This project has received funding from the European Union’s Horizon 2020 Research and Innovation Programme under grant agreement No. 727680