feasibility study for a long-term solution to address …
TRANSCRIPT

FEASIBILITY STUDY FOR A
LONG-TERM SOLUTION TO ADDRESS THE
ACID MINE DRAINAGE ASSOCIATED WITH THE
EAST, CENTRAL AND WEST RAND UNDERGROUND
MINING BASINS
FOCUS GROUP MEETING
7 September 2012
Jurgo van Wyk
(Department of Water Affairs)

2
Objectives of Meeting
Long-Term Feasibility Study
• Provide background
• Provide information regarding the Feasibility Study
• Listen to inputs from key stakeholders

DISCUSSION STRUCTURE
1. WHERE DO WE COME FROM?
2. WHERE ARE WE NOW?
3. WHERE ARE WE GOING?

WHERE DO WE COME FROM?

• Acid generation is caused by the exposure of rock containing sulphide
minerals, most commonly iron pyrite (FeS2), with air and water
• results in the production of highly acidic water;
• Contains elevated concentrations of sulphate (salt) and metals;
• AMD largely associated with gold & coal mining.
What is Acid Mine Drainage (AMD)?

Decant from an abandoned shaft AMD generation on surface
• Generated on surface and underground;
• Seeps to surface streams and groundwater;
• Accumulates underground.

Mining history
1886 Receiving
Water Users
TIME
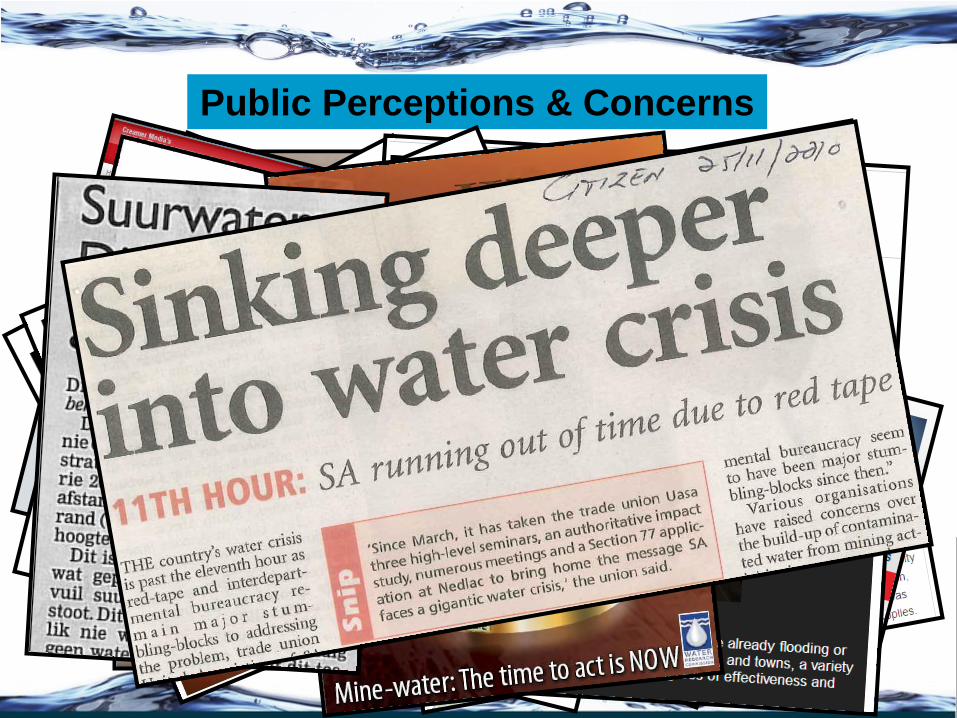
Public Perceptions & Concerns

The problem !!!
Water ingress &
Re-watering of the
underground mine
workings in the
3 mining basins
Flooding of the mine voids
Decanting to surface
Potentially increases seismic activity
May cause geotechnical impacts, if the water
reaches the near-surface environment
Impacts on the Ecology
Impairs fitness-for-use of receiving water resources
Threatens water security in the Vaal River water
supply area
CAUSE EFFECT (1) EFFECT (2)
AMD Generation
May contaminate shallow groundwater resources
Gold Reef City Museum

The Solution Proposed by the Mining Industry
In 2005 DWA directed the industry to develop a long term solution;
Mines responded with the “WUC” proposal:
Regional scale solution (ERB, CRB & WRB);
CSIR ABC process for sulphate removal;
Possible shortcomings:
Financial and economic model;
Technology
Process and Procedural requirements.

1.8.2 ToE:AMD - Composition & ToR
►CGS (Chair); ►DMR; ► DWA; ►DST; ►Mintek; ►CSIR; ►WRC; ►Universities
• Risk Appraisal;
• Assessment & Collation of work done by various institutions to date;
• Assessment of available solutions and technologies;
• Viability and cost of critical short term interventions;
• Integrated lasting and sustainable medium and long-term solutions;
• Explore possible partnerships with private sector. Term
s o
f R
efe
ren
ce
Team of Experts:AMD

Recommendations approved by IMC: AMD
The 3 priority basins (Western, Central and East Rand Basins) should have
implementation plans that include (9 February 2011):
pumping to maintain the underground mine water levels at least
below ECL (short term);
neutralisation of, and removal of heavy metals from AMD (short term);
elimination of contribution to salinity in river systems (medium to long term);
prevention of ingress;
regular inspection & monitoring;
ongoing assessment and management; and
remediation to reduce AMD related impacts from other sources, such as from
mine residue deposits.
Some areas they felt needed revisiting include the liability of polluters and
costing of implementation.
elimination of contribution to salinity in river systems (medium to long term);

Directive to TCTA
– DWA appointed TCTA as Implementing Agent on 6 Apr 2011 to:
• Install pumps for mine water extraction
• Construction/ refurbishment of on-site treatment plants with option to refurbish existing plants
• Convey treated water to nearby watercourse
• Facilitate operation of pumps and treatment plants
– TCTA appointed PSPs to undertake Due Diligence on Wits AMD
– Due Diligence report finalized on 7 July 2011 - specified immediate and short-term solutions for Wits AMD
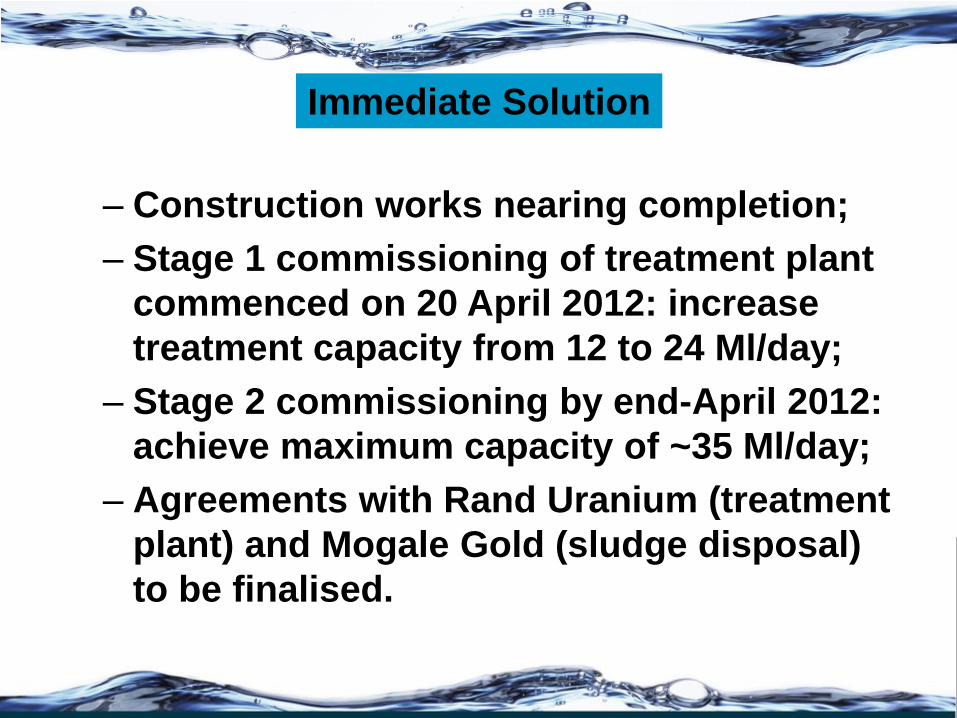
Immediate Solution
– Construction works nearing completion;
– Stage 1 commissioning of treatment plant
commenced on 20 April 2012: increase
treatment capacity from 12 to 24 Ml/day;
– Stage 2 commissioning by end-April 2012:
achieve maximum capacity of ~35 Ml/day;
– Agreements with Rand Uranium (treatment
plant) and Mogale Gold (sludge disposal)
to be finalised.

Short-Term Solution
– Four (4) bids for short-term solution received by the TCTA;
– Evaluation of bids are finalized ;
– Based on current funding (R433 million), TCTA will recommend plausible options to DWA;
– Current funding limitations may imply a phased (modular) implementation of short-term solution;
– TCTA intend to award bid soon.

The “hard” reality
Ce
ntr
al R
an
d M
inin
g B
as
in
To
re
ac
h E
CL
(±
45 –
65
Ml/
da
y)
East
Ra
nd
Min
ing
Ba
sin
To
re
ac
h E
CL
(±
75 –
92
Ml/
da
y)
WRMB 326 mil m3
CRMB 281 mil m3
ERMB 400 mil m3
Tot approx. Void Space: 1007 mil m3
1886 Sep’02 Jun’13 Apr’12
Min
e c
los
ure
??
?
Fir
st
go
ld f
ou
nd
in
Jh
b
We
st
Ra
nd
Min
ing
Ba
sin
d
ecan
t to
su
rface
(±
15 –
25
Ml/
da
y)
FSC (Grootdraai Dam) : 349.6 mil m3
FSC (Vaal Dam): 2 603.5 mil m3
FSC (Bloemhof Dam): 1 240.3 mil m3
Jun’14

Vaal River Strategy
► The Vaal River System supply water to 60% of economy and 45% of
population.
► To ensure that sufficient water of good quality is available to supply the
future requirements of the important area of the VRS a multi-pillar strategy
is required:
(1) Eradicate unlawful water use by 2013 (H. Smit);
(2) Reduction in water use by 15% through WC/ WDM (focus on loss-management) by
2015 (P. Herbst);
(3) Augmentation through LHWP#2 by 2020 (P. Pyke);
(4) Implementation of the IWQMS – Integrated WQM SSC (J.J. van Wyk);
(5) Re-use of treated “effluent” (1st: underground mine water return-flows; 2nd: WWTW
return-flows) by 2014/ 15 (J.J. van Wyk);
(6) Plan yield replacement scheme in the Orange by 2034 (S. Rademeyer & P. Pyke)
(7) Manage uncertainties in Crocodile (West) and Olifants (S. Rademeyer); and
(8) Establish a Strategy Steering Committee to facilitate Strategy implementation co-
ordination (S. Rademeyer);

2.1.9 Vaal River system water balance: Short-Term
2400
2600
2800
3000
3200
3400
3600
3800
2005 2010 2015 2020 2025 2030 2035 2040 2045 2050
Yie
ld /
Wat
er
Re
qu
ire
me
nts
(m
illio
n m
3 /
an
nu
m)
Years
High Water Requirement Scenario with
Water Conservation and Demand Management
Polihali Dam Yield
First transfer from LHWP Phase II
High with target
WC/WDM
Mine Water: Neutralization and
discharge Unlawful removed
System
Yield
Deficit
Deficit
Yield reduction due to
dilution wastages
Short-term
excess yield

2.1.10 Vaal River system water balance: Long-Term
2400
2600
2800
3000
3200
3400
3600
3800
2005 2010 2015 2020 2025 2030 2035 2040 2045 2050
Yie
ld /
Wat
er
Re
qu
ire
me
nts
(m
illio
n m
3 /
an
nu
m)
Years
19
High Water Requirement Scenario with
Water Conservation and Demand Management
First transfer from LHWP Phase II
High with target
WC/WDM
Mine Water: Desalination for urban
use Unlawful removed
Yield reduction due to
dilution wastages
Yield increases due to
desalination of mine
water System
Yield
Short-term
excess yield
Polihali Dam Yield

Salinity status: TDS (2006)
Douglas
Aucampshoop
Kalkfontein
RustfonteinTierpoort
Krugerdrif
BLOEMFONTEIN
LOWERVAAL
Tweerivier
Kimberley
Douglas Incremental
Lower Harts
Vaalharts
De Hoop
Taung
Wentzel
Barberspan
Spitskop
Erfenis
Allemanskraal
Sand Vet Incemental
MIDDLEVAAL Klipbank
Bloemhof Incremental
Rietspruit
Johan Neser
Klipdrif
Boskop
Klerkskraal
Rietfontein
Koppies
Kromdraai
Parys
VAALBARRAGE
Suikerbos
Kliprivier
BarrageIncremental
JOHANNESBURG
Delangesdrift
Vaal Dam Incremental
UPPERVAAL
Sterkfontein
Frankfort
UPPERVAAL
Grootdraai
Standerton
Christiana
VAAL
Makw
esie
Klerksdorp
Bloemhof
Vaalharts
Weir
VS1
VS2
VS4
VS5
VS6
VS7
VS8
VS16
VS17
VS18VS19
VS20
VS1 - At origin at N17 bridge
LEGEND : LEVEL 1 POINTS
VS2 - At Camden (R29/N2 Bridge)
VS3 - At N11 Bridge to Amersfort
VS4 - At R35 Bloukop Bridge
VS5 - Grootdraai Dam
VS6 - At Villiers Flood Section
VS7 - Vaal Dam on Vaal River
(downstream weir)
VS8 - Vaal Barrage - near Barrage wall
VS9 - Vaal River at low water bridge
VS10 - Vermaasdrift
VS11 - Midvaal
VS12 - Orkney Bridge
VS13 - Regina weir
VS14 - Balkfontein
VS15 - Bloemhof Dam (upstream)
VS16 - Bloemhof Dam (downstream weir)
VS17 - Vaalharts Barrage (downstream weir)
VS18 - Vaal River at De Hoop
VS19 - Schmidtsdrift
VS20 - Douglas Barrage - near barrage wall
VS3VS9
VS11
VS12
VS13
VS14VS15
VS10
0
100
200
300
400
500
600
700
800
900
VS20 VS19 VS18 VS17 VS16 VS14 VS13 VS12 VS11 VS10 VS9 VS8 VS7 VS6 VS5 VS4 VS3 VS2 VS1
Monitoring Point on Vaal River(Level 1)
TD
S (
mg
/l)
Acceptable RWQO
Vaal Dam
Grootdraai
Dam
Bloemhof
Dam
Vaal
Barrage
Douglas
Barrage

TDS Load Contributions

TDS Concentrations

Modeling results: Cascading TDS values
Point Scenario RWQOs:TDS
95%tile (mg/l) A B
Vaal Barrage 825 569 600
Midvaal off-take 748 622 600
Sedibeng off-take 859 648 600
Bloemhof Dam 813 602 750
Vaal Harts Weir 832 629 750
Klipspruit 1240 596 600
Suikerbosrand 1075 651 650
► Scenario A (Interim) – Discharge of semi-treated AMD to the Vaal River system
after neutralisation & metal removal; &
► Scenario B (Long run) – Desalination of underground mine water and re-use.

LHWP Phase II (Polihali Dam)
Use of acid mine drainage
Thukela-Vaal transfer (Phased Mielietuin
& Jana Dams)
Zambezi-Vaal transfer
Orange-Vaal transfer (Boskraai Dam with phased pipelines)
Desalination of seawater
Mzimvubu-Vaal transfer
0
5
10
15
20
25
0 100 200 300 400 500 600 700 800
Marg
inal C
ost
-U
RV
(R
/m3)
Volume (million m3/a)
Vaal River Augmentation Options
Legend
(0.85) - Unit energy requirementkWh/m3 of raw water
(13.2)
(4.2)
(4.4)
(3.4)
(2.4)(2.5)
(0.0)
2.1.11 Vaal River Augmentation Options

Important Dead-lines
Short-Term Emergency Works
• To stop decanting in WRMB.
• To protect the ECLs in CRMB
(June/ July 2013); and
• To protect the ECLs in ERMB
(June 2014).
Long-Term Solution
• To remove the mine water induced
salt-loading (i.e. 2014/ 15)

WHERE ARE WE NOW?

FS:LTS to- Consider all options and find the best solution;
Follow a defensible process;
Potentially facilitate public sector innovation;
Address the waste “management” challenges;
Protect the Tax payer and water user interest;
Consider OPEX;
Etc.
Nothing beats good planning

• Investigate and recommend a feasible long-term solution to the AMD problems emerging in the study area, in order to ensure long term water supply security and continuous fitness for use of Vaal River water.
Study Goal
Study registered with National Treasury and
needs to comply to the requirements to enable
a possible PPP solution as well.

Agric.
Desal.
Pipe-
line RFP RFQ Opt 2
Opt 1
Pref. Opt /
Ref. Project
Pre-Feasibility Feasibility Procurement
OPTIONS ANALYSIS
Sept ‘12 Feb ‘13 Aug ‘12
Tech.
Environ Other
Finan.
Project Sizes to Consider:
• Small < R250M
• Large <R 1 Billion
• Mega >R1 Billion
Feasibility
Pre-Feasibility Feasibility
Dec ‘13

5x Focus Areas of the Feasibility Study
Technical Study
Legal Study
Institutional/ PPP Study
Finances & Economics Study
Key Stakeholder Participation
INT
EG
RA
TIO
N

The Study Area

Study Governance Structure,
Role of SSC and
Communications Strategy

• Aurecon SA
– Proxa
• SRK
– Shango Solutions
– Kaleo Consulting
• Turner & Townsend
– Ledwaba Maswai
– Ignis
• Specialist Individuals, comprising Engineers, Social &
Environmental Specialists, Economists, Lawyers, Treatment
Specialists, etc.
• 103 members
PSP: Multi-Disciplinary Consortium

Management Structure


• The Feasibility study to consider all options;
• Require technical input and expert advice;
• Focussed consultation on a technical level with key
stakeholders and stakeholder sectors/ groups.
• Not an EIA or public consultation process yet.
Who are key stakeholders in this study?
Directly affected parties, those who have a high level of
influence on the direction and success of AMD long-term
initiatives, and those whose input is critical to the study
Key Stakeholder Engagement
and Communication

• Study Stakeholder 2 day w/shop May 2012
• Stakeholders Engaged to Date:
– Government Departments
– CSIR
– CGS
– NECSA
– WRC
– Rand Water
– Municipalities
– Universities e.g., Wits, NW, Tuks, TUT, FS etc.,
– Experts: Frank Winde, Leslie Stoch, etc.
– FSE
• DWA presentations to Catchment Forums and existing forums
and structures,
– E.g. Blesbokspruit Forum, Leeuspruit Forum, Western Basin Void Decant
Technical Group, Vaal Dam Forum and Vaal Barrage Forum.
Key Stakeholder Engagement and Communication

• DWA website - will contain relevant information
• Newsletters
– With standard text box for information/ feedback to stakeholders
on the short-term interventions
– Distribution:
• DWA website & Electronically (email) to wider stakeholder database,
– Newsletters
• Press releases
– Distribute by DWA
– Press releases:
• March 2012 -Statement by Minister Edna Molewa at the AMD media
briefing in Randfontein on 22 March 2012
• Frequently Asked Questions (FAQ) on DWA website
• Broad public participation to follow
Communication with wider Stakeholder Group

FEASIBILITY STUDY FOR A
LONG-TERM SOLUTION TO ADDRESS THE
ACID MINE DRAINAGE ASSOCIATED WITH THE
EAST, CENTRAL AND WEST RAND UNDERGROUND
MINING BASINS
FOCUS GROUP MEETING
7 September 2012
Andrew Tanner
(Aurecon)

5x Focus Areas of the Feasibility Study
Technical Study
Legal Study
Institutional/ PPP Study
Finances & Economics Study
Key Stakeholder Participation
INT
EG
RA
TIO
N

WHERE ARE WE NOW?

WHERE ARE WE NOW?
Study Inception
Gathering Information

WHERE ARE WE NOW?
Legal Study

• The draft “Legal Considerations for Apportionment of
Liabilities Report” has been submitted to DWA during
the last week of June.
• This is a confidential report
• Discussions with DWA on this matter are on-going
Current Status

Legal Considerations for Apportionment of Liabilities
(cont.…)
• The CGS’ s alternative (technical/pragmatic) approaches
on a apportioning liabilities is being considered and
commented on by technical team members under this
component.

TECHNICAL DISCUSSION STRUCTURE
WHERE ARE WE NOW?
WHERE ARE WE GOING?

WHERE ARE WE NOW?
Component 4.1: Assessment of the Current Status of the Management of AMD
• Draft report submitted to DWA on 18 May 2012

• The current status was reviewed under the following
headings:
Existing and planned (STI) infrastructure
Current and planned treatment of AMD
Environmental aspects
Procurement strategies
• The STI does have implications for LTS and the
costs of alternatives are being evaluated
Findings to Date

Agric.
Desal.
Pipe-
line RFP RFQ Opt 2
Opt 1
Pref. Opt /
Ref. Project RFI
Pre-Feasibility Feasibility Procurement
OPTIONS ANALYSIS
30 Aug 15 Dec June
Tech.
Environ Other
Finan.
Project Sizes to Consider:
• Small < R250M
• Large <R 1 Billion
• Mega >R1 Billion
Feasibility
Pre-Feasibility Feasibility

WHERE ARE WE NOW?
Technical Pre feasibility
• Mine voids
• ECL
• How and where to abstract
• Water quantity
• Water Quality
• Water use
• Treatment options
• Waste disposal
• Integrated Long term Options

WHERE ARE WE NOW?
• MINE VOIDS

Current Mine Water Status in Wits Basins
Basin
Mine water level
(metres below
surface) [mbs]
Environmental
critical level
(ECL) (mbs)
Est. date to ECL
Eastern June 2012= 538 314 Jun 2014
Central June 2012= 322 174 Jun-Jul 2013
Western At surface 160
ECL currently breached
resulting in surface
decant
ECL – The highest level that mine water can be allowed to rise in the mine void before adverse
environmental impacts can be detected

• 1st Draft Report submitted on 16 May 2012
• Comments received and report discussed with DWA on
22 June 2012
• Additional analyses carried out
• 2nd Draft Report issued on 22 August
• Now available to SSC members on the project Web
Portal
Water Quantity and Quality of Mine Voids

Findings
to Date

Western Basin:
• ECL Objectives
Protection of Cradle of Humankind Dolomites and Tweelopies
Spruit
Reverse hydraulic gradient towards mine void
Water Quantity and Quality of Mine Voids

Western Basin
Water Quantity and Quality of Mine Voids

Western Basin (cont…):
ECL Strategy
• Lower level slowly to 1600 m amsl and maintain for sufficient
time to empty storage in dolomitic aquifer
• Monitor in Cradle of Human Kind and Tweeloopies Spruit
during dewatering
• Lower to 1550 m amsl (TCTA recommendation) if no
improvement to Tweelopies catchment or problems in Cradle of
Human Kind
Water Quantity and Quality of Mine Voids

Western Basin (cont.…):
Abstraction Strategy
• Rand Uranium Shaft #8 (TCTA selection) due to
proven good connection
• Passive drainage by tunnel connected to void
(possible longer term solution)
Water Quantity and Quality of Mine Voids

Length Cost Savings
(km) (R mil) Head (m) Elec. NPV
(R.mil)
6.9 276 180/130 148/114
NPV for 50 years
1450
1500
1550
1600
1650
1700
1750
0 2 4 6 8
Ele
vati
on
(m
am
sl)
Distance (km)
Western Basin Tunnel Option
No 8 Shaft Tunnel ECL Ground line TOL
Average Flow 23 Ml/d
Assumed Eskom Tariff
Increases
2013 25 %
2014-2027 13 %
Thereafter (CPI) 6 %

Central Basin:
ECL Objectives
• Protect shallow aquifers
• Maintain ECL at 1520 m amsl, 100m below surface
• Plug GRC shaft or move museum
Water Quantity and Quality of Mine Voids

Central Basin
Water Quantity and Quality of Mine Voids
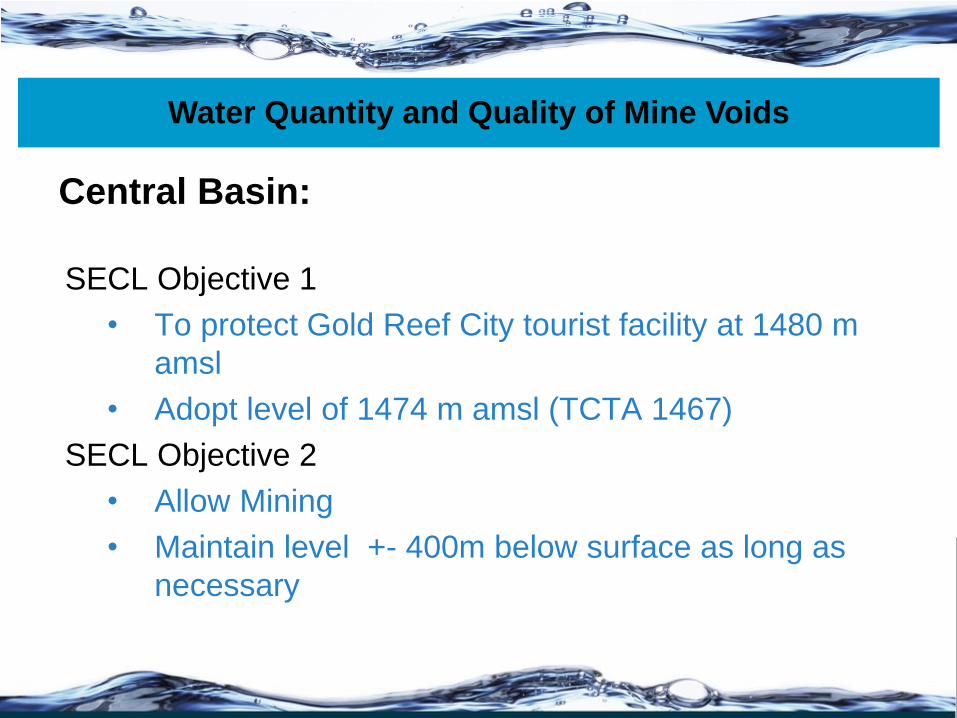
Central Basin:
SECL Objective 1
• To protect Gold Reef City tourist facility at 1480 m
amsl
• Adopt level of 1474 m amsl (TCTA 1467)
SECL Objective 2
• Allow Mining
• Maintain level +- 400m below surface as long as
necessary
Water Quantity and Quality of Mine Voids

Central Basin
Gold Reef City
TCTA SECL
1480
1467
1520
1500
1653
Proposed TOL
Proposed ECL
Energy Saving: R 2.5 million / annum
NPV: R 27 million
33
m
15
3 m
Energy Cost: R 8.2 million / annum
NPV: R 130 million
Average pump rate 46 Ml/day
Water Quantity and Quality of Mine Voids

Central Basin:
Recommendation • Maintain at level for mining or at 1467 m amsl
initially.
• If GRC shaft has been plugged
• Slowly allow level to rise and Monitor
Water Quantity and Quality of Mine Voids

Central Basin (cont…):
Abstraction options
• South West Vertical (SWV) shaft recommended by
TCTA. Deep and limited connectivity
• Considering additional abstraction from:
several declines (more connection at shallow depths)
passive drainage via tunnel or
abstraction boreholes targeting mine void/declines at
shallower depths
Water Quantity and Quality of Mine Voids

Length Cost Savings
(km) (R mil) Head (m) Elec. NPV
(R.mil)
7.5 300 206/150 300/230
NPV for 50 years
Capacity 46 Ml/d
Assumed Eskom Tariff
Increases
2013 25 %
2014-2027 13 %
Thereafter (CPI) 6 %
1450
1500
1550
1600
1650
0 2.5 5 7.5 10 12.5 15
Ele
vati
on
(m
am
sl)
Distance (km)
Central Basin Tunnel from SWV Shaft
Ground line SWV Shaft Tunnel ECL TOL TCTA ECL
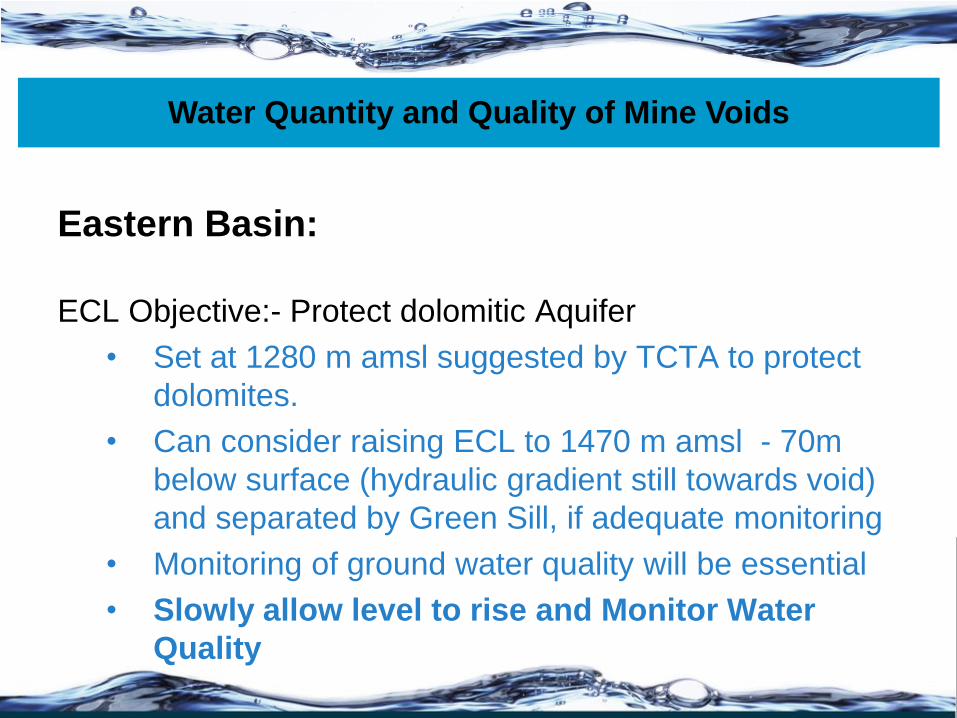
Eastern Basin:
ECL Objective:- Protect dolomitic Aquifer
• Set at 1280 m amsl suggested by TCTA to protect
dolomites.
• Can consider raising ECL to 1470 m amsl - 70m
below surface (hydraulic gradient still towards void)
and separated by Green Sill, if adequate monitoring
• Monitoring of ground water quality will be essential
• Slowly allow level to rise and Monitor Water
Quality
Water Quantity and Quality of Mine Voids

Eastern Basin
Water Quantity and Quality of Mine Voids

Eastern Basin (cont…):
Abstraction points
• Grootvlei #3 recommended by TCTA (1280 m amsl)
but recirculation to void - known ingress point
• Shafts at lower elevations could reduce pumping by
20 m head difference
• E.g. Marievale
• Boreholes into void could be considered
Water Quantity and Quality of Mine Voids

Summary of ECL and Pumping Rate
Basin TCTA ECL
mamsl
This Study
ECL
mamsl
Approx. Average Pumping Rates (TCTA)
(Ml/day)
Proposed Pump Capacity and Rate (this study)
(Ml/day)
Volume Range Capacity Rate
Western 1550 1600 27 23-35 40 23
Central 1467 1520/1474 57 34-84 50 46
Eastern 1280 1470 82 38-110 100 80
Water Quantity and Quality of Mine Voids

Water Chemistry
Water Quantity and Quality of Mine Voids

WHERE ARE WE NOW?
Discussion
• Western basin
• Central basin
• Eastern basin

WHERE ARE WE GOING?
What can we do with the water?

• Objective
– Assess options to eliminate or suitably reduce the salt
loadings on the Vaal System from underground AMD.
• Scope
– Options for direct use of neutralized water
– Assess alternative uses for desalinated water.
Options to eliminate (or suitably reduce) Underground
Mine Water induced Salt Loading on the Vaal River System

• Interim First Draft report issued to DWA 5
September, (without RW Inputs)
Need more inputs from and discussions with
Rand Water to complete report
Options for Discharge, Delivery and Disposal of
Treated Water & Waste Products

Findings to Date
• Two Water Quality Streams
Neutralised water
Desalinated water

Findings to Date
• Direct use of neutralized water
Mines
Agriculture
Industry

• Options for Direct Use of Neutralized Water
– Direct supply to agriculture.
• Pipe or canal supply from neutralization plant to distribute some
or all of the water.
• There are salt tolerant crops.
• Requires careful management and crop rotation.
• Salts build up in the soil.
• All salts are not removed from the system.
• Not sustainable as a Long-Term Solution??
Options to eliminate (or suitably reduce) Underground
Mine Water induced Salt Loading on the Vaal River System

• Options for Direct Use of Neutralized Water
(cont.…)
– Direct supply to mines:
• Pipe or canal to operations that can accept this saline water
• Processing of mine dumps, etc.
• Other process that can accept saline water?
• Salts combined with dump material in a slurry
• Slurry reprocessed
• Waste product “stored”?
– Slimes dam, etc.
Options to eliminate (or suitably reduce) Underground
Mine Water induced Salt Loading on the Vaal River System

• Options for Direct Use of Neutralized Water
(cont.…)
– Direct supply to mines:
• Salts are not removed from the system
– Will eventually re-enter the resource unless run off is contained
and permanently “stored”.
These options may defer the problem but may pose
long term risks.
Options to eliminate (or suitably reduce) Underground
Mine Water induced Salt Loading on the Vaal River System

• Options for Direct Use of Neutralized Water
(cont.…)
– Direct supply to Industry:
• Pipe (or canal) to industries that will accept saline water:
– Will not use the salt in their process
– Will treat to get acceptable water
– Disposal of salt will be a risk to the water resource and
environment
Options to eliminate (or suitably reduce) Underground
Mine Water induced Salt Loading on the Vaal River System

Findings to Date
Direct use of neutralized water
• Use of Neutralised Water is not a recommended
LTS since majority of the salt remains in the
system.
• May buy some time if carefully managed.

Findings to Date
• Alternative use of Neutralised and Desalinated
Water
Rivers
Potable
Industry

• Options for use of neutralized and desalinated
water – each discussed in the following
presentations, by basin:
– Potable Water:
• Treated to SANS 241 (minimum)
• Other higher standards may required
– Industrial Users:
• Salts removed to acceptable concentrations
• May be to SANS 241
Options to eliminate (or suitably reduce) Underground
Mine Water induced Salt Loading on the Vaal River System

• Options for use of neutralized and desalinated
water – each discussed in the following
presentations, by basin (cont.…):
– Discharge to Rivers:
• RWQO
• Downstream Users
• Environment
Options to eliminate (or suitably reduce) Underground
Mine Water induced Salt Loading on the Vaal River System

• Desalinated Water - Discharge to Rivers
Options to eliminate (or suitably reduce) Underground
Mine Water induced Salt Loading on the Vaal River System
• Objective
Provide guidance on the discharge of
desalinated acid mine drainage by considering
Water User Quality Requirements for the
affected basins.

Resource Water Quality Objective
• RWQO is the water quality component of the Resource
Quality Objectives (RQOs).
– numeric or descriptive in-stream (or in-aquifer) water quality
objectives
– finer resolution (spatial or temporal) than RQOs
• Water requirements
– Domestic, Agriculture, Recreational, Aquatic, Industrial
• Levels
– Target, Acceptable, Tolerable, Unacceptable
• Vaal River Reconciliation Study

Western Basin

Central Basin

Eastern Basin

• Desalinated Water
– Potable Use
– Industrial Use
Options to eliminate (or suitably reduce) Underground
Mine Water induced Salt Loading on the Vaal River System

• Potable Use
– If desalinated the drinking water quality standards can
be achieved
– Rand Water is considered as the primary stakeholder,
as the mine water treatment facilities fall within their
area of supply and jurisdiction
– Other stakeholders to be considered are Johannesburg
Water, Magalies Water and municipalities such as
Ekurhuleni Metropolitan Municipality
– Rand Water have major concerns about the public’s
reaction if desalinated water is proposed for potable use
Options to eliminate (or suitably reduce) Underground
Mine Water induced Salt Loading on the Vaal River System

• Industrial Use
– Rand Water have a number of existing and
potential customers who will probably take
treated mine water for industrial purposes
– Other users (industries and mines) can be
considered
Options to eliminate (or suitably reduce) Underground
Mine Water induced Salt Loading on the Vaal River System

Options to eliminate (or suitably reduce) Underground
Mine Water induced Salt Loading on the Vaal River System

WHERE ARE WE GOING?
How can we treat the AMD?

• Draft report issued to DWA on 30 August 2012
Component 4.4: Assessment of Treatment Technologies

Alternative Treatment Processes and the Implications
Classification of technology
• Pre-treatment
– HDS
• Physical Processes
– Conventional RO (following
HDS)
– Alternative RO (no HDS
pre-treatment)
– Electro-coagulation
– Electro-coagulation &
Electro-precipitation
• Chemical processes – ABC-process
– SAVMIN process
• Biological processes
– Biosure
– Paques

Alternative Development Options
Factors affecting the selection process:
• Quality of raw AMD
• Quality required of
treated AMD
• Waste products produced
– Mass of waste
– Volume of waste
– Properties of waste
– Value of waste products
• State of development of
technology
• Complexity of process
and operation
• Risk evaluation
– Environmental impact
– Health factors
– Impact of failures
• Recovery times
• Danger to public
Alternative Treatment Processes and the Implications

TECHNOLOGY OPTIONS

Classification of AMD Treatment Technologies
Alternative Treatment Processes, Products & Possible
Locations
Classification Development Risk level Comments
Embryonic Laboratory
Scale
Simulations
Very high Chemical principles are evaluated and
proven
No secondary effects are simulated
Limited design info available
Innovative Pilot Plant
Simulations
Moderately
high
Proven chemical principles are applied
on a larger scale
Limited simulation of secondary effects
depending on the size of the pilot plant
Design parameters are being
determined.
Risk that not all parameters are
identified
Proven Being used in
practice
Moderate Has ben used in Practice for extended
period to treat at least 10Ml/d

• Discussion
– HDS and Conventional RO (CRO) are only
“proven” technology
– HDS produces large quantities of waste with
disposal challenge
– CRO produces gypsum sludge
– All other processes are innovative and require
further research or testing to be proven
Alternative Treatment Processes and the Implications

• Discussion (continued)
– Processes that reduce the waste should
receive preference for further investigation
– Alternative RO produces re-usable metals
and gypsum (as claimed by the supplier)
– Biological processes can produce metal
sulphides and elemental sulphur in biological
processes
Alternative Treatment Processes and the Implications

• Discussion (continued)
– Biological processes need to be placed where
the carbon source is
– Biological processes require tertiary treatment
to achieve potable standards
Alternative Treatment Processes and the Implications

WHERE ARE WE GOING?
What can we do with the waste products?

Image showing discharges
into CPS Pit

HDS Sludge Storage Facilities (SSFs)
H
L1 x B1 7H
L2 x B2
Basin AMD
(Ml/d) H
(m)
L2 (m)
B2 (m)
NPV (R.mil)
URV (R/m3)
Western 23 22 735 590 959 7.27
Central 46 38 1030 630 1152 4.35
Eastern 80 32 1200 800 1946 4.24
Size and NPV for 50 years

WHERE ARE WE GOING?
What are the possible Options for
Abstraction, treatment, water use
and waste management?

TECHNICAL OPTIONS UNDER CONSIDERATION INCLUDE
Potential raising of the ECLs (with monitoring) to levels that are still deemed
“safe”;
Tunnels (Western and Central Basins);
Connectivity limitation between sub-basins and the need for multiple
abstraction regimes;
Alternative pumping locations taking account of preferential flow-paths
within the mine voids and the associated impacts on WQ;
Innovative treatment technologies;
Waste discharge options- an important challenge;
Management and use of treated water; etc.

• Flow Diagram Model has been developed for all
3 Basins
• Costing Models are in an advanced stage of
development (URV Method) for all 3 Basins
Current Status

Typical Flow Diagram Model
OPTION? 2Dry mass 105.5 t/d
Total Mass 1055 t/d
Total Vol 959.1 m³/d
Storage Cap. 2 days 27 Ml/d
Storage Cap. 1918.2 m³
100% 0 Ml/d
Dry mass 148.4 t/d
Total Mass 1484 t/d
Total Vol 1349.3 m³/d 0.96 Ml/d 100%
Storage Cap. 2 days
Storage Cap. 2698.5 m³ 27 Ml/d 0 Ml/d 0%
0 Ml/d
0%
1.35 Ml/d
100% 0%
0 Ml/d
0%
0 Ml/d
0 Ml/d
0% 0% 0 Ml/d
27 Ml/d
27 Ml/d
Daily Flow 27 Ml/d 0% 0% 0 Ml/d
Average Flow 313 l/s
Pumping Time 19 hrs 0 Ml/d
Peak Flow 395 l/s 0 Ml/d
0.00 Ml/d
Sewage Sludge 0 Ml/d
Treatment cap. 0 Ml/d
0 Ml/d
Sewage Sludge 0 Ml/d
Treatment cap. 0 Ml/d
Sewage Sludge 0 Ml/d
Treatment cap. 0 Ml/d
0 Ml/d
0 Ml/d
0 Ml/d
0.00 Ml/d
Dry mass 0.0 t/d 0.00 Ml/d
Total Mass 0 t/d
Total Vol 0.0 m³/d
Storage Cap. 2 days
Storage Cap. 0.0 m³
Dry mass 0.0 t/d
Total Mass 0 t/d
Total Vol 0.0 m³/d
Storage Cap. 2 days
Storage Cap. 0.0 m³
Abstraction Neutralization Plant
Sludge Disposal
Biosure
Sludge Disp.
Percy Stewart
Flip Human
Randfontein
Desalination
Agricultural
IndustrialSludge/Water
Disposal
Environmental (River)
Potable
Industrial
Sludge Disposal
Discharge Point
User 1
User 2
User 1
User 2
User 3
PL 1
PL 5
PL 7
PL 8
PL 6
PL 10
PL 2
PL 3
PL 4
PL 11
PL 12
PL 13
PL 14
PL 15
PL 16
PL 9
Tunnel
Tunnel
Neutralization Plant
Sludge Disposal
PL 17 Desalination Environmental (River)
Discharge Point
Sludge Disposal

WHAT ARE THE MAIN CONCERNS/CHALLENGES?

Implementation of the
Long Term Solution

Key Study Program Dates
• Contract start date: 30 Jan. 2012
• Inception Report:
- Possible Scope Changes: Mid-May 2012
• Pre feasibility Draft report: End-Sept 2012
• Feasibility Draft: End-Nov. 2012
• Approvals and Final Reports: Feb. 2013
• Contract end date : 28 Feb. 2013

Fast tracking the process

116
Possible Commissioning Dates
Process Normal Process
(Low Risk)
Fastest Process
(High Risk)
Conventional
Procurement
September 2017 May 2017
DBOM or PPP
Procurement
July 2018 Aug 2015
Implementation Programme-Comparisons

Contributions

• Technical
Abstraction points
Water delivery
Waste disposal
Implementation
• Legal
Who contributes what?
OPTIONS FOR CONSIDERATION

• Institutional
Who operates and maintain?
• Financial and Economics
Funding
Cost recovery
OPTIONS FOR CONSIDERATION

Contact Details
http://www.dwa.gov.za/Projects/AMDFSLTS
(as per the news letter)

CLOSURE