february 28th, 2019 - engie
TRANSCRIPT
APPENDICES
FY 2018 RESULTS
February 28th, 2019

APPENDICES - INDEX
FINANCIALAPPENDICES
PAGE 3
Generation capacity & electricity output 4
CO2 16
Sustainability 18
Outright power generation
in Europe nuclear & hydro 26
Networks KPIs 28
Reportable segments 30
— North America 31
— Latin America 33
— Africa/Asia 35
— Benelux 37
— France 40
— Europe excluding France & Benelux 44
— Infrastructures Europe 47
— GEM 50
— Others 52
PAGE 55
Impact of weather in France 56
Change in number of shares, scope & forex 59
Balance sheet, P/L & cash flow statement 64
Profit & Loss details 72
Cash flow details 90
Credit 95
BUSINESS APPENDICES

BUSINESS APPENDICES
FY 2018 RESULTS

GENERATION CAPACITY
& ELECTRICITY OUTPUT

At 100%
% consolidation(1)
Net ownership(2)
40%
1%8%
31%
18% 3%
BREAKDOWN OF GENERATION CAPACITY BY GEOGRAPHIC AREAAS OF 12/31/2018
5
(1) % of consolidation for full consolidated and joint operations affiliates and % holding for equity consolidated companies(2) ENGIE ownership
META
Asia
Oceania
International
61% 77%
Europe
39% 23%
International
47% 86%
Europe
53% 14%
International
44% 85%
Europe
56% 15%
104.3 GW
68.5 GW 53%
2%8%
14%
20%
3%
59.6 GW 56%
2%7%
16%
16%
3%
6.7 GW
23%11%
28%
25%
4.6 GW
14%14%
16%
37%
4.2 GW
15%15%
18%
32%
Installed Under construction
BU
SIN
ES
S A
PP
EN
DIC
ES
2%
3%
2%
Europe
North America
Latin America
GENERATION CAPACITY & ELECTRICITY OUTPUT
11%
16%
18%
FY 2018 RESULTS

At 100%
% consolidation(2)
Net ownership(3)
68.5 GW
10%
9%2%
45%1%
5%
23%
5%
104.3 GW
7%6%
2%
55%
1%
5%
19%
5%
4.2 GW
10%
26%
18%
44%
2%0%
4.6 GW
15%
24%
16%
43%
1%
6.7 GW
10%
17%
24%
45%
3%
BREAKDOWN OF GENERATION CAPACITY BY TECHNOLOGYAS OF 12/31/2018
6
(1) Excluding pumped storage for hydro capacity(2) % of consolidation for full consolidated and joint operations affiliates and % holding for equity consolidated companies(3) ENGIE ownership
FY 2018 RESULTS
low CO2 emissions
88% 89%
renewable(1)
24% 65%
low CO2 emissions
85% 84%
renewable(1)
25% 68%
low CO2 emissions
87% 90%
renewable(1)
22% 72%
Installed Under construction
59.6 GW
8%
11%
49%1%
5%
19%
5%
2%
Natural gas
Hydro
Wind
Complex/
other RES
Coal
Nuclear
Other
non-renewable
Solar
BU
SIN
ES
S A
PP
EN
DIC
ES
1%
1%
GENERATION CAPACITY & ELECTRICITY OUTPUT

in MW Hydro(1) WindBiomass
& biogasSolar
EUROPE 4,093 3,672 422 1,028
NORTH AMERICA - 659 113 223
LATIN AMERICA 12,201 589 99 259
MIDDLE EAST,
TURKEY & AFRICA- 407 - 21
ASIA 152 - 30 668
OCEANIA 48 82 - 3
TOTAL 16,494 5,409 664 2,201
RENEWABLE ENERGY: ~ 24% OF GROUP’S GENERATION CAPACITYAs of 12/31/2018
7
(1) Excluding pumped storage(2) % of consolidation for full and joint operations affiliates and % holding for equity consolidated companies(3) ENGIE ownership
24.8 GWinstalled
9%3%
22%
67%
8%3%
21%17.9 GW
installed68%
in MW Hydro(1) WindBiomass
& biogasSolar
EUROPE 4,000 2,574 412 495
NORTH AMERICA - 264 113 203
LATIN AMERICA 7,930 589 82 259
MIDDLE EAST,
TURKEY & AFRICA- 197 - 4
ASIA 152 - 30 433
OCEANIA 48 82 - 3
TOTAL 12,130 3,705 637 1,396
in MW Hydro(1) WindBiomass
& biogasSolar
EUROPE 2,464 2,199 412 457
NORTH AMERICA - 264 107 203
LATIN AMERICA 5,909 420 57 229
MIDDLE EAST,
TURKEY & AFRICA- 197 - 4
ASIA 71 - 21 433
OCEANIA 48 69 - 3
TOTAL 8,492 3,148 596 1,328
10%
4%
23%13.6 GW
installed63%
Hydro(1) Wind Biomass & biogas Solar
FY 2018 RESULTS
AT 100% % CONSOLIDATION(2) NET OWNERSHIP(3)
BU
SIN
ES
S A
PP
EN
DIC
ES
GENERATION CAPACITY & ELECTRICITY OUTPUT

INSTALLED CAPACITY EVOLUTION VS END 2017AS OF 12/31/2018, IN GW, AT 100%
8
102.7
104.3
12/31/2017 12/31/2018Americas Europe & Others Africa/Asia Disposals &
others
Closing/
Decommissioning
+0.6
+0.8
+1.3
• Belgium, gas, 150 MW
• Belgium, other non-renewable, 147 MW
• France, wind 249 MW
• France, solar 224 MW• Safi (Morocco, coal,
1,250 MW)
(1.0)
0.1
• Loy Yang B (Australia, coal, 986 MW)
-1.3 GW closed or sold
of which -1.0 GW coal
• Campo Largo (Brazil, wind, 327 MW)
• Longwood (USA, non renewable, 101 MW)
• USA, solar, 130 MW
• Intipampa(Peru, solar, 41 MW)
+2.7 GW of new capacity added: • 49% in low CO2 technologies
o/w 80% renewable
• 70% international
• Arjona(Brazil, gas, 190 MW)
• Alegrete(Brazil, non renewable, 60 MW)
• Iquique (Chile, non renewable, 42 MW)
FY 2018 RESULTS
BU
SIN
ES
S A
PP
EN
DIC
ES 61%
International
39%Europe
88%low CO2 emissions
23%renewable
GENERATION CAPACITY & ELECTRICITY OUTPUT
(0.3)
• Drogenbos conversion (Belgium, +230 MW)
• Capacity revision:
Solar in India 108 MW and in China 21 MW
Others
AT 100%
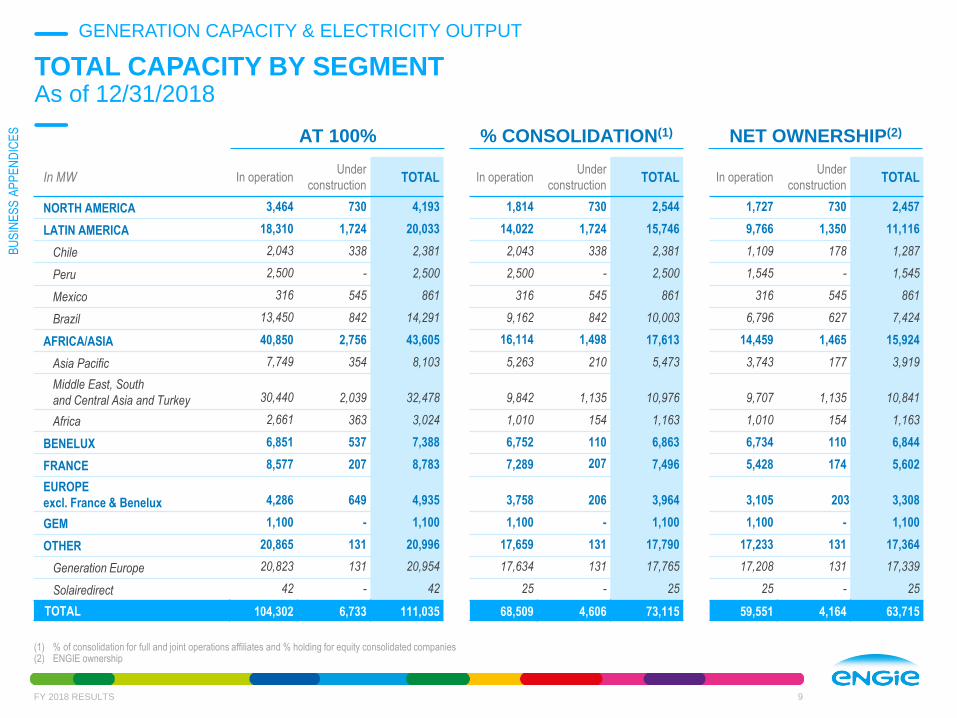
TOTAL CAPACITY BY SEGMENTAs of 12/31/2018
9
(1) % of consolidation for full and joint operations affiliates and % holding for equity consolidated companies(2) ENGIE ownership
In MW In operationUnder
constructionTOTAL In operation
Under
constructionTOTAL In operation
Under
constructionTOTAL
NORTH AMERICA 3,464 730 4,193 1,814 730 2,544 1,727 730 2,457
LATIN AMERICA 18,310 1,724 20,033 14,022 1,724 15,746 9,766 1,350 11,116
Chile 2,043 338 2,381 2,043 338 2,381 1,109 178 1,287
Peru 2,500 - 2,500 2,500 - 2,500 1,545 - 1,545
Mexico 316 545 861 316 545 861 316 545 861
Brazil 13,450 842 14,291 9,162 842 10,003 6,796 627 7,424
AFRICA/ASIA 40,850 2,756 43,605 16,114 1,498 17,613 14,459 1,465 15,924
Asia Pacific 7,749 354 8,103 5,263 210 5,473 3,743 177 3,919
Middle East, South
and Central Asia and Turkey 30,440 2,039 32,478 9,842 1,135 10,976 9,707 1,135 10,841
Africa 2,661 363 3,024 1,010 154 1,163 1,010 154 1,163
BENELUX 6,851 537 7,388 6,752 110 6,863 6,734 110 6,844
FRANCE 8,577 207 8,783 7,289 207 7,496 5,428 174 5,602
EUROPE
excl. France & Benelux 4,286 649 4,935 3,758 206 3,964 3,105 203 3,308
GEM 1,100 - 1,100 1,100 - 1,100 1,100 - 1,100
OTHER 20,865 131 20,996 17,659 131 17,790 17,233 131 17,364
Generation Europe 20,823 131 20,954 17,634 131 17,765 17,208 131 17,339
Solairedirect 42 - 42 25 - 25 25 - 25
TOTAL 104,302 6,733 111,035 68,509 4,606 73,115 59,551 4,164 63,715
FY 2018 RESULTS
% CONSOLIDATION(1) NET OWNERSHIP(2)
BU
SIN
ES
S A
PP
EN
DIC
ES
GENERATION CAPACITY & ELECTRICITY OUTPUT

In MWBiomass
and biogas Coal Hydro Natural gas Nuclear
Other non
renewable Solar WindTOTAL
NORTH AMERICA 113 - - 2,465 - 3 223 659 3,464
LATIN AMERICA 99 1,949 12,201 1,906 - 1,327 238 589 18,310
Chile - 1,052 44 673 - 163 63 48 2,043
Peru - 125 255 917 - 1,164 40 - 2,501
Mexico - - - 316 - - - - 316
Brazil 99 773 11,903 - - - 134 541 13,450
AFRICA/ASIA 30 2,265 152 35,799 - 1,483 668 453 40,850
Asia Pacific 30 1,015 152 5,715 - 478 312 46 7,748
Middle East, South
and Central Asia and Turkey- - - 30,084 - - 356 - 30,440
Africa - 1,250 - - - 1,004 - 407 2,661
BENELUX - - - - 6,429 - 16 406 6,851
FRANCE 106 22 3,928 1,085 - 301 991 2,144 8,577
EUROPE
excl. France & Benelux11 88 2,295 651 - 60 23 1,157 4,286
GEM - - - 1,100 - - - - 1,100
OTHER 305 2,855 1,306 14,815 - 1,541 42 - 20,865
Generation Europe 305 2,855 1,306 14,815 - 1,541 - - 20,823
Solairedirect - - - - - - 42 - 1,168
TOTAL 664 7,179 19,883 57,822 6,429 4,715 2,201 5,409 104,302
TOTAL CAPACITY BY SEGMENT AND BY TECHNOLOGYAs of 12/31/2018, at 100%
10FY 2018 RESULTS
BU
SIN
ES
S A
PP
EN
DIC
ES
GENERATION CAPACITY & ELECTRICITY OUTPUT

EXPECTED COMMISSIONING OF CAPACITY UNDER CONSTRUCTIONAs of 12/31/2018, at 100%
11FY 2018 RESULTS
In MW 2019 2020 2021 TOTAL
NORTH AMERICA 534 196 - 730
LATIN AMERICA 1,507 217 - 1,724
Chile 338 - - 338
Mexico 328 217 - 545
Brazil 842 - - 842
AFRICA/ASIA 2,402 354 - 2,756
Asia Pacific 263 91 - 354
Middle East, South
and Central Asia and Turkey 2,039 - - 2,039
Africa 100 263 - 363
BENELUX 50 - 487 537
FRANCE 207 - - 207
EUROPE
excl. France & Benelux 441 208 - 649
GEM - - - -
OTHER 131 - - 131
Generation Europe 131 - - -
TOTAL 5,271 974 487 6,733
BU
SIN
ES
S A
PP
EN
DIC
ES
GENERATION CAPACITY & ELECTRICITY OUTPUT

EXPECTED COMMISSIONING OF CAPACITY UNDER CONSTRUCTIONBY MAIN PROJECTAs of 12/31/2018, at 100%
12FY 2018 RESULTS
In MW 2019 2020 2021 TOTAL
SOLAR 1,035 121 - 1,156
Paracatu - Brazil 158 - - 158
NTPC Kadapa - India 250 - - 350
Villa Ahumada - Mexico 150 - - 150
Trompezon - Mexico 126 - - 126
WIND 1,790 762 487 3,040
Solomon Forks - USA 277 - - 277
East Fork - USA - 196 - 196
Umburanas - Brazil 360 - 360
Willogoleche - Australia 119 - - 119
SECI - India 252 - - 252
Seamade - Belgium - - 487 487
Las Majas – Spain 237 - - 237
OTHER RENEWABLE 80 91 - 171
Rantau Dedap - Indonesia - 91 - 91
NATURAL GAS 1,644 - - 1,644
Fadhili – Saudi Arabia 1,507 - - 1,507
Vilvoorde - Belgique 96 - - 96
THERMAL CONTRACTED 661 - - 661
Mejilones – Chile 338 - - 338
Pampa Sul – Brazil 324 - - 324
TOTAL(1) 5,271 974 487 6,733
BU
SIN
ES
S A
PP
EN
DIC
ES
(1) Including hydro (2 MW in 2019), other non renewable (52 MW in 2019) and biomass & biogas (7 MW in 2019)
o/w
o/w
o/w
GENERATION CAPACITY & ELECTRICITY OUTPUT
o/w

420 TWh
7% 1%
1%63%
3%
17%
7%1%
At 100% 70%
international
30%
Europe
91%
low CO2 emissions
21%
renewable(1)
% consolidation(2) 54%
international
46%
Europe
87%
low CO2 emissions
25%
renewable(1)
Net ownership(3) 52%
international
48%
Europe
89%
low CO2 emissions
21%
renewable(1)
254 TWh 46%
2%10%
19%
20%
3%
221 TWh
8%2%
14%
53%
3%
17%
2%
254 TWh
10% 2%
2%49%
3%
21%
12%
221 TWh 48%
2%9%
22%
16%
3%
TOTAL GENERATION OUTPUT BREAKDOWNBY GEOGRAPHIC AREA AND TECHNOLOGYAs of 12/31/2018
13
(1) Excluding pumped storage for hydro output(2) % of consolidation for full consolidated and joint operations affiliates and % holding for equity consolidated companies(3) ENGIE ownership
FY 2018 RESULTS
META Asia
Latin America
Oceania
420 TWh
30%
1%8%
41%
16%
4%
Natural gas Hydro Wind Complex/other RES
CoalNuclearSolar
1%
1%
BU
SIN
ES
S A
PP
EN
DIC
ES Europe North America
GENERATION CAPACITY & ELECTRICITY OUTPUT
Other non-renewable

In TWh At 100% % consolidation(1) Net ownership(2)
NORTH AMERICA 15.4 7.5 7.0
LATIN AMERICA 67.8 50.2 36.1
Chile 5.3 5.3 2.7
Peru 5.2 5.2 3.2
Mexico 2.5 2.5 2.5
Brazil 54.7 37.2 27.6
AFRICA/ASIA 208.6 79.0 71.1
Asia Pacific 28.9 22.4 14.8
Middle East, South
and Central Asia and Turkey 177.1 55.5 55.2
Africa 2.6 1.1 1.1
BENELUX 31.4 31.3 31.2
FRANCE 24.3 22.7 14.9
EUROPE
excl. France & Benelux 6.7 5.9 5.1
GEM 7.6 7.6 7.6
OTHER 58.7 49.7 48.2
Generation Europe 58.6 49.7 48.1
Solairedirect 0.1 0.0 0.0
TOTAL 420.4 253.9 221.2
ELECTRICITY OUTPUT BY SEGMENTAs of 12/31/2018
14
(1) % of consolidation for full and joint operations affiliates and % holding for equity consolidated companies(2) ENGIE ownership
FY 2018 RESULTS
BU
SIN
ES
S A
PP
EN
DIC
ES
GENERATION CAPACITY & ELECTRICITY OUTPUT

In TWhBiomass
and biogas Coal Hydro Natural gas Nuclear
Other non
renewable Solar WindTOTAL
NORTH AMERICA 0.7 - - 5.4 - 0.3 0.3 0.8 7.5
LATIN AMERICA 0.5 7.3 33.4 7.2 - 0.4 0.3 1.1 50.2
Chile - 3,6 0.1 1.3 - 0.0 0.1 0.1 5.3
Peru - 0.0 1.4 3,3 - 0.3 0.1 - 5.2
Mexico - - - 2.5 - - - - 2.5
Brazil 0,5 3.7 31.9 - - 0.0 0.1 1.0 37.2
AFRICA/ASIA - 8.4 0.4 68.2 - 0.5 0.6 0.9 79.0
Asia Pacific - 8,2 0.4 13.5 - 0.2 0.1 0.1 22.4
Middle East, South
and Central Asia and Turkey- - - 54.8 - 0.2 0.5 - 55.5
Africa - 0,3 - - - 0.1 - 0.7 1.1
BENELUX - - - - 30.7(1) - 0.0 0.6 31.3
FRANCE 0.7 0.1 16.3 1.8 - 0.6 0.5 2.6 22.7
EUROPE
excl. France & Benelux0.1 0.1 2.5 1.5 - 0.0 0.0 1.8 5.9
GEM - - - 7.6 - - - - 7.6
OTHER 1.9 10.0 1.1 32.2 - 4.4 0.0 - 49.7
Generation Europe 1.9 10.0 1.1 32.2 - 4.4 - - 49.7
Solairedirect - - - - - - 0.0 - 0.0
TOTAL 3.9 25.9 53.7 124.0 30.7 6.3 1.8 7.6 253.9
ELECTRICITY OUTPUT BY SEGMENT AND BY TECHNOLOGYAs of 12/31/2018, in % of consolidation
15
(1) o/w France 7.6 TWh and Germany 2.3 TWh
FY 2018 RESULTS
BU
SIN
ES
S A
PP
EN
DIC
ES
GENERATION CAPACITY & ELECTRICITY OUTPUT

CO2

CO2 EMISSIONS: A -26% DROP IN 2018 VS 2017 OF DIRECT EMISSIONS DUE TO DECREASING COAL FIRED ASSETS
In Mt
Direct emissions
of greenhouse gases in 201865.8
of which direct emissions
of greenhouse gases under
the EU-ETS system (estimate)
29.3
Allocation of bonus quotas 0.8
2018 - UNAUDITED FIGURES
COVERAGE OF CO2 EMISSIONS
CO2
24.2 Mt (38%)
29.3 Mt (46%)
10 Mt (16%)
2018 GHG (scope 1) FROM ENERGY GENERATIONSPLIT BY FUEL
Coal
Gas
Other
63.6 Mt CO2
FY 2018 RESULTS 17

SUSTAINABILITY

2018 RESULTS CONFIRMING LONG TERM CSR AMBITION
Objective Key Performance Indicator FY 2015 FY 2016 FY 2017 FY 2018 2020 target
1) Supporting our customersin the energy transition
Satisfaction rate among our B2C customers NA 81% 83% 81% 85%
2) RenewableShare of renewable energy in the electricity generation capacity
18.3% 19.5% 23.1% 23.7% 25%
3) Greenhouse gas emissions% reduction in ratio of CO2 emissions to energy production compared with 2012
+0.6% -11.3% -18.1% -28.7% -20%
4) Stakeholder dialogue % of industrial activities covered by a suitable dialogue and consultation mechanism
NA 20% 48% 53% 100%
5) Gender diversity % of women in the Group’s workforce 21.6% 21.9% 22.2% 21.1% 25%
6) Health and safetyInternal frequency rate for occupational accidents
3.6 3.6 3.3 3.4 < 3
ENGIE committed in 2016 to 6 ambitious CSR objectives to be achieved by 2020
• To support its strategic ambition and demonstrate its impacts on society
CSR governance designed to ensure commitment across the Group
• CSR performance reviews led by CSR Department with Business Units
19
SUSTAINABILITY
FY 2018 RESULTS

CONTRIBUTION OF ENGIE CSR OBJECTIVES TO UNITED
NATIONS SUSTAINABLE DEVELOPMENT GOALS
ENGIE CSR objectives support the Group’s ambition of energy transition leaderships and contribute
to the global sustainable development priorities defined by the United Nations
(1) By 2020(2) By 2020, vs 2012 level
25%(1) renewable energy in the generating
capacity mix, new renewable projects,
sustainable energy access for all (~3 million
beneficiaries of “Rassembleurs d’Energies”
projects as of End 2018), 20 million(1)
beneficiaries of sustainable-energy access
programs at the “Base of the Pyramid”
Support our customers in the energy transition
(B2C satisfaction rate above 85%(1)), develop
Stakeholder Engagement (all industrial activities
covered by a suitable dialogue(1)), objective of
100% of target sites with an integrated
environmental management plan drawn up in
collaboration with their stakeholders(1)
€1.5bn Expenditure in emerging & digital
technologies between 2016 and 2018, €165m
ENGIE New Ventures fund investing in
startups
Cut CO2 emissions ratio for energy
production by -20%(2), exit from coal power
generation
Objective of Health & Safety (internal
accident frequency rate below 3(1)), “our live-
saving rules” to reduce fatal accidents
Member of the CEO water mandate from 2008
Objective of gender diversity (25%(1) of
woman in the workforce)
ENGIE’s commitment to the French National
Strategy on Biodiversity (SNB) from 2012,
confirmed again in 2016, member of
Act4nature initiative
20
SUSTAINABILITY
FY 2018 RESULTS
2018 2018 2018 Climat 2018 Water 2018
82
44
7075
BBA
A
B -68
52
A-(1)
C(1)
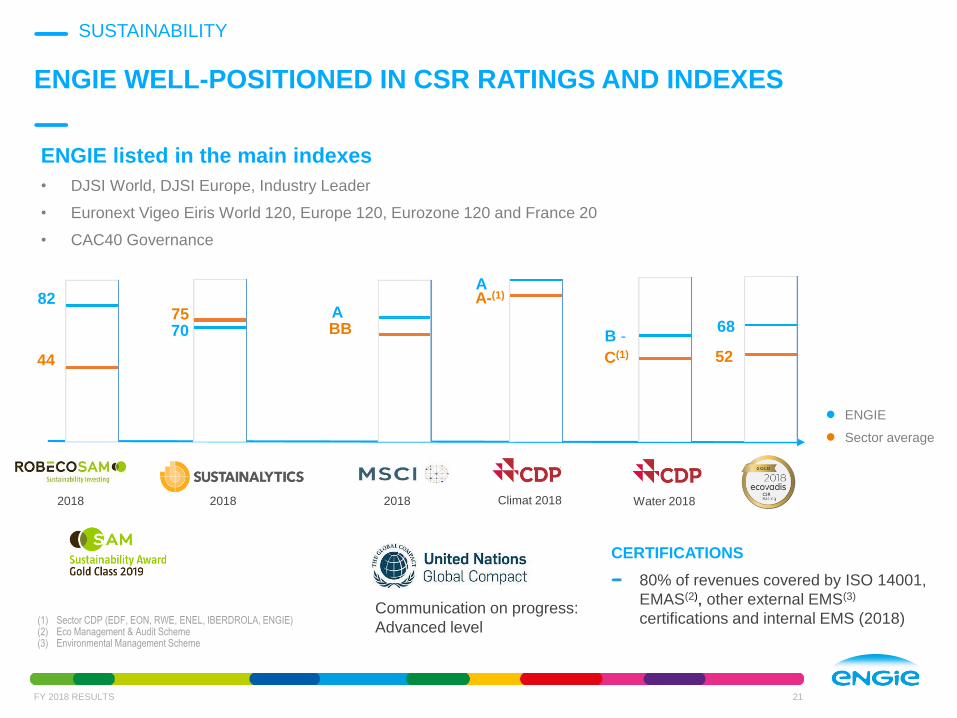
ENGIE WELL-POSITIONED IN CSR RATINGS AND INDEXES
ENGIE listed in the main indexes
• DJSI World, DJSI Europe, Industry Leader
• Euronext Vigeo Eiris World 120, Europe 120, Eurozone 120 and France 20
• CAC40 Governance
(1) Sector CDP (EDF, EON, RWE, ENEL, IBERDROLA, ENGIE)(2) Eco Management & Audit Scheme(3) Environmental Management Scheme
Communication on progress:
Advanced level
CERTIFICATIONS
80% of revenues covered by ISO 14001,
EMAS(2), other external EMS(3)
certifications and internal EMS (2018)
ENGIE
Sector average
21
SUSTAINABILITY
FY 2018 RESULTS

22
Measure
• manage customer’s carbon footprint
- energy data collection of industrial sites and CO2 neutral roadmap
- help develop inclusive, resilient, and transparent supply chain
Gain
• develop appropriate energy solutions for
every site
- focus on relevant sites & energy solutions
- quick wins for customer’s sustainability roadmap
- increase business profitability with relevant solutions
Sustain
• develop new territorial approaches to help customers being more sustainable
- innovate through circular economy, identify industrial synergies & effective business alliances
- implement comprehensive stakeholder engagement
- provide support in climate risk assessment, benchmark human & labor rights practices
ENGIE DECARBONIZATION ROADMAP: DELIVER GREENER COMPETITIVE SOLUTIONS FOR INDUSTRIAL CLIENTS
1
2
3
SUSTAINABILITY
FY 2018 RESULTS

Support to Operations
Kathu 100MW greenfield Concentrated Solar Power
project in South Africa
Sustainable Energy
— Saving 6 Mt of CO2 over 20 years operation
— Reliably able to supply over 179,000 South African
homes with stable electricity during peak demand
periods
Local acceptation of the project
— Promote local development through community
investment projects; and economy through local
procurement and employment
— Stakeholder engagement and conflict management
support given during construction period
— Project successfully delivered and started operation
in early February 2019
STAKEHOLDER ENGAGEMENT: A KEY LEVER TO IMPROVE THE BUSINESS
2018 result: 53%
Development of dedicated toolkit to support BUs
• Local context studies to identify main issues
• Stakeholder mapping for each issue, Stakeholder dialogue
action plan
Training programs for
• Business Developers / Project Managers, along with ENGIE
University
• Operational teams to prepare them for meetings with
communities
CSR corporate team bringing operational support to
projects worldwide
23
Objective to have 100 % of industrial activities
covered by a suitable dialogue & consultation
mechanism by 2020
SUSTAINABILITY
FY 2018 RESULTS

GREEN FINANCE TO SUPPORT ENGIE’S AMBITIOUS DEVELOPMENT STRATEGY IN RENEWABLE ENERGIES AND ENERGY EFFICIENCY
Green Bond: focus on some eligible projects allocated to September 2017 issuance
ENGIE aimed at being at the
forefront of the energy
transition with the acquisition
in 2018 a majority stake of
Electro Power Systems (EPS),
a pioneer in hybrid solution
storages.
EPS is a company specialized in
energy storage solutions and
microgrids that enable
intermittent renewable sources to
be transformed into a stable
power source. With the
transaction, both companies aim
at further accelerating their vision
to be at the forefront of the
energy transition, with special
focus on decentralized energy
solutions.
Renewable energy projects
ENGIE considerably expanded
its wind development portfolio
in the U.S by acquiring Infinity
Renewables, a leading
developer of utility-scale wind
projects in the United States.
The acquisition includes more
than 8,000 MW of projects in
various stages of development. In
end of 2018 ENGIE announced
the start of construction of the
276 MW Solomon Forks Wind
Project and the 196 MW East
Fork Wind Project in northwest
Kansas.
ENGIE confirmed in 2018 its
number one position in the
solar and wind energy sectors
in France with the acquisition
of the LANGA group
Founded in 2008, the LANGA
group, based in Brittany, is one of
the most active independent
producers of renewable energy,
simultaneously present in solar,
wind, biogas and biomass. The
group is developing 1.3 GW of
projects due to be completed by
2022.
Energy efficiency projects
24
ENGIE announced on 30
January 2019 the commercial
operation of the 100 MW Kathu
Solar Park in South Africa.
This state of the art plant is a
greenfield Concentrated Solar
Power (CSP) project with
parabolic trough technology and
equipped with a molten salt
storage system that allows for 4.5
hours of thermal energy storage
to provide reliable electricity in
the absence of solar radiation
and during peak demand. Kathu
is the first CSP development for
ENGIE.
SUSTAINABILITY
FY 2018 RESULTS

PROGRESS ON GREEN BOND ALLOCATION
€2.5bn allocated
at the end of 2016
48 projects funded
from 2014 to 2016
€1.25bn Green Bond issued in September 2017 fully allocated **
% FUNDS ALLOCATED BY TECHNOLOGY% FUNDS ALLOCATED BY GEOGRAPHICAL AREA
Africa
10,5%
Europe
53,3%Latin America
18,5%
Transmission 3,8%
Energy efficiency 10,1%
Biomass 4,1%
Energy storage
4,6%
Solar
30,9%
Wind
38,4%
Asia Pacific
2,4%
25* *provisional allocation before validation by auditors
North America
15,3%
BondsAmount issuance
[bnEUR]
Allocation
periodReporting
Impact (@100%)
[MTCO2]/year*
January 2019 1 NEW
January 2018 1 2018 - 2019
September 2017 1.25 2017 - 2018 2018 Registration document (ongoing)
March 2017 1.5 2016 - 2017 2017 Registration document 3.3
May 2014 2.5 2014 - 2016 2015 and 2016 Registration document 8.7
Green Mobility 6,8%
Geothermal 1%
District cooling 0,3%
* projects’ contributions to avoided or reduced emissions
SUSTAINABILITY
FY 2018 RESULTS25

OUTRIGHT POWER
GENERATION IN EUROPE
Nuclear & Hydro

CWE outright: EBITDA price sensitivity
+/- €1/MWh in achieved price
n ca. +/- €60m EBITDA impact before hedging
3-year rolling hedging policy
OUTRIGHT POWER GENERATION IN EUROPENuclear & Hydro
27
(1) Estimates, average hydro conditions
As of 12/31/18
France, Belgium
France
~35%
Belgium
~65%
~60
TWh/year(1)
66%
Forward outright prices Belgium baseload
3-year rolling hedging policy
CWE outright: forward prices and hedges
€/MWh
BU
SIN
ES
S A
PP
EN
DIC
ES
FY 2018 RESULTS
39%
OUTRIGHT POWER GENERATION IN EUROPE - NUCLEAR & HYDRO
Outright hedges: prices & volumes
In €/MWh
3735 36
42
46
2017 2018 2019 2020 2021
100%100% 77%
62%
31%

NETWORKS KPIs

GAS DISTRIBUTION AND TRANSPORT INFRASTRUCTURES WORLDWIDE
29
NETWORKS KPIs
Assets Remuneration CE 2018
MexicoT: 1,271 km pipelines
D: 0.5M customers & 11,184 km grid
T: Take or Pay contracts maturing >2025
D: Regulated (cost + based) adjusted by mix of
inflation, FX, capex, opex and other income,
reviewed each 5y
€0.51bn
ChileT: 1,070 km pipelines
D: 58 km gridT: Bilateral contracts €0.31bn
Argentina D: 0.7M customers & 12,412 km grid Regulated (cost+ based), adjusted for inflation €0.06bn
ThaïlandD: 300 industrial customers
& 273 km gridIndexed on oil €0.08bn
Germany T: 1,241 km pipelines Regulatory WACC €0.10bn
(associates)
RomaniaD: 1.8M customers
& 19,643 km grid
Regulatory WACC + incentives;
Price cap with yearly volume correction€0.77bn
TurkeyD: 0.3M customers
& 2,924 km gridPrice cap model (license until 2033) €0.01bn
FY 2018 RESULTS
NETWORKS

REPORTABLE
SEGMENTS

31
NORTH AMERICAStable EBITDA - better performance of Power Generation and positive scope fully offset by higher development costs and negative one-offs variation
(1) Total includes Other €(68)m (2) Sales figures are consolidated according
to accounting standards
(3) At 100%(4) End of Period(5) 2017 w/o volumes from US merchant assets sold
⚫ Client Solutions: Better performance in retail activities
offset by lower volumes on Canada Services
⚫ Power Generation:
- Commissioning of Holman solar farm in H2 2017
- Better prices in US North East due to cold weather
⚫ Others: 2017 insurance fees (one-off), higher
development costs
⚫ 6 acquisitions in RES & Client Solutions closed in 2018:
Longwood (DHC), Infinity (Wind), SoCore, Unity, Donnelly
and Plymouth Rock (Downstream)
Lean 2018
EBITDA 2019 Outlook
⚫ Commissioning and partial sell down of Live Oak (200
MW wind) and Solomon Forks (277 MW Wind)
⚫ Full year contribution of 2018 acquisitions
134
+25
(9) (4)
+13 +5
98
60
ClientSolutions
PowerGeneration
224
In €m 2017 2018 D 18/17 D org
Revenues 2,964 3,383 +14.1% +5.5%
COI including share in Net Income of Associates 174 151 -13.1% -20.1%
Gross CAPEX 316 974
Capital Employed(4) 1,718 2,494
2017 2018
Electricity sales(2) (TWh) 41.3 40.7
Installed capacity(3) (GW) 3.2 3.5
Electricity production(3) (5) (TWh) 14.5 15.4
Retail - B2B Power volumes (TWh) 37.6 38.2
Other KFIs KPIs
EBITDA
In €m
Scope FX2017 ClientSolutions
PowerGeneration
2018(1)Others
-7.5%
2018 vs 2017
224240
Gas
Gas
(30)
FY 2018 RESULTS
REPORTABLE SEGMENTS

NORTH AMERICAGeneration capacity and production as of 12/31/2018, at 100%
FY 2018 RESULTS 32
In MW In operation
Under
construction Total
USA 2,152 730 2,882
CANADA 805 - 805
PUERTO RICO 507 - 507
TOTAL 3,464 730 4,194
In TWh Total
USA 10.4
CANADA 2.0
PUERTO RICO 3.0
TOTAL 15.4
15.4 TWh
2%12%
77%
3.5 GW
installed
3% 19%
71%
7%
Natural gas
Wind
Biomass & biogas
Other non-renewable
Solar
4%5%
BREAKDOWN OF ELECTRICITY OUTPUTBREAKDOWN OF GENERATION CAPACITY
BU
SIN
ES
S A
PP
EN
DIC
ES
REPORTABLE SEGMENTS

EBITDA 2019 Outlook
⚫ Brazil: Improvement of hydrology, but lower spot prices affecting
uncontracted energy. COD of 900 MW in wind, solar and thermal
⚫ Latin America: LDCs tariff increase in Argentina & Mexico, COD
of IEM power plant in Chile.
1,709 1196 1,609 1196 1258 1266 1266
931
(100)
+47+90
(45)
+74
368
227
249
LATIN AMERICAStrong organic growth from energy management in Brazil (hydro allocation), new PPA in Chile and tariff increase in our LDCs, partially offset by lower margins in Peru
⚫ FX & Scope: Negative impact from EUR/BRL and EUR/USD,
partially compensated by scope impacts of hydro concessions
acquired in Brazil at the end of 2017 (Jaguara and Miranda).
⚫ Brazil:
- Better results from hydro allocation
- COD of Santa Monica and Campo Largo (wind) and Assu and
Floresta (solar)
⚫ Latin America:
- Chile: higher volumes with the start of new PPA with distribution
companies in January 2018
- Peru: end of high margin PPAs (Las Bambas and SPCC) during
2017 and one-off effect of Las Bambas penalty received in
2017
- Mexico and Argentina: tariff increase in the LDCs
Lean 2018
+11.1%
In €m 2017 2018 D 18/17 D org
Revenues 4,383 4,639 +5.8% +17.1%
COI including share in Net Income of Associates 1,277 1,355 +6.2% +12.9%
Gross CAPEX 2,241 1,758
Capital Employed(3) 9,281 9,897
2017 2018
Electricity sales(1) (TWh) 59.3 62.6
Gas sales(1) (TWh) 28.9 34.3
Electricity production(2) (TWh) 66.1 67.8
Latam: Gas volume transported (MGJ) 147 147
Brazil - Average PLD price (BRL/MWh) 324 288
Brazil - GSF (%) 80.0 81.4
Other KFIs KPIs
EBITDA
In €m
(1) Sales figures are consolidated accordingto accounting standards
(2) At 100%
(3) End of Period
2018 vs 2017
Mexico & Others
Peru
Chile
Brazil
Forex& Scope
Chile Peru 2018Mexico & Others
Brazil2017
1,775
FY 2018 RESULTS 33
REPORTABLE SEGMENTS

LATIN AMERICAGeneration capacity and production as of 12/31/2018, at 100%
34
In MW In operation
Under
construction Total
BRAZIL 13,450 842 14,292
CHILE 2,043 338 2,381
PERU 2,500 2,500
MEXICO 316 545 861
TOTAL 18,310 1,724 20,034
In TWh Total
BRAZIL 54.7
CHILE 5.3
PERU 5.2
MEXICO 2.5
TOTAL 67.8
Natural gas
Hydro
Wind
Biomass & biogas
Coal
Other non-renewable
Solar
18.3 GW
installed
1%7% 11%
67%
3%
10%
1%
FY 2018 RESULTS
BREAKDOWN OF ELECTRICITY OUTPUTBREAKDOWN OF GENERATION CAPACITY
67.8 TWh
1% >1%11%
75%
2%
11%>1%
BU
SIN
ES
S A
PP
EN
DIC
ES
REPORTABLE SEGMENTS

KPIs
35
AFRICA/ASIAPhase out of coal assets in Australia partly offset organic growth of solar India and performance of gas distribution activities in Thailand
(1) Sales figures are consolidated according to accounting standards(2) At 100%
(3) Million Imperial Gallons per Day - installed capacity at 100%(4) End of Period
⚫ Scope : Sale of Loy Yang B in Jan. 2018 partly offset by
contribution of Tabreed in Middle-East (Sept. 2017) and B2X
acquisitions in Africa (ECAM Morocco, Thermaire & Ampair RSA,
Fenix)
⚫ MESCAT: 2017 positive one-offs (Fadhili contract closing and
positive Al Dur & MIRFA settlements of claims) more than offset
by 2018 positive one-offs and organic growth of solar in India.
⚫ Thailand: Lower energy margin and capacity revenues on
Glow offset by a positive price effect for PTT NGD.
⚫ Other : positive outcome of claims
Lean 2018
EBITDA 2019 Outlook
⚫ Closing of Glow disposal
⚫ CODs: Wind – Ras Ghareb (Egypt), SECI 3-4 (India),
Willogoleche (Australia), Sainshand (Mongolia); Solar – Kadapa
(India), Kathu (South Africa); Geothermal – Muara Laboh
(Indonesia); IPP/IWP – Fadhili (KSA)
⚫ End of the PPA in Baymina (Turkey) in March 2019
MESCAT
Australia
Thailand
In €m 2017 2018 D 18/17 D org
Revenues 3,939 4,014 +1.9% +5.0%
COI including share in Net Income of Associates 1,016 893 -12.1% +6.0%
Gross CAPEX 887 616
Capital Employed(4) 5,186 3,553
2017 2018
Electricity sales(1) (TWh) 44.8 35.2
Gas distributed (TWh) 13.6 14.7
Installed capacity(2) (GW) 40.2 40.8
Electricity production(2) (TWh) 211.4 208.6
Middle-East - Water desalination capacity (MIGD)(3) 1,160 1,208
Other KFIs
EBITDA
In €m
2018 vs 2017
Others
1,2721,061
486
(171) (40)
+30 (0) +1+30
187
440
9
2017 Scope FX MESCAT Australia Thailand Others 2018
+6.0%
1,122
FY 2018 RESULTS
REPORTABLE SEGMENTS

AFRICA/ASIAGeneration capacity and production as of 12/31/2018, at 100%
36
In MW
In
operation
Under
construction Total
AUSTRALIA 1,015 119 1,134
BAHRAIN 3,117 - 3,117
CHINA 331 2 333
EGYPT - 263 263
INDIA 356 532 888
INDONESIA - 171 171
KUWAIT 1,539 - 1,539
LAO PDR 152 - 152
MONGOLIA - 55 55
MOROCCO 1,566 - 1,566
OMAN 3,693 - 3,693
In MW
In
operation
Under
construction Total
PAKISTAN 932 - 932
QATAR 3,755 - 3,755
SAUDI ARABIA 6,072 1,507 7,579
SINGAPORE 3,201 - 3,201
SOUTH
AFRICA1,095 100 1,195
THAILAND 3,050 7 3,057
TURKEY 1,243 - 1,243
UAE 9,733 - 9,733
TOTAL 40,850 2,756 43,606
208.6 TWh
4% >0%1%
94%
1%
Solar
Natural gas
Hydro
Wind
Biomass & biogas
Coal
Other non-renewable
In TWh Total
AUSTRALIA 3.4
BAHRAIN 16.5
CHINA 0.3
INDIA 0.5
KUWAIT 12.9
LAO PDR 0.4
MOROCCO 2.0
OMAN 18.5
PAKISTAN 6.8
FY 2018 RESULTS
BREAKDOWN OF ELECTRICITY OUTPUTBREAKDOWN OF GENERATION CAPACITY
In TWh Total
QATAR 16.1
SAUDI ARABIA 49.5
SINGAPORE 8.9
SOUTH AFRICA 0.7
THAILAND 15.9
TURKEY 4.2
UAE 52.1
TOTAL 208.6
BU
SIN
ES
S A
PP
EN
DIC
ES
40.8 GW
installed
4% 6% >0%1%
88%
2%
REPORTABLE SEGMENTS
>0%

37
550(16)
(706) (14)
BENELUXStrong decrease of nuclear volumes and lower achieved prices
(1) Nuclear €(543)m, RES €+39m and Client Solutions €+351m (2) Sales figures are expressed in contributive & exclude Giants sales
(3) At 100% (5) End of Period(4) In Belgium
⚫ Client Solutions:
- B2C Belgium: performance negatively affected by lower
margins; but positive net churn in gas and electricity
- Services: good performances of the Belgian activities but
difficulties in Fabricom International Operations and Service
NL
⚫ Nuke power Generation Belgium: lower availability (52% in
2018 vs 77% in 2017) due to several unplanned outages and
lower achieved prices
Lean 2018
EBITDA 2019 Outlook
⚫ Nuke: improved availability at 74%. 2019 hedge cover ratio
(Be+Fr) at 78% (as of 31/12/2018). End of the E.On swap in
April 2019 (290 MW)
In €m 2017 2018 D 18/17 D org
Revenues 6,771 6,690 -1.2% -1.9%
COI including share in Net Income of Associates -11 -765 n/a n/a
Gross CAPEX 694 925
Capital Employed(5) -3,019 -3,759
2017 2018
Electricity sales(2) (TWh) 47.7 38.2
Gas sales(2) (TWh) 49.4 52.0
Electricity production(3) (TWh) 44.5 31.4
Nuclear plants availability(4) 77% 52%
Outright nuclear achieved price (€/MWh) 36.2 34.5
Nuclear production (TWh) 43.8 30.7
-186
Other KFIs KPIs
EBITDA
In €m
Client solutions
Power Generation Others
2018 vs 2017
2017 2018(1)
30
24
FY 2018 RESULTS
REPORTABLE SEGMENTS

NUCLEAR CAPACITYAs of 12/31/2018
38
(1) Net of third party capacity and drawing rights. Tihange 1, Doel 1 & Doel 2 extended for 10 years (Tihange 1 until 10/01/2025, Doel 1 until 02/15/2025 and Doel 2 until 12/01/2025)
4.9
0.5
0.5
4.9
1.2
0.3
6.4 GW
net capacity
In Belgium, ENGIE operates 5.9 GW through 7 units
(to reach 40/50-year lifetime between 2022 and 2025)
5.9 GW
operated
Germany
France
Belgium
EDF Luminus
EDF
ENGIE
BELGIAN OPERATED CAPACITY BY OWNER(1)
ENGIE: 6.4 GW(1) IN BELGIUM, FRANCE
AND GERMANY
REPORTABLE SEGMENTS
FY 2018 RESULTS

Contracts(1) (Million) Sales(2) (TWh)
Gas Electricity Gas Electricity
TOTAL BENELUX 1.8 3.0 52.0 33.4
of which Belgium 1.5 2.7 38.8 22.7
of which Netherlands 0.3 0.3 13.2 10.7
BENELUXBreakdown of electricity and gas sales to final customers
39
Electricity
Electricity
13.5 14.8 17.1 17.9
2015 2016 2017 2018
21.7 22.2 19.9 20.9
2015 2016 2017 2018
11.7 11.29.1 9.1
2015 2016 2017 2018
Gas at real climate
Gas at real climate
(1) Number of contracts is consolidated at 100%, excluding entities at equity method (3) In 2018, Local Business Accounts (small professionals) transferred from B2C to B2B(2) Sales figures are consolidated according to accounting rules, Group contribution (2017 restated for comparison purposes).
BELGIUM - B2B SALES(3) (TWh)
BELGIUM - B2C SALES (3) (TWh)
REPORTABLE SEGMENTS
13.7 13.2 13.1 13.6
2015 2016 2017 2018
FY 2018 RESULTS

40
FRANCESignificant wind & solar sell-downs and better hydro conditions partially offset byunfavorable temperature and decrease in retail gas margins
(1) Excludes Giants sales(2) At 100%(3) End of Period
1,461 1,465
+4+164 +40
496
1,173
1,669
+14.2%Client solutions
France Renewables
2017 2018
Electricity sales(1) (TWh) 34.3 39.0
Gas sales(1) (TWh) 94.7 88.3Renewable - Installed capacity2) (GW) 5.9 6.9Renewable - Electricity production(2) (TWh) 15.6 20.8
CNR achieved price (€/MWh) 40.1 36.4
CNR hydro production (TWh) 10.8 14.4Services - Net commercial development (€m/y) 148 96Installations - Backlog (€m) 4,142 4,416
Other KFIs KPIs
EBITDA
In €m
Scope& Forex
2018France Renewables
ClientSolutions
In €m 2017 2018 D 18/17 D org
Revenues 14,157 15,183 +7.2% +4.4%
COI including share in Net Income of Associates 869 1,034 +19.0% +18.3%
Gross CAPEX 1,067 1,322
Capital Employed(3) 5,890 6,300
2018 vs 2017
2017
⚫ Scope in: B2B acquisitions (MCI 12/17, Icomera 6/17, Eras
03/18, CNN MCO 9/17)
⚫ Scope out: Renewables 2017’s sell-downs impact
⚫ Renewables:
- CNR: better hydrology conditions in 2018
- Wind & solar : significant sell-downs in 2018 (wind assets from
La Compagnie du Vent, wind offshore projects from Yeu-
Noirmoutier and Dieppe-Le Tréport)
⚫ Client Solutions:
- B2C: Strong negative temperature effect, Lower gas margin,
increase in retail power sales
- B2B: increase in profitability in installation business
Lean 2018
EBITDA 2019 Outlook
⚫ B2B: organic & external growth expected
⚫ B2C: margin squeeze mainly due to energy tariff freeze
FY 2018 RESULTS
REPORTABLE SEGMENTS

FRANCEGeneration capacity and production as of 12/31/2018, at 100%
41
24.3 TWh
In MW In operation
Under
construction Total
FRANCE 8,195 207 8,402
FRENCH POLYNESIA 284 - 284
MONACO 3 - 3
NEW CALEDONIA 63 - 63
VANUATU 24 - 24
WALLIS AND FUTUNA 9 - 9
TOTAL 8,578 207 8,785
In TWh Total
FRANCE RENEWABLES 20.8
FRANCE NETWORKS 1.7
FRANCE BTOB 1.7
TOTAL 24.3
3% 3%
Natural gas
Hydro
Wind
Biomass & biogas
Other non-renewable
Solar
67%
4%
8%
8.6 GW
installed
1%4%
>0%
46%
25%
13%
12%
15%
Coal
FY 2018 RESULTS
BREAKDOWN OF ELECTRICITY OUTPUTBREAKDOWN OF GENERATION CAPACITY
BU
SIN
ES
S A
PP
EN
DIC
ES
REPORTABLE SEGMENTS

7.1 7.9 10.4 12.515.8
18.9
2013 2014 2015 2016 2017 2018
127.996.2 99.6 102.6 94.7 88.3
2013 2014 2015 2016 2017 2018
Electricity
FRANCEBreakdown of electricity and gas sales to final customers
FY 2018 RESULTS 42
(1) Of which public distribution tariffs: 114.1 TWh in FY 2013; 78.8 TWh in FY 2014; 68.4 TWh in FY 2015; 67.3 TWh in 2016, 56.5 TWh in 2017, 47,7 TWh in 2018
Gas at real climate(1)
● Development of B2C power sales, market share increased to 12%● 2018 vs 2017 : Decrease due to loss in the residential gas customer
base market share (68%), and to a unfavorable temperature effect
Contracts (Million) Sales (TWh)
Gas Electricity Gas Electricity
France 7.4 4.3 88.3 18.9
B2C SALES (TWh)
REPORTABLE SEGMENTS

Thousands of contracts
163
368
500
724
880
939
1,02
2
1,16
7
1,32
2
1,47
6
1,60
5
1,73
8
1,94
5
2,13
8
2,37
7
2,54
7
2,71
3
3,00
1
3,31
8
3,58
8
3,82
2
4,04
1
7781 84
8485 85 86 85
8686 86 88
90101
118141
161183
207222
237245
jun-
08
dec-
08
jun-
09
dec-
09
jun-
10
dec-
10
jun-
11
dec-
11
jun-
12
dec-
12
jun-
13
dec-
13
jun-
14
dec-
14
jun-
15
dec-
15
jun-
16
dec-
16
jun-
17
dec-
17
jun-
18
dec-
18
FRANCEResidential & small business customers portfolio in France
FY 2018 RESULTS 43
Portfolio of 184,000 contracts at end 2018, decrease of
10,000 contracts since end 2017
Household• Increased by 453,000 contracts since end 2017
• The growth in electricity exceeds the decrease in gas
Small businessIncreased by 23,000 contracts since end 2017
HOUSEHOLD & SMALL BUSINESSMillions of contracts
HOUSEHOLD
Decreased by 334,000 contracts since end 2017
SMALL BUSINESS
ENGIE Competitors
10.2
10.0
9.9
9.8
9.7
9.6
9.4
9.3
9.2
9.1
9.0
8.8
8.7
8.5
8.4
8.2
8.0
7.8
7.7
7.5
7.4
7.2
0.1
0.3
0.5
0.6
0.7
0.7
0.9
1.0
1.1
1.2
1.3
1.4
1.6
1.8
1.9
2.1
2.3
2.5
2.6
2.8
2.9
3.1
jun-
08
dec-
08
jun-
09
dec-
09
jun-
10
dec-
10
jun-
11
dec-
11
jun-
12
dec-
12
jun-
13
dec-
13
jun-
14
dec-
14
jun-
15
dec-
15
jun-
16
dec-
16
jun-
17
dec-
17
jun-
18
dec-
18
Mill
ions
of c
ontr
acts
Household Small business
ELECTRICITY GAS
REPORTABLE SEGMENTS

44
2017 2018
Electricity sales(1) (TWh) 30.3 29.1
Gas sales(1) (TWh) 71.1 70.6
Renewable - Installed capacity(2) (GW) 1.3 1.3
Renewable - Electricity production(2) (TWh) 2.7 2.9
Romania - Gas distributed (GWh) 46.2 45.8
EUROPE (excluding FRANCE & BENELUX)Higher margins in Romania along with a better operational performance in Germany, Italy and Keepmoat contribution in UK
(1) Excludes Giants sales & contributive Group(2) At 100%
(3) End of Period
⚫ Scope& Forex: Scope In: UK (Keepmoat Regeneration),
Italy (Conversional Lighting), Switzerland (Priora); Scope
out Hungary (DSO); negative FX impact UK and Romania
⚫ Romania: higher energy margins in free market
⚫ Germany : Good performance in Services
⚫ Italy: energy sales increase, retail bad debt improvement
⚫ UK: Keepmoat Regeneration growth
Lean 2018
EBITDA 2019 Outlook
⚫ Romania: new gas market regulation
⚫ Italy: continuing development of Public Lighting
⚫ Germany: integration of OTTO service company (700
people)
⚫ UK: strong order book, new contracts contributions (Queen
Alexandra hospital, Kingstom University)
650 639
(11)
+11 +11 +6 +8 +4
140
126
115
227
71
+6,5%
Germany
Italy
UK
Others
679
Romania
Other KFIs KPIs
EBITDA
In €m
Scope& Forex
2018Germ. UKRoman. Italy Others
In €m2017 2018 D 18/17 D org
Revenues 8,831 9,527 +7.9% +5.1%
COI including share in Net Income of Associates 434 473 +9.0% +11.6%
Gross CAPEX 636 372
Capital Employed(3) 5,022 5,092
2018 vs 2017
2017
FY 2018 RESULTS
REPORTABLE SEGMENTS

14.2 TWh
1%
Natural gas
Hydro
Wind
Biomass & biogas
Other non-renewable
Solar
17%
64% 17%
Coal
EUROPE (excluding FRANCE & BENELUX)Generation capacity and production as of 12/31/2018, at 100%
FY 2018 RESULTS 45
In MW In operation Under construction Total
AUSTRIA 1 - 1
CZECH REPUBLIC 5 - 5
GERMANY 778 50 828
GREECE 148 - 148
HUNGARY <0 - 0
ITALY 1,386 - 1,386
NORWAY - 208 208
POLAND 138 5 143
PORTUGAL 493 25 518
ROMANIA 98 - 98
SLOVAKIA 0 - 0
SPAIN 102 354 456
SWITZERLAND - 7 7
UNITED KINGDOM 2,236 - 2,236
TOTAL 5,386 649 6,035
5.4 GW
installed
1% 2%
21%
33%
43%
>0% >0%
(1) Includes 1.1GW capacity in Italy managed by BU GEM (2) Includes 7.6 TWh output in Italy managed by BU GEM
BREAKDOWN OF ELECTRICITY OUTPUT(2)BREAKDOWN OF GENERATION CAPACITY(1)
In TWh TotalAUSTRIA <0
CZECH REPUBLIC <0
GERMANY 0.9
GREECE <0
HUNGARY <0
ITALY 8.5
POLAND 0.3
PORTUGAL 1.11
ROMANIA 0.24
SLOVAKIA 0.01
SPAIN 0.54
UNITED KINGDOM 2.55
TOTAL 14.22
BU
SIN
ES
S A
PP
EN
DIC
ES
1%
REPORTABLE SEGMENTS

EUROPE (excluding FRANCE & BENELUX)Breakdown of electricity and gas sales to final customers
FY 2018 RESULTS 46
(1) Number of contracts is consolidated at 100%, excluding entities at equity method
(2) Sales figures are consolidated according to accounting rules, Group contribution
(3) SME Romania (Power & Gas) classified as B2C in 2016 moved to B2B as from 2017
30.1 34.5 30.2 25.7 26.2
2014 2015 2016 2017 2018
40.0 39.938.0
45.4 44.8
2014 2015 2016 2017 2018
B2B
5.815.1
24.2 25.4 24.4
2014 2015 2016 2017 2018
B2B(3)
Gas at real climate Electricity
Gas at real climate Electricity
1.0 1.21.9 1.7 1.9
2014 2015 2016 2017 2018
Contracts(1) (Million) Sales(2) (TWh)
Gas Electricity Gas Electricity
TOTAL EUROPE exc. FR/BENELUX(3) 2.5 0.4 71.1 26.4
of which Romania 1.7 0.0 36.9 3.4
of which Italy 0.7 0.2 7.0 0.9
of which Germany 0.1 0.2 8.3 10.3
of which Others (UK mainly) 0.1 0.0 18.9 11.8
B2B SALES (TWh)(3)
B2C SALES (TWh)(3)
REPORTABLE SEGMENTS

47
INFRASTRUCTURES EUROPEPositive impact of new storage regulation in France partially offset by adverse temperatureand a negative one-off in French gas transmission activities
(1) Regulated Asset Base as of 01/01(2) CRE informed GRTgaz about its intention to set a new ATRT7 tariff one year in advance i.e. from 01/04/2020 (3) End of period
164
GRTgaz
Elengy
3,386
1,088
178448
(39)
+10
(1)
3,499
1,785
+143Storengy
GRDF
⚫ Tariffs: annual revision for distribution (-2.05% July 2017 and
+2.01% July 2018) transmission (-3.1% April 2017 and
+3.0% April 2018)
⚫ Transmission: Commercial Operation of Val de Saône North-
South gas pipe (Nov 1st, 2018), increase in short-term sales
of GRTgaz Germany, new high/low calorific gas swap
contract in Northern France area (interco with GEM, one-off
impact)
⚫ Distribution : negative temperature impact vs. last year (-7.4
TWh), 2017 commissioning provision, 2.5 million Gazpar
smart meters installed at end 2018
⚫ Elengy: Market success of new transhipment operations
⚫ Storage: new regulation in France (ATS1) as from January
1st 2018, high level of sales in UK
Lean 2018
EBITDA 2019 Outlook
⚫ Last year under ATRT6(2), ATRD5 & ATS1 regulation
2017 2018
Gas distributed (TWh) 283.7 277.5
Distribution RAB(1) (€bn) 14.4 14.5
Transmission RAB(1) (€bn) 8.3 8.2
LNG Terminals RAB(1) (€bn) 1.0 1.1
Storage RAB(1) (€bn) - 3.6
Temperature effect (TWh) -0.7 -8.1
Other KFIs KPIs
EBITDA2018 vs 2017
In €m
GRTgaz2017 2018ElengyGRDF Storengy
+3.3%
In €m 2017 2018 D 18/17 D Org
Revenues (including intra-Group) 6,712 6,859 2.2% 2.2%
Revenues 5,446 5,694 4.6% 4.6%
COI including share in Net Income of Associates 1,941 2,016 3.9% 3.8%
Gross CAPEX 1,718 1,619
Capital Employed(3) 19,914 19,802
FY 2018 RESULTS
REPORTABLE SEGMENTS

INFRASTRUCTURES EUROPESecured cash flows
FY 2018 RESULTS 48
Distribution France
Transmission
Storage
LNG terminals
€3,499m €1,619m
€21m
€929m
€486m
€183m€178m
€1,785m
€1,088m
€448m
2018 CAPEX BREAKDOWN 2018 EBITDA BREAKDOWN
REPORTABLE SEGMENTS

INFRASTRUCTURES EUROPERegulation in France
FY 2018 RESULTS 49
(1) For already decided projects; for new projects: ad hoc fixed premium(2) Estimate
(3) Géométhane, an Economic Interest Group shared equally by Géosud and Storengy
Period of regulation
CAPEX (in €m) RAB remuneration(real pre-tax) Type of tariff
Regulated asset base at
01/01/2018 (in €bn)(2)2017 2018
Distribution07/01/2016-
07/01/2020855 929
5.0%
+ incentives of 200bps
over 20yrs for Gazpar
Price cap
yearly update14.4
Transmission04/01/2017-
03/31/2021671 486
5.25%
+ incentives up to
300bps over 10yrs(1)
Cost +
yearly update8.2
LNG terminals04/01/2017-
03/31/202145 21
7.25%
+ incentives 125bps
(for Capex decided
in 2004-2008)
and 200bps for
extensions over 10yrs
Cost +
update every 2 years1.1
Storage (France)01/01/2018
03/31/2020147 183 5.75%
Cost +
yearly update
Storengy: 3.5
Géométhane(3): 0.19
TOTAL 1,718 1,619 27.3
REPORTABLE SEGMENTS

50
GEM New management set up for LT contracts & positive market evolution leading to strong results improvement
(1) Giants customers(2) End of Period
⚫ One-off 2017 losses in South of France
⚫ Favorable market and weather conditions in Europe in Q1
2018 (cold snap + low stock level in Feb) versus gas
congestion situation in February 2017 (South of France)
⚫ Value extraction from the new management set up of LT
gas supply contract management
⚫ Continuous effort on the cost base reduction
Lean 2018
EBITDA 2019 Outlook
⚫ Normalization of gas portfolio activities expected
⚫ Maximization of LT supply contracts performance under
the new management set up
⚫ Ongoing renegotiation of gas supply conditions
⚫ Active portfolio optimization and focus on cost savings
In €m 2017 2018 D 18/17 D org
Revenues 7,638 6,968 -8.8% -8.8%
COI including share in Net Income of Associates -229 199 +187.1% +186.8%
Gross CAPEX 346 45
Capital Employed(2) 611 1,102
2017 2018
GEM - Gas sales (TWh)(1) 51.0 55.6
GEM - Electricity sales (TWh)(1) 21.3 21.1
Other KFIs KPIs
EBITDA
In €m
2018 vs 2017
(188) (189)
240
(0.9)+40
+50
+339
2017
Scope&
Forex
2017.12Post Scope
& FX
One-off 2017 losses in
South France
Favorable weather
cond. 2018
Gas assets optimization
& other activities
2018
FY 2018 RESULTS
REPORTABLE SEGMENTS

GEMBreakdown of electricity and gas sales to final customers
FY 2018 RESULTS 51
Other Europe
Gas at real climate Electricity
Sales(1) (TWh)
Gas Electricity
TOTAL GEM 55.6 21.1
of which Belgium 8.5 9.6
of which Netherlands
of which France (2)
4.0
32.6
2.7
5.7
of which Europe exc. France & Benelux 10.5 3.2
● Increasing competition in all European markets for Giants customers, both on Power and Gas markets except for gas in Belgium & France
GIANTS SALES (TWh)
(1) Sales figures are consolidated according to accounting rules, Group contribution(2) Sales Power France in GEM since 01/01/2016; Previous years are restated
France(2) Netherlands Belgium
REPORTABLE SEGMENTS
12 9.715.3 11.2 8.5
18.4
7.75.3
4.1 4
41.3
24 17.8 25.4 32.8
14.8
12.611.6 10.3
10.5
86.5
54.0
50.0 51.055.6
2014 2015 2016 2017 2018
15.8 16.3
8.5 9.3 9.6
1.73.8
4 3.3 2.7
9.2
9.6
8 5.6 5.7
3.7
3.9
4.2
3.1 3.2
30.4
33.6
24.7
21.3 21.1
2014 2015 2016 2017 2018

52
OTHERSEBITDA increase mainly due to an increase in ancillaries services and positive one-offs more than offsetting the negative impact from disposal of thermal assets
(1) Including NewCorp, GBS, E&C, Innovation & New Businesses and SUEZ(2) At 100%
(3) End of Period
⚫ Scope-outs: Poland & UK coal assets
⚫ Generation:
- Increasing ancillaries revenues
- Positive one-offs (favorable outcomes of some litigations)
- Less favorable market conditions for spread power
generation in 2018
⚫ GTT: higher revenues but slight drop in margins
⚫ Others: lower corporate costs thanks to performance plan
Lean 2018
EBITDA 2019 Outlook
⚫ Further actions on Corporate costs
⚫ Commercial development of B2B supply in France
136
70
213
(66)
(7)
+68+0
+81
In €m 2017 2018 D 18/17 D org
Revenues 5,445 4,498 -17.4% -10.2%
COI including share in Net Income of Associates -300 -232 +22.8% +37.1%
Gross CAPEX 1,232 538
Capital Employed(3) 7,447 6,930
2017 2018
Electricity production(2) (TWh) 78.7 58.7
Generation - Load factor gas fleet 38% 31%
Generation - Load factor coal fleet 53% 46%
Tractebel Engineering - Backlog (€m) 771 778
Electricity sales to B2B customers (TWh) 25.0 24.3
Gas sales to B2B customers (TWh) 42.3 36.9
Other KFIs KPIs
EBITDA
In €m
Scope& Forex
Others(1)GTT Tractebel 2018Generation
2018 vs 2017
2017
FY 2018 RESULTS
+153%
REPORTABLE SEGMENTS

OTHERSBreakdown of electricity and gas sales to B2B customers
FY 2018 RESULTS 53
(1) Of which public distribution tariffs: 33.5 TWh in FY 2014; 1.9 TWh in FY 2015; 0.3 TWh in 2016; 0.4 TWh in 2017; 0.4 TWh in 2018
66.150.5 51.5
42.4 36.9
2014 2015 2016 2017 2018
10.1 11.5
23.6 25.0 24.3
2014 2015 2016 2017 2018
B2B
● Increasing competition on B2B gas sales/market share of 18% (B2B)
Gas at real climate(1) Electricity
Contracts (Thousand) Sales (TWh)
Gas Electricity Gas Electricity
France 50.9 126.4 36.9 24.3
B2B SALES (TWh)
REPORTABLE SEGMENTS

20.9 GW
installed
7%14%
71%
6%
1%
OTHERSGeneration capacity and production as of 12/31/2018, at 100%
54
In MW
In
operation
Under
construction Total
BELGIUM 4,960 131 5,091
FRANCE 2,191 - 2,191
GERMANY 1,660 - 1,660
GREECE 422 - 422
ITALY 3,547 - 3,547
58.7 TWh
21%
Natural gas
Hydro
Biomass & biogas
Other non-renewable
2%
66%
Coal
3%
8%
In MW
In
operation
Under
construction Total
NETHERLANDS 3,647 - 3,647
PANAMA 21 - 21
PORTUGAL 2,406 - 2,406
SOUTH AFRICA 21 - 21
SPAIN 1,990 - 1,990
TOTAL 20,865 131 20,996
FY 2018 RESULTS
BREAKDOWN OF ELECTRICITY OUTPUTBREAKDOWN OF GENERATION CAPACITY
In TWh Total
BELGIUM 16.2
FRANCE 6.0
GERMANY 5.3
GREECE 1.5
In TWh Total
ITALY 7.8
NETHERLANDS 12.3
PORTUGAL 9.1
SPAIN 0.3
TOTAL 58.7
BU
SIN
ES
S A
PP
EN
DIC
ES
REPORTABLE SEGMENTS

FINANCIAL APPENDICES
FY 2018 RESULTS
IMPACT OF WEATHER
IN FRANCE

-9.2
-4.1
Q1 Q2 Q3 Q4
+1.0+0.5
2018
FY 2018 CLIMATE ADJUSTMENT IN FRANCEIMPACT ON GAS SALES AND DISTRIBUTION
Sales – B2C/B2B: ~€10m EBITDA / TWh
Distribution - Infrastructures : ~€7m EBITDA / TWh
Sales (B2C/B2B): -3.6 TWh – Distribution (infras): -8.1 TWh
Sales - B2C/B2B Distribution - Infrastructures
SENSITIVITY
COOLER
WARMER
AVERAGECLIMATE
FY 2018 & FY 2017
-0.9-0.4
+2.2+1.0
Q1 Q2 Q3
2017 Sales (B2C/B2B): -0.3 TWh – Distribution (infras): -0.7 TWh
Q4
-2.9-1.4
+4.4+2.0
-1.6-0.8 -1.7-0.8
FY 2018 RESULTS 57
IMPACT OF WEATHER IN FRANCE

IMPACT OF WEATHER IN FRANCE
FY 2018 RESULTS 58
(1) Impact on Net Income Group share and Net Recurring Income Group share, with a normative income tax
Estimates, in €m
EBITDA Net income(1)
FY 2017 FY 2018 ∆ 18/17 FY 2017 FY 2018 ∆ 18/17
France B2C/B2B
Gas sales-3 -36 -33 -2 -24 -22
Infrastructures Europe
GRDF-5 -57 -52 -3 -37 -34
Total weather adjustment -8 -93 -85 -5 -61 -56
FIN
AN
CIA
L A
PP
EN
DIC
ES
IMPACT OF WEATHER IN FRANCE

CHANGE IN NUMBER
OF SHARES, SCOPE
& FOREX

CHANGE IN NUMBER OF SHARES
60
(1) Undiluted, excluding treasury stock
At 12/31/2017 At 12/31/2018
Existing shares 2,435,285,011 2,435,285,011
FY 2017 FY 2018
Average number of shares(1) 2,396 millions 2,396 millions
Recurring EPS €1.05 €1.01
Recurring EPS post hybrids coupons €0.99 €0.95
CHANGE IN NUMBER OF SHARES, SCOPE & FOREX
FY 2018 RESULTS

MAIN CHANGES IN CONSOLIDATION SCOPE
FY 2018 RESULTS 61
ACQUISITIONS
Keepmoat Regeneration – UK (EUROPE excl. FRANCE & BENELUX)Full consolidation since 04/30/2017
Icomera – Sweden (FRANCE)Full consolidation since 05/30/2017
Tabreed – UAE (AFRICA/ASIA)Equity method since 08/16/2017
CNN MCO – France (FRANCE) Full consolidation since 09/01/2017
Talen Group – USA (NORTH AMERICA)Full consolidation since 09/15/2017
ENGIE Brasil Energia Consolidated (CEMIG) – Brazil (BRAZIL)Full consolidation since 11/10/2017
MCI – France (FRANCE)Full consolidation since 12/29/2017
Unity International Group – USA (NORTH AMERICA)Full consolidation since 05/01/2018
Socore Energy – USA (NORTH AMERICA)Full consolidation since 04/16/2018
Thermaire&Ampair – (AFRICA/ASIA)Full consolidation since 02/01/2018
Engie Contracting Almaghrib – (AFRICA/ASIA)Full consolidation since 03/01/2018
Fenix – (AFRICA/ASIA)Full consolidation since 03/01/2018
Langa Group – France (FRANCE) Full consolidation since 07/18/2018
DISPOSALS / PARTIAL DISPOSALS
Polaniec – Poland (OTHER)Held for sale since 12/24/2016 to 03/14/2017
NuGeneration – UK (OTHER)Equity method until 07/25/2017
Merchant thermal Generation assets – UK (OTHER)Full consolidation until 06/30/2017
Held for sale since 07/01/2017 to 10/31/2017
Egaz-Degaz – Hungary (EUROPE excl. FRANCE & BENELUX)Full consolidation until 01/11/2018
Loy Yang B – Australia (APAC)Full consolidation until 12/30/2017
Held for sale since 12/31/2017 to 01/15/2018
Langa Group – France (FRANCE)Full consolidation since 07/18/2018
Held for sale since 12/31/2018
DISCONTINUED OPERATIONSE&P International (E&P)Discontinued operations since 05/11/2017 (retroactive to 01/01/2017
till 02/15/2018)
LNG Upstream activities (GEM & LNG)Discontinued operations since end of March 2018 (retroactive to 01/01/2018,
2017 figures restated accordingly)
FIN
AN
CIA
L A
PP
EN
DIC
ES
CHANGE IN SCOPE & FOREX
CHANGES IN METHODGlow Group – Thailand (APAC)Full consolidation until 06/29/2018
Held for sale since 06/30/2018

IMPACT OF FOREIGN EXCHANGE EVOLUTION
FY 2018 RESULTS 62
The average rate applies
to the income statement
and to the cash flow statement
The closing rate applies to the balance sheet
In €m Δ 18/17 GBP USD BRL THB Others TOTAL
REVENUES -35 -251 -345 +4 -302 -929
EBITDA -2 -59 -151 +1 -47 -258
COI after share in net income of entities
accounted for using the equity method-2 -44 -124 +1 -38 -207
TOTAL NET DEBT -1 152 -124 18 -26 +19
TOTAL EQUITY -20 125(1) -356 -9 240(1) -20
GBP USD BRL THB
FY 2018 average rate 1.13 0.85 0.23 0.026
FY 2017 average rate 1.14 0.89 0,28 0,026
D Average rate -0.9% -4.3% -16.3% +0.4%
Closing rate at 12/31/2018 1.12 0.87 0.23 0.027
Closing rate at 12/31/2017 1.13 0.83 0.25 0.025
D Closing rate -0.8% +4.7% -10.6% +5.1%
(1) Net of P&L recycling impact for disposals closed in FY 2018
FIN
AN
CIA
L A
PP
EN
DIC
ES
CHANGE IN NUMBER OF SHARES, SCOPE & FOREX

FY 2018 EBITDA/COI BREAKDOWN BY CURRENCY
FY 2018 RESULTS 63
(1) After share in net income of entities accounted for using the equity method
€5.1bn€9.2bn
THB/EUR0.03
AUD/EUR0.63
GBP/EUR1.13
BRL/EUR0.23
USD/EUR0.85
EUR5.57
FX40%
USD1.39
BRL0.93
0.280.20
0.29
Other0.57
USD1.02
BRL0.78
0.22
0.160.25
Other0.36
FX55%
EUR45%
EUR2.33
EUR60%
EBITDA FY 2018Amount in EUR after translation (average rate)
FX VS. EURAverage FY 2018
COI(1) FY 2018Amount in EUR after translation (average rate)
FIN
AN
CIA
L A
PP
EN
DIC
ES
CHANGE IN NUMBER OF SHARES, SCOPE & FOREX
BALANCE SHEET, P/L &
CASH FLOW STATEMENT

SUMMARY STATEMENTS OF FINANCIAL POSITION
65
FY 2018 Net Debt €22.5bn = Financial debt of €33.5bn - Cash & equivalents of €8.9bn - Financial assets valued at fair value through profit/loss of €1.6bn - Assets related to financing of €0.01bn(incl. in non-current assets) - Derivative instruments hedging items included in the debt of €0.3bn
In €bn
ASSETS 12/31/2017 12/31/2018 LIABILITIES 12/31/2017 12/31/2018
NON CURRENT ASSETS 92.4 91.7
Equity, Group share 36.3 35.6
Non-controlling interests 5.8 5.4
CURRENT ASSETS 57.7 62.0 TOTAL EQUITY 42.1 40.9
of which financial assets valued
at fair value through profit/loss0.0 0.0 Provisions 21.7 21.8
of which cash & equivalents 8.9 8.7 Financial debt 33.5 32.2
Other liabilities 52.8 58.8
TOTAL ASSETS 150.1 153.7 TOTAL LIABILITIES 150.1 153.7
FIN
AN
CIA
L A
PP
EN
DIC
ES
FY 2018 RESULTS
BALANCE SHEET, P/L & CASH FLOW STATEMENT

DETAILS OF SOME ASSETS AND PROVISIONS
66
Other
financial
assets
€3.9bn
Assets from
contracts with
customers
€7.4bn
Investments
in associates
& joint ventures
€7.8bn
Others
€3.0bn
Recycling and storage & site rehabilitation€6.4bn
Dismantling
€6.1bn
Pensions
€6.4bn
Total provisions
€21.8bn
PROVISIONS AS OF 12/31/2018DETAILS OF SOME ASSETS AS OF 12/31/2018
FIN
AN
CIA
L A
PP
EN
DIC
ES
FY 2018 RESULTS
BALANCE SHEET, P/L & CASH FLOW STATEMENT
• Equity instruments at fair
value through equity 0.7
• Equity instruments at fair
value through income 0.4
• Debt instruments at fair
value through equity 1.9
• Debt instruments at fair
value through income 0.8
Loans &
receivables at
amortized cost
€4.6bn
ECONOMIC NET DEBT / EBITDA
FY 2018 RESULTS 67
BALANCE SHEET, P/L & CASH FLOW STATEMENT
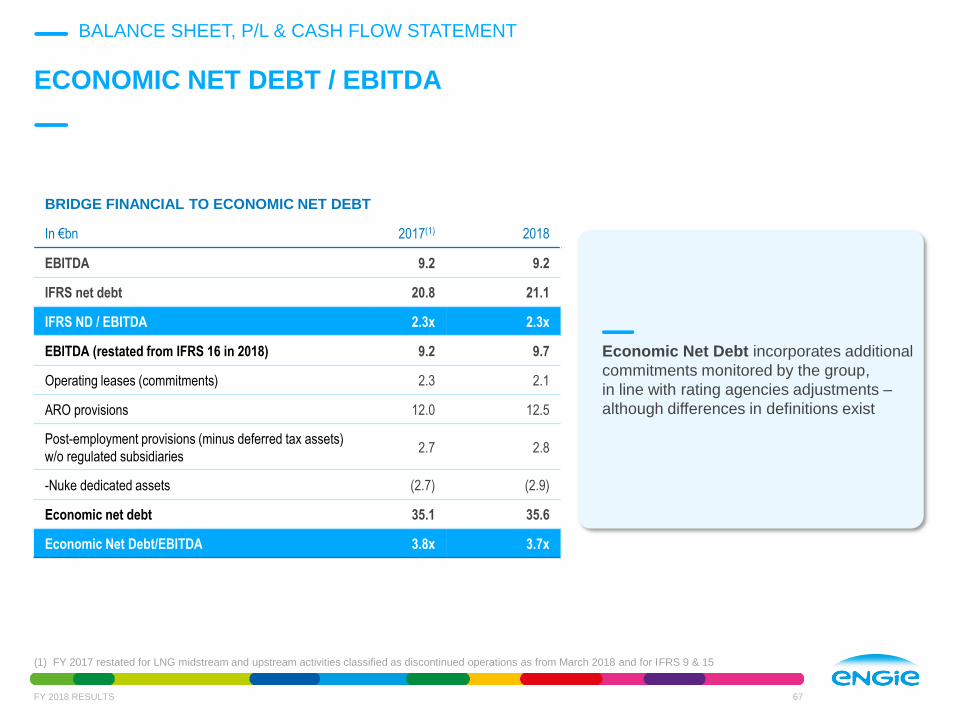
Economic Net Debt incorporates additional
commitments monitored by the group,
in line with rating agencies adjustments –
although differences in definitions exist
(1) FY 2017 restated for LNG midstream and upstream activities classified as discontinued operations as from March 2018 and for IFRS 9 & 15
BRIDGE FINANCIAL TO ECONOMIC NET DEBT
In €bn 2017(1) 2018
EBITDA 9.2 9.2
IFRS net debt 20.8 21.1
IFRS ND / EBITDA 2.3x 2.3x
EBITDA (restated from IFRS 16 in 2018) 9.2 9.7
Operating leases (commitments) 2.3 2.1
ARO provisions 12.0 12.5
Post-employment provisions (minus deferred tax assets)
w/o regulated subsidiaries2.7 2.8
-Nuke dedicated assets (2.7) (2.9)
Economic net debt 35.1 35.6
Economic Net Debt/EBITDA 3.8x 3.7x

ROCEp
FY 2018 RESULTS 68
BALANCE SHEET, P/L & CASH FLOW STATEMENT
In €mn 2018
Industrial capital employed - end of period 51,412
Assets under construction -5,648
Productive industrial capital employed (CEp) 45,764
COI after share in recurring net income of entities accounted for using the equity
method5,275
Other income and financial expenses(1) -675
Normative income tax(2) -1,228
NOPAT 3,372
ROCEp = NOPAT / CEp 7.4%
(1) Mainly unwinding effect of long term provisions and interest cost of employee benefits(2) COI before share in recurring net income of entities accounted for using the equity method plus other income and financial expenses, multiplied by the statutory
tax rates in force in the underlying jurisdictions

In €m FY 2017(1) FY 2018
REVENUES 59,576 60,596
Purchases -31,465 -32,190
Personnel costs -10,051 -10,624
Amortization depreciation and provisions -3,787 -3,586
Other operating incomes and expenses -9,523 -9,431
Share in net income of entities accounted for using the equity method 422 361
CURRENT OPERATING INCOME after share in net income
of entities accounted for using the equity method5,172 5,126
MtM, impairment, restructuring, disposals and others -2,437 -2,481
INCOME FROM OPERATING ACTIVITIES 2,735 2,645
Financial resultof which recurring cost of net debt
of which non recurring items included in financial income/loss
of which others
-1,388-677
-238
-474
-1,381-625
-205
-552
Income taxof which current income tax
of which deferred income tax
395-367
761
-704-712
9
Non-controlling interests relating to continued operations 695 572
Net income/(loss) relating to discontinued operations, Group share 273 1,045
NET INCOME GROUP SHARE 1,320 1,033
EBITDA 9,199 9,236
SUMMARY INCOME STATEMENT
FY 2018 RESULTS 69
(1) FY 2017 restated for LNG midstream and upstream activities classified as discontinued operations as from March 2018 and for IFRS 9 & 15
FIN
AN
CIA
L A
PP
EN
DIC
ES
BALANCE SHEET, P/L & CASH FLOW STATEMENT

SUMMARY RECURRING INCOME STATEMENT
FY 2018 RESULTS 70
In €m FY 2017(1) FY 2018
EBITDA(1) 9,199 9,236
of which recurring contribution of share in net income of entities accounted for using the
equity method446 510
Depreciation, Amortization and others -4,027 -4,110
CURRENT OPERATING INCOME
after share in net income of entities accounted for using the equity method5,172 5,126
Financial result -1,151 -1,176
of which recurring cost of net debt -677 -625
of which others -474 -552
Income tax -1,067 -851
Adjustment for non-recurring share in net income of entities accounted for using
the equity method24 149
Non-controlling interests relating to continued operations -746 -790
Net recurring income/(loss) relating to continued activities, Group share 2,233 2,458
Net recurring income/(loss) relating to discontinued activities, Group share 285 -33
NET RECURRING INCOME GROUP SHARE 2,518 2,425
(1) FY 2017 restated for LNG midstream and upstream activities classified as discontinued operations as from March 2018 and for IFRS 9 & 15.
FIN
AN
CIA
L A
PP
EN
DIC
ES
BALANCE SHEET, P/L & CASH FLOW STATEMENT
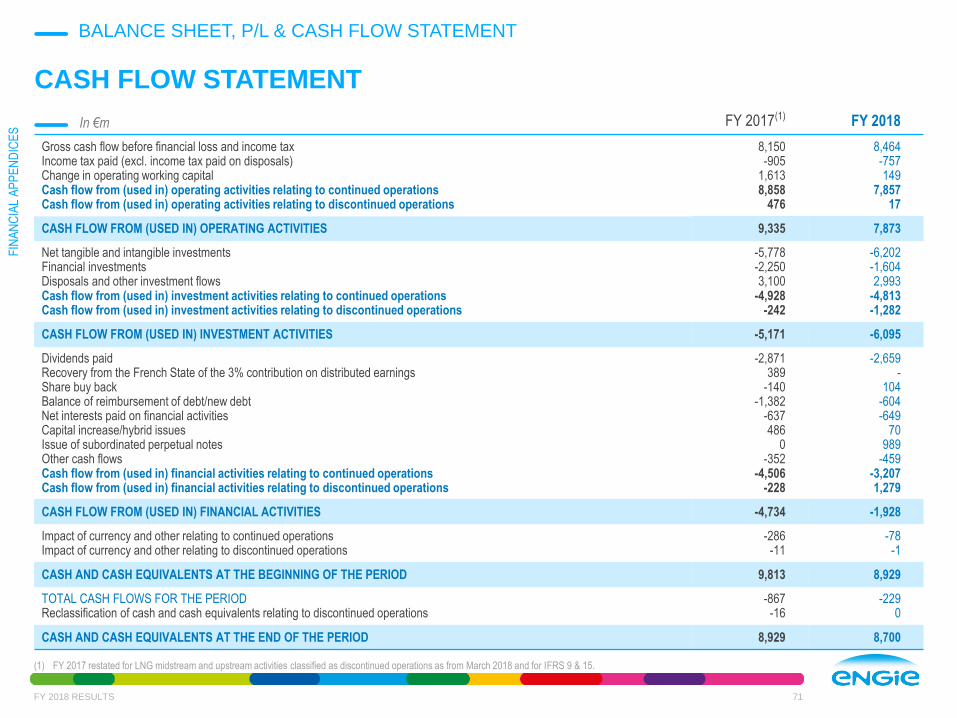
CASH FLOW STATEMENT
FY 2018 RESULTS 71
In €m FY 2017(1) FY 2018
Gross cash flow before financial loss and income taxIncome tax paid (excl. income tax paid on disposals)Change in operating working capitalCash flow from (used in) operating activities relating to continued operationsCash flow from (used in) operating activities relating to discontinued operations
8,150-905
1,6138,858
476
8,464-757149
7,85717
CASH FLOW FROM (USED IN) OPERATING ACTIVITIES 9,335 7,873
Net tangible and intangible investmentsFinancial investmentsDisposals and other investment flowsCash flow from (used in) investment activities relating to continued operationsCash flow from (used in) investment activities relating to discontinued operations
-5,778-2,2503,100
-4,928-242
-6,202-1,6042,993
-4,813-1,282
CASH FLOW FROM (USED IN) INVESTMENT ACTIVITIES -5,171 -6,095
Dividends paidRecovery from the French State of the 3% contribution on distributed earningsShare buy backBalance of reimbursement of debt/new debtNet interests paid on financial activitiesCapital increase/hybrid issuesIssue of subordinated perpetual notesOther cash flowsCash flow from (used in) financial activities relating to continued operationsCash flow from (used in) financial activities relating to discontinued operations
-2,871389
-140-1,382
-637486
0-352
-4,506-228
-2,659-
104-604-649
70989
-459-3,2071,279
CASH FLOW FROM (USED IN) FINANCIAL ACTIVITIES -4,734 -1,928
Impact of currency and other relating to continued operationsImpact of currency and other relating to discontinued operations
-286-11
-78-1
CASH AND CASH EQUIVALENTS AT THE BEGINNING OF THE PERIOD 9,813 8,929
TOTAL CASH FLOWS FOR THE PERIODReclassification of cash and cash equivalents relating to discontinued operations
-867-16
-2290
CASH AND CASH EQUIVALENTS AT THE END OF THE PERIOD 8,929 8,700
(1) FY 2017 restated for LNG midstream and upstream activities classified as discontinued operations as from March 2018 and for IFRS 9 & 15.
FIN
AN
CIA
L A
PP
EN
DIC
ES
BALANCE SHEET, P/L & CASH FLOW STATEMENT

PROFIT & LOSS DETAILS
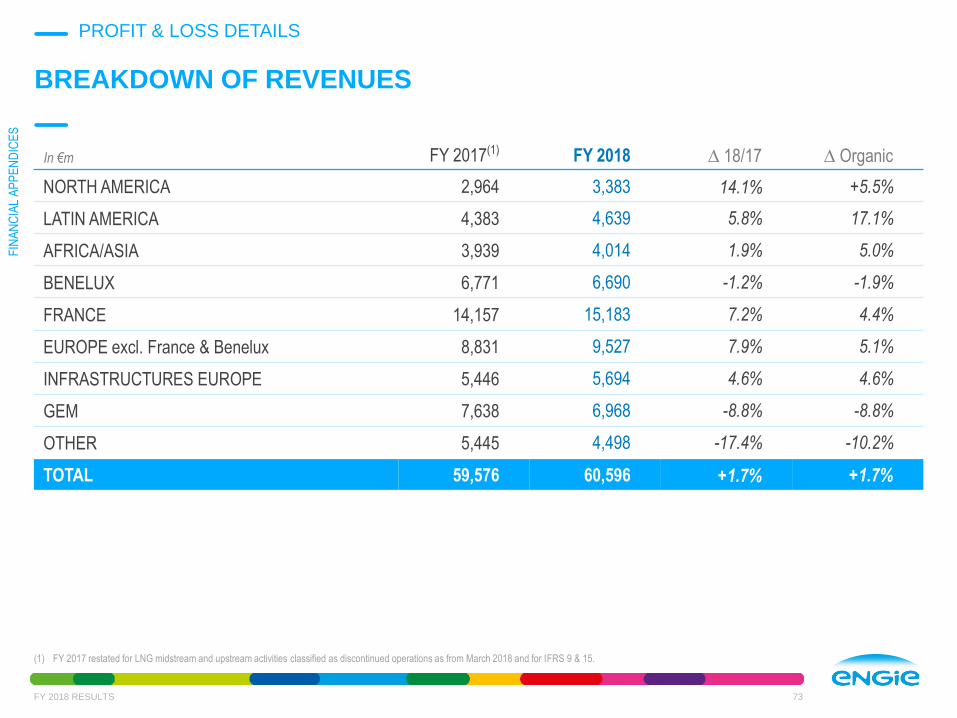
BREAKDOWN OF REVENUES
FY 2018 RESULTS 73
In €m FY 2017(1) FY 2018 ∆ 18/17 ∆ Organic
NORTH AMERICA 2,964 3,383 14.1% +5.5%
LATIN AMERICA 4,383 4,639 5.8% 17.1%
AFRICA/ASIA 3,939 4,014 1.9% 5.0%
BENELUX 6,771 6,690 -1.2% -1.9%
FRANCE 14,157 15,183 7.2% 4.4%
EUROPE excl. France & Benelux 8,831 9,527 7.9% 5.1%
INFRASTRUCTURES EUROPE 5,446 5,694 4.6% 4.6%
GEM 7,638 6,968 -8.8% -8.8%
OTHER 5,445 4,498 -17.4% -10.2%
TOTAL 59,576 60,596 +1.7% +1.7%
(1) FY 2017 restated for LNG midstream and upstream activities classified as discontinued operations as from March 2018 and for IFRS 9 & 15.
FIN
AN
CIA
L A
PP
EN
DIC
ES
PROFIT & LOSS DETAILS

BREAKDOWN OF REVENUES BY REPORTABLE SEGMENT
FY 2018 RESULTS 74
(1) Total revenues, including inter-companies, amount to €6.9bn (2) Total revenues, including inter-companies, amount to €13.0bn
6.6% - €4.0bnAfrica/Asia
11.5% - €7.0bnGEM(2)
25.1% - €15.2bnFrance
9.4% - €5.7bnInfrastructures Europe(1)
7.7% - €4.6bnLatin America
7.4% - €4.5bnOther
11.0% - €6.7bnBenelux
15.7% - €9.5bnEurope excl. France & Benelux
5.6% - €3.4bnNorth America
€60.6bn
FIN
AN
CIA
L A
PP
EN
DIC
ES
PROFIT & LOSS DETAILS

REVENUES BY GEOGRAPHIC REGION BY DESTINATION
FY 2018 RESULTS 75
In €m FY 2017(1) FY 2018 ∆ 18/17
France 25,251 24,983 -1.1%
Belgium 5,921 5,961 +0.7%
SUB-TOTAL FRANCE-BELGIUM 31,171 30,944 -0.7%
Other EU countries 14,583 15,448 +5.9%
of which Italy 2,504 3,232 +29.1%
of which UK 4,291 4,413 +2.8%
of which Germany 2,637 2,551 -3.3%
of which Netherlands 2,462 2,335 -5.2%
Other European countries 1,100 820 -25.5%
SUB-TOTAL EUROPE 46,854 47,212 +0.8%
North America 3,499 3,865 +10.5%
SUB-TOTAL EUROPE & NORTH AMERICA 50,353 51,077 +1.4%
Asia, Middle East and Oceania 4,913 4,936 +0.5%
South America 4,040 4,197 +3.9%
Africa 271 385 42.3%
TOTAL 59,576 60,596 +1.7%
(1) FY 2017 restated for LNG midstream and upstream activities classified as discontinued operations as from March 2018 and for IFRS 9 & 15.
FIN
AN
CIA
L A
PP
EN
DIC
ES
PROFIT & LOSS DETAILS

BREAKDOWN OF EBITDA
FY 2018 RESULTS 76
In €m FY 2017(1) FY 2018 ∆ 18/17 ∆ Organic
NORTH AMERICA 224 224 +0.1% -7.5%
LATIN AMERICA 1,709 1,775 +3.8% 11.1%
AFRICA/ASIA 1,272 1,122 -11.7% 6.0%
BENELUX 550 -186 NA NA
FRANCE 1,461 1,669 +14.2% 14.2%
EUROPE excl. France & Benelux 650 679 +4.6% 6.5%
INFRASTRUCTURES EUROPE 3,386 3,499 +3.3% 3.3%
GEM -188 240 NA NA
OTHER 136 213 56.6% 152.8%
TOTAL 9,199 9,236 +0.4% +4.7%
(1) FY 2017 restated for LNG midstream and upstream activities classified as discontinued operations as from March 2018 and for IFRS 9 & 15.
FIN
AN
CIA
L A
PP
EN
DIC
ES
PROFIT & LOSS DETAILS

2018 one-offs
RES platforms
development costs
Retail
Noram -0.02
EBITDA VARIATION(1)
BY REPORTABLE SEGMENT
FY 2018 RESULTS 77
In €bn
Lean 2018 contribution in all segments(1) Organic variation
FIN
AN
CIA
L A
PP
EN
DIC
ES
Latam +0.16
Nuclear outages &
prices
Benelux -0.73
Infrastructure +0.11
Storage regulation
Distribution tariff
revision
Temperatures
Market and weather
conditions in
Europe
New management
set up of LT gas
supply contract
management
GEM +0.43
Solar in India
Gas distribution in
Thailand
Energy margin in
Thailand
Africa & Asia +0.06
Corporate cost
savings
One-offs in
generation
Other +0.14
Other Europe +0.04
Client solutions in
Romania & Germany
Retail in Germany &
Italy
Gas distribution in
romania
France +0.21
Hydro volumes
DBSO margins
Gas margins
Electricity volumes
PROFIT & LOSS DETAILS
New PPAs in Chile
Spot prices in Chile
Tariffs increases in
gas infrastructure in
Mexico & Argentina

FY 2018 EBITDA BREAKDOWN - MATRIX
78
Unaudited figures(1) % excluding “Other”
In €bn
3 Métiers
9 SegmentsServices
Retail Other TOTAL
RES+Thermal
Contracted
Thermal
Merchant
Infra-
structures Upstream
North America 0.10 0.0 0.06 0.15 (0.09) 0.22
Latin America 1.48 0.01 0.26 - 0.04 (0.02) 1.77
Africa/Asia 0.57 0.04 0.06 0.13 0.32 1.12
Benelux 0.04 (0.54) - - 0.35 (0.03) (0.18)
France 0.50 - - - 1.17 - 1.67
Europeexcl, France, Benelux
0.09 0.10 0.13 - 0.44 (0.08) 0.68
Infrastructures Europe - - 3.50 - - - 3.50
GEM 0.00 0.21 0.02 0.24
Other (0.01) 0.48 (0.01) 0.16 0.13 (0.54) 0.21
Total %(1)
2.76 29% 0.10 1% 3.94 41% 0.44 4% 2.43 25% (0.43) 9.24
GENERATIONCLIENT
SOLUTIONSNETWORKS
FY 2018 RESULTS
FIN
AN
CIA
L A
PP
EN
DIC
ES
PROFIT & LOSS DETAILS

FY 2017 EBITDA BREAKDOWN - MATRIX
79
Unaudited figures(1) % excluding “Other”
In €bn
3 Métiers
9 SegmentsServices
Retail Other TOTAL
RES+Thermal
Contracted
Thermal
Merchant
Infra-
structures Upstream
North America 0.10 0.00 0.05 0.12 (0.05) 0.22
Latin America 1.49 0.22 0.03 (0.03) 1.71
Africa/Asia 0.52 0.07 0.03 0.10 0.55 1.27
Benelux 0.06 0.15 0.37 (0.02) 0.55/6
France 0.34 1.12 1.46
Europeexcl, France, Benelux
0.07 0.12 0.17 0.37 (0.08) 0.65
Infrastructures Europe 3.39 3.39
GEM 0.09 (0.29) 0.01 (0.19)
Other (0.05) 0.40 (0.01) 0.16 0.13 (0.49) 0.14
Total %(1)
2.53 27% 0.83 9% 3.79 40% (0.07) 2.24 24% (0.12) 9.20
GENERATIONCLIENT
SOLUTIONSNETWORKS
FIN
AN
CIA
L A
PP
EN
DIC
ES
FY 2018 RESULTS
PROFIT & LOSS DETAILS

€9.2bn(2)
17.7% €1.7bnFrance
BREAKDOWN OF FY 2018 EBITDA
FY 2018 RESULTS 80
(1) By origin(2) Including Benelux EBITDA for €-0,2bn
50.4%France
14.5%Other Europe
Italy 2.3%
Netherlands 2.5%
Germany 2.8%
13.7%Rest of the world
4.0%North America
17.4%Latin America
11.9%€1.1bnAfrica/Asia
2.5%€0.2bn
GEM
37.1%€3.5bn
InfrastructuresEurope
18.8%€1.8bnLatin America
2.3%€0.2bn
Other
7.2%€0.7bn
Europe excl.France
& Benelux
2.4%€0.2bnNorth America
o/w UK 3.0%
BREAKDOWN BY REPORTABLE SEGMENTGEOGRAPHIC BREAKDOWN(1)
€9.2bn
FIN
AN
CIA
L A
PP
EN
DIC
ES
PROFIT & LOSS DETAILS

BREAKDOWN OF SHARE IN NET INCOMEOF ENTITIES ACCOUNTED FOR USING EQUITY METHOD
FY 2018 RESULTS 81
In €m FY 2017(1) FY 2018 ∆ 18/17
NORTH AMERICA 78 75 -3.8%
LATIN AMERICA -17 -25 -45.7%
AFRICA/ASIA 191 166 -13.0%
BENELUX 5 7 52.1%
FRANCE 8 1 -90.1%
EUROPE excl. France & Benelux 36 45 26.2%
INFRASTRUCTURES EUROPE 9 12 31.8%
GEM -4 -5 -4.2%
OTHER 116 84 -28.1%
TOTAL 422 361 -14.5%
(1) FY 2017 restated for LNG midstream and upstream activities classified as discontinued operations as from March 2018 and for IFRS 9 & 15
FIN
AN
CIA
L A
PP
EN
DIC
ES
PROFIT & LOSS DETAILS
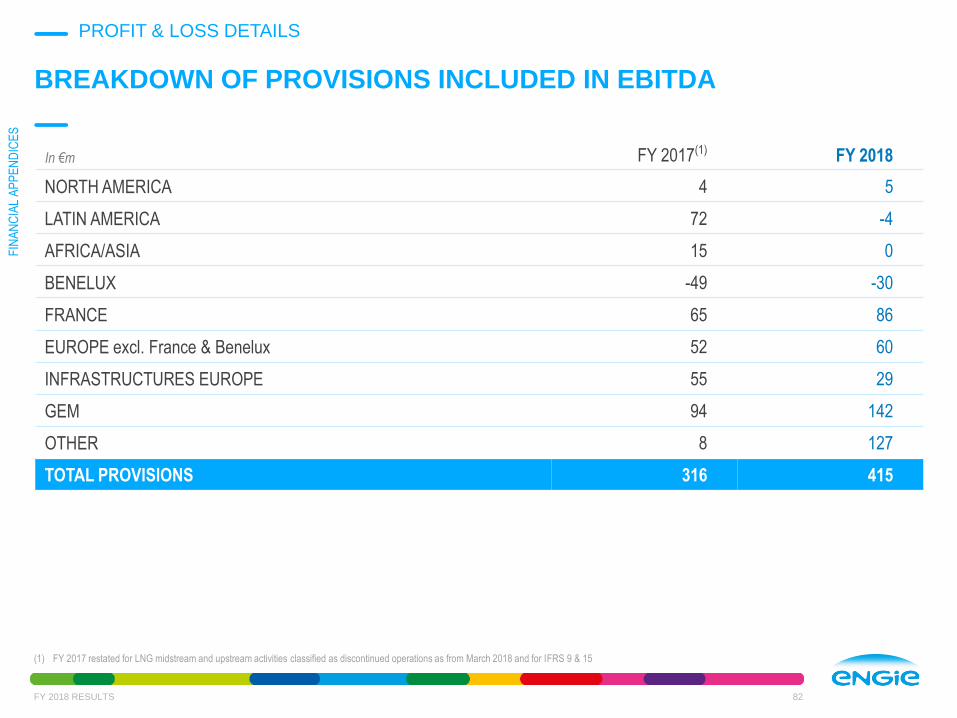
BREAKDOWN OF PROVISIONS INCLUDED IN EBITDA
FY 2018 RESULTS 82
In €m FY 2017(1) FY 2018
NORTH AMERICA 4 5
LATIN AMERICA 72 -4
AFRICA/ASIA 15 0
BENELUX -49 -30
FRANCE 65 86
EUROPE excl. France & Benelux 52 60
INFRASTRUCTURES EUROPE 55 29
GEM 94 142
OTHER 8 127
TOTAL PROVISIONS 316 415
(1) FY 2017 restated for LNG midstream and upstream activities classified as discontinued operations as from March 2018 and for IFRS 9 & 15
FIN
AN
CIA
L A
PP
EN
DIC
ES
PROFIT & LOSS DETAILS

BREAKDOWN OF CURRENT OPERATING INCOMEAfter share in net income of entities accounted for using the equity method
FY 2018 RESULTS 83
In €m FY 2017(1) FY 2018 ∆ 18/17 ∆ Organic
NORTH AMERICA 174 151 -13.1% -20.1%
LATIN AMERICA 1 277 1 355 6.2% 12.9%
AFRICA/ASIA 1 016 893 -12.1% 6.0%
BENELUX -11 -765 NA NA
FRANCE 869 1 034 19.0% 18.3%
EUROPE excl. France & Benelux 434 473 9.0% 11.6%
INFRASTRUCTURES EUROPE 1 941 2 016 3.9% 3.8%
GEM -229 199 NA NA
OTHER -300 -231 22.8% 37.1%
TOTAL 5,172 5,126 -0.9% +5.1%
(1) FY 2017 restated for LNG midstream and upstream activities classified as discontinued operations as from March 2018 and for IFRS 9 & 15
FIN
AN
CIA
L A
PP
EN
DIC
ES
PROFIT & LOSS DETAILS

In €m
North
America
Latin
America Africa/Asia Benelux France
Europe exc. France & Benelux
Infrastructures
Europe GEM Other FY 2018
EBITDA 224 1,775 1,122 -186 1,669 679 3,499 240 213 9,236
Depreciation -72 -416 -134 -576 -628 -201 -1,479 -39 -337 -3,882
Share based payments -1 -2 -4 -4 -7 -3 -3 -3 -52 -79
Non recurring
contribution of shares
in net income of entities
accounted for using the
equity method
1 -2 -91 0 -0 -2 -0 0 -55 -149
COI after share in net
income of entities
accounted for using
the equity method
151 1,355 893 -765 1,034 473 2,016 199 -231 5,126
DIVISIONAL RECONCILIATION BETWEEN EBITDA AND COIAfter share in net income of entities accounted for using the equity method
FY 2018 RESULTS 84
FIN
AN
CIA
L A
PP
EN
DIC
ES
PROFIT & LOSS DETAILS

FROM COI AFTER SHARE IN NET INCOME OF ENTITIES ACCOUNTED FOR USING THE EQUITY METHOD TO NET INCOME GROUP SHARE
FY 2018 RESULTS 85
In €m FY 2017(1) FY 2018
COI after share in net incomeof entities accounted for using the equity method
5,172 5,126
MtM commodities 29 -223
Impairment -1,298 -1,798
Restructuring costs -669 -162
Asset disposals & others -500 -297
INCOME FROM OPERATING ACTIVITIES 2,735 2,645
Financial result -1,388 -1,381
Income tax 395 -704
Non-controlling interests -788 -595
Income from discontinued operations, Group share 366 1,069
NET INCOME GROUP SHARE 1,320 1,033
(1) FY 2017 restated for LNG midstream and upstream activities classified as discontinued operations as from March 2018 and for IFRS 9 & 15
FIN
AN
CIA
L A
PP
EN
DIC
ES
PROFIT & LOSS DETAILS

BREAKDOWN OF NON-CONTROLLING INTERESTS
FY 2018 RESULTS 86
In €m FY 2017(1) FY 2018
NORTH AMERICA 11 12
LATIN AMERICA 283 274
AFRICA/ASIA 141 140
BENELUX 1 1
FRANCE 35 37
EUROPE excl. France & Benelux 54 54
INFRASTRUCTURES EUROPE 120 106
GEM 0 2
OTHER 49 -55
Non-controlling interests 695 572
(1) FY 2017 restated for LNG midstream and upstream activities classified as discontinued operations as from March 2018 and for IFRS 9 & 15
FIN
AN
CIA
L A
PP
EN
DIC
ES
PROFIT & LOSS DETAILS

In €m FY 2017(1) FY 2018
EBITDA 9,199 9,236
Restructuring costs cashed out -429 -378
Provisions -316 -415
Share in net income of entities accounted for using the equity method -446 -510
Dividends and others 142 531
Cash generated from operations before income tax
and working capital requirements8,150 8,464
RECONCILIATION BETWEEN EBITDA AND OPERATING CASH FLOW
FY 2018 RESULTS 87
(1) FY 2017 restated for LNG midstream and upstream activities classified as discontinued operations as from March 2018 and for IFRS 9 & 15
FIN
AN
CIA
L A
PP
EN
DIC
ES
PROFIT & LOSS DETAILS

NET RECURRING INCOME GROUP SHARE
FY 2018 RESULTS 88
In €m FY 2017(1) FY 2018
Net income/(loss) relating to continued operations, Group share 1,047 -12
Net income/(loss) relating to discontinued operations, Group share 273 1,045
NET INCOME GROUP SHARE 1,320 1,033
MtM commodities -29 223
Impairment 1,298 1,798
Restructuring costs 669 162
Asset disposals & others 500 297
Financial result (non-recurring items) 238 205
Share in net income of entities accounted for using the equity method
(non-recurring items)24 149
Income tax on non-recurring items -1,461 -147
Non-controlling interests on above items -51 -219
Non-recurring items relating to discontinued operations, Group share 12 -1,078
NET RECURRING INCOME GROUP SHARE 2,518 2,425
(1) FY 2017 restated for LNG midstream and upstream activities classified as discontinued operations as from March 2018 and for IFRS 9 & 15
FIN
AN
CIA
L A
PP
EN
DIC
ES
PROFIT & LOSS DETAILS
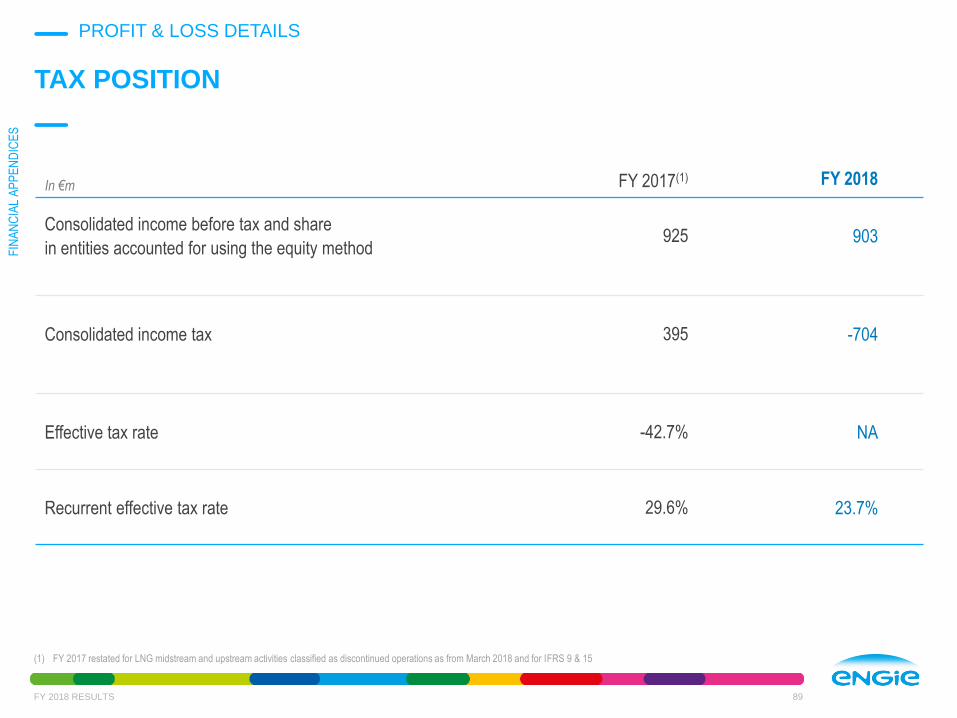
TAX POSITION
FY 2018 RESULTS 89
In €m FY 2017(1) FY 2018
Consolidated income before tax and share
in entities accounted for using the equity method925 903
Consolidated income tax 395 -704
Effective tax rate -42.7% NA
Recurrent effective tax rate 29.6% 23.7%
(1) FY 2017 restated for LNG midstream and upstream activities classified as discontinued operations as from March 2018 and for IFRS 9 & 15
FIN
AN
CIA
L A
PP
EN
DIC
ES
PROFIT & LOSS DETAILS

CASH FLOW DETAILS

FROM EBITDA TO FREE CASH FLOW
FY 2018 RESULTS 91
FY 2018FREE CASH
FLOW
Restructuring& others
Cash generated from operations before income tax and working
capital requirements
FY 2018EBITDA
Taxcash
expenses
WCR
Maintenancecapex
Netfinancial
expenses
9.28.5 (0.7)
+0.1
(0.8)
4.7
(2.6)(0.6)
7.3
FY 2018CFFO
In €bn
FIN
AN
CIA
L A
PP
EN
DIC
ES
CASH FLOW DETAILS

FREE CASH FLOW(1) GENERATION FROM FY 2017 TO FY 2018
FY 2018 RESULTS 92
D Operating cash flow
FY 2017FCF(2)
D Tax cashexpenses
D WCR DMaintenance
capex
FY 2018FCF
D Netfinancial expenses
6.0+0.3 (1.5)
(0.1)
+0.1 (0.2)
4.7
In €bn
(1) Free Cash Flow = CFFO after Maintenance Capex(2) FY 2017 restated for LNG midstream and upstream activities classified as discontinued operations as from March 2018 and for IFRS 9 & 15
FIN
AN
CIA
L A
PP
EN
DIC
ES
CASH FLOW DETAILS

BREAKDOWN OF INVESTMENTS
FY 2018 RESULTS 93
In €m Maintenance Development Financial FY 2018
NORTH AMERICA 34 494 446 974
LATIN AMERICA 119 1,463 177 1,758
AFRICA/ASIA 93 160 363 616
BENELUX 625 66 233 925
FRANCE 290 568 463 1,322
EUROPE excl. France & Benelux 116 150 106 372
INFRASTRUCTURES EUROPE 951 671 -2 1,619
GEM 14 30 1 45
OTHER 347 11 180 538
TOTAL 2,589 3,613 1,967 8,169
FIN
AN
CIA
L A
PP
EN
DIC
ES
CASH FLOW DETAILS

DETAIL OF FY 2018 TOTAL GROSS CAPEX
FY 2018 RESULTS 94
€8.2bn
2.0
3.6
2.6
Financial
Development
Maintenance
⚫ Campo Largo & Umburanas
(Wind – Brazil) ~ €0.6bn
⚫ GRDF (Networks – France) ~ €0.4bn
⚫ Infinity (Wind – USA ) ~ €0.4bn
⚫ Solar & Wind – France ~ €0.2bn
⚫ Paracatu (Solar – Brazil) ~ €0.2bn
⚫ Pampa Sul (Thermal – Brazil) ~ €0.2bn
⚫ GRTgaz (Networks – France) ~ €0.2bn
⚫ ENGIE Energia Chile (Chile) ~ €0.2 bn
⚫ Willogoleche (Wind – Australia) ~ €0.1bn
⚫ Langa (RES – France) ~€0.2bn
⚫ Unity / Donnelly (B2B – USA) ~€0.2bn
⚫ Synatom (SICAV – Benelux) ~€0.2bn
⚫ Longwood (B2T – USA) ~€0.1bn
⚫ Infinity Ressources (Wind – USA)~€0.1bn
⚫ Socore (Solar – USA) ~€0.1bn
⚫ Capital increase (SAFI – Morocco)~€0.1bn
⚫ Kathu (Solar – South Africa) ~€0.1bn
⚫ Priora (B2T – Switzerland) ~€0.1bn
⚫ Capital increase (FEIH – France) ~€0.1bn
FIN
AN
CIA
L A
PP
EN
DIC
ES
CASH FLOW DETAILS

CREDIT

“INVESTMENT GRADE” CATEGORY RATING
96
CREDIT RATINGS as of February 25, 2019
FIN
AN
CIA
L A
PP
EN
DIC
ES
FY 2018 RESULTS
CREDIT
Dates refer to the latest rating changes
A+ A1 A+
A A2 Engie (Stable) 4/27/2016 A Engie (Stable) 10/9/2017
A- EDF (Stable) 2/25/2019 A3 EDF (Stable) 9/28/2016 A- EDF (Stable) 6/7/2016
EnBW (Stable) 6/20/2017 EnBW (Stable) 6/6/2018 EnBW (Stable) 8/4/2011
Verbund (Stable) 9/20/2018 Vattenfall (Stable) 9/27/2013 Enel (Stable) 2/11/2019
Engie (Stable) 4/30/2018
BBB+ Iberdrola (Stable) 4/22/2016 Baa1 Iberdrola (Stable) 6/15/2012 BBB+ Iberdrola (Stable) 3/25/2014
Vattenfall (Stable) 6/7/2017 Verbund (Positive) 9/17/2018 Innogy (Stable) 8/31/2018
Enel (Stable) 12/6/2017 SSE (stable) 12/20/2018 SSE (Stable) 7/31/2015
EDP (Stable) 8/8/2017 E.ON (Stable) 8/24/2018
SSE (Stable) 12/20/2018
BBB E.ON (Stable) 3/15/2017 Baa2 E.ON (Stable) 5/16/2017 BBB RWE (Stable) 10/5/2018
Naturgy (Stable) 11/28/2013 Naturgy (Stable) 8/11/2010 Naturgy (Stable) 8/1/2018
Fortum (Negative) 1/18/2018 Fortum (Negative) 2/15/2018 Fortum (Stable) 6/28/2018
Innogy (Stable) 10/11/2017 Innogy (Stable) 6/30/2017
Uniper (Stable) 4/27/2018 Enel (Stable) 11/5/2012
Baa3 EDP (Stable) 2/15/2015 BBB- EDP (Stable) 7/2/2014
RWE (Stable) 6/30/2017
S&P Moody’s Fitch

SPLIT OF GROSS DEBT(1) & DEBT MATURITY PROFILE(2)
97
FIN
AN
CIA
L A
PP
EN
DIC
ES
CREDIT
DEBT MATURITY PROFILE(2)
(1) Without IFRS 9 (+€1.3bn) without bank overdraft (+€0.5bn)(2) Excluding/net of €2.9bn of NEU CP/US CP(3) Negotiable European Commercial Paper(4) Cash & cash equivalents (€8.7bn), plus financial assets qualifying or designated at faire value through income (€1.2bn), net of bank overdraft (€0.5bn)(5) Excluding IFRS 16
AVERAGE COST
OF GROSS DEBT:
Bonds 22.6
(3) NEU CP / US CP 2.9
Drawn credit lines0.1
(5) Financial Leasing 0.4
Other borrowings0.1
Bank borrowings4.6
€30.7bn
SPLIT OF GROSS DEBT(1)
9.5
1.22.5 1.8 2.6 2.7
1.1
10.7
10.3
0.3
1.00.4
0.4 0.30.2
1.9
0.2
0.1
0.10.0 0.0
0.0
0.1
19.8
1.7 3.6 2.3 3.0 3.0 1.4
12.8
12/2018Liquidity
2019 2020 2021 2022 2023 2024 2025and beyond
Undrawn credit lines(2)
Cash(4)
2.63%as of
12/31/2017 2.68% vs AVERAGE NET DEBT MATURITY : 10.9
YEARS
Bank borrowingsOther Bonds
FY 2018 RESULTS

NET DEBT(1) BREAKDOWN BY RATE AND CURRENCY
98
FIN
AN
CIA
L A
PP
EN
DIC
ES
CREDIT
Fixed rates81%
Capped rates 5%
Floating rates14%
€21.1bn
EUR75%
USD18%
BRL6%
GBP1%
€21.1bn
(1) After hedging
FY 2018 RESULTS

Disclaimer
Forward-Looking statements
This communication contains forward-looking information and statements. These statements
include financial projections, synergies, cost-savings and estimates, statements regarding plans,
objectives, savings, expectations and benefits from the transactions and expectations with respect
to future operations, products and services, and statements regarding future performance.
Although the management of ENGIE believes that the expectations reflected in such forward-
looking statements are reasonable, investors and holders of ENGIE securities are cautioned that
forward-looking information and statements are not guarantees of future performances and are
subject to various risks and uncertainties, many of which are difficult to predict and generally
beyond the control of ENGIE, that could cause actual results, developments, synergies, savings
and benefits to differ materially from those expressed in, or implied or projected by, the forward-
looking information and statements. These risks and uncertainties include those discussed or
identified in the public filings made by ENGIE with the Autorité des Marchés Financiers (AMF),
including those listed under “Facteurs de Risque” (Risk factors) section in the Document de
Référence filed by ENGIE (ex GDF SUEZ) with the AMF on March, 28 2018 (in accordance with
article 212-13). Investors and holders of ENGIE securities should consider that the occurrence of
some or all of these risks may have a material adverse effect on ENGIE.
99FY 2018 RESULTS

Symbol ENGIY
CUSIP 29286D105
Platform OTC
Type of programme Level 1 sponsored
ADR ratio 1:1
Depositary bank Citibank, NA
ADR PROGRAMAMERICAN DEPOSITARY RECEIPT
100
FOR MORE INFORMATION, GO TO
http://www.citi.com/dr
FY 2018 RESULTS

FOR MORE INFORMATION ABOUT ENGIE
+33 1 44 22 66 29
Presentation
http://www.engie.com/en/investors-area/
FOR MORE INFORMATION ABOUT FY 2018 RESULTS, YOU WILL FIND ON
http://www.engie.com/en/investors/results/2018-results/
Analyst
pack
Appendices Press
Release
Recorded
conference
audiocast
Financial
report
Download the new ENGIE Investor relations app !
101
2018FULL YEAR
Ticker: ENGI
101FY 2018 RESULTS