th february 2021 - engie
TRANSCRIPT
26th February 2021
1 Greenhouse Gases
2 Science Based targets

FY 2020 Results February 2021 2
Agenda
IntroductionAarti SINGHAL
Investor Relations Director
2020 OverviewCatherine MACGREGOR
Chief Executive Officer
Financial Review & OutlookJudith HARTMANN
EVP, Chief Financial Officer
2021 PrioritiesCatherine MACGREGOR
Chief Executive Officer

FY 2020 Results February 2021 3
Catherine MACGREGOR
CEO
2020 Overview

FY 2020 Results February 2021 4
• Clear and meaningful role in tackling climate change
• Critically important that decarbonization is achieved through an energy mix
that is reliable, affordable and based on flexible/resilient energy systems
• ENGIE is a major player in the energy sector: renewables, networks and
decentralized infrastructure
$15 trillion
to be invested in power
generation globally by 2050
$15trillion
39%
28%
15%
12%
6%
Wind
Solar
Others
Gas
Other Renewables
Renewable gases demandEU Sustainable Development Scenario (TWh)
0
200
400
600
800
1 000
1 200
2019 2030 2050
x3
x3
Hydrogen
Biogas & Biomethane
Source: BNEF, Energy outlook 2020 Source: IEA, World Energy Outlook 2020

FY 2020 Results February 2021 5
Strong recovery from Q2 levels, with H2 organic performance similar to previous year
Strong liquidity maintained
1 Net of DBSO and US tax equity proceeds
EBITDA
€9.3bn
2019: €10.4bn
COI
€4.6bn
2019: €5.8bn
NRIgs
€1.7bn
2019: €2.7bn
Growth Capex1
€4.0bn
2019: €7.1bn
Proposed dividend
€0.53

FY 2020 Results February 2021 66
New strategic orientation driving Group simplification
and focus on execution …
• SUEZ disposal1
completed in October
• Strategic reviews launched; strengthened position in key countries
. . . while ensuring delivery of essential services for customers and executing on capital projects
• Continuously evolved operational processes to ensure high
health and safety standards
• €7.7bn Capex2, incl. €4.0bn growth Capex2
• Commissioned 3 GW wind and solar assets
Update on Belgian nuclear assets
1 Sale of 29.9% shareholding in SUEZ
2 Net of DBSO and US tax equity proceeds

FY 2020 Results February 2021 7
2019 2020 2030
75mt3 68
mt43mt
28%
2019 2020 2030
31%
58%
GHG1 emissions from energy production, in line with the SBT 2 objectives
Share of Renewables (GW at 100%) in the electric capacity mix in line with the SBT 2 objectives
Greenhousegases emissions
Renewables
1 Greenhouse gases
2 Science Based Targets
3 2019 figure proforma excluding emissions linked to blast furnace gases
2019 2020 2030
24% 24%
50%
% of women in the management of the Group
Gender diversity
Exit from coal
• New commitment to exit from all
coal in Europe by 2025 and globally
by 2027, including coal generation
for DHC networks
Commitment to exit from coal by 2027
Centralized coal power generation capacity @100%
2020 2027
No coalCoal
101GW
4 GW

FY 2020 Results February 2021 8
Capacity growth in the last 2 years1
(GW @100%)
2020 achievements
• 3 GW of wind and solar assets commissioned, second
year in a row, despite Covid-19
− In key markets: US, Europe, Latin America
− Including for the first time, both fixed and floating
offshore wind through Ocean Winds JV with EDPR
• 2 GW of capacity acquired, mainly hydro
• Over 1.5 GW corporate PPAs signed
RENEWABLES
1 For the Renewables GBL
31 Dec2018
Capacitybuilt
Capacitydisposed/
closed
Capacityacquired
31 Dec2020
23.6
6.0
2.1
31.1(0.5)
+7.6 GW
+32%

FY 2020 Results February 2021 9
• J. Stubler appointed as EVP, to manage the project
• Multi-technical services entity with scale and strong growth prospects
• Employee consultation on organization design commenced in February 2021
• Preparation for the creation of potential new entity, subject to feedback of stakeholders
Launch ofstrategic review
Q3
2020
Q4
2020
Q1
2021
Q2
2021
Q3-Q4
2021
Phase 1 of review complete with
preliminary scope defined
Employee consultation on organization design
Review of options
Creation of a new entity subject to
stakeholder feedback
Next steps

FY 2020 Results February 2021 10
1
• Expect significant improvement in financial performance driven by:
− Strong recovery from Covid-19 impacts in 2020
− Benefit of growth in Renewables and international Networks
− Improved Nuclear availability and higher achieved prices
− Reversal of the warm weather effects last year
• Potential adverse impact of extreme cold weather in Texas in February
• c. €2 bn of disposals towards Group simplification, value creation and
capital re-allocation towards growth
• Significant investment, with over 90% in Renewables, Networks and
Asset-Based Client Solutions
COI indicative range
€5.2-5.6bn
NRIgs guidance range
€2.3-2.5bn
Growth Capex2 indication
€5.5-6.0bn
1 Main assumptions for these targets and indications: average weather in France for 2021, full pass through of supply costs
in French regulated gas tariffs, no major regulatory or macro-economic changes, no change in Group accounting policies,
market commodity prices as of 12/31/2020, average forex for 2021: €/$: 1.23; €/BRL: 6.27, up to €100m dilution effect at
the COI level from c. €2bn disposals in addition to previously signed transactions. Assumption of no additional stringent
lockdowns and gradual easing of restrictions over 2021
2 Net of DBSO and US tax equity proceeds

FY 2020 Results February 2021 11
JudithHARTMANN
EVP, CFO
Financial Overview
& Outlook

FY 2020 Results February 2021 12
Recovery in H2 following significant impacts of Covid-19 in Q2
• 2020 COI impacted by 3 headwinds:
▪ €(1.2)bn Covid-19
▪ €(0.3)bn FX
▪ €(0.16)bn French temperatures
• 2020 guidance reached at NRIgs level with
EBITDA and COI above indications
• Continued delivery of major capital projects
with c. €4.0bn growth Capex3 invested in
strategic priorities
• Simplification: sale of 29.9% shares in SUEZ
completed in October and further strategic
reviews launched
€bn, unaudited figures1
2020
ActualYoY ∆
Gross
YoY ∆
Organic Guidance
EBITDA 9.3 (11)% (6)% 9.0 – 9.2
COI 4.6 (21)% (16)% 4.2 – 4.4
NRIgs 1.7 (37)% (34)% 1.7 – 1.9
NIgs (1.5) (2.5)
CFFO2 7.1 (0.5)
Capex3 7.7 (2.3) 7.5 – 8.0
Financial Net Debt 22.5 (3.5)
Economic Net Debt /
EBITDA4.0x Flat Above 4.0x
COI YoY gross evolution - all reportable segments down
1 Unaudited figures throughout the presentation
2 Cash flow from Operations = Free Cash Flow before Maintenance Capex
3 Net of DBSO and US tax equity proceeds
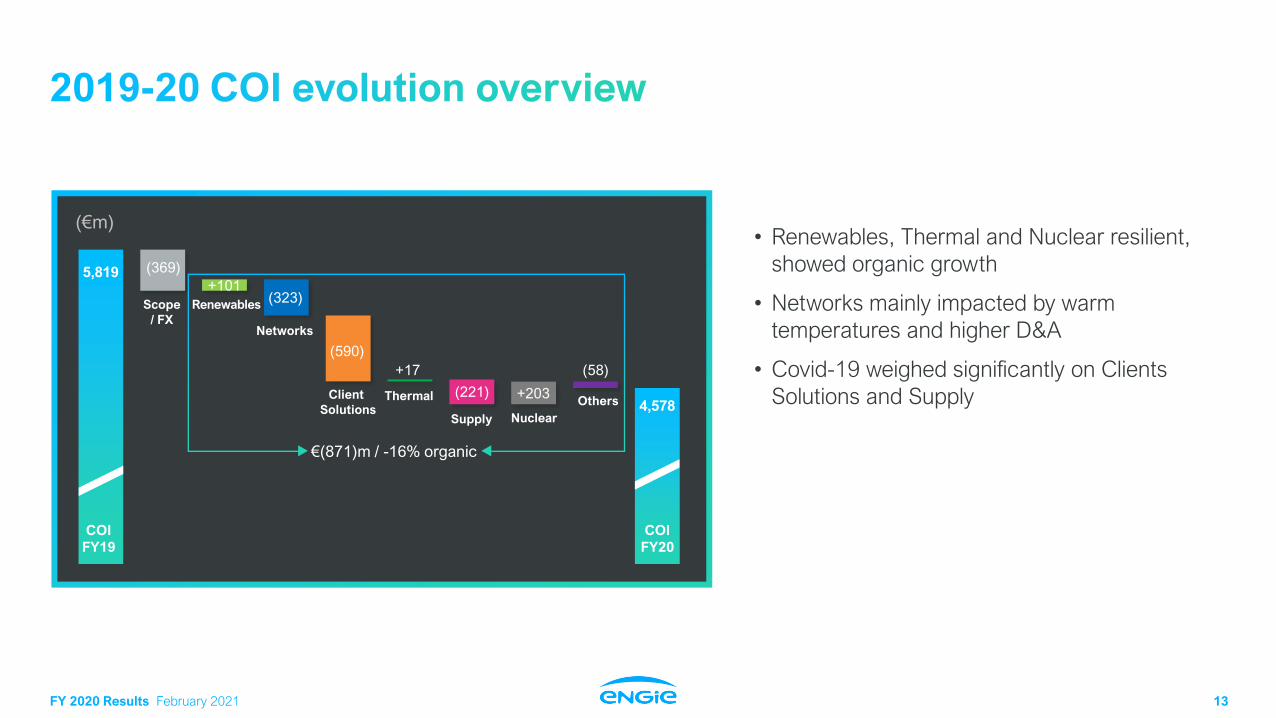
FY 2020 Results February 2021 13
• Renewables, Thermal and Nuclear resilient,
showed organic growth
• Networks mainly impacted by warm
temperatures and higher D&A
• Covid-19 weighed significantly on Clients
Solutions and SupplyClient
SolutionsNuclear
OthersThermal
Renewables
Networks
Supply
Scope
/ FX
5,819
4,578+203
+17
(323)+101
(590)
(221)
(369)
(58)
COI
FY19
COI
FY20
(€m)
€(871)m / -16% organic

FY 2020 Results February 2021 1414
+11% organic growth
• Latin America: decrease mainly due to FX BRL (c. €-195m) and unfavorable hydro
GSF / energy allocation in Brazil, partly offset by positive GFOM ruling in Brazil (c. €165m)
• France: decrease mainly due to lower DBSO, partly offset by improved prices for
hydro and higher wind production
• Rest of the World: increase mainly due to commissioning in USA and to higher wind
production
182
167
150
851
1,195
654
750
1,070970
Rest of the World
France
Latin America
161
149
170
14
Renewables COI by geography (€m)
2019 20202019restated FX/Scope
RENEWABLES
1 Net of DBSO and US tax equity proceeds
Limited global impact of Covid-19 (c. €-50m)
Overall
operational resilienceto Covid-19
2020Growth Capex1 of
€1.5bn39% of total
growth Capex1

FY 2020 Results February 2021 1515
France lower due to temperature and higher D&AInternational networks up significantly, mainly driven by TAG
• France:
− largely driven by lower volumes due to temperature (c. €-100m) and Covid-19
(both recoverable under regulatory arrangements)
− higher D&A, reversal of positive internal 2019 one-off and lower RAB remuneration
rates
• Latin America: higher contribution from TAG (mainly scope effect) and from power
transmission lines under construction in Brazil, partly offset by negative FX
• Rest of the world: primarily negative price and volume effects
Networks COI by geography (€m)
20202019
1,9571,610
284
103
384
70
2,063
2,344
Rest of the World
Latin America
France
2020Growth Capex of
€1.5bn38% of total
growth Capex1
NETWORKS
Limited global impact of Covid-19 (c. €-70m)
2.0madditional gas smart
meters installed
in France in 2020
1 Net of DBSO and US tax equity proceeds

FY 2020 Results February 2021 16
Recovery in H2 after a Covid-19 impacted H1
• Lower revenues of €-0.9bn
• Cost control actions achieved a gross Opex reduction of €0.3bn
• Increasing cumulated backlog for projects
COI (€m) FY19 FY20 Delta
Client Solutions 1,082 459 -623
Projects backlog(€bn)
11.111.7
COI (€bn)
0.4
-0.1
0.61 0.6
CLIENT SOLUTIONS
DHC net installed capacity
+9%
1 H2 2019 Client Sloutions COI restated from Q4 2019 SUEZ contribution
Major global impact of Covid-19 (c. €-600m)
EVBoxSPAC transaction announced withclosing expected
in the comingweeks
2019
H1 H2 Dec19
Dec20
2019 2020
2020
+5%

FY 2020 Results February 2021 17
+1% organic growth despite material positive one-offs in 2019
• Disposals of Glow (Thailand), US gas assets and German / Dutch coal
power plants (c. €-90m)
• Negative FX impacts (c. €-40m), mainly BRL
• Higher contribution from European merchant gas fleet (higher spreads
and ancillaries), higher operational contribution of Brazilian assets and
improved performance from Middle East gas contracted activities
• Partly offset by positive 2019 one-offs due to LDs in Brazil and Chile
(> €0.1bn)
COI (€m) FY19 FY20 Delta
Thermal 1,320 1,209 -112
THERMAL
Demothballing of
0.7GWCCGTs units in Eems
(NL) in Aug-Nov 2020
Minimal global impact of Covid-19 (c. €-40m)
Overall
operational resilience
to Covid-19

FY 2020 Results February 2021 18
Nuclear improvement mainly driven by better pricesSupply and Others performance impacted by Covid-19
• Supply
− Strong negative impacts from Covid-19 (net c. €-290m)
− Negative impact from warm temperature (c. €-100m)
− Partly offset by one-offs and mitigation actions
• Nuclear
− Better achieved prices and lower Opex
− Partly offset by lower volumes / availability
Limited global impact of Covid-19 (c. €-60m)
• Others
− Positive 2019 one-off and Covid-19 impacts for GEM
− Partly offset by outperformance of GEM activities and
higher contribution from GTT
Limited global impact of Covid-19 (c. €-70m)
NUCLEAR
COI (€m) FY19 FY20 Delta
Supply 345 112 -233
Nuclear (314) (111) +203
Others (154) (224) -70
Last planned
LTOmaintenance works done
+186kB2C power
supplycontracts
24.4mB2C contracts
SUPPLY OTHERS

FY 2020 Results February 2021 19
(€bn) 2020
NRIgs 1.7
Impairment2 & Others (4.7)
Restructuring costs (0.3)
Capital gains3 1.6
Commodities MtM 0.2
NIgs (1.5)
From NRIgs to NIgs
1 Cost of net debt + unwinding of discount on long-term provisions
2 Mainly coming from the impacts of the change in lifetime assumption for Belgian nuclear reactors, of changes in the
commodity price scenario and of the extension of fair value accounting of GEM contract / assets
3 Mainly coming from the sale of 29.9% shareholding in SUEZ
From EBITDA to NRIgs
(€bn) FY19 FY20 Delta
EBITDA 10.4 9.3 -1.1
D&A and others (4.5) (4.7) -0.2
COI 5.8 4.6 -1.2
Net interest expense1 (1.3) (1.4) -0.1
Recurring income tax (1.1) (0.8) +0.3
Minorities & Others (0.7) (0.7) +0.1
NRIgs 2.7 1.7 -1.0

FY 2020 Results February 2021 20
Strong liquidity of €23.0bn as at 31 December 2020, incl. €13.3bn of cash
25.9
22.5Scope 2
0.6(4.2)7.7
Gross
Capex 1
Dividends Others 3
CFFO
(7.1)
(0.5)
Dec
2019
Dec
2020
2.38%2.70%
Financial Net Debt and cost of gross debt (€bn)
Cost of gross debt
1 Net of DBSO and US tax equity proceeds
58%2.5x
4.0x 4.0x
2.4x
Financial Net Debt / EBITDA
Economic Net Debt / EBITDA
Leverage ratios
2 Including net scope impact from disposals & acquisitions, mainly due to sale of 29.9% shareholding in SUEZ
3 Mainly due to FX
€3.9bnaverage outstanding
amount of hybrids(yearly coupon of
c. €100m)
World leader ingreen bonds with
€12bnissued since 2014
Dec 19 Dec 20

FY 2020 Results February 2021 21
Indications for FY 2021
Growth Capex1 split per BL(€bn)
Renewables
Networks
Client Solutions
Thermal & Supply
5.5 - 6.0
1 Net of DBSO and US tax equity proceeds
c. €4bn
Maintenance and
Nuclear funding Capex
c. €2bn
Disposals driving simplification
• Strategic reviews
• Geographical refocus
• Coal exit

FY 2020 Results February 2021 22
1
Business Line Performance expectations vs. 2020
RenewablesGrowth in the US and France, partly offset by lower benefit from the GFOM rulings in Brazil
and weaker BRL
NetworksNew lower RAB remuneration rates in France offset by reversal of 2020 warm temperatures
and growth in Latin America
Client Solutions Overall strong recovery from Covid-19, albeit with a relatively slower recovery for Asset-light
activities, and y-o-y accretion from SUEZ and EV-Box partial disposals
Thermal Normalization of strong 2020 performance in Europe
Supply Strong recovery from Covid-19 and temperature normalization
Nuclear Better availability following LTO completions and higher achieved prices
1 Main assumptions for these targets and indications: average weather in France for 2021, full pass through of
supply costs in French regulated gas tariffs, no major regulatory or macro-economic changes, no change in
Group accounting policies, market commodity prices as of 12/31/2020, average forex for 2021: €/$: 1.23;
€/BRL: 6.27; up to €0.1bn dilution effect at the COI level from c. €2bn disposals in addition to previously signed
transactions. Assumptions of no additional stringent lockdowns and gradual easing of restrictions over 2021
Potential net negative impact from the extreme cold weather in Texas in February currently estimated between €80 to
120 million at the Group COI and Net Recurring Income Group share level, mainly on Renewables and Supply.

FY 2020 Results February 2021 2323
1
EBITDA indicative range
€9.9-10.3bn
COI indicative range
€5.2-5.6bn
NRIgs guidance range
€2.3-2.5bn
Dividendpolicy reaffirmed
65-75% payout ratio on NRIgs
1 Main assumptions for these targets and indications: average weather in France for 2021, full pass through of supply costs
in French regulated gas tariffs, no major regulatory or macro-economic changes, no change in Group accounting policies,
market commodity prices as of 12/31/2020, average forex for 2021: €/$: 1.23; €/BRL: 6.27; up to €0.1bn dilution effect at
the COI level from c. €2bn disposals in addition to previously signed transactions. Assumptions of no additional stringent
lockdowns and gradual easing of restrictions over 2021
Leverage“Strong investment grade” rating
Economic Net Debt / EBITDA ≤ 4.0x
over the long term
Key assumptions
Covid-19: Projections based on
absence of additional stringent
lockdowns and gradual easing of
restrictions over 2021
Disposals: 2021 COI dilution up to
€0.1bn from c. €2bn disposals in
addition to previously signed
transactions
FX: Average for 2021:
• €/USD: 1.23
• €/BRL: 6.27
Market commodity prices
as at 31 Dec 2020

FY 2020 Results February 2021 24
Catherine MACGREGOR
CEO
2021 Priorities

FY 2020 Results February 2021 2525
• Simplify the Group at pace
• Accelerate investments in Renewables, Networks and Asset-based
Client solutions
• Strengthen the Group’s commitment to the energy transition
18 May 2021
NEXT UPDATE
Build a robust foundation for long-term growth
Q1 results and medium-term outlook

FY 2020 Results February 2021 26
Simplified, focused on four activities
Edouard SAUVAGEPaulo ALMIRANTE Cécile PREVIEU Sébastien ARBOLA
Four business activities
NetworksRenewables Client SolutionsThermal
& Supply
An organisation with clear priorities and high performance orientation
Jérôme STUBLER
Multi-technical servicesorganisational project

FY 2020 Results February 2021 2727
A key long-term growth engine for the Group
• ENGIE has a 13 GW portfolio of young wind and solar assets
− Average age of ~ 5 years
− Highly contracted with ~15 years of average residual duration
• On track to achieve 2019 target of commissioning 9 GW in three years by 2021
• Leadership position in corporate PPAs
• Primary focus on organic growth and targeted acquisition opportunities
− Intend to retain higher ownership of renewables
RENEWABLES
Renewables capacityunder constructionwith COD expected in 2021As at December 2020
Onshore wind
Offshore Wind
3.0 GW
0.3 GW
1.2 GW
1.5 GW
Solar

FY 2020 Results February 2021 2828
• Investing significantly in Networks to ensure safety, reliability and
improve energy efficiency
• Significant platform of regulated Networks in France
− Regulatory remunerations set through to 2024
− Playing a leading role in the development of renewable gases
• Leveraging on deep experience to drive growth internationally
− Importance of gas in emerging markets experiencing growth
and reducing exposure to coal / oil
− Focused on delivery of
power transmission lines
under construction
NETWORKS
53%
31%
13%
3%
GRDF
GRTgaz
Storengy
Elengy
French networks RAB
€28.3bn
Capital employed in international networks
€3.7bn
€1.2bn
€1.2bn
€1.2bn
Brazil
Europe
LatAm &
Other
Figures as at 31 Dec. 2020
+91additional
biomethane production units
connected in France in 2020
2,800kmpower transmission
linesunder construction
Figures as at 1 Jan. 2020

FY 2020 Results February 2021 2929
• Asset-based, decentralized energy solutions
− Attractive growth potential driven by decarbonization
targets and growth in energy efficiency solutions
− District Heating and Cooling (DHC), onsite generation,
onsite solar PV, green mobility, public lighting, smart cities
• Leadership positions and strong platform in Client Solutions
• Potential creation of a new leader in multi-technical services
− Strong growth prospects; healthy order book
and projects backlog of €11.7bn
CLIENT SOLUTIONS
30-yearcontract in Monaco for
seawater based DHC
Growth projected for decentralized
infrastructure
DHC worldwide revenue expected
to grow by over 5% p.a. to 2026
Source: IEA and Navigant

FY 2020 Results February 2021 30
Progress at pacein 2020, despite
challenging backdrop
Summary
Accelerating investment in Renewables,
Networks and Asset-based
Client Solutions
A simple andfocusedbusiness
organisation
Clear priorities for sustainable, long-term value
creation

FY 2020 Results February 2021 31
ADDITIONAL MATERIAL

FY 2020 Results February 2021 32
Negative impact from operations partially compensated by change in WCR improvement
FY20
CFFO
FY19
CFFO
(€bn)
Taxes &interest paid
Operatingcash flow
(1.1)
7.6
0.7
(0.2)0.0
7.1
Change in WCR for GEM
Change in WCR excluding GEM

FY 2020 Results February 2021 33
1 Including corporate, GTT, LNG activities in Noram and GEM
2020(€m) Renewables Networks
Client
solutions Thermal Supply Nuclear Others1 TOTAL
France 150 1,610 363 - 106 - - 2,229
Rest of Europe 87 71 131 370 100 (111) - 648
Latin America 750 384 (3) 359 53 - - 1,542
USA & Canada 62 2 24 43 (8) - 1 124
Middle East, Asia & Africa 65 3 41 441 (32) - - 518
Others (43) (6) (97) (3) (109) - (225) (483)
TOTAL 1,070 2,063 459 1,209 112 (111) (224) 4,578
2019(€m) Renewables Networks
Client
solutions Thermal Supply Nuclear Others1 TOTAL
France 182 1,957 575 - 149 - - 2,862
Rest of Europe 96 96 347 293 189 (314) - 707
Latin America 851 284 (1) 501 61 - - 1,696
USA & Canada 47 1 8 26 25 - 49 155
Middle East, Asia & Africa 70 14 25 523 (13) - - 619
Others (50) (8) 129 (23) (65) - (203) (221)
TOTAL 1,195 2,344 1,082 1,320 345 (314) (154) 5,819

FY 2020 Results February 2021 34
FY20
COI
FY19
COI
(€bn)
Covid-19
FX &Scope
(0.4)
5.80.2
0.3
(1.2)
4.6
PricesLean
2021 net
Others
(0.2)
Volumes
(0.0)

FY 2020 Results February 2021 35
ProvisionsAs at 31 Dec 2020
€8.9bn
€8.2bn
€7.6bn
€2.4bn
Pensions
Recycling & storage
& site rehabilitation
Dismantling
Others
€27.1bn
Details of some financial assets As at 31 Dec 2020
€6.8bn
€7.8bn
€11.6bn
Investments in associates and joint ventures
Assets from contracts with customers
Other financial assets
€26.1bn
Equity instruments at fair value through equity
Equity instruments at fair value through income
Debt instruments at fair value through equity
Debt instruments at fair value through income
Loans & receivables at amortized cost
€1.2bn
€0.5bn
€1.9bn
€1.8bn
€6.2bn

FY 2020 Results February 2021 36
(€m) FY 2019 FY 2020
EBITDA 10,366 9,276
of which recurring share in net income of equity method entities 592 690
Depreciation, amortization and others (4,547) (4,698)
CURRENT OPERATING INCOME 5,819 4,578
Financial result (1,282) (1,422)
of which recurring cost of net debt (674) (772)
of which cost of lease liabilities (48) (47)
of which others (561) (603)
Income tax (1,111) (801)
Non-controlling interests (743) (652)
NET RECURRING INCOME GROUP SHARE 2,683 1,703

FY 2020 Results February 2021 37
• Normalized temperature in France (gas distribution and supply)
• Normalized hydro production in France
• Full pass through of supply costs in French regulated gas tariffs
• No major regulatory or macro-economic changes
• No change in Group accounting policies
• Market commodity prices as of 12/31/2020
• Average forex for 2020: €/$: 1.23; €/BRL: 6.27
• Recurring effective tax rate for 2021: 25%
• Up to € 0.1bn dilution effect at the COI level from ca. €2bn disposals in addition to previously signed transactions
• No additional stringent lockdowns and gradual easing of restrictions over 2021

FY 2020 Results February 2021 38
• These estimates have been prepared in accordance with a standard guidance applied across our businesses under a dedicated oversight
process (losses of revenues being inherently subject to more judgement than the identification of specific costs incurred).
• These estimates relate to operating items only and are presented net of savings and mitigating management action plans. By definition, these
estimates exclude foreign exchange and commodity price effects incurred in the Group’s various businesses, whether positive or negative.
(€bn)
Estimated
COI level Nature
RENEWABLES (0.05) Lower volumes dispatched
NETWORKS (0.07) Lower volumes, lower capitalized costs, specific Covid-19 related purchases
CLIENT SOLUTIONS (0.60) Loss of revenues / contracts, specific Covid-19 related purchases
THERMAL (0.04) Lower demand
SUPPLY (0.29) Lower demand, unwinding of hedges, bad debts, lower B2C services
NUCLEAR (0.06) Adjusted maintenance operations
OTHERS (0.07) Credit losses
TOTAL (1.18) Net of savings / action plans

FY 2020 Results February 2021 39
1 Net of DBSO and tax equity proceeds
Client Solutions
USA – University of Iowa
USA – SoCore on site solar
France – DHC
Networks
Brazil – Power transmission lines
GRDF (smart meters + networks dvpt)
Elengy Fosmax acquisition
Brazil – 10% TAG
Renewables
Portugal – Hydro
Offshore JV – Ocean Winds
Latin America – Wind & Solar
~0.7
~0.2
~0.1
~0.1
~1.5
~0.5
~0.4
~0.2
~0.1
~1.5
~0.7
~0.4
~0.4
Main growth projects(€bn)
€7.7bn Capex, o/w €4.0bn growth Capex focused on strategic priorities
Growth1
Nuclear funding
Maintenance
Breakdown by nature(€bn)
10.0
7.7
20202019
4%
14%
38%
39%
1%
4%
1%
Client Solutions Asset light
Client Solutions Asset based
Networks
Renewables
Thermal
Supply
Others
€4.0bn1
Growth Capex
by business line(€bn)
7.2
0.2
2.6 2.4
1.3
4.0

FY 2020 Results February 2021 40
Slightly above plan
REVENUE ENHANCEMENT
Net COI improvement€bn, cumulated) PROCUREMENT
Pooling, insourcing, centralization
and standardization
DIGITALIZATIONCRM, process engineering
and automation, asset optimization
SHARED SERVICES CENTERS Coverage and optimization
COST REDUCTION
INDUSTRIAL ASSETS PERFORMANCE IMPROVEMENT
Availability and efficiency
IMPROVED SERVICES OFFERINGSPricing actions
Cum. 2020 3Y
84% of the
3Y-target
Cum. 2020 3 YearTarget
0.67
0.80
Initial
target
0.55

FY 2020 Results February 2021 41
Nuclear and Hydro
Outright hedgesVolumes & prices (% and €/MWh)
36
4246 47 46
2019 2020 2021 2022 2023
100% 47% 27%80%100%
As at 12/31/20
Belgium and France
(+ Germany until April 2019)

FY 2020 Results February 2021 42
• Significantly contracted positions up to and beyond 2030
• Limited merchant price risk
Onshore wind & solarHedge ratio @conso%, as at 31 December 2020
Residual contract duration
Volumes @conso%, 2020 Solar Wind
Geography
Residual
contract
duration
(years)
2020
(TWh)
Residual
contract
duration
(years)
2020
(TWh)
France 15.7 0.5 11.6 3.8
Rest of Europe 12.5 0.1 8.2 3.0
Brazil 18.0 0.5 11.9 3.5
Latin America (excl. Brazil) 17.1 0.7 13.7 0.3
USA & Canada 15.6 0.1 13.2 3.6
Rest of the World 22.8 1.4 17.8 1.8
Other (offshore wind) - - 18.8 -
Average 19.2 12.1
85% 84% 81% 78% 77% 74% 73% 73% 71% 70%
2021 2022 2023 2024 2025 2026 2027 2028 2029 2030

FY 2020 Results February 2021 43
45
59
-
15
-
8
75
2 44 63 3
4-
1620
139
-
27
-
28
2-
40
- - -0
10
20
30
40
50
60
By generation technology (years)
FRANCE REST OF EUROPE USA & CANADA LATIN AMERICA MIDDLE EAST,
ASIA & AFRICA
Hydro Wind Solar Natural Gas Coal Nuclear

FY 2020 Results February 2021 44
1. Following the announcements of the Belgium
government in Q4 2020, it has been decided to stop
all the preparation works that would allow a 20-year
extension of half of the second-generation units
beyond 2025 as it seems unlikely that such an
extension can take place given technical and
regulatory constraints.
2. This change in lifetime assumption as well as
changes in the commodity price scenario have led to
an impairment of €2.9bn for nuclear assets, which
have been accounted as non-recurring items in the
2020 P&L.
Nuclear impairment
by asset type
€2.1bn
€0.7bn
Goodwill
PP&E
€2.9bn

FY 2020 Results February 2021 45
Period of regulation
RAB remuneration
Type of tariff
Regulated asset base
(real pre-tax) at 01/01/2020 (in €bn)
Distribution 07/01/2020 -
30/06/2024
4.10%
+ incentives of 200bps over 20 years for Gazpar
Price cap yearly
update
14.9
Transmission 04/01/2020-
31/03/2024
4.25%
+ incentives up to 300bps over 10 years1
Cost +
yearly update
8.8
Storage 01/01/2020-
31/12/2024
4.75% Cost +
yearly update
Storengy: 3.6
Géométhane3: 0.1
LNG terminals 04/01/2017-
31/03/2021
7.25%2 + incentives 125bps
(for Capex decided in 2004-2008)
and 200bps for extensions over 10 years
Cost +
update every 2 years
0.9
TOTAL 28.3
1 Only for selected network projects in service prior to the ATRT7
2 6,25% from 1st of April 2021
3 Géométhane, an Economic Interest Group shared equally by Géosud and Storengy

FY 2020 Results February 2021 46
Forward-Looking statements
This communication contains forward-looking information and statements. These statements include financial projections, synergies, cost-savingsand estimates, statements regarding plans, objectives, savings, expectations and benefits from the transactions and expectations with respect tofuture operations, products and services, and statements regarding future performance. Although the management of ENGIE believes that theexpectations reflected in such forward-looking statements are reasonable, investors and holders of ENGIE securities are cautioned that forward-looking information and statements are not guarantees of future performances and are subject to various risks and uncertainties, many of whichare difficult to predict and generally beyond the control of ENGIE, that could cause actual results, developments, synergies, savings and benefits todiffer materially from those expressed in, or implied or projected by, the forward-looking information and statements. These risks anduncertainties include those discussed or identified in the public filings made by ENGIE with the Autorité des Marchés Financiers (AMF), includingthose listed under “facteurs de risque” (risk factors) section in the Document de Référence filed by ENGIE (ex GDF SUEZ) with the AMF on March18, 2020 (under no: D.20-141). Investors and holders of ENGIE securities should consider that the occurrence of some or all of these risks mayhave a material adverse effect on ENGIE.

FY 2020 Results February 2021 47
Ticker: ENGI
FOR MORE INFORMATION ABOUT FY 2020 RESULTS:https://www.engie.com/en/finance/results/2020
+33 1 44 22 66 29 [email protected]
https://www.engie.com/en/financial-results