fecal microbiota transplantation in experimental ...maintain such homeostasis. significant...
TRANSCRIPT

Fecal Microbiota Transplantation in Experimental UlcerativeColitis Reveals Associated Gut Microbial and Host MetabolicReprogramming
Zhi-Xiang Yan,a,b Xue-Jiao Gao,a,b Ting Li,a,b Bin Wei,a,b Pan-Pan Wang,a,b Ying Yang,a,b Ru Yana,b
aState Key Laboratory of Quality Research in Chinese Medicine, Institute of Chinese Medical Sciences,University of Macau, Taipa, Macao, China
bZhuhai UM Science and Technology Research Institute, Zhuhai, China
ABSTRACT Fecal microbiota transplantation (FMT) is gaining attention for the treat-ment of ulcerative colitis (UC). Data from individual case studies have suggested thatFMT may be beneficial for UC, but the detailed microbial and molecular basis re-mains unknown. Here, we employ 16S rRNA gene sequencing and metabolomics toinvestigate the influence of FMT on gut microbial community composition and hostmetabolism in the dextran sulfate sodium-induced UC rat model. The findings fromthis pilot study suggest that FMT from normal donors to UC recipients could allevi-ate UC symptoms without close resemblance of donor’s gut microbial and metabolicpattern. Meanwhile, FMT from UC donors to normal recipient rats triggered UCsymptoms, UC-prone microbial shift, and host metabolic adaption. Gut microbiotaunder normal conditions could maintain stable species richness and diversity uponFMT intervention, but the disturbed gut microbiota under UC conditions could notmaintain such homeostasis. Significant correlations between altered bacterialcomposition and host metabolism could be assigned to the pathological effects ofUC (accounting for 8.0 to 16.2% of total variance) and/or the FMT intervention ef-fects (3.9 to 7.0% of total variance). Overall, our study reveals diverse gut microbialshifts in UC related FMT and their association with host metabolic reprogramming.
IMPORTANCE This study combined clinical symptoms measurement, 16S rRNA genemicrobial profiling and metabolomics to comprehensively investigate the gut bacte-rial and host metabolic association and reprogramming in FMT-treated experimentalUC. These data can advance our understanding of the effect of FMT on UC and theinvolvement of gut microbial dysbiosis in the development of UC.
KEYWORDS fecal microbiota transplantation, gut microbiota, host metabolism,ulcerative colitis
Fecal microbiota transplantation (FMT) aims to restore gut homeostasis by transfer-ring feces from a healthy donor to a patient suffering from gut microbial imbalance.
The therapy has been successfully used in the treatment of Clostridium difficile infection(CDI) (1–4). The success of treating CDI with FMT has promoted FMT-based therapeuticsfor other diseases, notably ulcerative colitis (UC), a chronic, relapsing, idiopathic,inflammatory disorder of the colon and rectum (5, 6). However, while CDI mainly resultsfrom Clostridium difficile infection and the resulting breakdown of gut microbiotadiversity, the pathogenesis of UC is more complex, multifactorial, and not fully under-stood. Abnormal host immune responses, dysfunctional intestinal barriers, and gutmicrobiota dysbiosis, as well as environmental and other, unknown factors, are asso-ciated with UC (5, 6). Moreover, it is not yet known whether gut microbial dysbiosis isa cause or effect of UC.
Although individual case studies of two randomized controlled trials (7, 8) have
Received 19 February 2018 Accepted 20 April2018
Accepted manuscript posted online 4 May2018
Citation Yan Z-X, Gao X-J, Li T, Wei B, WangP-P, Yang Y, Yan R. 2018. Fecal microbiotatransplantation in experimental ulcerativecolitis reveals associated gut microbial andhost metabolic reprogramming. Appl EnvironMicrobiol 84:e00434-18. https://doi.org/10.1128/AEM.00434-18.
Editor Andrew J. McBain, University ofManchester
Copyright © 2018 American Society forMicrobiology. All Rights Reserved.
Address correspondence to Ru Yan,[email protected].
Z.-X.Y. and X.-J.G. contributed equally to thisarticle.
PUBLIC AND ENVIRONMENTALHEALTH MICROBIOLOGY
crossm
July 2018 Volume 84 Issue 14 e00434-18 aem.asm.org 1Applied and Environmental Microbiology
on June 1, 2020 by guesthttp://aem
.asm.org/
Dow
nloaded from

suggested that FMT may be beneficial for UC, there were many inconsistencies be-tween the results. In one study, 24% of patients who received FMT and 5% whoreceived placebo entered remission after 7 weeks (7). In the other study, UC patientsreceiving FMT from healthy donors and autologous FMT (their own fecal microbiota)did not show statistically significant difference in clinical remission (8). Only 41% ofpatients who received donor FMT achieved clinical and endoscopic remission. A morerecent study indicates that, despite variation in processes, FMT appears to be effectivefor inducing remission in UC, with no major short-term safety signals (9). Overall, therehave been a limited number of studies evaluating the effectiveness of FMT in UC.
Numerous studies have shown that gut microbiota has a great impact on individualmetabolite profiles (10–13). A recent study indicated that FMT restores normal fecal bileacid composition in recurrent CDI (1). However, integrated metabolomics and metagenom-ics have not been employed to study the effect of FMT in UC, the pathogenesis of whichis more complex than CDI. Furthermore, it is unclear whether the metabolite alteration inFMT is due to the development of disease or microbial intervention. It is also unclear towhat extent FMT changes the metabolic pattern. For metabolic profiling, urine offers manyadvantages over other biofluids due to its noninvasiveness, lack of volume limit, and lessdemanding sample preparation procedures for liquid chromatography-mass spectrometry(LC-MS) (14). In this study, we used targeted urinary metabolomics and high-throughput16S rRNA gene sequencing to investigate the influence of FMT on the gut microflora andhost metabolism in dextran sulfate sodium (DSS)-induced UC. We demonstrated thatalteration of bacterial composition was accompanied by diverse and associated metabolicalterations.
RESULTS AND DISCUSSIONNormal-to-UC FMT alleviates UC symptoms without resembling the donor’s
gut microbial and metabolic pattern. In this study, we combined phenotyping,targeted metabolomics and 16S rRNA gene microbial profiling to comprehensivelyevaluate the impact of fecal microbiota transplantation in DSS-induced experimentalUC. UC is characterized by periods of exacerbation (active disease) and remission(inactive disease). Most previous studies treated rats with 5% DSS for 7 days to establishexperimental acute colitis (15, 16). Earlier studies in our laboratory found that colitissymptoms, such as rectal bleeding and diarrhea, occur as early as 2 to 3 daysfollowing DSS administration and that inflammation is fully installed within 6 to 7days (17, 18). Thus, we carried out FMT from the initial stage (day 0) rather thanafter colitis establishment (day 7) to evaluate the impact of microbial changes to colitisdevelopment.
The unsupervised principal-component analysis (PCA) plot (Fig. 1) and clusteredheatmap (see Fig. S1 in the supplemental material) showed significant intergroupdistinction on days 3, 5, and 7 based on UC symptom indicators (Table 1). While the UCgroup showed a significantly increased disease activity index (DAI) score and pro- andanti-inflammatory cytokines, transplantation of fecal microbiota of normal rats effec-tively alleviated these UC symptoms in the UN group (i.e., UC recipients of normal fecalmicrobiome) on days 5 and 7 (see Fig. S1B and C in the supplemental material).Correspondingly, the UN group scattered closer to the N group in the PCA plot (Fig. 1Bto D). It should be noted that the continued DSS treatment probably also affects themicrobiota transplanted from the normal (N) group and thus obscures the influence ofthe N microbiota in the UN group. To minimize the influence of DSS on FMT, our futurestudy will first establish the disease in the model and then perform FMT without DSStreatment to evaluate the impact of the N microbiota on UC.
The bacterial operational taxonomic unit (OTU) profile of the UC group on days 5and 7 was essentially separated from that of other groups in the PCA plots (see Fig. S2Aand C in the supplemental material). In contrast, the UN group clustered together withthe N group, as well as normal recipients receiving FMT from normal donors (NN) (seeFig. S2A in the supplemental material), on day 5 and moved away from them on day7 (see Fig. S2C in the supplemental material). Furthermore, the UN group showed the
Yan et al. Applied and Environmental Microbiology
July 2018 Volume 84 Issue 14 e00434-18 aem.asm.org 2
on June 1, 2020 by guesthttp://aem
.asm.org/
Dow
nloaded from
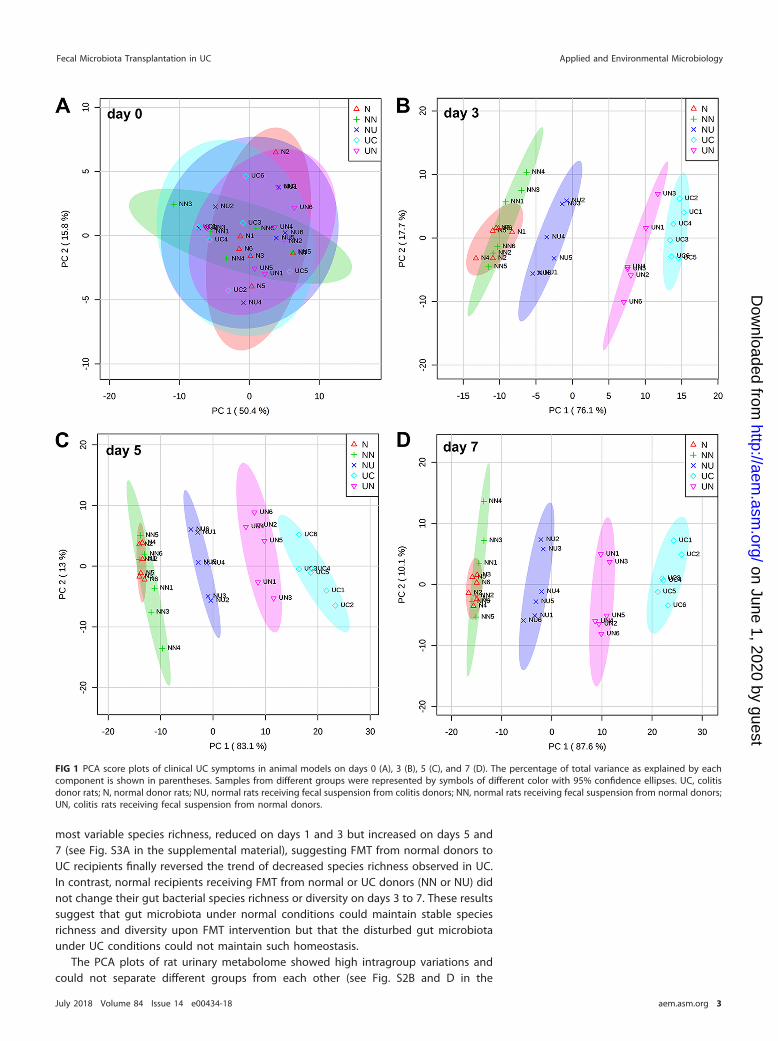
most variable species richness, reduced on days 1 and 3 but increased on days 5 and7 (see Fig. S3A in the supplemental material), suggesting FMT from normal donors toUC recipients finally reversed the trend of decreased species richness observed in UC.In contrast, normal recipients receiving FMT from normal or UC donors (NN or NU) didnot change their gut bacterial species richness or diversity on days 3 to 7. These resultssuggest that gut microbiota under normal conditions could maintain stable speciesrichness and diversity upon FMT intervention but that the disturbed gut microbiotaunder UC conditions could not maintain such homeostasis.
The PCA plots of rat urinary metabolome showed high intragroup variations andcould not separate different groups from each other (see Fig. S2B and D in the
FIG 1 PCA score plots of clinical UC symptoms in animal models on days 0 (A), 3 (B), 5 (C), and 7 (D). The percentage of total variance as explained by eachcomponent is shown in parentheses. Samples from different groups were represented by symbols of different color with 95% confidence ellipses. UC, colitisdonor rats; N, normal donor rats; NU, normal rats receiving fecal suspension from colitis donors; NN, normal rats receiving fecal suspension from normal donors;UN, colitis rats receiving fecal suspension from normal donors.
Fecal Microbiota Transplantation in UC Applied and Environmental Microbiology
July 2018 Volume 84 Issue 14 e00434-18 aem.asm.org 3
on June 1, 2020 by guesthttp://aem
.asm.org/
Dow
nloaded from
supplemental material). To further increase the group distinction, supervised partialleast-squares discriminant analysis (PLS-DA) was used, which revealed that, comparedto the UC group, the UN group diverged more significantly from the N and NN groupsat both species and genus levels (Fig. 2A, B, D, E, G, and H). Taken together, our studysuggested that FMT contributed UC remission could be achieved through alternativemicrobial and host metabolic reprograming in the recipients without close resem-blance of donor’s gut microbial and metabolic pattern. Hippuric acid, a dominanthost-microbial cometabolite, has been reported to be reduced under UC and Crohn’sdisease conditions due to differential gut microbial metabolism (19, 20, 21). Hippuricacid was significantly reduced in the UC and UN groups from days 2 to 5 and from days1 to 7 (except day 6), respectively (Fig. 3A). The extended duration of hippuric acidreduction in the UN group suggested a more sensitive (since it changed on day 1) andpronounced UC-prone metabolic shift. The relative abundances of C10:3 acylcarnitine,hydroxyphenylpropionylglycine, and riboflavin remained virtually unchanged amongthe N, NN, and NU groups (Fig. 3B to D). The levels increased in UC group and increasedeven more dramatically in the UN group in most cases. Acylcarnitines and acylglycinesare important biochemical markers for the diagnosis of disorders of mitochondrial fattyacid �-oxidation (22, 23, 24), and their increase signified disturbances in fatty acid�-oxidation in the UC and UN groups. It should be noted that unlike medium-chainacylcarnitines (e.g., C10:3 acylcarnitine), short-chain acylcarnitines such as acetylcarni-tine, butyrylcarnitine, and C-5�O acylcarnitine did not show significant change. Itshould also be noted that the high sensitivity and metabolite coverage of LC-MSrevealed more metabolic alterations in UC than noted in a previous nuclear magneticresonance (NMR)-based study (20, 25).
Two highly positively correlated (R � 0.67, P � 0.000001) cis-3,4-methylene deriv-atives (cis-3,4-methylene-heptanoylcarnitine and cis-3,4-methylene-heptanoylglycine)
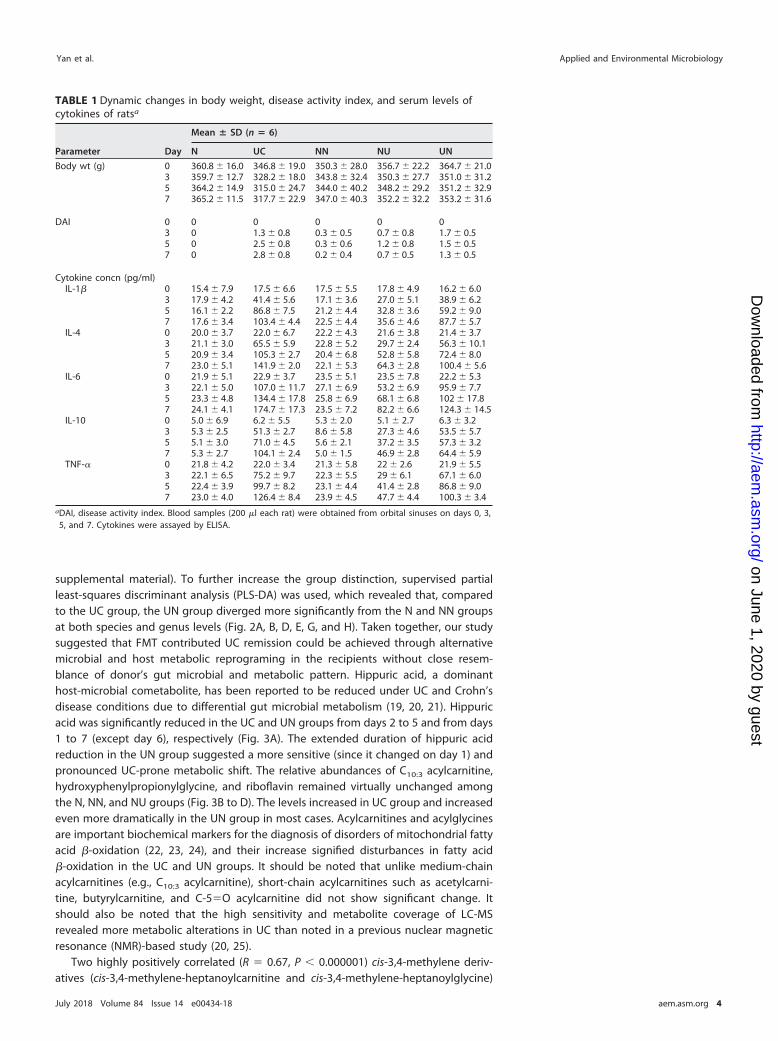
TABLE 1 Dynamic changes in body weight, disease activity index, and serum levels ofcytokines of ratsa
Parameter Day
Mean � SD (n � 6)
N UC NN NU UN
Body wt (g) 0 360.8 � 16.0 346.8 � 19.0 350.3 � 28.0 356.7 � 22.2 364.7 � 21.03 359.7 � 12.7 328.2 � 18.0 343.8 � 32.4 350.3 � 27.7 351.0 � 31.25 364.2 � 14.9 315.0 � 24.7 344.0 � 40.2 348.2 � 29.2 351.2 � 32.97 365.2 � 11.5 317.7 � 22.9 347.0 � 40.3 352.2 � 32.2 353.2 � 31.6
DAI 0 0 0 0 0 03 0 1.3 � 0.8 0.3 � 0.5 0.7 � 0.8 1.7 � 0.55 0 2.5 � 0.8 0.3 � 0.6 1.2 � 0.8 1.5 � 0.57 0 2.8 � 0.8 0.2 � 0.4 0.7 � 0.5 1.3 � 0.5
Cytokine concn (pg/ml)IL-1� 0 15.4 � 7.9 17.5 � 6.6 17.5 � 5.5 17.8 � 4.9 16.2 � 6.0
3 17.9 � 4.2 41.4 � 5.6 17.1 � 3.6 27.0 � 5.1 38.9 � 6.25 16.1 � 2.2 86.8 � 7.5 21.2 � 4.4 32.8 � 3.6 59.2 � 9.07 17.6 � 3.4 103.4 � 4.4 22.5 � 4.4 35.6 � 4.6 87.7 � 5.7
IL-4 0 20.0 � 3.7 22.0 � 6.7 22.2 � 4.3 21.6 � 3.8 21.4 � 3.73 21.1 � 3.0 65.5 � 5.9 22.8 � 5.2 29.7 � 2.4 56.3 � 10.15 20.9 � 3.4 105.3 � 2.7 20.4 � 6.8 52.8 � 5.8 72.4 � 8.07 23.0 � 5.1 141.9 � 2.0 22.1 � 5.3 64.3 � 2.8 100.4 � 5.6
IL-6 0 21.9 � 5.1 22.9 � 3.7 23.5 � 5.1 23.5 � 7.8 22.2 � 5.33 22.1 � 5.0 107.0 � 11.7 27.1 � 6.9 53.2 � 6.9 95.9 � 7.75 23.3 � 4.8 134.4 � 17.8 25.8 � 6.9 68.1 � 6.8 102 � 17.87 24.1 � 4.1 174.7 � 17.3 23.5 � 7.2 82.2 � 6.6 124.3 � 14.5
IL-10 0 5.0 � 6.9 6.2 � 5.5 5.3 � 2.0 5.1 � 2.7 6.3 � 3.23 5.3 � 2.5 51.3 � 2.7 8.6 � 5.8 27.3 � 4.6 53.5 � 5.75 5.1 � 3.0 71.0 � 4.5 5.6 � 2.1 37.2 � 3.5 57.3 � 3.27 5.3 � 2.7 104.1 � 2.4 5.0 � 1.5 46.9 � 2.8 64.4 � 5.9
TNF-� 0 21.8 � 4.2 22.0 � 3.4 21.3 � 5.8 22 � 2.6 21.9 � 5.53 22.1 � 6.5 75.2 � 9.7 22.3 � 5.5 29 � 6.1 67.1 � 6.05 22.4 � 3.9 99.7 � 8.2 23.1 � 4.4 41.4 � 2.8 86.8 � 9.07 23.0 � 4.0 126.4 � 8.4 23.9 � 4.5 47.7 � 4.4 100.3 � 3.4
aDAI, disease activity index. Blood samples (200 �l each rat) were obtained from orbital sinuses on days 0, 3,5, and 7. Cytokines were assayed by ELISA.
Yan et al. Applied and Environmental Microbiology
July 2018 Volume 84 Issue 14 e00434-18 aem.asm.org 4
on June 1, 2020 by guesthttp://aem
.asm.org/
Dow
nloaded from

were also increased in the UN and UC groups but remained constant in the other threegroups (see Fig. S4 in the supplemental material). Once more, the extended duration ofalteration was observed in the UN group. Libert et al. reported that cis-3,4-methylene-heptanoylcarnitine is present in human urine, except in urine from newborn patients(26). These researchers further found that the acylcarnitines with a cyclopropane ringin their fatty acid moieties disappeared in the urine of humans treated with antibiotic.Fatty acids with cyclopropane rings can be synthesized in bacterial membranes by
FIG 2 PLS-DA score plots of gut bacterial composition at the species (A, D, and G) and genus (B, E, and H) levels, as well as host urinary metabolome profiles(C, F, and I), on days 3, 5, and 7. The percentage of total variance as explained by each component is shown in parentheses. Samples from different groupsare represented by symbols of different color with 95% confidence ellipses. The leave-one-out cross-validation (LOOCV) results for each PLS-DA model are asfollows: A (R2 � 0.84, Q2 � 0.43), B (R2 � 0.74, Q2 � 0.58), C (R2 � 0.97, Q2 � 0.65), D (R2 � 0.70, Q2 � 0.34), E (R2 � 0.74, Q2 � 0.43), F (R2 � 0.91, Q2 � 0.58),G (R2 � 0.62, Q2 � 0.18), H (R2 � 0.82, Q2 � 0.55), and I (R2 � 0.91, Q2 � 0.57).
Fecal Microbiota Transplantation in UC Applied and Environmental Microbiology
July 2018 Volume 84 Issue 14 e00434-18 aem.asm.org 5
on June 1, 2020 by guesthttp://aem
.asm.org/
Dow
nloaded from

cyclopropane fatty acid synthase (27). Therefore, it has been proposed that cis-11,12-methylene-pentadecanoic acid generated by cyclopropane fatty acid synthase in bac-teria could be absorbed and metabolized through �-oxidation in mitochondria to formcis-3,4-methylene-heptanoyl coenzyme A, which would then be converted into acyl-carnitines and excreted (28). Therefore, the increased cis-3,4-methylene derivatives mayalso be due to the altered host utilization of bacterial fatty acids.
UC-to-normal FMT triggers UC symptoms, microbial shift, and host metabolicadaption. FMT from UC to normal rats (NU) resulted in UC symptoms, including anincreased DAI score and pro- and anti-inflammatory cytokine concentrations (Table 1and Fig. S1 in the supplemental material) and thus shifted to the UC group in PCA plots(Fig. 1). PLS-DA plots illustrates the gradual microbial shift from normal to UC status atspecies (Fig. 2A, D, and G) and genus (Fig. 2B, E, and H) levels from days 3 to 7. Therewas also a subtle alteration of NU metabolome, which partially shifted to the UC zoneon days 3 and 5 and shifted back to N and NN on day 7 (Fig. 2C, F, and I). Hippuric acidshowed a tendency toward reduction in the NU group on day 3 (P � 0.06), wassignificantly reduced on day 4 (P � 0.05) and day 5 (P � 0.01), and was restored to
FIG 3 Increased UC-prone metabolic shift in UC rats receiving FMT from normal rats (UN). Data are expressed as box-and-whisker plotswith median, quartiles, and ranges. The relative abundances of hippuric acid (A), C10:3 acylcarnitine (B), hydroxyphenylpropionylglycine (C),and riboflavin (D) are presented. *, P � 0.05 versus N; **, P � 0.01 versus N; #, P � 0.05 (UN versus UC).
Yan et al. Applied and Environmental Microbiology
July 2018 Volume 84 Issue 14 e00434-18 aem.asm.org 6
on June 1, 2020 by guesthttp://aem
.asm.org/
Dow
nloaded from
normal levels on days 6 and 7 (Fig. 3A). The restoration on days 6 and 7 was probablydue to the ongoing host metabolic adaptation to FMT intervention. In contrast to theUN group, FMT from normal to normal (NN) did not introduce appreciable alteration ingut bacterial or host metabolic profiles, proving that the fecal microbial composition ofFMT donors has a significant effect on recipients. It should be noted that in this study,FMT was performed by a single oral dose of a 1-g/kg fecal suspension for 7 days. Thus,a 250- to 350-g rat will only receive 1.5 to 2.1 mg of DSS per day through FMT basedon a previous report showing that only 6 mg of DSS existed in 1 g of feces from aDSS-treated rat (29). In contrast, a rat would receive 2.5 to 4.0 g of DSS per day throughdrinking water (50 to 80 ml of water containing 5% DSS). Given that FMT introduced1,700- to 2,700-fold less DSS than drinking water, the fecal DSS would have negligibleeffect on rats. A previous study showed that the transplantation of multiple entericbacterial species (Bacteroides species, Enterococcus faecalis, Escherichia coli, Pseudomo-nas fluorescens, and Fusobacterium varium) and Mycobacterium paratuberculosis togermfree mice results in the development of chronic intestinal inflammation (30). Inaddition, germfree mice colonized by gut microbiota from UC patients were moresusceptible to colitis than mice receiving microbiota from healthy humans (31). Inaccordance with previous reports, our study indicates the involvement of gut micro-biota in the pathogenesis of UC.
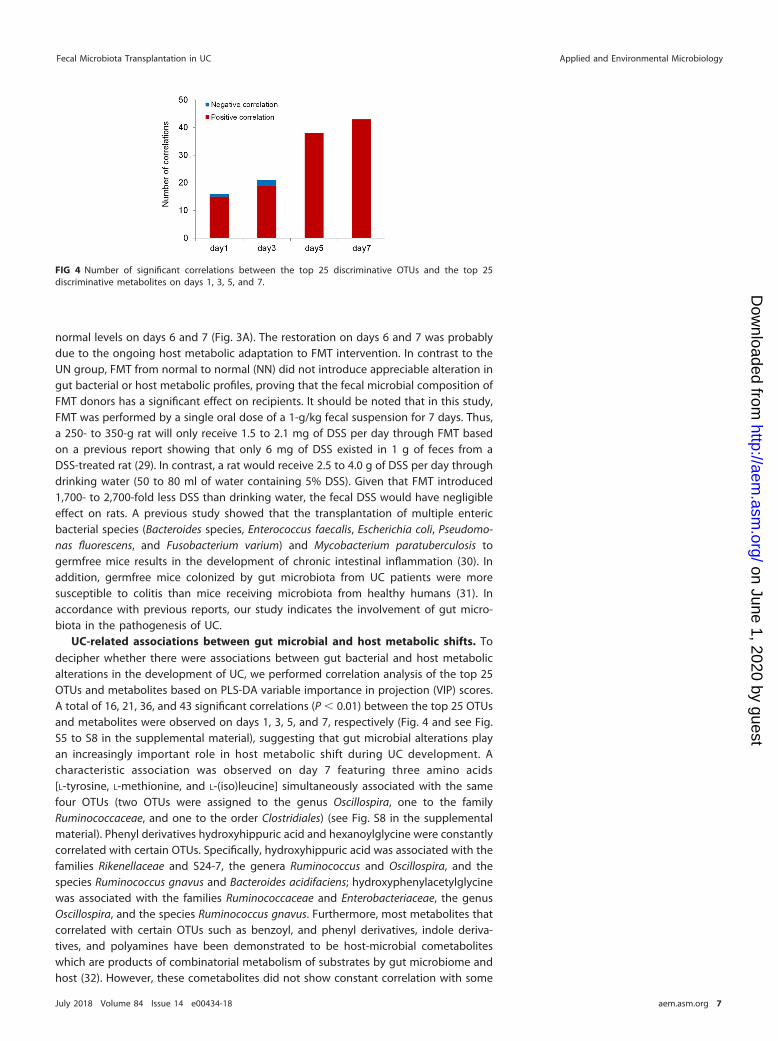
UC-related associations between gut microbial and host metabolic shifts. Todecipher whether there were associations between gut bacterial and host metabolicalterations in the development of UC, we performed correlation analysis of the top 25OTUs and metabolites based on PLS-DA variable importance in projection (VIP) scores.A total of 16, 21, 36, and 43 significant correlations (P � 0.01) between the top 25 OTUsand metabolites were observed on days 1, 3, 5, and 7, respectively (Fig. 4 and see Fig.S5 to S8 in the supplemental material), suggesting that gut microbial alterations playan increasingly important role in host metabolic shift during UC development. Acharacteristic association was observed on day 7 featuring three amino acids[L-tyrosine, L-methionine, and L-(iso)leucine] simultaneously associated with the samefour OTUs (two OTUs were assigned to the genus Oscillospira, one to the familyRuminococcaceae, and one to the order Clostridiales) (see Fig. S8 in the supplementalmaterial). Phenyl derivatives hydroxyhippuric acid and hexanoylglycine were constantlycorrelated with certain OTUs. Specifically, hydroxyhippuric acid was associated with thefamilies Rikenellaceae and S24-7, the genera Ruminococcus and Oscillospira, and thespecies Ruminococcus gnavus and Bacteroides acidifaciens; hydroxyphenylacetylglycinewas associated with the families Ruminococcaceae and Enterobacteriaceae, the genusOscillospira, and the species Ruminococcus gnavus. Furthermore, most metabolites thatcorrelated with certain OTUs such as benzoyl, and phenyl derivatives, indole deriva-tives, and polyamines have been demonstrated to be host-microbial cometaboliteswhich are products of combinatorial metabolism of substrates by gut microbiome andhost (32). However, these cometabolites did not show constant correlation with some
FIG 4 Number of significant correlations between the top 25 discriminative OTUs and the top 25discriminative metabolites on days 1, 3, 5, and 7.
Fecal Microbiota Transplantation in UC Applied and Environmental Microbiology
July 2018 Volume 84 Issue 14 e00434-18 aem.asm.org 7
on June 1, 2020 by guesthttp://aem
.asm.org/
Dow
nloaded from
specific OTUs, probably because they were produced by multiple bacterial species andwere also affected by host factors.
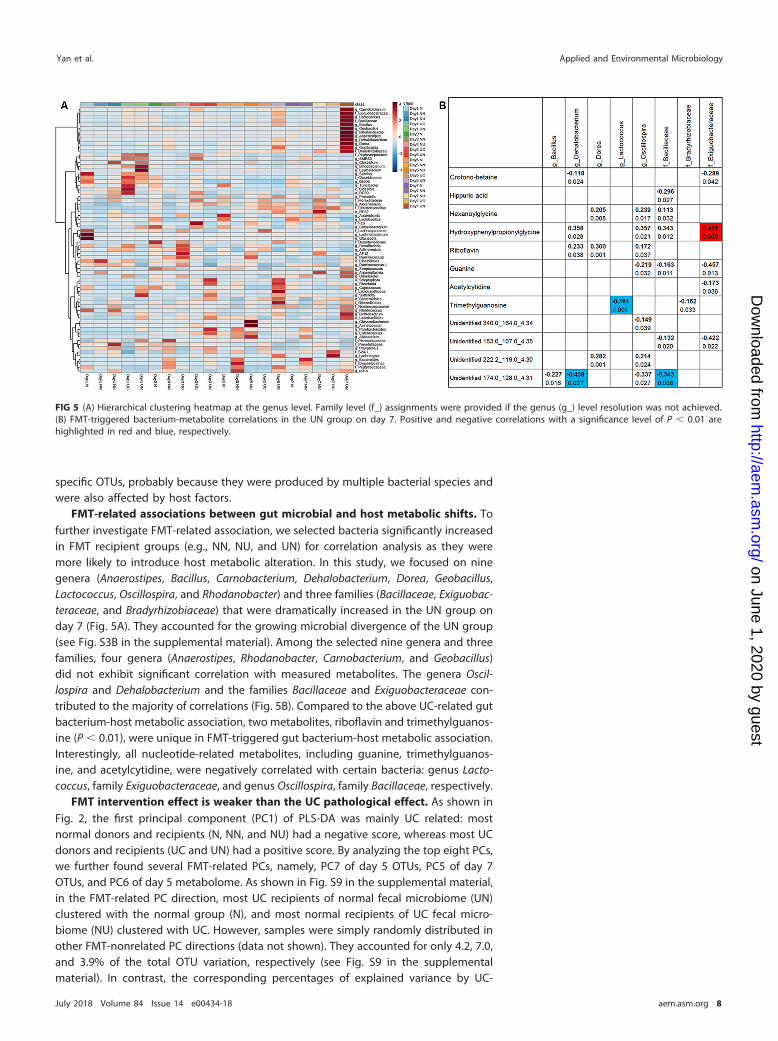
FMT-related associations between gut microbial and host metabolic shifts. Tofurther investigate FMT-related association, we selected bacteria significantly increasedin FMT recipient groups (e.g., NN, NU, and UN) for correlation analysis as they weremore likely to introduce host metabolic alteration. In this study, we focused on ninegenera (Anaerostipes, Bacillus, Carnobacterium, Dehalobacterium, Dorea, Geobacillus,Lactococcus, Oscillospira, and Rhodanobacter) and three families (Bacillaceae, Exiguobac-teraceae, and Bradyrhizobiaceae) that were dramatically increased in the UN group onday 7 (Fig. 5A). They accounted for the growing microbial divergence of the UN group(see Fig. S3B in the supplemental material). Among the selected nine genera and threefamilies, four genera (Anaerostipes, Rhodanobacter, Carnobacterium, and Geobacillus)did not exhibit significant correlation with measured metabolites. The genera Oscil-lospira and Dehalobacterium and the families Bacillaceae and Exiguobacteraceae con-tributed to the majority of correlations (Fig. 5B). Compared to the above UC-related gutbacterium-host metabolic association, two metabolites, riboflavin and trimethylguanos-ine (P � 0.01), were unique in FMT-triggered gut bacterium-host metabolic association.Interestingly, all nucleotide-related metabolites, including guanine, trimethylguanos-ine, and acetylcytidine, were negatively correlated with certain bacteria: genus Lacto-coccus, family Exiguobacteraceae, and genus Oscillospira, family Bacillaceae, respectively.
FMT intervention effect is weaker than the UC pathological effect. As shown inFig. 2, the first principal component (PC1) of PLS-DA was mainly UC related: mostnormal donors and recipients (N, NN, and NU) had a negative score, whereas most UCdonors and recipients (UC and UN) had a positive score. By analyzing the top eight PCs,we further found several FMT-related PCs, namely, PC7 of day 5 OTUs, PC5 of day 7OTUs, and PC6 of day 5 metabolome. As shown in Fig. S9 in the supplemental material,in the FMT-related PC direction, most UC recipients of normal fecal microbiome (UN)clustered with the normal group (N), and most normal recipients of UC fecal micro-biome (NU) clustered with UC. However, samples were simply randomly distributed inother FMT-nonrelated PC directions (data not shown). They accounted for only 4.2, 7.0,and 3.9% of the total OTU variation, respectively (see Fig. S9 in the supplementalmaterial). In contrast, the corresponding percentages of explained variance by UC-
FIG 5 (A) Hierarchical clustering heatmap at the genus level. Family level (f_) assignments were provided if the genus (g_) level resolution was not achieved.(B) FMT-triggered bacterium-metabolite correlations in the UN group on day 7. Positive and negative correlations with a significance level of P � 0.01 arehighlighted in red and blue, respectively.
Yan et al. Applied and Environmental Microbiology
July 2018 Volume 84 Issue 14 e00434-18 aem.asm.org 8
on June 1, 2020 by guesthttp://aem
.asm.org/
Dow
nloaded from

related PC1 were 8.0, 16.2, and 16.9% (Fig. 2A, D, and G), which were 1.9-, 2.3-, and4.4-fold greater than their FMT-related counterparts, respectively, suggesting that theFMT intervention effect was weaker than the UC pathological effect in microbial andmetabolic reprogramming. Similarly, a recent study found that FMT from highly feed-efficient donors shows little effects on age-related changes in feed efficiency-associatedfecal microbiota in chickens (33). Taken together, these results suggest that host- andenvironment-related factors may more strongly affect host fecal microbiota and me-tabolism than the FMT.
MATERIALS AND METHODSAnimals and FMT. Male Sprague-Dawley rats (250 to 300 g; Animal Facility of University of Macau)
were housed in a temperature-controlled room (23 � 1°C) with a 12-h light/dark cycle under specific-pathogen-free conditions. Rats were allowed to acclimate to the new environment for 4 days prior toexperiments with ad libitum access to standard chew (comprised of corn, fish meal, wheat flour, salt,vitamins, trace elements, amino acids, etc.) and demineralized water. All experimental proceduresinvolving animals were approved by the Animal Research Ethics Committee, University of Macau(UMAEC-2015-09).
Rats were randomly divided into five groups (n � 6 each group). Two donor groups were colitisdonor rats (UC) and normal donor rats (N). Three recipient groups were normal rats receiving fecalsuspension from colitis (NU) and normal (NN) donors and colitis rats receiving fecal suspension fromnormal donors (UN). Throughout the experimental period, rats were fed standard chow, and bottles wererefilled daily with fresh 5% DSS (MP Biomedicals, Santa Cruz, CA) for the UC and UN groups ordemineralized water for the N, NN, and NU groups for 7 days. The fecal samples from normal and UCdonor rats were freshly collected daily at 10:00 a.m. and pooled at equal amounts within each group. Onegram of pooled fecal samples from each donor group was suspended in 10 ml of sterile 0.9% normalsaline by vortexing. The FMT was performed by a single oral administration of a 1-g/kg fecal suspensionfor 7 days. Body weight and stool consistency of each rat were recorded daily. The blood samples werecollected on days 0, 3, 5, and 7. Fecal microbiota and urine samples were obtained by taking individualrats out of their cages and collecting fecal pellets and drops of urine. Fecal and urine samples werecollected on days 0 to 7 and stored at �80°C immediately after collection.
Assessment of clinical symptoms in animal models. Each rat was given a disease activity index(DAI) score based on weight loss, stool consistency, and bloody stool according to our previous report(34). Blood samples (200 �l) were obtained from the orbital sinus, and proinflammatory (interleukin-1�
[IL-1�], IL-6, and tumor necrosis factor alpha [TNF-�]) and anti-inflammatory (IL-4 and IL-10) cytokines inthe serum were measured using enzyme-linked immunosorbent assay (ELISA) kits from Excell BiologicalCo., Ltd. (Shanghai, China), according to the manufacturer’s instructions.
Targeted urinary metabolomics. Portions (25 �l) of urine were mixed with 100 �l of 5% methanol,vortexed, and centrifuged at 14,000 � g for 15 min (4°C). The supernatant was subjected to targetedurinary metabolomics analysis with an Agilent 1200 rapid-resolution liquid chromatograph coupled witha 4000 QTRAP (Applied Biosystems/MDS Sciex) mass spectrometer using the same parameters as in ourprevious study (14). Briefly, 5 �l of sample was separated on a Zorbax SB-C18 (100 by 2.1 mm, 1.8 �m;Agilent) column at the flow rate of 200 �l min�1 using 0.1% formic acid in H2O (A) and 0.1% formic acidin acetonitrile (B). The mass spectrometer was operated in positive-ion mode, and scheduled multiplereaction monitoring was used for targeted quantification of 410 transitions covering 235 identifiedmetabolites with the same collision energy and declustering potential listed in Table S2 in our previousstudy (14). The quantified metabolites included amino acids, acylglycines, acylcarnitines, bile acids,cholines, indoles, nucleotides, polyamines, purines, dipeptides, and steroids, which was comprehensiveenough to provide important biological information. The scan time and the detection window were 2and 140 s, respectively. Following acquisition, data were extracted by peak finding and alignment usingthe MarkerView software 1.2 (AB Sciex) with the following parameters: smoothing half-width, 1 point;baseline subtraction window, 2.0 min; noise percentage, 50%; peak-splitting factor, 2; minimum requiredintensity, 300; minimum peak width, 6 points; minimum signal-to-noise, 5.0; maximum number of peaks,1,000; and retention time tolerance, 0.2 min.
Microbial community profiling by 16S rRNA gene sequencing. Microbial genomic DNA wasextracted from fecal samples by using a Qiagen QIAamp DNA stool minikit according to the manufac-turer’s protocol. PCR was performed using the primers 338F (5=-ACTCCTACGGGAGGCAGCA-3=) and 806R(5=-GGACTACHVGGGTWTCTAAT-3=) (95°C for 3 min, followed by 30 cycles of 95°C for 30 s, 55°C for 30 s,72°C for 45 s, and 72°C for 10 min) (35). Microbial community composition was determined bysequencing the V3-V4 variable region of the 16S rRNA gene using the Illumina MiSeq platform (SanDiego, CA) and trimmed using a 5-bp sliding window with 1-bp-length steps based on the phredalgorithm (36). The sequenced reads were assembled into single end reads using FLASH version 1.2.6(37). Chimeric sequences were removed using UCHIME (38) in mothur version 1.31.2 (39), and sequencesthat exhibited the following characteristics were discarded: read length, �200 bp; ambiguous basecalling; six-base homopolymer runs; lack of primers; primer mismatches; or uncorrectable barcodes. The16S rRNA sequences were clustered into species-level phylotypes using the closed-reference OTU pickingprotocol (40) against Greengenes database version 13_5 (41) with a threshold of 97% using theQuantitative Insights into Microbial Ecology (QIIME) software (42). The most abundant read from each
Fecal Microbiota Transplantation in UC Applied and Environmental Microbiology
July 2018 Volume 84 Issue 14 e00434-18 aem.asm.org 9
on June 1, 2020 by guesthttp://aem
.asm.org/
Dow
nloaded from
OTU was selected as the representative read for that OTU. The taxonomy associated with the Greengenesdatabase to which OTUs matched was assigned to OTUs.
Multivariate analysis. Microbiome data, as well as the metabolomics data, were subjected to dataprocessing, normalization, scaling, and multivariate analyses using MetaboAnalyst 3.0 (43). Features withat least 50% missing values were removed by using a data integrity check. The remaining missing valueswere replaced with a small value (the half of the minimum positive values in the original data). Then, datawere filtered based on the interquantile range to remove baseline noises that are unlikely to be of usewhen modeling the data. Data were further normalized to total intensity followed by Pareto scaling toobtain normally distributed variables. PCA and PLS-DA were performed to identify distinct OTUs andmetabolite patterns. Discriminative OTUs and metabolites were selected based on the VIP scoregenerated from PLS-DA. Pearson’s correlation analysis was carried out using SPSS Statistics 20 (IBM, NewYork, NY), and significance levels were established at P � 0.05. The significance of the differencesbetween groups was determined by a two-tailed Student t test using GraphPad Prism software. AMann-Whitney nonparametric test was used for metabolite data graphed as box-and-whisker plots withmedians, quartiles, and ranges.
Accession number(s). Raw sequencing data are available in the NCBI SRA BioProject database underaccession no. SRP132248.
SUPPLEMENTAL MATERIAL
Supplemental material for this article may be found at https://doi.org/10.1128/AEM.00434-18.
SUPPLEMENTAL FILE 1, PDF file, 1.5 MB.
ACKNOWLEDGMENTSThis study was financially supported by the National Natural Science Foundation
(reference no. 81473281), the University of Macau (MYRG2015-00220-ICMS-QRCM andMYRG162-ICMS11-YR), and the Science and Technology Development fund of MacaoSAR (043/2011/A2).
R.Y., Z.-X.Y., and X.-J.G. conceived and designed the study. Z.-X.Y., X.-J.G., T.L., B.W.,P.-P.W., and Y.Y. conducted the animal study and collected samples. Z.-X.Y. and X.-J.G.performed data analysis. Z.-X.Y. and R.Y. wrote and edited the manuscript. All authorsread and approved the final version of the manuscript.
REFERENCES1. Weingarden AR, Chen C, Bobr A, Yao D, Lu Y, Nelson VM, Sadowsky MJ,
Khoruts A. 2014. Microbiota transplantation restores normal fecal bileacid composition in recurrent Clostridium difficile infection. Am J PhysiolGastrointest Liver Physiol 306:G310 –G319. https://doi.org/10.1152/ajpgi.00282.2013.
2. Kelly CR, de Leon L, Jasutkar N. 2012. Fecal microbiota transplantationfor relapsing Clostridium difficile infection in 26 patients: methodologyand results. J Clin Gastroenterol 46:145–149. https://doi.org/10.1097/MCG.0b013e318234570b.
3. Brandt LJ, Aroniadis OC, Mellow M, Kanatzar A, Kelly C, Park T, StollmanN, Rohlke F, Surawicz C. 2012. Long-term follow-up of colonoscopic fecalmicrobiota transplant for recurrent Clostridium difficile infection. Am JGastroenterol 107:1079 –1087. https://doi.org/10.1038/ajg.2012.60.
4. de Groot PF, Frissen MN, de Clercq NC, Nieuwdorp M. 2017. Fecalmicrobiota transplantation in metabolic syndrome: history, present andfuture. Gut Microbes 8:253–267. https://doi.org/10.1080/19490976.2017.1293224.
5. Michail S, Durbin M, Turner D, Griffiths AM, Mack DR, Hyams J, Leleiko N,Kenche H, Stolfi A, Wine E. 2012. Alterations in the gut microbiome ofchildren with severe ulcerative colitis. Inflamm Bowel Dis 18:1799 –1808.https://doi.org/10.1002/ibd.22860.
6. Lepage P, Häsler R, Spehlmann ME, Rehman A, Zvirbliene A, Begun A, OttS, Kupcinskas L, Doré J, Raedler A, Schreiber S. 2011. Twin study indicatesloss of interaction between microbiota and mucosa of patients withulcerative colitis. Gastroenterology 141:227–236. https://doi.org/10.1053/j.gastro.2011.04.011.
7. Moayyedi P, Surette MG, Kim PT, Libertucci J, Wolfe M, Onischi C,Armstrong D, Marshall JK, Kassam Z, Reinisch W, Lee CH. 2015. Fecalmicrobiota transplantation induces remission in patients with activeulcerative colitis in a randomized controlled trial. Gastroenterology 149:102–109. https://doi.org/10.1053/j.gastro.2015.04.001.
8. Rossen NG, Fuentes S, van der Spek MJ, Tijssen JG, Hartman JH, Duflou
A, Löwenberg M, van den Brink GR, Mathus-Vliegen EM, de Vos WM,Zoetendal EG, D’Haens GR, Ponsioen CY. 2015. Findings from a random-ized controlled trial of fecal transplantation for patients with ulcerativecolitis. Gastroenterology 149:110 –118. https://doi.org/10.1053/j.gastro.2015.03.045.
9. Costello SP, Soo W, Bryant RV, Jairath V, Hart AL, Andrews JM. 2017.Systematic review with meta-analysis: faecal microbiota transplantationfor the induction of remission for active ulcerative colitis. Aliment Phar-macol Ther 46:213–224. https://doi.org/10.1111/apt.14173.
10. Martin FP, Sprenger N, Yap IK, Wang Y, Bibiloni R, Rochat F, Rezzi S,Cherbut C, Kochhar S, Lindon JC, Holmes E, Nicholson JK. 2009. Panor-ganismal gut microbiome-host metabolic crosstalk. J Proteome Res8:2090 –2105. https://doi.org/10.1021/pr801068x.
11. Li M, Wang B, Zhang M, Rantalainen M, Wang S, Zhou H, Zhang Y, ShenJ, Pang X, Zhang M, Wei H, Chen Y, Lu H, Zuo J, Su M, Qiu Y, Jia W, XiaoC, Smith LM, Yang S, Holmes E, Tang H, Zhao G, Nicholson JK, Li L, ZhaoL. 2008. Symbiotic gut microbes modulate human metabolic pheno-types. Proc Natl Acad Sci U S A 105:2117–2122. https://doi.org/10.1073/pnas.0712038105.
12. Klein MS, Newell C, Bomhof MR, Reimer RA, Hittel DS, Rho JM, Vogel HJ,Shearer J. 2016. Metabolomic modeling to monitor host responsivenessto gut microbiota manipulation in the BTBR(T�tf/j) mouse. J ProteomeRes 15:1143–1150. https://doi.org/10.1021/acs.jproteome.5b01025.
13. Wikoff WR, Anfora AT, Liu J, Schultz PG, Lesley SA, Peters EC, Siuzdak G.2009. Metabolomics analysis reveals large effects of gut microflora onmammalian blood metabolites. Proc Natl Acad Sci U S A 106:3698 –3703.https://doi.org/10.1073/pnas.0812874106.
14. Yan Z, Yan R. 2016. Tailored sensitivity reduction improves patternrecognition and information recovery with a higher tolerance to variedsample concentration for targeted urinary metabolomics. J ChromatogrA 1443:101–110. https://doi.org/10.1016/j.chroma.2016.03.023.
15. O’Sullivan S, Wang J, Pigott MT, Docherty N, Boyle N, Lis SK, Gilmer JF,
Yan et al. Applied and Environmental Microbiology
July 2018 Volume 84 Issue 14 e00434-18 aem.asm.org 10
on June 1, 2020 by guesthttp://aem
.asm.org/
Dow
nloaded from

Medina C. 2017. Inhibition of matrix metalloproteinase-9 by abarbiturate-nitrate hybrid ameliorates dextran sulphate sodium-inducedcolitis: effect on inflammation-related genes. Br J Pharmacol 174:512–524. https://doi.org/10.1111/bph.13712.
16. Netzel-Arnett S, Buzza MS, Shea-Donohue T, Désilets A, Leduc R, FasanoA, Bugge TH, Antalis TM. 2012. Matriptase protects against experimentalcolitis and promotes intestinal barrier recovery. Inflamm Bowel Dis18:1303–1314. https://doi.org/10.1002/ibd.21930.
17. Hu N, Huang Y, Gao X, Li S, Yan Z, Wei B, Yan R. 2017. Effects of dextransulfate sodium induced experimental colitis on cytochrome P450 activ-ities in rat liver, kidney and intestine. Chem Biol Interact 271:48 –58.https://doi.org/10.1016/j.cbi.2017.04.018.
18. Gao XJ, Li T, Wei B, Yan ZX, Hu N, Huang YJ, Han BL, Wai TS, Yang W, YanR. 2018. Bacterial outer membrane vesicles from dextran sulfate sodium-induced colitis differentially regulate intestinal UDP-glucuronosyltransferase1A1 partially through Toll-like receptor 4/mitogen-activated protein kinase/phosphatidylinositol 3-kinase pathway. Drug Metab Dispos 46:292–302.https://doi.org/10.1124/dmd.117.079046.
19. Lees HJ, Swann JR, Wilson ID, Nicholson JK, Holmes E. 2013. Hippurate:the natural history of a mammalian-microbial cometabolite. J ProteomeRes 12:1527–1546. https://doi.org/10.1021/pr300900b.
20. Dong F, Zhang L, Hao F, Tang H, Wang Y. 2013. Systemic responses ofmice to dextran sulfate sodium-induced acute ulcerative colitis using 1HNMR spectroscopy. J Proteome Res 12:2958 –2966. https://doi.org/10.1021/pr4002383.
21. Williams HR, Cox IJ, Walker DG, Cobbold JF, Taylor-Robinson SD, MarshallSE, Orchard TR. 2010. Differences in gut microbial metabolism areresponsible for reduced hippurate synthesis in Crohn’s disease. BMCGastroenterol 10:108. https://doi.org/10.1186/1471-230X-10-108.
22. Costa CG, Guérand WS, Struys EA, Holwerda U, ten Brink HJ, Tavares deAlmeida I, Duran M, Jakobs C. 2000. Quantitative analysis of urinaryacylglycines for the diagnosis of beta-oxidation defects using GC-NCI-MS. J Pharm Biomed Anal 21:1215–1224. https://doi.org/10.1016/S0731-7085(99)00235-6.
23. Sahai I, Marsden D. 2009. Newborn screening. Crit Rev Clin Lab Sci46:55– 82. https://doi.org/10.1080/10408360802485305.
24. Sim KG, Hammond J, Wilcken B. 2002. Strategies for the diagnosis ofmitochondrial fatty acid oxidation disorders. Clin Chim Acta 323:37–58.https://doi.org/10.1016/S0009-8981(02)00182-1.
25. Schicho R, Nazyrova A, Shaykhutdinov R, Duggan G, Vogel HJ, Storr M.2010. Quantitative metabolomic profiling of serum and urine in DSS-induced ulcerative colitis of mice by 1H NMR spectroscopy. J ProteomeRes 9:6265– 6273. https://doi.org/10.1021/pr100547y.
26. Libert R, Van Hoof F, Laus G, De Nayer P, Habib Jiwan JL, de HoffmannE, Schanck A. 2005. Identification of ethylsuccinylcarnitine present insome human urines. Clin Chim Acta 355:145–151. https://doi.org/10.1016/j.cccn.2004.12.020.
27. Libert R, Van Hoof F, Thillaye M, Vincent MF, Nassogne MC, Stroobant V,de Hoffmann E, Schanck A. 1997. Identification of new medium-chainacylcarnitines present in normal human urine. Anal Biochem 251:196 –205. https://doi.org/10.1006/abio.1997.2274.
28. Yang S, Minkler P, Hoppel C. 2007. cis-3,4-Methylene-heptanoylcarnitine:characterization and verification of the C8:1 acylcarnitine in human urine.J Chromatogr B Analyt Technol Biomed Life Sci 857:251–258. https://doi.org/10.1016/j.jchromb.2007.07.027.
29. Araki Y, Andoh A, Fujiyama Y, Hata K, Makino J, Okuno T, Nakanura F,Bamba T. 2001. Application of 2-aminopyridine fluorescence labeling inthe analysis of in vivo and in vitro metabolism of dextran sulfate sodiumby size-exclusion high-performance liquid chromatography. J Chro-
matogr B Biomed Sci Appl 753:209 –215. https://doi.org/10.1016/S0378-4347(00)00541-7.
30. Sartor RB. 2003. Targeting enteric bacteria in treatment of inflammatorybowel diseases: why, how, and when. Curr Opin Gastroenterol 19:358 –365. https://doi.org/10.1097/00001574-200307000-00006.
31. Natividad JM, Pinto-Sanchez MI, Galipeau HJ, Jury J, Jordana M, ReinischW, Collins SM, Bercik P, Surette MG, Allen-Vercoe E, Verdu EF. 2015.Ecobiotherapy rich in firmicutes decreases susceptibility to colitis in ahumanized gnotobiotic mouse model. Inflamm Bowel Dis 21:1883–1893.https://doi.org/10.1097/MIB.0000000000000422.
32. Nicholson JK, Holmes E, Kinross J, Burcelin R, Gibson G, Jia W, PetterssonS. 2012. Host-gut microbiota metabolic interactions. Science 336:1262–1267. https://doi.org/10.1126/science.1223813.
33. Siegerstettera SC, Petria RM, Magowan E, Lawlor PG, Zebeli Q, O’ConnellNE, Metzler-Zebeli BU. 2017. Fecal microbiota transplant from highlyfeed efficient donors shows little effects on age-related changes in feedefficiency-associated fecal microbiota in chickens. Appl Environ Micro-biol https://doi.org/10.1128/AEM.02330-17.
34. Huang Y, Hu N, Gao X, Yan Z, Li S, Jing W, Yan R. 2015. Alterations oftestosterone metabolism in microsomes from rats with experimentalcolitis induced by dextran sulfate sodium. Chem Biol Interact 232:38 – 48.https://doi.org/10.1016/j.cbi.2015.02.013.
35. Wei G, Lai Y, Wang G, Chen H, Li F, Wang S. 2017. Insect pathogenicfungus interacts with the gut microbiota to accelerate mosquito mor-tality. Proc Natl Acad Sci U S A 114:5994 –5999. https://doi.org/10.1073/pnas.1703546114.
36. Ewing B, Hillier L, Wendl MC, Green P. 1998. Base-calling of automatedsequencer traces using Phred. I. Accuracy assessment. Genome Res8:175–185. https://doi.org/10.1101/gr.8.3.175.
37. Magoc T, Salzberg SL. 2011. FLASH: fast length adjustment of short readsto improve genome assemblies. Bioinformatics 27:2957–2963. https://doi.org/10.1093/bioinformatics/btr507.
38. Edgar RC, Haas BJ, Clemente JC, Quince C, Knight R. 2011. UCHIMEimproves sensitivity and speed of chimera detection. Bioinformatics27:2194 –2200. https://doi.org/10.1093/bioinformatics/btr381.
39. Schloss PD, Westcott SL, Ryabin T, Hall JR, Hartmann M, Hollister EB,Lesniewski RA, Oakley BB, Parks DH, Robinson CJ, Sahl JW, Stres B,Thallinger GG, Van Horn DJ, Weber CF. 2009. Introducing mothur: open-source, platform-independent, community-supported software for de-scribing and comparing microbial communities. Appl Environ Microbiol75:7537–7541. https://doi.org/10.1128/AEM.01541-09.
40. Edgar RC. 2010. Search and clustering orders of magnitude faster thanBLAST. Bioinformatics 26:2460–2461. https://doi.org/10.1093/bioinformatics/btq461.
41. DeSantis TZ, Hugenholtz P, Larsen N, Rojas M, Brodie EL, Keller K, HuberT, Dalevi D, Hu P, Andersen GL. 2006. Greengenes, a chimera-checked16S rRNA gene database and workbench compatible with ARB. ApplEnviron Microbiol 72:5069 –5072. https://doi.org/10.1128/AEM.03006-05.
42. Caporaso JG, Kuczynski J, Stombaugh J, Bittinger K, Bushman FD,Costello EK, Fierer N, Peña AG, Goodrich JK, Gordon JI, Huttley GA, KelleyST, Knights D, Koenig JE, Ley RE, Lozupone CA, McDonald D, Muegge BD,Pirrung M, Reeder J, Sevinsky JR, Turnbaugh PJ, Walters WA, Widmann J,Yatsunenko T, Zaneveld J, Knight R. 2010. QIIME allows analysis ofhigh-throughput community sequencing data. Nat Methods 7:335–336.https://doi.org/10.1038/nmeth.f.303.
43. Xia J, Wishart DS. 2011. Web-based inference of biological patterns:functions and pathways from metabolomic data using MetaboAnalyst.Nat Protoc 6:743–760. https://doi.org/10.1038/nprot.2011.319.
Fecal Microbiota Transplantation in UC Applied and Environmental Microbiology
July 2018 Volume 84 Issue 14 e00434-18 aem.asm.org 11
on June 1, 2020 by guesthttp://aem
.asm.org/
Dow
nloaded from