fed’s new inflation targeting policy seeks to maintain
TRANSCRIPT

Fed’s New Inflation Targeting Policy Seeks to Maintain Well-Anchored
Expectations
Research DepartmentJune 24, 2021
Enrique Martínez García
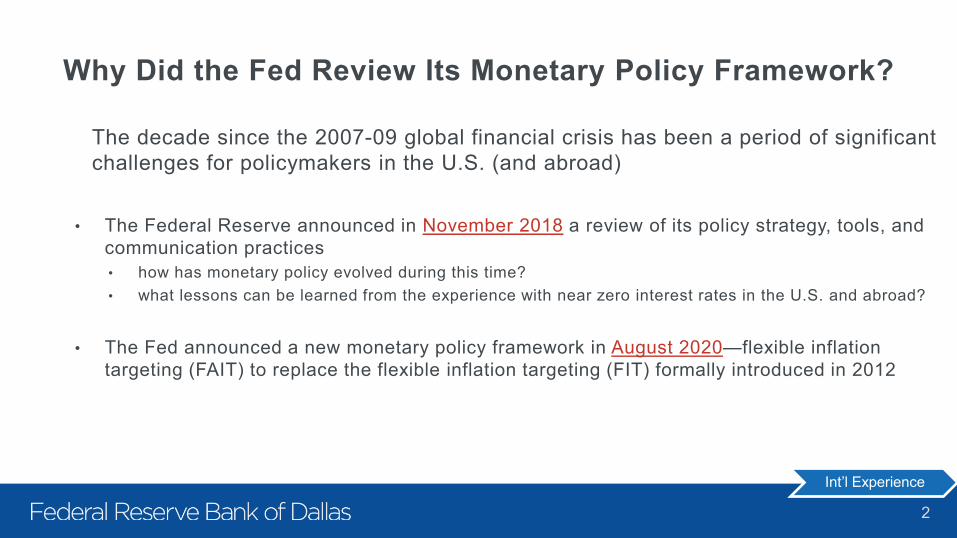
The decade since the 2007-09 global financial crisis has been a period of significant challenges for policymakers in the U.S. (and abroad)
• The Federal Reserve announced in November 2018 a review of its policy strategy, tools, and communication practices• how has monetary policy evolved during this time?• what lessons can be learned from the experience with near zero interest rates in the U.S. and abroad?
• The Fed announced a new monetary policy framework in August 2020—flexible inflation targeting (FAIT) to replace the flexible inflation targeting (FIT) formally introduced in 2012
Why Did the Fed Review Its Monetary Policy Framework?
2
Int’l Experience

Monetary Policy in a Changing Economy
3

1. Monetary policy evolved to provide further accommodation after the fed funds rate became constrained near zeroa. provision of ample reserves to the banking system b. policy tools other than the Feds Fund rate: balance sheet policies, forward guidancec. communication practices: explicit 2 percent inflation target, summary of economic
projections (SEP), and Consensus Statement, etc.
2. Somewhat mixed macroeconomic performance from the crisis onwarda. easing financial conditions; other transmission channels: managing expectations (signaling
about future policy rate to reduce policy uncertainty), improved sentiment, etc.b. efficacy hinges on the credibility of the commitment; size, duration and scalability of policy
actions are uncertain, can have implications for financial stabilityc. outcomes partly affected by a changing economy, may also reflect limitations of the
monetary policy framework in place (FIT)
Monetary Policy Tools: Learning by Doing
4
Summary Estimates

Monetary Policy in Real Time
• Structural transformations difficult to ascertain in real time
• Altering the trade-off between inflation and economic activity• diminished sensitivity of inflation to domestic resource slack
• Decline in the longer-run real rate of interest → lower nominal rates, less monetary policy space• attributed to structural forces—slowdown in productivity growth, demographics,
globalization, etc.—largely out of the purview of monetary policy• tied also to lower rate of growth in potential output, shifts in the labor market (decline in the
longer-run rate of unemployment prior to the Covid19 recession)
• Similar structural shifts observed abroad
5
Longer-Run UR

Diminished Sensitivity of Inflation to Domestic Slack(Reduced-Form Phillips Curve Estimates)
6
NOTE: Shaded areas indicate the 70 percent confidence interval. The figure reports the 15-year rolling widow estimate of the persistence parameter α and the slope parameter κ in the regression πt = απt-1 + (1-α)π0
t-1 + κ(ut - u*t) + εt. The variable π0t represents the long-term inflation expectations. Consistent with the standard assumption in FRB/US, it is
assumed that π0t = π0
t-1 + γ(πt-1 - π0t-1) with γ = 0.05.
SOURCE: Author's calculations.
Slope of the Phillips curve currently at -0.1

0
1
2
3
'06 '07 '08 '09 '10 '11 '12 '13 '14 '15 '16 '17 '18 '19
R-star Estimate
Survey of Professional Forecasters: Real 10-Year-Ahead Average of 3-Month Yield
FOMC Summary of Economic Projections:Longer-Run Estimate of Fed Funds Rate
Percent
Downward Shift in the Longer-Run Real Rate of Interest
7
Sources: Holston, Laubach, and Williams (2017) (https://doi.org/10.1016/j.jinteco.2017.01.004), Federal Reserve Bank of St. Louis FRED Database, Federal Reserve Bank of Philadelphia Survey of Professional Forecasters, Haver Analytics, author’s calculations.Notes: The model-based estimate of Holston, Laubach, and Williams (2017) offers is for the natural rate of interest.
Low Long Yields

Sources: Federal Reserve Bank of St. Louis FRED Database, Federal Reserve Bank of Philadelphia Survey of Professional Forecasters, Haver Analytics, author’s calculations.
Inflation and Unemployment Rate Forecasting Surprises
8
-2
-1
0
1
2
3
4
5
'06 '07 '08 '09 '10 '11 '12 '13 '14 '15 '16 '17 '18 '19 '20
Inflation RatePCE Deflator
Headline PCE InflationFOMC 2 Percent TargetSurvey of Professional ForecastersFOMC Summary of Economic Projections
Q4/Q4 % change
3
4
5
6
7
8
9
10
'06 '07 '08 '09 '10 '11 '12 '13 '14 '15 '16 '17 '18 '19 '20
Unemployment Rate
Unemployment RateSurvey of Professional ForecastersSEP
Percent
Forecast Surprises
Was the inflation target being interpreted more like a ceiling on inflation?

Inflation Expectations: A Limitation of FIT?
• Anchored longer-run inflation expectations during the crisis facilitated the pursuit of the dual mandate
• Concern about de-anchoring inflation expectations
• Low inflation realizations can erode the public’s longer-run inflation expectations, reducing incentives to raise prices and wages, thus creating a vicious circle
• Credibility of the policy commitment is crucial
• Bank of Japan’s decades-long struggle to meet its inflation objective illustrates the difficulty of raising inflation once longer-run inflation expectations become entrenched at too low a level
9

A FAIT Accompli—How Has the Fed’s Monetary Policy Framework Changed?
10

Key changes incorporated into the FOMC’s revised Statement on Longer-Run Goals and Monetary Policy Strategy — updating the terms of the dual mandate (inflation)
What Has Changed As a Result of the Framework Review?
11

Key changes incorporated into the FOMC’s revised Statement on Longer-Run Goals and Monetary Policy Strategy — updating the terms of the dual mandate (employment)
What Has Changed As a Result of the Framework Review?
12

How Is FAIT Different than FIT in Practice?
Let bygones-be-bygones (FIT) vs. allowing make-up strategies (FAIT)
13
ln(Pt)
t
Price level path after deflationary shock under FIT
Price level path according to the inflation target
Пt
t
Inflation according to the inflation target
Inflation after deflationary shock under FIT (averages less than the inflation target)
Price level path after deflationary shock under FAIT Inflation after
deflationary shock under FAIT (averages to the inflation target)

What Does FAIT Have to Do with the Zero Lower Bound on Interest Rates?
14

Why Does The Zero Lower Bound Matter?
• Fed funds cannot be lowered further in response to adverse demand shock: • costly and difficult to escape (liquidity trap): Japan
15
-3
-2
-1
0
1
2
3
4
'86 '88 '90 '92 '94 '96 '98 '00 '02 '04 '06 '08 '10 '12 '14 '16 '18 '20
U.S. real interest rate
Percent, annualized
NOTES: The shaded bars indicate National Bureau of Economic Research (NBER) recessions. The U.S. real rate is the federal funds rate minus the one-quarter-ahead inflation expectations from Blue Chip Economic Indicators.SOURCES: Blue Chip Economic Indicators; Board of Governors of the Federal Reserve System/FRED; NBER; authors' calculations.
zero lower bound puts a lower bound on the real interest rate (r) of –πe
Fisher equation: r = i – πe
r = real interest ratei = nominal interest rateπe = inflation expectations

Theory Musings: IS-LM and the Zero Lower Bound
16
Saving curves (S)
Investment curve (I)
r
Desired savings, investment
r r
Output, Y Real money supply, demand
Real money supply (MS)
Real money demand (MD)
IS
LM
-πe
• IS curve (equilibrium in the goods market)• LM curve (asset market equilibrium)—zero lower bound puts a lower bound
on the real interest rate (r) of –πe, introduces a kink into the LM curve
IS shock IS shock

Why is the Federal Reserve Concerned About the Zero Lower Bound?
• The aggregate demand (AD) curve becomes vertical
• monetary policy is rendered “ineffective”
• as long the zero lower bound is still binding, if the money supply changes are not large enough & inflation expectations are exogenous and unchanged
• higher inflation expectations (πe) can ease the constraint
17
r
Y
IS
LM(M0)
-πe
LM(M1)LM(M2)
P
Y
AD
P1P0P2
M1>M0>M2

Aggregate Demand Shocks Are Amplified when the Zero Lower Bound is Binding
• Negative IS shocks have larger effects on economic activity
• because the real rate (r) cannot react to partially offset the effects of an IS shock on aggregate demand (AD)…
• ….assuming inflation expectations are exogenous and unchanged & aggregate supply (AS) is perfectly elastic
18
r
Y
IS
-πe
LM
P
Y
AD
P AS
r<-πe

The Risk of a Liquidity Trap
• If a negative demand shock when the zero lower bound is binding causes agents to begin to expect prices to fall, lower inflation expectations increase the real interest rate lower bound
• this makes it harder to escape the constraint
• further reduces aggregate demand aggravating the downturn
• if it builds on itself, it could result in a deflationary spiral
19
r
Y
IS
-π0e
LM
P
Y
AD
P0
AS
P1
-π1e
P2

A World of Low Inflation and Low Interest Rates
20
NOTES: Data for the euro area begin in January 1997; all others begin in January 1986. Each dot represents a month. CPI refers to the consumer price index. SOURCE: Organization for Economic Cooperation and Development.

FAIT and the Great Escape
• Credibility is critical to escape the zero lower bound• FAIT formalizes the commitment to keep inflation expectations anchored• …allows make-up strategies to prevent persistent negative demand shocks and
low inflation from becoming entrenched in expectations
• The Federal Reserve aims to keep inflation expectations well-anchored • to avoid the risks of a liquidity trap resulting from expected inflation becoming
entrenched below target• to support broad-based, full employment while keeping prices stable—inflation
expectations being key when prices are costly to adjust
• Promise “low-for-long” policies after zero lower bound (“forward guidance”)• Buy corporate debt, longer maturity gov’t debt (“credit & quantitative easing”)
21

Concluding Remarks
22

Three Takeaways for Monetary Policy
• Low interest rates in the U.S. (and abroad) leave less space to stimulate the economy through cuts in the policy rate
• Limited monetary and fiscal policy space in the U.S. (and abroad) can exacerbate the consequences of adverse shocks, constraining domestic policy
• Balance sheet policies, forward guidance → monetary accommodation
can help provide monetary accommodation when policy rates are constrained near zero—but are no panacea
FAIT allows for make-up strategies, more room to sustain well-anchored inflation expectation
23
Fiscal Space

FAIT’s Game Plan… (And 3 Other Ways to Play in a 4-5-1)

Some Useful References
• On the monetary policy framework review and FAIT:• https://www.dallasfed.org/research/economics/2021/0406• https://www.dallasfed.org/~/media/documents/institute/wpapers/2020/0399.pdf• https://www.federalreserve.gov/newsevents/speech/powell20200827a.htm• https://www.federalreserve.gov/newsevents/speech/clarida20200831a.htm• https://www.federalreserve.gov/monetarypolicy/guide-to-changes-in-statement-on-longer-run-goals-
monetary-policy-strategy.htm
• On the IS-LM model and the zero lower bound:• https://www.dallasfed.org/~/media/documents/research/er/1993/er9304a.pdf• https://www.dallasfed.org/~/media/documents/research/er/1993/er9304b.pdf• https://www.dallasfed.org/~/media/documents/research/staff/staff1102.pdf
• On the monetary policy toolkit and its implementation:• https://www.bis.org/publ/cgfs63.htm• https://www.stlouisfed.org/open-vault/2020/august/how-does-fed-influence-interest-rates-using-new-
tools
25

Supplementary Materials

Sources: Haver Analytics, author’s calculations.
When Cutting Policy Rates Is Not Enough
27
Central Bank Policy Rates
0
20
40
60
80
100
120
1999 2001 2003 2005 2007 2009 2011 2013 2015 2017 2019
Fed
BoE
BoJ
ECB
Percent
Central Bank Assets-over-GDP
Back
-1
0
1
2
3
4
5
6
7
1999 2001 2003 2005 2007 2009 2011 2013 2015 2017 2019
FedBOEBOJECB
Percent

0
2
4
6
'06 '07 '08 '09 '10 '11 '12 '13 '14 '15 '16 '17 '18 '19
10-Year Yield3-Month Yield
Percent
Key Monetary Policy Developments in the U.S.
28
Sources: Board of Governors of the Federal Reserve, Haver Analytics, author’s calculations.Notes: FG = Forward Guidance; SEP = FOMC Summary of Economic Projections, LSAP = large-scale asset purchases, and MEP = maturity extension program.
First SEP Release
First Consensus Statement2 Percent Target
LSAP1FG1
LSAP2
MEPFG2
LSAP3FG3
Release Normalization Plans
Symmetry of inflation objective
FOMC Timeline
Framework review announced

Sources: Board of Governors of the Federal Reserve System as reported in Eberly et al. (2019) (https://doi.org/10.3386/w26002).
FOMC Timeline – Balance Sheet Policies
29
Back

Sources: Board of Governors of the Federal Reserve System as reported in Eberly et al. (2019) (https://doi.org/10.3386/w26002).
FOMC Timeline – Forward Guidance
30
Back

Sources: Board of Governors of the Federal Reserve System as reported in Eberly et al. (2019) (https://doi.org/10.3386/w26002).
FOMC Timeline – Summary of Economic Projections and Consensus Statement
31
Back

Macroeconomic Performance Somewhat Mixed on Unemployment and Inflation
• Unemployment:• the unemployment rate fell from 10 percent to its lowest level since 1970, prior to
Covid-19• the labor market recovered at a somewhat slower pace than in the historical
experience, during the early part of the recovery after the 2007-09 recession
• Inflation:• headline PCE inflation rate has averaged only 1.4 percent—the trimmed-mean
PCE, 1.8 percent—since the FOMC announced an explicit inflation target of 2 percent (January 2012)
• The macro performance during the recovery surprised analysts and policymakers, partly reflecting a changing economy
32
Back

-2
0
2
4
6
'06 '07 '08 '09 '10 '11 '12 '13 '14 '15 '16 '17 '18 '19
Survey of Professional Forecasters:Longer-Run EstimatesFOMC Summary of Economic Projections:Longer-Run Estimates
12-month % change
Longer-Run Inflation Rate Expectations Held Steady
33
Sources: Federal Reserve Bank of St. Louis FRED Database, Federal Reserve Bank of Philadelphia Survey of Professional Forecasters, Haver Analytics, author’s calculations.
FOMC introduces explicit price stability target of 2 percent
Other Expectations

Sources: For Michigan, University of Michigan’s Survey of Consumers; for Survey of Professional Forecasters (SPF), Federal Reserve Bank of Philadelphia; for Treasury Inflation-Protected Securities (TIPS), Federal Reserve Board staff calculations.NOTES: TIPS compensation values are based on comparisons of an estimated TIPS yield curve with an estimated nominal off-the-run Treasury yield curve, with an adjustment for the indexation lag effect.
Long-Term Inflation Expectations and Compensation
34
Back

3
4
5
6
7
8
9
10
'06 '07 '08 '09 '10 '11 '12 '13 '14 '15 '16 '17 '18 '19
Unemployment Rate
Survey of Professional Forecasters:Longer-Run Estimates
FOMC Summary of EconomicProjections: Longer-Run Estimates
Percent
Sources: Federal Reserve Bank of St. Louis FRED Database, Federal Reserve Bank of Philadelphia Survey of Professional Forecasters, Haver Analytics, author’s calculations.
Declining Estimates of the Longer-Run Unemployment Rate Since 2013
35
Back

-2
-1
0
1
2
3
4
5
6
7
8
1999 2001 2003 2005 2007 2009 2011 2013 2015 2017 2019
USUKJapanGermanyItalyFranceSpain
Percent
Sources: Haver Analytics, author’s calculations.
10-Year Government Yields
36
Euro area sovereign debt crisis begins
Back

Sources: Andrade et al. (2016) (https://shorturl.at/ghwzH).Notes: U.S.: LSAP refers to Large Scale Asset Purchases, MEP is the Maturity Extension Program; U.K.: APF refers to the Asset Purchase Facility; Euro Area: APP is the Asset Purchase Programme; Japan: CME+ denotes Comprehensive Monetary Easing (+ denotes an extended period) and QQE is Quantitative and Qualitative Easing.
Median and Range of the Estimated Impact on 10-Year Yields Standardized to Asset Purchases of 10 Percent of GDP
37
Back
U.S. U.K. Euro Area
Japan
All Episodes LSAP1 LSAP2 MEP APF1 APP CME+ QQE
12/08-03/10
11/10-12/12
09/11-12/12
03/09-01/10
03/15-09/16
12/08-08/11
04/13-09/14
Size(Percent of GDP) 12% 4% 3% 14% 11% 21% 23%
Median 53 76 45 60 67 43 11 20
Range 10-175 32-175 22-138 23-175 34-107 27-64 10-12 14-26

Central Government Debt-over-GDP
38
Sources: OECD; Haver Analytics.
Back
0
50
100
150
200
250
0
20
40
60
80
100
120
140
1999 2002 2005 2008 2011 2014 2017
US UKGermany FranceItaly SpainJapan
Percent of GDP

Country Background Materials

Performance of the U.S. Economy
40
U.S. Inflation U.S. Real GDP Growth and Unemployment Rate
0
2
4
6
8
10
12
-6
-4
-2
0
2
4
6
8
'99 '01 '03 '05 '07 '09 '11 '13 '15 '17 '19
Real GDP growth
Unemployment rate
Percent
-4
-2
0
2
4
6
8
'99 '01 '03 '05 '07 '09 '11 '13 '15 '17 '19
Headline CPI
Core CPI
12-month percent change
Sources: Haver Analytics; Database of Global Economic Indicators; ECRI.

Performance of the U.K. Economy
41
U.K. Inflation U.K. Real GDP Growth and Unemployment Rate
0
2
4
6
8
10
-7
-5
-3
-1
1
3
5
7
'99 '01 '03 '05 '07 '09 '11 '13 '15 '17 '19
Real GDP growth
Unemployment rate
Percent
-1
0
1
2
3
4
5
6
'99 '01 '03 '05 '07 '09 '11 '13 '15 '17 '19
Headline CPI
Core CPI
12-month percent change
Sources: Haver Analytics; Database of Global Economic Indicators; ECRI.

-1
0
1
2
3
4
5
'99 '01 '03 '05 '07 '09 '11 '13 '15 '17 '19
Headline CPI
Core CPI
12-month percent change
Performance of the Euro Area Economy
42
Euro Area Inflation Euro Area Real GDP Growth and Unemployment Rate
0
2
4
6
8
10
12
14
-6
-4
-2
0
2
4
6
'99 '01 '03 '05 '07 '09 '11 '13 '15 '17 '19
Real GDP growth
Unemployment rate
Percent
Sources: Haver Analytics; Database of Global Economic Indicators; ECRI.

Performance of the Japanese Economy
43
Japan Inflation Japan Real GDP Growth and Unemployment Rate
0
1
2
3
4
5
6
-10
-8
-6
-4
-2
0
2
4
6
8
10
'99 '01 '03 '05 '07 '09 '11 '13 '15 '17 '19
Real GDP growth
Unemployment rate
Percent
-3
-2
-1
0
1
2
3
4
5
'99 '01 '03 '05 '07 '09 '11 '13 '15 '17 '19
Headline CPICore CPICore CPI ex. taxes
12-month percent change
Sources: Haver Analytics; Database of Global Economic Indicators; ECRI.

44

45
• The Fed - Why does the Federal Reserve aim for inflation of 2 percent over the longer run?
• Teaching the New Tools of Monetary Policy.
• Teacher Lecture Guide and PowerPoint Slides.