final drainage report sbc - microsoft · final drainage report monument hill business center ......
TRANSCRIPT

1
FINAL DRAINAGE REPORT
MONUMENT HILL BUSINESS CENTERLOT 3, GREATER EUROPE MISSION SUBDIVISION FILING NO. 1
1945 Deer Creek RoadEl Paso County, Colorado
PREPARED FOR OWNER/DEVELOPER:
SIEVERS BUSINESS CENTER, LLC16152 Old Forest Point, Unit 2-202
Monument, CO 80132Phone:
Contact: Stan SieversEmail: [email protected]
PREPARED BY:
KELLY DEVELOPMENT SERVICES, LLC9301 Scrub Oak Drive
Lone Tree, Colorado 80124Phone: 303-888-6338
Contact: Greg Kelly, PEEmail: [email protected]
September 20, 2017
PCD Project No. PPR-17-007


3
Table of ContentsI. GENERAL LOCATION AND DESCRIPTION...............................................................................................4
II. DRAINAGE BASINS AND SUB-BASINS ........................................................................................................4
III. DRAINAGE DESIGN CRITERIA ...............................................................................................................4
IV. STORMWATER MANAGEMENT FACILITY DESIGN.........................................................................5
V. CONCLUSIONS ..................................................................................................................................................8
VI. REFERENCES .....................................................................................................................................................9
VII. APPENDICES .....................................................................................................................................................9
4
FINAL DRAINAGE REPORTMONUMENT HILL BUSINESS CENTER
I. GENERAL LOCATION AND DESCRIPTION
Project LocationThe Monument Hill Business Center project is located at the northeast corner of theintersection of Monument Hill Road and Deer Creek Road in El Paso County, Colorado. The siteaddress is 1945 Deer Creek Road. The site is located within the Southwest Quarter of Section 11,Township 11 South, Range 67 West of the 6th P. M., County of El Paso, State of Colorado. Theseproperty is platted as Lot 3, Greater Europe Missions Subdivision Filing No. 1.
The site is currently 3.27 acres bounded on the north by Deer Creek Road; on the east by an RVand Self-Storage facility on Lot18A, Woodmoor Business Technological Park 3; to the south by achurch on Lot 20A Woodmoor Business Technological Park Filing No. 1A; and to the west byMonument Hill Road. The site will be reduced to 2.99 acres once a 30’ wide right-of-way isacquired by El Paso County for improvements to Monument Hill Road and Deer Creek Road.
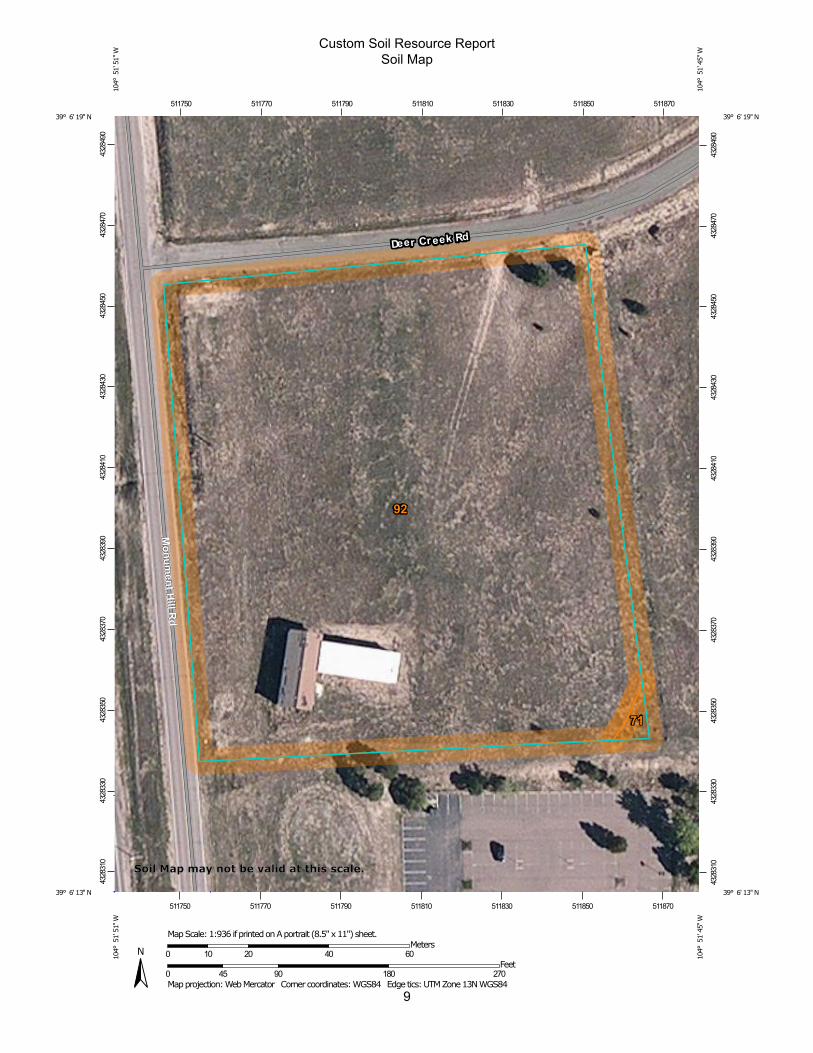
Property DescriptionThe site is currently vacant and is covered by native grasses and weeds. Historically, the groundsurface sloped to the southwest at approximately a 2.5 to 3 percent slope. The soil is classifiedas Tomah-Crowfoot loamy sands, which are considered as Hydrologic Soil Type B.
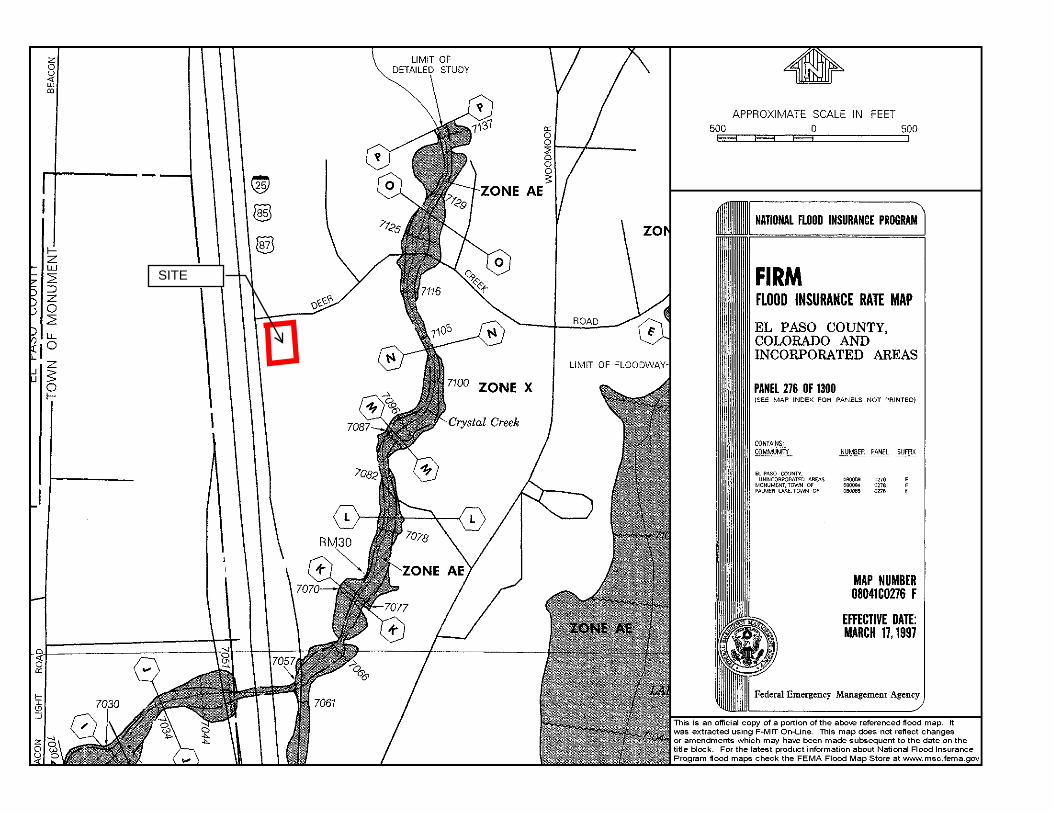
The site is not located within a floodplain as shown on the FEMA FIRM Map No. 08041CO276Fdated March 17, 1997. The site is located within unshaded Zone X. This zone is described as“Areas determined to be outside the 0.2% annual chance floodplain”.
The proposed development is a small office/warehouse facility consisting of two buildings of14,000 SF and 17,500 SF with access drives, parking spaces and landscaped areas.
II. DRAINAGE BASINS AND SUB-BASINS
The site is located within the Crystal Creek basin within Monument Creek watershed. There areno major drainageways crossing or adjacent to the site.
The site is included within the limits of the Dirty Woman Creek and Crystal Creek Drainage BasinPlanning Study prepared by Kiowa Engineering in September, 1993. There are no drainage wayfacilities proposed in the study that are located within the limits of the site.
III. DRAINAGE DESIGN CRITERIA
RegulationsThis drainage report is based upon the 1991 El Paso County Drainage Criteria Manual andadopted portions of the City of Colorado Springs Drainage Criteria Manual Volumes 1, dated

5
May 2014. The portions of the City of Colorado Springs Drainage Criteria Manual adopted bythe County are Chapter 6 (Hydrology) and Chapter 13 Section 3.2.1 (Full Spectrum Detention).
HydrologyThe Rational Method was used to calculate runoff from this site in accordance with theDrainage Criteria Manual Volumes 1 and 2. The 5-year storm event is used to design the initialdrainage system. The 100-year storm is used to design the major drainage system. All drainageimprovements are designed to for the major storm. The 1-Hour Design Point Rainfall Valuesfrom the City of Colorado Springs Drainage Criteria Manual Volume 1, used in this this reportare 1.50 inches for the 5-year storm and 2.52 inches for the 100-year event.
HydraulicsCalculation methods for private improvements are based upon the Manning’s Equation and theCity of Colorado Springs Drainage Criteria Manual Volumes 1 and 2, dated May 2014. On-sitestorm drainage improvements are designed for the 5-year and 100-year storm events.
IV. STORMWATER MANAGEMENT FACILITY DESIGN
Existing Stormwater DrainageCurrently, stormwater runoff flows from the northeast corner of the site towards thesouthwest corner. Approximately the eastern one-half of the site flows onto the property to thesouth. The proposed stormwater improvements will minimize the amount of runoff flowingonto the adjacent property. The northwest one-quarter of the site drains to the roadside swalenext to Monument Hill Road, where it combines with the runoff from the Deer Creek Roadswale and flows into a 24” RCP culvert under Monument Hill Road and Interstate 25 to thewest. The southwest one-quarter of the site drains to the roadside swale along Monument HillRoad and then to the south.
Historically, runoff from the property to the east flowed onto the site. A self-storage facility wasconstructed and the drainage improvements diverted runoff to the east. Only a very smallportion of the adjacent site (approximately the west 5’) flows onto the site. Because thisportion of the adjacent site is landscaped, these flows are very minor.
Stormwater Conveyance FacilitiesThe general concept for the site drainage will be for storm runoff to surface flow from thebuilding roofs and pavement to the southwest to a series of inlets located along the curb andgutter of parking area and access drives. Runoff will be captured by these inlets and piped to astormwater detention and water quality facility along the southerly property line of the site.This facility will be an Extended Detention Basin designed in accordance with City of ColoradoSprings criteria. Discharge from the EDB will be controlled by a standard outlet structure. Thedischarge will be piped to the roadside drainage channel along Monument Hill Road, where iswill flow under the road to the west. The on-site storm sewers and EDB will be private and willbe maintained by the property owner.
Specifically, the site grading creates 7 sub-basins on-site. Each sub-basin is described as follows:

6
Sub-basin A is made up of building roof and pavement that is a large portion of the westernone-half of the site. Runoff surface flows to the south and west to the parking area curb andgutter, then to a 10’ Type R inlet in the southwest corner of the parking lot at Design Point 1.The area is 1.39 acres with a percent impervious of 96%. The runoff is calculated at 5.9 cfs inthe 5-year storm and 10.8 cfs in the 100-year. The runoff is piped in an 18” RCP to thedetention water quality pond.
Sub-basin B is 0.95 acres of building roof, pavement and landscaping in the eastern one-half ofthe site. Percent impervious is 81%. Runoff surface flow from the building roof and pavementsouth and west to a 10’ Type R inlet at Design Point 2. Flow is then conveyed to the EDB. Sub-basin B flows in the 5-year event are 3.53 cfs and in the 100-year event are 6.72 cfs.
Sub-basin C contains 0.21 acres of building roof, pavement and landscaping at a percentimpervious of 88%. It is in the southern portion of the site. Runoff surface flows to the south toa 5’ Type R inlet at Design Point 3. The flow combines with the runoff from Sub-basin B and isthen piped in an 18” RCP to the detention/water quality pond. The 5-year runoff is 0.83 cfs andthe 100-year runoff is 1.55 cfs. The combined runoff from Sub-basins B and C in the 18” RCPflowing to the pond at Design Point 4 is 4.36 cfs in the 5-year storm and 8.27 cfs in the 100-yearstorm.
Sub-basin D is a small area (0.09 acres) adjacent to Deer Creek Road and Monument Hill Road.It is all landscaped with a percent impervious of 0%. Flows runs off to the existing swale next tothe roadway. These minor flows are 0.03 cfs and 0.26 cfs in the 5-year and 100-year storms.
Sub-basin E contains the Extended Detention Basin providing stormwater detention and waterquality for the site. It is 0.22 acres of landscaping. The flows generated within this sub-basin are0.07 cfs and 0.55 cfs in the initial and major storm events.
The runoff from Sub-basins A, B, C and E all flow to the EDB. The total flows reaching the basibare 8.78 cfs in the 5-year event and 16.62 cfs in the 100-year event.
Sub-basin F is a landscaped area containing 0.15 acres. It is all landscape and slopes to thesouth, much in the same pattern that the site currently slopes. It is 0% impervious and therunoff is 0.06 cfs for the 5-year and 0.45 for the 100-year. This runoff flows onto the adjacentproperty, which is the same flow pattern as existing Sub-basin E3. The existing conditions runofffrom sub-basin E3 is 0.61 cfs for the 5-year storm and 4.48 cfs in the 100-year. The proposedimprovements will significantly reduce the runoff flowing onto the property to the south.
There is an off-site sub-basin that impact the design of the stormwater facilities for thisdevelopment. Sub-basin OS2 is the south one-half of Deer Creek Road east of the entrance tothe site. It flows westerly to the 18” RCP culvert under the entrance drive at Design Point 6. It is0.17 acres. The 100-year runoff is calculated to be 0.65 cfs. The flow depth in the culvert is 0.3feet or 3.6 inches. Riprap will be installed at both ends of the culvert to minimize erosion.

7
A summary of the Sub-basins’ runoff is as follows:
DEVELOPED SUB-BASIN RUNOFF SUMMARY TABLE
Sub-basinDesignation
DesignPoint
Sub-basin
Area (ac)
PercentImpervious
C5 C100Tc
(min)Q5
(cfs)Q100
(cfs)
A 1 1.39 96% 0.86 0.93 5.5 5.95 10.77
B 2 0.95 81% 0.73 0.83 5.0 3.53 6.72
C 3 0.21 88% 0.78 0.87 5.0 0.83 1.55
D 0.07 0% 0.08 0.35 10.8 0.02 0.16
E 0.22 0% 0.08 0.35 9.0 0.07 0.55
F 0.15 0% 0.08 0.35 5.0 0.06 0.45
OS2 6 0.17 29% 0.32 0.53 8.6 0.23 0.65
EXISTING SUB-BASIN RUNOFF SUMMARY TABLE
Sub-basinDesignation
DesignPoint
Sub-basin
Area (ac)
PercentImpervious
C5 C100Tc
(min)Q5
(cfs)Q100
(cfs)
E1 0.51 0.0% 0.08 0.35 11.3 0.16 1.16
E2 0.68 0.0% 0.08 0.35 11.1 0.21 1.56
E3 2.08 0.0% 0.08 0.35 12.8 0.61 4.48
E4 E4 0.50 37.8% 0.39 0.58 13.7 0.70 1.73
A summary of the Design Points’ flows is as follows:
DESIGN POINT RUNOFF SUMMARY TABLE
DesignPoint
ContributingSub-basins
ContributingArea
(acres)
Tc
(min)Q5
(cfs)Q100
(cfs)
1 A 1.39 5.5 5.95 10.77
2 B 0.95 5.0 3.53 6.72
3 C 0.95 5.0 0.83 1.55
4 B, C 1.16 5.0 4.36 8.27
5 A, B, C, E 2.77 9.0 8.78 16.62
6 OS2 0.17 8.6 0.23 0.65
E4 E4 0.50 13.7 0.70 1.73

8
Stormwater Quality and Storage Facilities
El Paso County requires the Four Step Process be followed for the selection and siting ofstructural BMPs for new development to provide water quality for stormwater runoff beingdischarged into State Waters. The Four Steps are employ runoff reduction practices, stabilizedrainageways, provide water quality capture volume (WQCV) and implement permanent BMPs.The design of the site has followed this process as much as possible. Pavement has beenminimized to meet only the parking spaces as required by the county and landscaped areas areincluded to assist in reducing runoff. There are no major drainageways on site. Thedrainageways adjacent to the site are being improved with riprap protection whereconcentrated flows may cause erosion. The WQCV is being provided in the permanent BMP,which is an Extended Detention Basin designed in accordance with county regulations.
Stormwater detention and water quality enhancement is provided on-site in an ExtendedDetention Basin stormwater facility. This basin is designed using the Full Spectrum Method.Based upon the area of the site that contributes to the EDB of 2.77 acres and a percentimpervious of 83%, the pond is required to provide 0.384 acre-feet or 16,727 cubic feet ofdetention storage, which includes the water quality capture volume and the excess urbanrunoff volume. The pond will have a maximum storage depth of 6.23 feet. The pond bottom willbe at an elevation of 7113.80 feet and the 100-year water surface elevation will be 7120.03feet.The EURV is 0.0.175 acre-feet or 7,623 cubic feet and the EURV water surface elevation will be7119.08 feet. The WQCV is 0.080 acre-feet or 3,484 cubic feet and the WQCV water surfaceelevation will be 7117.18 feet.
Discharge will be controlled by a standard outlet structure with an flow control plate designedto release the WQCV over 40 hours and release 97% of the 5-year storm in less than 72 hours.The 100-year discharge will be limited to 2.35 cfs (0.85 cfs/acre for Type B soils) and will becontrolled by a circular orifice plate located at the discharge side of the outlet structure prior tothe flow entering an 18” RCP flowing to the proposed drainage swale adjacent to MonumentHill Road. This swale flows to the south and will be constructed as part of the Monument HillRoad Safety Improvements. In the event the outlet structure should become clogged withdebris, and emergency overflow weir and swale will be constructed along the west side of thepond. The emergency overflow swale will be 10’ wide by 1’ deep with 4:1 side slopes. Overflowwill go to the proposed drainage swale along Monument Hill Road flowing to the south.
All storm sewers and the Extended Detention Basin facility will be private and will bemaintained by the property owner.
V. CONCLUSIONS
The drainage plan for the Monument Hill Business Center site is in conformance to acceptableengineering standards and practices and criteria established by the El Paso County. Novariances to any of the regulations and requirements are being requested. No adverse impactsto downstream facilities and/or adjacent properties are expected as a result of thedevelopment of the site.
9
VI. REFERENCES
1. El Paso County’s Engineering Criteria Manual, Revised 07/29/2015 Revision 5.2. City of Colorado Springs Drainage Criteria Manual Volumes 1 and 2, dated May 2014.3. Storm Drainage Criteria Manual. Volumes 1 - 3, Urban Drainage and Flood Control
District, latest versions.4. FEMA Flood Insurance Rate Map Number08041CO295F dated March 17, 1997.5. National Resources Conservation Services Custom Soil Resource Report of El Paso
County Area, Colorado dated February 13, 2017.6. Dirty Woman Creek and Crystal Creek Drainage Basin Planning Study prepared by Kiowa
Engineering dated September, 1993.7. Final Drainage Report, Monument Hill Self Storage prepared by Vermillion Peak
Engineering dated December 15, 2014.
VII. APPENDICES
1. Hydrologic Computationsa. Land use assumptions, composite “C” and % Impervious calculationsb. Initial and major storm runoff computations for developed runoff conditions
2. Hydraulic Computationsa. Extended Detention Basin Calculationsb. SDI Design Datac. Storm Sewer Pipe Flow Calculationsd. Inlet Capacity Calculations
3. Referenced Informationa. FEMA FIRMb. NCRS Soils Report

10
APPENDIX 1
HYDROLOGIC COMPUTATIONS
LOCATION: Sievers Business Center El Paso County, CO Soil Type: B Final Drainage Report BY: GSK DATE: 9/20/2017
SUB-BASINPERCENT
IMPERVIOUS
DESIGNATION PAVED ROOFS LAWNS TOTAL 2YR 5 YR 10 YR 100 YR 2YR 5 YR 10 YR 100 YR 2YR 5 YR 10 YR 100 YR 2YR 5 YR 10 YR 100 YR
Imperviousness (%) =
A 1.20 0.16 0.03 1.39 0.89 0.90 0.92 0.96 0.71 0.73 0.75 0.81 0.02 0.08 0.15 0.35 0.85 0.86 0.88 0.93 96.2%
B 0.58 0.22 0.15 0.95 0.89 0.90 0.92 0.96 0.71 0.73 0.75 0.81 0.02 0.08 0.15 0.35 0.71 0.73 0.76 0.83 81.5%
C 0.14 0.05 0.02 0.21 0.89 0.90 0.92 0.96 0.71 0.73 0.75 0.81 0.02 0.08 0.15 0.35 0.76 0.78 0.81 0.87 87.6%
D 0.00 0.00 0.07 0.07 0.89 0.90 0.92 0.96 0.71 0.73 0.75 0.81 0.02 0.08 0.15 0.35 0.02 0.08 0.15 0.35 0.0%
E 0.00 0.00 0.22 0.22 0.89 0.90 0.92 0.96 0.71 0.73 0.75 0.81 0.02 0.08 0.15 0.35 0.02 0.08 0.15 0.35 0.0%
F 0.00 0.00 0.15 0.15 0.89 0.90 0.92 0.96 0.71 0.73 0.75 0.81 0.02 0.08 0.15 0.35 0.02 0.08 0.15 0.35 0.0%
EDB CONTRIBUTION 1.92 0.43 0.42 2.77 0.89 0.90 0.92 0.96 0.71 0.73 0.75 0.81 0.02 0.08 0.15 0.35 0.73 0.75 0.78 0.84 82.9%
OFF-SITE
OS2 0.05 0.00 0.12 0.17 0.89 0.90 0.92 0.96 0.71 0.73 0.75 0.81 0.02 0.08 0.15 0.35 0.28 0.32 0.38 0.53 29.3%
EXISTING SITE
E1 0.00 0.00 0.51 0.51 0.89 0.90 0.92 0.96 0.71 0.73 0.75 0.81 0.02 0.08 0.15 0.35 0.02 0.08 0.15 0.35 0.0%
E2 0.00 0.00 0.68 0.68 0.89 0.90 0.92 0.96 0.71 0.73 0.75 0.81 0.02 0.08 0.15 0.35 0.02 0.08 0.15 0.35 0.0%
E3 0.00 0.00 2.08 2.08 0.89 0.90 0.92 0.96 0.71 0.73 0.75 0.81 0.02 0.08 0.15 0.35 0.02 0.08 0.15 0.35 0.0%
E4 0.19 0.00 0.31 0.50 0.89 0.90 0.92 0.96 0.71 0.73 0.75 0.81 0.02 0.08 0.15 0.35 0.35 0.39 0.44 0.58 37.8%
0
PAVEMENT ROOFS LAWNS
90100
COMPOSITE 'C' FACTORS (DEVELOPED)
COMPOSITE C FACTORAcreage
9/20/2017 Sievers Business Center Final Drainage Report
TIME OF CONCENTRATION (STANDARD FORM SF-2) REMARKS
LOCATION: Sievers Business Center Final Drainage Report BY: GSK DATE: 9/20/2017 FORMULAS:
SUB-BASIN DATAINIT./OVERLAND TIME
(Ti)
TRAVEL TIME
(Tt)TOTAL
FINAL
Tc * Ti = 0.395 (1.1-C5)L^0.5/S/100^1/3
DESIGNATION C5AREA
(AC)
LENGTH
(FT)
SLOPE
%
Ti
(Min.)*
GRASS/
PAVED
LENGTH
(FT)
SLOPE
%
VEL
(FPS)**
Tt
(Min.)
Ti+Tt
(Min.)
LGTH.
(FT)Tc = (L/180) + 10 (minutes)
** V=Cv*(S/100)^0.5
A 0.86 1.39 40 2.00 2.18 PAVED 455 1.32 2.30 3.30 5.5 495 12.8 5.5 Design Point 1 - Inlet
B 0.73 0.95 50 6.00 2.63 PAVED 335 1.34 2.32 2.41 5.0 385 12.1 5.0 Design Point 2 - Inlet
C 0.78 0.21 50 10.00 1.92 PAVED 166 1.33 2.31 1.20 3.1 216 11.2 5.0 Design Point 3 - Inlet
D 0.08 0.07 142 3.50 14.68 GRASS 0 1.00 0.70 0.00 14.7 142 10.8 10.8
E 0.08 0.22 60 5.00 8.47 PAVED 90 2.22 2.98 0.50 9.0 150 10.8 9.0
F 0.08 0.15 25 12.00 4.08 GRASS 0 1.00 0.70 0.00 4.1 25 10.1 5.0
OS2 0.32 0.17 10 2.00 3.58 GRASS 280 1.77 0.93 5.01 8.6 290 11.6 8.6
E1 0.08 0.51 227 3.96 17.81 GRASS 0 1.00 0.70 0.00 17.8 227 11.3 11.3
E2 0.08 0.68 200 3.50 17.42 GRASS 0 1.00 0.70 0.00 17.4 200 11.1 11.1
E3 0.08 2.08 300 3.00 22.46 GRASS 200 3.00 1.21 2.75 25.2 500 12.8 12.8
E4 0.39 0.50 10 2.00 3.26 GRASS 658 1.00 0.70 15.67 18.9 668 13.7 13.7
Tc Check
(Urbanized Basins)
9/20/2017 Sievers Business Center Final Drainage Report

Standard Form SF - 3Storm Drainage System Design
(Rational Method Procedure)
Subdivision Sievers Business Center
Designer GSK I= 28.5*P1 0
Date (10+TC)0.786
Design Storm 5 -YR DEVELOPED Where: P1 = 1.50
Direct Runoff Total Runoff
Su
bb
asin
De
sig
na
tion
Are
a
Ru
no
ffC
oe
ffe
cie
nt
tc
Cx
A
I Q tc
Cx
A
I Q
Comment
ac. min. ac. in/hr cfs min. ac. in/hr cfs(1) (2) (3) (4) (5) (6) (7) (8) (9) (10) (11) (12)
1 A 1.39 0.86 5.5 1.20 4.96 5.95 5.95 Flow at Inlet & Pipe to pond
2 B 0.95 0.73 5.0 0.69 5.08 3.53 3.53 Flow at Inlet3 C 0.21 0.78 5.0 0.16 5.09 0.83 5.0 0.86 5.08 4.36 Flow in Pipe to Pond4 E 0.22 0.08 9.0 0.02 4.23 0.07 9.0 2.08 4.23 8.78 Total Flow to Pond
5 OS2 0.17 0.32 8.6 0.05 4.30 0.23 0.23 Flow at 18" culvert
D 0.07 0.08 10.8 0.01 3.94 0.02 0.02
F 0.15 0.08 5.0 0.01 5.09 0.06 0.06
E1 0.51 0.08 11.3 0.04 3.87 0.16 0.16
E2 0.68 0.08 11.1 0.05 3.89 0.21 0.21
E3 2.08 0.08 12.8 0.17 3.66 0.61 0.61
E4 E4 0.50 0.39 13.7 0.20 3.55 0.70 0.70
9/20/2017
De
sig
nP
oin
t
9/20/2017 Sievers Business Center Final Drainage Report

Standard Form SF - 3Storm Drainage System Design
(Rational Method Procedure)
Subdivision Sievers Business Center
Designer GSK I= 28.5*P1
Date (10+TC)0.786
Design Storm 100-YR DEVELOPED Where: P1 = 2.52
Direct Runoff Total Runoff
Subbasin
Desig
natio
n
Are
a
Runoff
Coeff
ecie
nt
tc
Cx
A
I Q tc
Cx
A
I Q
Comment
ac. min. ac. in/hr cfs min. ac. in/hr cfs(1) (2) (3) (4) (5) (6) (7) (8) (9) (10) (11) (12)
1 A 1.39 0.93 5.5 1.29 8.34 10.77 10.77 Flow at Inlet & Pipe to pond
2 B 0.95 0.83 5.0 0.79 8.53 6.72 6.72 Flow at Inlet3 C 0.21 0.87 5.0 0.18 8.55 1.55 5.0 0.97 8.53 8.27 Flow in Pipe to Pond4 E 0.22 0.35 9.0 0.08 7.11 0.55 9.0 2.34 7.11 16.62 Total Flow to Pond
5 OS2 0.17 0.53 8.6 0.09 7.22 0.65 0.65 Flow at 18" culvert
D 0.07 0.35 10.8 0.02 6.61 0.16 10.8 0.11 6.61 0.76
F 0.15 0.35 5.0 0.05 8.55 0.45 0.45
E1 0.51 0.35 11.3 0.18 6.50 1.16 1.16
E2 0.68 0.35 11.1 0.24 6.53 1.56 1.56
E3 2.08 0.35 12.8 0.73 6.16 4.48 4.48
E4 E4 0.50 0.58 13.7 0.29 5.96 1.73 1.73
9/20/2017
Desig
nP
oin
t
9/20/2017 Sievers Business Center Final Drainage Report

Sub-basin
Designation
Design
Point
Sub-basin
Area (ac)
Percent
ImperviousC5 C100
Tc
(min)
Q5
(cfs)
Q100
(cfs)
A 1 1.39 96% 0.86 0.93 5.5 5.95 10.77
B 2 0.95 81% 0.73 0.83 5.0 3.53 6.72
C 3 0.21 88% 0.78 0.87 5.0 0.83 1.55
D 0.07 0% 0.08 0.35 10.8 0.02 0.16
E 0.22 0% 0.08 0.35 9.0 0.07 0.55
F 0.15 0% 0.08 0.35 5.0 0.06 0.45
OS2 6 0.17 29% 0.32 0.53 8.6 0.23 0.65
Sub-basin
Designation
Design
Point
Sub-basin
Area (ac)
Percent
ImperviousC5 C100
Tc
(min)
Q5
(cfs)
Q100
(cfs)
E1 0.51 0.0% 0.08 0.35 11.3 0.16 1.16
E2 0.68 0.0% 0.08 0.35 11.1 0.21 1.56
E3 2.08 0.0% 0.08 0.35 12.8 0.61 4.48
E4 E4 0.50 37.8% 0.39 0.58 13.7 0.70 1.73
DEVELOPED SUB-BASIN RUNOFF SUMMARY TABLE
EXISTING SUB-BASIN RUNOFF SUMMARY TABLE
9/20/2017 Sievers Business Center Final Drainage Report

Design
Point
Contributing
Sub-basins
Contributing
Area
(acres)
Tc
(min)
Q5
(cfs)
Q100
(cfs)
1 A 1.39 5.5 5.95 10.77
2 B 0.95 5.0 3.53 6.72
3 C 0.95 5.0 0.83 1.55
4 B, C 1.16 5.0 4.36 8.27
5 A, B, C, E 2.77 9.0 8.78 16.62
6 OS2 0.17 8.6 0.23 0.65
E4 E4 0.50 13.7 0.70 1.73
DESIGN POINT RUNOFF SUMMARY TABLE
9/20/2017 Sievers Business Center Final Drainage Report

APPENDIX 2
HYDRAULIC COMPUTATIONS
Project:
Basin ID:
Depth Increment = ft
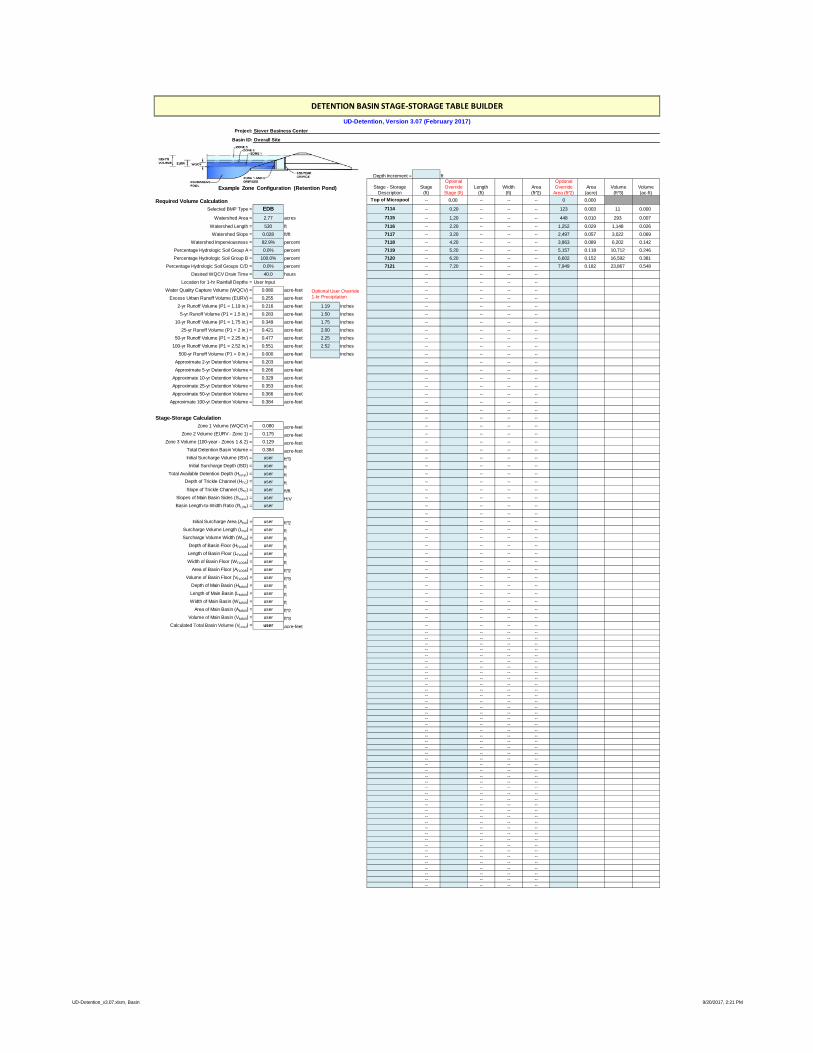
Required Volume Calculation Top of Micropool -- 0.00 -- -- -- 0 0.000
Selected BMP Type = EDB 7114 -- 0.20 -- -- -- 123 0.003 11 0.000
Watershed Area = 2.77 acres 7115 -- 1.20 -- -- -- 448 0.010 293 0.007
Watershed Length = 530 ft 7116 -- 2.20 -- -- -- 1,252 0.029 1,148 0.026
Watershed Slope = 0.028 ft/ft 7117 -- 3.20 -- -- -- 2,497 0.057 3,022 0.069
Watershed Imperviousness = 82.9% percent 7118 -- 4.20 -- -- -- 3,863 0.089 6,202 0.142
Percentage Hydrologic Soil Group A = 0.0% percent 7119 -- 5.20 -- -- -- 5,157 0.118 10,712 0.246
Percentage Hydrologic Soil Group B = 100.0% percent 7120 -- 6.20 -- -- -- 6,602 0.152 16,592 0.381
Percentage Hydrologic Soil Groups C/D = 0.0% percent 7121 -- 7.20 -- -- -- 7,949 0.182 23,867 0.548
Desired WQCV Drain Time = 40.0 hours -- -- -- --
Location for 1-hr Rainfall Depths = User Input -- -- -- --
Water Quality Capture Volume (WQCV) = 0.080 acre-feet -- -- -- --
Excess Urban Runoff Volume (EURV) = 0.255 acre-feet -- -- -- --
2-yr Runoff Volume (P1 = 1.19 in.) = 0.216 acre-feet 1.19 inches -- -- -- --
5-yr Runoff Volume (P1 = 1.5 in.) = 0.283 acre-feet 1.50 inches -- -- -- --
10-yr Runoff Volume (P1 = 1.75 in.) = 0.349 acre-feet 1.75 inches -- -- -- --
25-yr Runoff Volume (P1 = 2 in.) = 0.421 acre-feet 2.00 inches -- -- -- --
50-yr Runoff Volume (P1 = 2.25 in.) = 0.477 acre-feet 2.25 inches -- -- -- --
100-yr Runoff Volume (P1 = 2.52 in.) = 0.551 acre-feet 2.52 inches -- -- -- --
500-yr Runoff Volume (P1 = 0 in.) = 0.000 acre-feet inches -- -- -- --
Approximate 2-yr Detention Volume = 0.203 acre-feet -- -- -- --
Approximate 5-yr Detention Volume = 0.266 acre-feet -- -- -- --
Approximate 10-yr Detention Volume = 0.329 acre-feet -- -- -- --
Approximate 25-yr Detention Volume = 0.353 acre-feet -- -- -- --
Approximate 50-yr Detention Volume = 0.366 acre-feet -- -- -- --
Approximate 100-yr Detention Volume = 0.384 acre-feet -- -- -- --
-- -- -- --
Stage-Storage Calculation -- -- -- --
Zone 1 Volume (WQCV) = 0.080 acre-feet -- -- -- --
Zone 2 Volume (EURV - Zone 1) = 0.175 acre-feet -- -- -- --
Zone 3 Volume (100-year - Zones 1 & 2) = 0.129 acre-feet -- -- -- --
Total Detention Basin Volume = 0.384 acre-feet -- -- -- --
Initial Surcharge Volume (ISV) = user ft 3̂ -- -- -- --
Initial Surcharge Depth (ISD) = user ft -- -- -- --
Total Available Detention Depth (Htotal) = user ft -- -- -- --
Depth of Trickle Channel (HTC) = user ft -- -- -- --
Slope of Trickle Channel (STC) = user ft/ft -- -- -- --
Slopes of Main Basin Sides (Smain) = user H:V -- -- -- --
Basin Length-to-Width Ratio (RL/W) = user -- -- -- --
-- -- -- --
Initial Surcharge Area (AISV) = user ft 2̂ -- -- -- --
Surcharge Volume Length (LISV) = user ft -- -- -- --
Surcharge Volume Width (W ISV) = user ft -- -- -- --
Depth of Basin Floor (HFLOOR) = user ft -- -- -- --
Length of Basin Floor (LFLOOR) = user ft -- -- -- --
Width of Basin Floor (WFLOOR) = user ft -- -- -- --
Area of Basin Floor (AFLOOR) = user ft 2̂ -- -- -- --
Volume of Basin Floor (VFLOOR) = user ft 3̂ -- -- -- --
Depth of Main Basin (HMAIN) = user ft -- -- -- --
Length of Main Basin (LMAIN) = user ft -- -- -- --
Width of Main Basin (WMAIN) = user ft -- -- -- --
Area of Main Basin (AMAIN) = user ft 2̂ -- -- -- --
Volume of Main Basin (VMAIN) = user ft 3̂ -- -- -- --
Calculated Total Basin Volume (Vtotal) = user acre-feet -- -- -- --
-- -- -- ---- -- -- ---- -- -- ---- -- -- ---- -- -- ---- -- -- ---- -- -- ---- -- -- ---- -- -- ---- -- -- ---- -- -- ---- -- -- ---- -- -- ---- -- -- ---- -- -- ---- -- -- ---- -- -- ---- -- -- ---- -- -- ---- -- -- ---- -- -- ---- -- -- ---- -- -- ---- -- -- ---- -- -- ---- -- -- ---- -- -- ---- -- -- ---- -- -- ---- -- -- ---- -- -- ---- -- -- ---- -- -- ---- -- -- ---- -- -- ---- -- -- ---- -- -- ---- -- -- ---- -- -- ---- -- -- ---- -- -- ---- -- -- ---- -- -- ---- -- -- ---- -- -- --
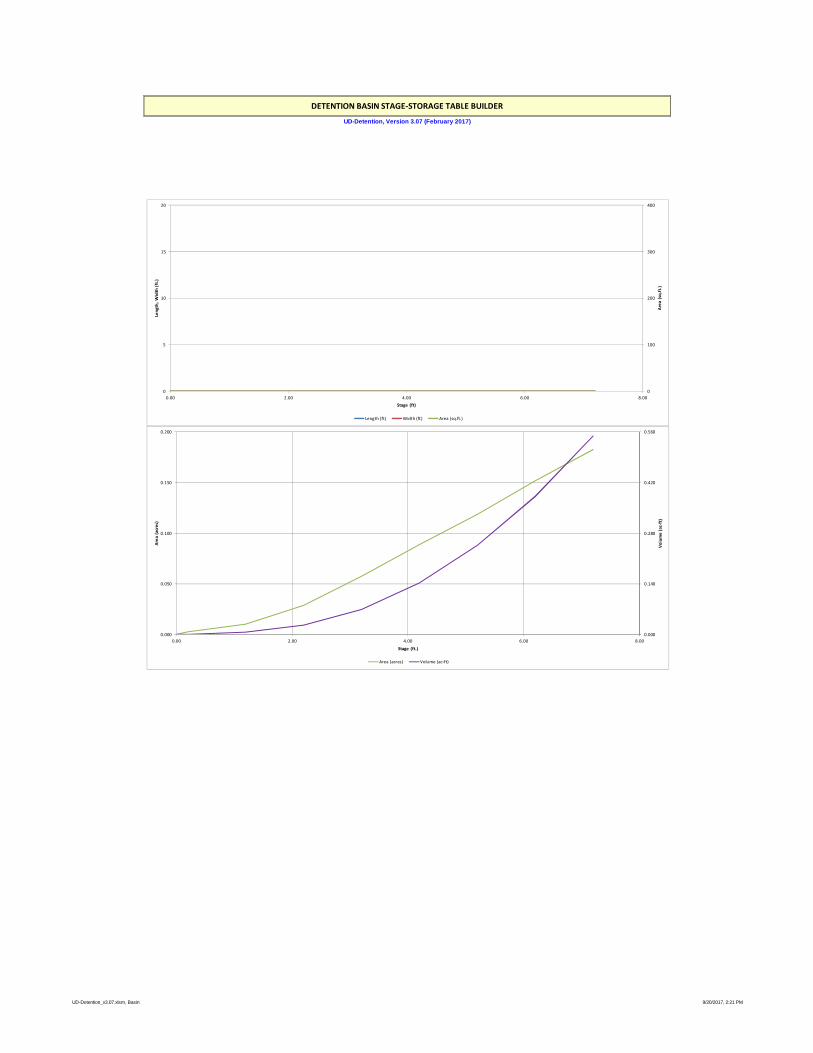
DETENTION BASIN STAGE-STORAGE TABLE BUILDER
OptionalOverride
Area (ft 2̂)Length
(ft)
OptionalOverrideStage (ft)
Stage(ft)
Stage - StorageDescription
Area(ft 2̂)
Width(ft)
Siever Business Center
Overall Site
UD-Detention, Version 3.07 (February 2017)
Volume(ft 3̂)
Volume(ac-ft)
Area(acre)
Optional User Override1-hr Precipitation
Example Zone Configuration (Retention Pond)
UD-Detention_v3.07.xlsm, Basin 9/20/2017, 2:21 PM
1 User Defined Stage-Area Boolean for Message
1 Equal Stage-Area Inputs Watershed L:W
1 CountA
0 Calc_S_TC
H_FLOOR
L_FLOOR_OTHER
0.00 ISV 0.00 ISV
0.00 Floor 0.00 Floor
3.38 Zone 1 (WQCV) 3.38 Zone 1 (WQCV)
5.28 Zone 2 (EURV) 5.28 Zone 2 (EURV)
6.23 Zone 3 (100-year) 6.23 Zone 3 (100-year)
DETENTION BASIN STAGE-STORAGE TABLE BUILDER
UD-Detention, Version 3.07 (February 2017)
0.000
0.140
0.280
0.420
0.560
0.000
0.050
0.100
0.150
0.200
0.00 2.00 4.00 6.00 8.00
Vo
lum
e(a
c-ft
)
Are
a(a
cre
s)
Stage (ft.)
Area (acres) Volume (ac-ft)
0
100
200
300
400
0
5
10
15
20
0.00 2.00 4.00 6.00 8.00
Are
a(s
q.f
t.)
Len
gth
,W
idth
(ft.
)
Stage (ft)
Length (ft) Width (ft) Area (sq.ft.)
UD-Detention_v3.07.xlsm, Basin 9/20/2017, 2:21 PM

Project:
Basin ID:
Stage (ft) Zone Volume (ac-ft) Outlet Type
Zone 1 (WQCV) 3.38 0.080 Orifice Plate
Zone 2 (EURV) 5.28 0.175 Orifice Plate
Zone 3 (100-year) 6.23 0.129 Weir&Pipe (Circular)
0.384 Total
User Input: Orifice at Underdrain Outlet (typically used to drain WQCV in a Filtration BMP) Calculated Parameters for Underdrain
Underdrain Orifice Invert Depth = N/A ft (distance below the filtration media surface) Underdrain Orifice Area = N/A ft2
Underdrain Orifice Diameter = N/A inches Underdrain Orifice Centroid = N/A feet
User Input: Orifice Plate with one or more orifices or Elliptical Slot Weir (typically used to drain WQCV and/or EURV in a sedimentation BMP) Calculated Parameters for Plate
Invert of Lowest Orifice = 0.00 ft (relative to basin bottom at Stage = 0 ft) WQ Orifice Area per Row = N/A ft2
Depth at top of Zone using Orifice Plate = 5.28 ft (relative to basin bottom at Stage = 0 ft) Elliptical Half-Width = N/A feet
Orifice Plate: Orifice Vertical Spacing = 21.10 inches Elliptical Slot Centroid = N/A feet
Orifice Plate: Orifice Area per Row = N/A inches Elliptical Slot Area = N/A ft2
User Input: Stage and Total Area of Each Orifice Row (numbered from lowest to highest)
Row 1 (required) Row 2 (optional) Row 3 (optional) Row 4 (optional) Row 5 (optional) Row 6 (optional) Row 7 (optional) Row 8 (optional)
Stage of Orifice Centroid (ft) 0.00 1.76 3.52
Orifice Area (sq. inches) 0.36 0.36 0.99
Row 9 (optional) Row 10 (optional) Row 11 (optional) Row 12 (optional) Row 13 (optional) Row 14 (optional) Row 15 (optional) Row 16 (optional)
Stage of Orifice Centroid (ft)
Orifice Area (sq. inches)
User Input: Vertical Orifice (Circular or Rectangular) Calculated Parameters for Vertical Orifice
Not Selected Not Selected Not Selected Not Selected
Invert of Vertical Orifice = N/A N/A ft (relative to basin bottom at Stage = 0 ft) Vertical Orifice Area = N/A N/A ft2
Depth at top of Zone using Vertical Orifice = N/A N/A ft (relative to basin bottom at Stage = 0 ft) Vertical Orifice Centroid = N/A N/A feet
Vertical Orifice Diameter = N/A N/A inches
User Input: Overflow Weir (Dropbox) and Grate (Flat or Sloped) Calculated Parameters for Overflow Weir
Zone 3 Weir Not Selected Zone 3 Weir Not Selected
Overflow Weir Front Edge Height, Ho = 5.28 N/A ft (relative to basin bottom at Stage = 0 ft) Height of Grate Upper Edge, Ht = 6.03 N/A feet
Overflow Weir Front Edge Length = 3.00 N/A feet Over Flow Weir Slope Length = 3.09 N/A feet
Overflow Weir Slope = 4.00 N/A H:V (enter zero for flat grate) Grate Open Area / 100-yr Orifice Area = 29.07 N/A should be > 4
Horiz. Length of Weir Sides = 3.00 N/A feet Overflow Grate Open Area w/o Debris = 6.49 N/A ft2
Overflow Grate Open Area % = 70% N/A %, grate open area/total area Overflow Grate Open Area w/ Debris = 3.25 N/A ft2
Debris Clogging % = 50% N/A %
User Input: Outlet Pipe w/ Flow Restriction Plate (Circular Orifice, Restrictor Plate, or Rectangular Orifice) Calculated Parameters for Outlet Pipe w/ Flow Restriction Plate
Zone 3 Circular Not Selected Zone 3 Circular Not Selected
Depth to Invert of Outlet Pipe = 0.00 N/A ft (distance below basin bottom at Stage = 0 ft) Outlet Orifice Area = 0.22 N/A ft2
Circular Orifice Diameter = 6.40 N/A inches Outlet Orifice Centroid = 0.27 N/A feet
Half-Central Angle of Restrictor Plate on Pipe = N/A N/A radians
User Input: Emergency Spillway (Rectangular or Trapezoidal) Calculated Parameters for Spillway
Spillway Invert Stage= 7.10 ft (relative to basin bottom at Stage = 0 ft) Spillway Design Flow Depth= 0.41 feet
Spillway Crest Length = 10.00 feet Stage at Top of Freeboard = 8.51 feet
Spillway End Slopes = 4.00 H:V Basin Area at Top of Freeboard = 0.18 acres
Freeboard above Max Water Surface = 1.00 feet
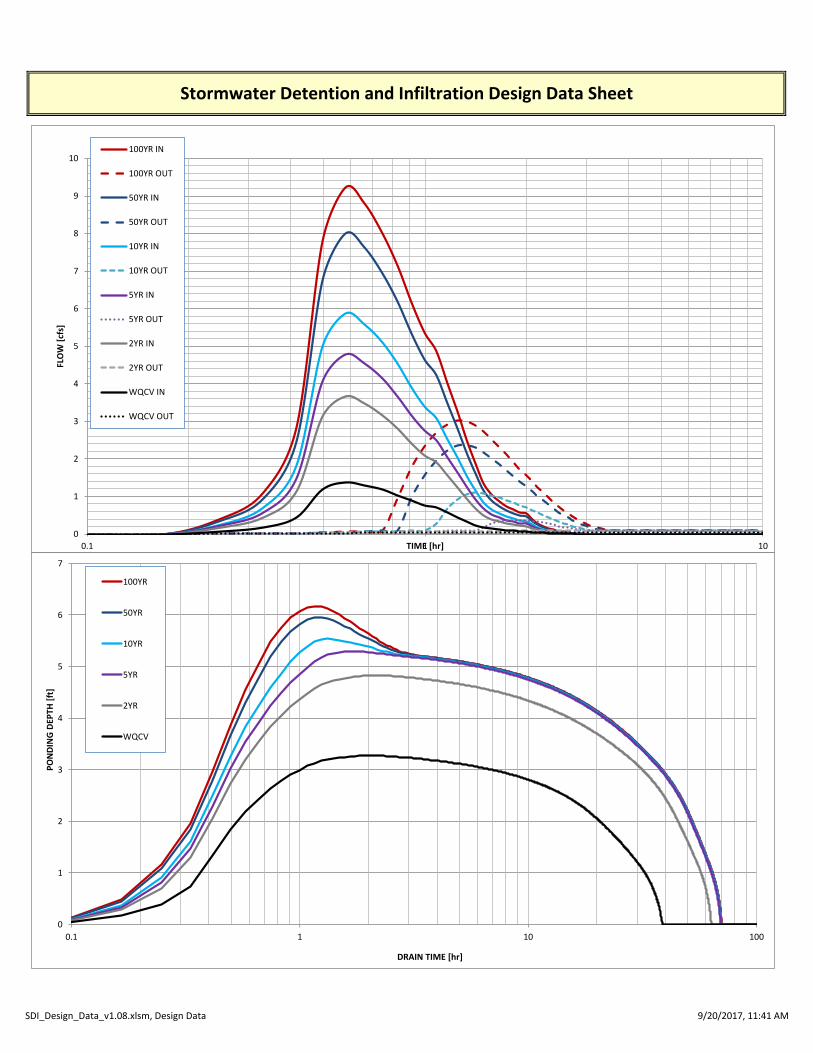
Routed Hydrograph Results
Design Storm Return Period = WQCV EURV 2 Year 5 Year 10 Year 25 Year 50 Year 100 Year 500 Year
One-Hour Rainfall Depth (in) = 0.53 1.07 1.19 1.50 1.75 2.00 2.25 2.52 0.00
Calculated Runoff Volume (acre-ft) = 0.080 0.255 0.216 0.283 0.349 0.421 0.477 0.551 0.000
OPTIONAL Override Runoff Volume (acre-ft) =
Inflow Hydrograph Volume (acre-ft) = 0.080 0.254 0.216 0.283 0.349 0.421 0.477 0.552 #N/A
Predevelopment Unit Peak Flow, q (cfs/acre) = 0.00 0.00 0.01 0.02 0.20 0.66 0.92 1.24 0.00
Predevelopment Peak Q (cfs) = 0.0 0.0 0.0 0.1 0.6 1.8 2.5 3.4 0.0
Peak Inflow Q (cfs) = 1.4 4.3 3.6 4.8 5.8 7.0 8.0 9.2 #N/A
Peak Outflow Q (cfs) = 0.0 0.1 0.1 0.2 1.1 2.3 2.6 2.6 #N/A
Ratio Peak Outflow to Predevelopment Q = N/A N/A N/A 3.7 2.0 1.3 1.0 0.8 #N/A
Structure Controlling Flow = Plate Plate Plate Overflow Grate 1 Overflow Grate 1 Overflow Grate 1 Outlet Plate 1 Outlet Plate 1 #N/A
Max Velocity through Grate 1 (fps) = N/A N/A N/A 0.0 0.2 0.3 0.4 0.4 #N/A
Max Velocity through Grate 2 (fps) = N/A N/A N/A N/A N/A N/A N/A N/A #N/A
Time to Drain 97% of Inflow Volume (hours) = 38 63 59 65 64 62 61 59 #N/A
Time to Drain 99% of Inflow Volume (hours) = 40 68 64 71 70 69 69 68 #N/A
Maximum Ponding Depth (ft) = 3.28 5.16 4.83 5.36 5.57 5.73 5.89 6.18 #N/A
Area at Maximum Ponding Depth (acres) = 0.06 0.12 0.11 0.12 0.13 0.14 0.14 0.15 #N/A
Maximum Volume Stored (acre-ft) = 0.074 0.240 0.203 0.264 0.291 0.313 0.334 0.376 #N/A
Detention Basin Outlet Structure Design
UD-Detention, Version 3.07 (February 2017)Sievers Business Center
Overall Site
Example Zone Configuration (Retention Pond)

COUNTA for Basin Tab = 1 Ao Dia WQ Plate Type Vert Orifice 1 Vert Orifice 2
Count_Underdrain = 0 0.11(diameter = 3/8 inch) 2 1 1
Count_WQPlate = 1 0.14(diameter = 7/16 inch)
Count_VertOrifice1 = 0 0.18(diameter = 1/2 inch) Outlet Plate 1 Outlet Plate 2 Drain Time Message Boolean
Count_VertOrifice2 = 0 0.24(diameter = 9/16 inch) 2 1 5yr, <72hr 0
Count_Weir1 = 1 0.29(diameter = 5/8 inch) >5yr, <120hr #N/A 0
Count_Weir2 = 0 0.36(diameter = 11/16 inch) Max Depth Row
Count_OutletPipe1 = 1 0.42(diameter = 3/4 inch) WQCV 329 Watershed Constraint Check
Count_OutletPipe2 = 0 0.50(diameter = 13/16 inch) 2 Year 484 Slope 0.028
COUNTA_2 (Standard FSD Setup)= 1 0.58(diameter = 7/8 inch) EURV 517 Shape 2.33
MaxPondDepth_Error? FALSE 0.67(diameter = 15/16 inch) 5 Year 537
Hidden Parameters & Calculations 0.76 (diameter = 1 inch) 10 Year 558 Spillway Depth
0.86(diameter = 1-1/16 inches) 25 Year 574 0.41
WQ Plate Flow at 100yr depth = 0.11 0.97(diameter = 1-1/8 inches) 50 Year 590
CLOG #1= 35% 1.08(diameter = 1-3/16 inches) 100 Year 619 1 Z1_Boolean
Cdw #1 = 0.89 1.20(diameter = 1-1/4 inches) 500 Year #N/A 1 Z2_Boolean
Cdo #1 = 0.69 1.32(diameter = 1-5/16 inches) Zone3_Pulldown Message 1 Z3_Boolean
Overflow Weir #1 Angle = 0.245 1.45(diameter = 1-3/8 inches) 1 Opening Message
CLOG #2= #VALUE! 1.59(diameter = 1-7/16 inches) Draintime Running
Cdw #2 = #VALUE! 1.73(diameter = 1-1/2 inches) Outlet Boolean Outlet Rank Total (1 to 4)
Cdo #2 = #VALUE! 1.88(diameter = 1-9/16 inches) Vertical Orifice 1 0 0 1
Overflow Weir #2 Angle = #VALUE! 2.03(diameter = 1-5/8 inches) Vertical Orifice 2 0 0 Boolean
Underdrain Q at 100yr depth = 0.00 2.20(diameter = 1-11/16 inches) Overflow Weir 1 1 1 0 Max Depth
VertOrifice1 Q at 100yr depth = 0.00 2.36(diameter = 1-3/4 inches) Overflow Weir 2 0 0 0 500yr Depth
VertOrifice2 Q at 100yr depth = 0.00 2.54(diameter = 1-13/16 inches) Outlet Pipe 1 1 1 0 Freeboard
EURV_draintime_user = 2.72(diameter = 1-7/8 inches) Outlet Pipe 2 0 0 1 Spillway
Count_User_Hydrographs #N/A 2.90(diameter = 1-15/16 inches) 0 Spillway Length
CountA_3 (EURV & 100yr) = 1 3.09(diameter = 2 inches) Button Visibility Boolean FALSE Time Interval
CountA_4 (100yr Only) = 1 3.29(use rectangular openings) 1 Button_Trigger
0 Underdrain
1 WQCV Plate
0 EURV-WQCV Plate
0 EURV-WQCV VertOrifice
1 Outlet 90% Qpeak
0 Outlet Undetained
S-A-V-D Chart Axis Override X-axis Left Y-Axis Right Y-Axis
minimum bound
maximum bound
Detention Basin Outlet Structure Design
UD-Detention, Version 3.07 (February 2017)
0
1
2
3
4
5
6
7
8
9
10
0.1 1 10
FLO
W[c
fs]
TIME [hr]
500YR IN
500YR OUT
100YR IN
100YR OUT
50YR IN
50YR OUT
25YR IN
25YR OUT
10YR IN
10YR OUT
5YR IN
5YR OUT
2YR IN
2YR OUT
EURV IN
EURV OUT
WQCV IN
WQCV OUT
0
1
2
3
4
5
6
7
0.1 1 10 100
PO
ND
ING
DEP
TH
[ft]
DRAIN TIME [hr]
500YR
100YR
50YR
25YR
10YR
5YR
2YR
EURV
WQCV
0.00
0.50
1.00
1.50
2.00
2.50
3.00
3.50
4.00
4.50
0
5,000
10,000
15,000
20,000
25,000
30,000
0.00 1.00 2.00 3.00 4.00 5.00 6.00 7.00 8.00
OU
TFL
OW
[cfs
]
AR
EA[f
t^2
],V
OLU
ME
[ft^
3]
PONDING DEPTH [ft]
User Area [ft^2]
Interpolated Area [ft^2]
Summary Area [ft^2]
Volume [ft^3]
Summary Volume [ft^3]
Outflow [cfs]
Summary Outflow [cfs]

Outflow Hydrograph Workbook Filename:
Storm Inflow Hydrographs
The user can override the calculated inflow hydrographs from this workbook with inflow hydrographs developed in a separate program.
SOURCE WORKBOOK WORKBOOK WORKBOOK WORKBOOK WORKBOOK WORKBOOK WORKBOOK WORKBOOK #N/A
Time Interval TIME WQCV [cfs] EURV [cfs] 2 Year [cfs] 5 Year [cfs] 10 Year [cfs] 25 Year [cfs] 50 Year [cfs] 100 Year [cfs] 500 Year [cfs]
4.99 min 0:00:00 0.00 0.00 0.00 0.00 0.00 0.00 0.00 0.00 #N/A
0:04:59 0.00 0.00 0.00 0.00 0.00 0.00 0.00 0.00 #N/A
Hydrograph 0:09:59 0.00 0.00 0.00 0.00 0.00 0.00 0.00 0.00 #N/A
Constant 0:14:58 0.06 0.19 0.17 0.21 0.26 0.32 0.36 0.41 #N/A
1.003 0:19:58 0.17 0.52 0.44 0.57 0.70 0.84 0.95 1.10 #N/A
0:24:57 0.43 1.33 1.13 1.47 1.80 2.17 2.45 2.82 #N/A
0:29:56 1.18 3.65 3.11 4.05 4.96 5.96 6.74 7.76 #N/A
0:34:56 1.36 4.28 3.64 4.76 5.84 7.04 7.96 9.19 #N/A
0:39:55 1.29 4.07 3.47 4.53 5.57 6.71 7.59 8.77 #N/A
0:44:55 1.17 3.71 3.15 4.12 5.07 6.11 6.91 7.98 #N/A
0:49:54 1.04 3.29 2.80 3.67 4.51 5.44 6.16 7.12 #N/A
0:54:53 0.88 2.83 2.40 3.15 3.88 4.69 5.31 6.14 #N/A
0:59:53 0.77 2.47 2.10 2.75 3.38 4.09 4.63 5.36 #N/A
1:04:52 0.70 2.23 1.90 2.49 3.06 3.70 4.19 4.85 #N/A
1:09:52 0.56 1.83 1.55 2.04 2.51 3.04 3.45 4.00 #N/A
1:14:51 0.45 1.48 1.25 1.65 2.04 2.47 2.81 3.26 #N/A
1:19:50 0.33 1.12 0.94 1.25 1.56 1.89 2.15 2.50 #N/A
1:24:50 0.24 0.82 0.69 0.92 1.15 1.40 1.60 1.86 #N/A
1:29:49 0.18 0.60 0.51 0.67 0.84 1.02 1.16 1.35 #N/A
1:34:49 0.14 0.47 0.40 0.53 0.65 0.79 0.90 1.05 #N/A
1:39:48 0.12 0.39 0.33 0.43 0.54 0.65 0.74 0.86 #N/A
1:44:47 0.10 0.33 0.28 0.37 0.46 0.55 0.63 0.73 #N/A
1:49:47 0.09 0.29 0.25 0.32 0.40 0.49 0.55 0.64 #N/A
1:54:46 0.08 0.26 0.22 0.29 0.36 0.44 0.50 0.58 #N/A
1:59:46 0.07 0.24 0.21 0.27 0.34 0.41 0.46 0.54 #N/A
2:04:45 0.05 0.18 0.15 0.20 0.25 0.30 0.34 0.39 #N/A
2:09:44 0.04 0.13 0.11 0.15 0.18 0.22 0.25 0.29 #N/A
2:14:44 0.03 0.10 0.08 0.11 0.13 0.16 0.18 0.21 #N/A
2:19:43 0.02 0.07 0.06 0.08 0.10 0.12 0.13 0.15 #N/A
2:24:43 0.01 0.05 0.04 0.06 0.07 0.08 0.10 0.11 #N/A
2:29:42 0.01 0.03 0.03 0.04 0.05 0.06 0.07 0.08 #N/A
2:34:41 0.01 0.02 0.02 0.03 0.03 0.04 0.05 0.06 #N/A
2:39:41 0.00 0.02 0.01 0.02 0.02 0.03 0.03 0.04 #N/A
2:44:40 0.00 0.01 0.01 0.01 0.01 0.02 0.02 0.02 #N/A
2:49:40 0.00 0.00 0.00 0.00 0.01 0.01 0.01 0.01 #N/A
2:54:39 0.00 0.00 0.00 0.00 0.00 0.00 0.00 0.00 #N/A
2:59:38 0.00 0.00 0.00 0.00 0.00 0.00 0.00 0.00 #N/A
3:04:38 0.00 0.00 0.00 0.00 0.00 0.00 0.00 0.00 #N/A
3:09:37 0.00 0.00 0.00 0.00 0.00 0.00 0.00 0.00 #N/A
3:14:37 0.00 0.00 0.00 0.00 0.00 0.00 0.00 0.00 #N/A
3:19:36 0.00 0.00 0.00 0.00 0.00 0.00 0.00 0.00 #N/A
3:24:35 0.00 0.00 0.00 0.00 0.00 0.00 0.00 0.00 #N/A
3:29:35 0.00 0.00 0.00 0.00 0.00 0.00 0.00 0.00 #N/A
3:34:34 0.00 0.00 0.00 0.00 0.00 0.00 0.00 0.00 #N/A
3:39:34 0.00 0.00 0.00 0.00 0.00 0.00 0.00 0.00 #N/A
3:44:33 0.00 0.00 0.00 0.00 0.00 0.00 0.00 0.00 #N/A
3:49:32 0.00 0.00 0.00 0.00 0.00 0.00 0.00 0.00 #N/A
3:54:32 0.00 0.00 0.00 0.00 0.00 0.00 0.00 0.00 #N/A
3:59:31 0.00 0.00 0.00 0.00 0.00 0.00 0.00 0.00 #N/A
4:04:31 0.00 0.00 0.00 0.00 0.00 0.00 0.00 0.00 #N/A
4:09:30 0.00 0.00 0.00 0.00 0.00 0.00 0.00 0.00 #N/A
4:14:29 0.00 0.00 0.00 0.00 0.00 0.00 0.00 0.00 #N/A
4:19:29 0.00 0.00 0.00 0.00 0.00 0.00 0.00 0.00 #N/A
4:24:28 0.00 0.00 0.00 0.00 0.00 0.00 0.00 0.00 #N/A
4:29:28 0.00 0.00 0.00 0.00 0.00 0.00 0.00 0.00 #N/A
4:34:27 0.00 0.00 0.00 0.00 0.00 0.00 0.00 0.00 #N/A
4:39:26 0.00 0.00 0.00 0.00 0.00 0.00 0.00 0.00 #N/A
4:44:26 0.00 0.00 0.00 0.00 0.00 0.00 0.00 0.00 #N/A
4:49:25 0.00 0.00 0.00 0.00 0.00 0.00 0.00 0.00 #N/A
4:54:25 0.00 0.00 0.00 0.00 0.00 0.00 0.00 0.00 #N/A
4:59:24 0.00 0.00 0.00 0.00 0.00 0.00 0.00 0.00 #N/A
5:04:23 0.00 0.00 0.00 0.00 0.00 0.00 0.00 0.00 #N/A
5:09:23 0.00 0.00 0.00 0.00 0.00 0.00 0.00 0.00 #N/A
5:14:22 0.00 0.00 0.00 0.00 0.00 0.00 0.00 0.00 #N/A
5:19:22 0.00 0.00 0.00 0.00 0.00 0.00 0.00 0.00 #N/A
5:24:21 0.00 0.00 0.00 0.00 0.00 0.00 0.00 0.00 #N/A
5:29:20 0.00 0.00 0.00 0.00 0.00 0.00 0.00 0.00 #N/A
5:34:20 0.00 0.00 0.00 0.00 0.00 0.00 0.00 0.00 #N/A
5:39:19 0.00 0.00 0.00 0.00 0.00 0.00 0.00 0.00 #N/A
5:44:19 0.00 0.00 0.00 0.00 0.00 0.00 0.00 0.00 #N/A
5:49:18 0.00 0.00 0.00 0.00 0.00 0.00 0.00 0.00 #N/A
5:54:17 0.00 0.00 0.00 0.00 0.00 0.00 0.00 0.00 #N/A
5:59:17 0.00 0.00 0.00 0.00 0.00 0.00 0.00 0.00 #N/A
Detention Basin Outlet Structure Design
UD-Detention, Version 3.07 (February 2017)

Stormwater Facility Name:
Facility Location & Jurisdiction:
User Input: Watershed Characteristics User Defined User Defined User Defined User Defined
Watershed Slope = 0.028 ft/ft Stage [ft] Area [ft^2] Stage [ft] Discharge [cfs]
Watershed Length = 530 ft 0.00 0 0.00 0.00
Watershed Area = 2.77 acres 0.20 123 0.20 0.01
Watershed Imperviousness = 82.9% percent 1.20 448 1.20 0.01
Percentage Hydrologic Soil Group A = percent 2.20 1,252 2.20 0.03
Percentage Hydrologic Soil Group B = 100.0% percent 3.20 2,497 3.20 0.04
Percentage Hydrologic Soil Groups C/D = percent 4.20 3,863 4.20 0.07
5.20 5,157 5.20 0.09
User Input 17 6.20 6,602 6.20 3.12
7.20 7,949 7.20 4.28
WQCV Treatment Method = 40.00 hours
After completing and printing this worksheet to a pdf, go to:
https://maperture.digitaldataservices.com/gvh/?viewer=cswdif
create a new stormwater facility, and
attach the pdf of this worksheet to that record.
Routed Hydrograph Results
Design Storm Return Period = WQCV 2 Year 5 Year 10 Year 50 Year 100 Year
One-Hour Rainfall Depth = 0.53 1.19 1.50 1.75 2.25 2.52 in
Calculated Runoff Volume = 0.080 0.217 0.284 0.350 0.478 0.552 acre-ft
OPTIONAL Override Runoff Volume = acre-ft
Inflow Hydrograph Volume = 0.080 0.216 0.283 0.349 0.478 0.552 acre-ft
Time to Drain 97% of Inflow Volume = 35.5 55.3 59.5 58.1 55.8 54.5 hours
Time to Drain 99% of Inflow Volume = 37.5 60.6 66.1 65.5 64.3 63.5 hours
Maximum Ponding Depth = 3.27 4.83 5.29 5.54 5.96 6.17 ft
Maximum Ponded Area = 0.06 0.11 0.12 0.13 0.14 0.15 acres
Maximum Volume Stored = 0.073 0.204 0.256 0.287 0.344 0.376 acre-ft
Location for 1-hr Rainfall Depths (use dropdown):
Workbook Protected Worksheet Protected
Stormwater Detention and Infiltration Design Data Sheet
Sievers Business Center Extended Detention Basin
1945 Deer Creek Road, El Paso County
SDI_Design_Data_v1.08.xlsm, Design Data 9/20/2017, 11:41 AM
WQCV_Trigger = 1
RunOnce= 1
CountA= 1
Draintime Coeff= 1.0
0 1 2 3
#N/A
#N/A
0 1 2 3
#N/A
#N/A
Check Data Set 1 Check Data Set 1
Area
Discharge
Stormwater Detention and Infiltration Design Data Sheet
0
1
2
3
4
5
6
7
8
9
10
0.1 1 10
FLO
W [
cfs]
TIME [hr]
100YR IN
100YR OUT
50YR IN
50YR OUT
10YR IN
10YR OUT
5YR IN
5YR OUT
2YR IN
2YR OUT
WQCV IN
WQCV OUT
0
1
2
3
4
5
6
7
0.1 1 10 100
PO
ND
ING
DEP
TH [
ft]
DRAIN TIME [hr]
100YR
50YR
10YR
5YR
2YR
WQCV
SDI_Design_Data_v1.08.xlsm, Design Data 9/20/2017, 11:41 AM

Project:
Pipe ID:
Design Information (Input)
Pipe Invert Slope So = 0.0263 ft/ft
Pipe Manning's n-value n = 0.0120
Pipe Diameter D = 18.00 inches
Design discharge Q = 10.77 cfs
Full-flow Capacity (Calculated)
Full-flow area Af = 1.77 sq ft
Full-flow wetted perimeter Pf = 4.71 ft
Half Central Angle Theta = 3.14 radians
Full-flow capacity Qf = 18.50 cfs
Calculation of Normal Flow Condition
Half Central Angle (0<Theta<3.14) Theta = 1.67 radians
Flow area An = 0.99 sq ft
Top width Tn = 1.49 ft
Wetted perimeter Pn = 2.50 ft
Flow depth Yn = 0.82 ft
Flow velocity Vn = 10.87 fps
Discharge Qn = 10.77 cfs
Percent Full Flow Flow = 58.2% of full flow
Normal Depth Froude Number Frn = 2.35 supercritical
Calculation of Critical Flow Condition
Half Central Angle (0<Theta-c<3.14) Theta-c = 2.32 radians
Critical flow area Ac = 1.58 sq ft
Critical top width Tc = 1.10 ft
Critical flow depth Yc = 1.26 ft
Critical flow velocity Vc = 6.80 fps
Critical Depth Froude Number Frc = 1.00
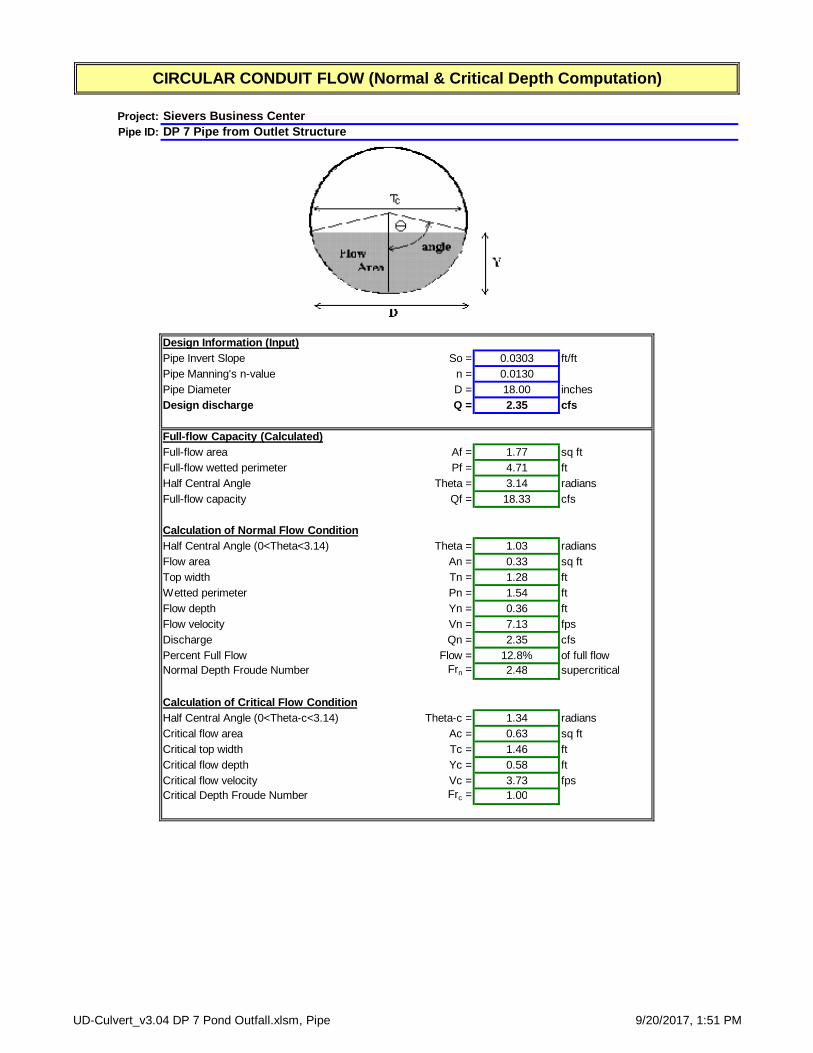
CIRCULAR CONDUIT FLOW (Normal & Critical Depth Computation)
Seibers Business Center
DP 1 to EDB
UD-Culvert_v3.04 DP 1.xlsm, Pipe 9/20/2017, 1:18 PM

Project:
Pipe ID:
Design Information (Input)
Pipe Invert Slope So = 0.0095 ft/ft
Pipe Manning's n-value n = 0.0130
Pipe Diameter D = 18.00 inches
Design discharge Q = 6.72 cfs
Full-flow Capacity (Calculated)
Full-flow area Af = 1.77 sq ft
Full-flow wetted perimeter Pf = 4.71 ft
Half Central Angle Theta = 3.14 radians
Full-flow capacity Qf = 10.27 cfs
Calculation of Normal Flow Condition
Half Central Angle (0<Theta<3.14) Theta = 1.75 radians
Flow area An = 1.08 sq ft
Top width Tn = 1.48 ft
Wetted perimeter Pn = 2.63 ft
Flow depth Yn = 0.88 ft
Flow velocity Vn = 6.19 fps
Discharge Qn = 6.72 cfs
Percent Full Flow Flow = 65.4% of full flow
Normal Depth Froude Number Frn = 1.27 supercritical
Calculation of Critical Flow Condition
Half Central Angle (0<Theta-c<3.14) Theta-c = 1.92 radians
Critical flow area Ac = 1.26 sq ft
Critical top width Tc = 1.41 ft
Critical flow depth Yc = 1.00 ft
Critical flow velocity Vc = 5.35 fps
Critical Depth Froude Number Frc = 1.00
CIRCULAR CONDUIT FLOW (Normal & Critical Depth Computation)
Sievers Business Center
DP 2 to DP 3
UD-Culvert_v3.04 DP 2.xlsm, Pipe 9/20/2017, 1:20 PM

Project:
Pipe ID:
Design Information (Input)
Pipe Invert Slope So = 0.0093 ft/ft
Pipe Manning's n-value n = 0.0130
Pipe Diameter D = 18.00 inches
Design discharge Q = 8.27 cfs
Full-flow Capacity (Calculated)
Full-flow area Af = 1.77 sq ft
Full-flow wetted perimeter Pf = 4.71 ft
Half Central Angle Theta = 3.14 radians
Full-flow capacity Qf = 10.16 cfs
Calculation of Normal Flow Condition
Half Central Angle (0<Theta<3.14) Theta = 1.95 radians
Flow area An = 1.29 sq ft
Top width Tn = 1.39 ft
Wetted perimeter Pn = 2.93 ft
Flow depth Yn = 1.03 ft
Flow velocity Vn = 6.41 fps
Discharge Qn = 8.27 cfs
Percent Full Flow Flow = 81.4% of full flow
Normal Depth Froude Number Frn = 1.17 supercritical
Calculation of Critical Flow Condition
Half Central Angle (0<Theta-c<3.14) Theta-c = 2.08 radians
Critical flow area Ac = 1.41 sq ft
Critical top width Tc = 1.31 ft
Critical flow depth Yc = 1.11 ft
Critical flow velocity Vc = 5.88 fps
Critical Depth Froude Number Frc = 1.00
CIRCULAR CONDUIT FLOW (Normal & Critical Depth Computation)
Sievers Business Center
DP 3 to DP 4
UD-Culvert_v3.04 DP 3.xlsm, Pipe 9/20/2017, 1:21 PM
Project:
Pipe ID:
Design Information (Input)
Pipe Invert Slope So = 0.0303 ft/ft
Pipe Manning's n-value n = 0.0130
Pipe Diameter D = 18.00 inches
Design discharge Q = 2.35 cfs
Full-flow Capacity (Calculated)
Full-flow area Af = 1.77 sq ft
Full-flow wetted perimeter Pf = 4.71 ft
Half Central Angle Theta = 3.14 radians
Full-flow capacity Qf = 18.33 cfs
Calculation of Normal Flow Condition
Half Central Angle (0<Theta<3.14) Theta = 1.03 radians
Flow area An = 0.33 sq ft
Top width Tn = 1.28 ft
Wetted perimeter Pn = 1.54 ft
Flow depth Yn = 0.36 ft
Flow velocity Vn = 7.13 fps
Discharge Qn = 2.35 cfs
Percent Full Flow Flow = 12.8% of full flow
Normal Depth Froude Number Frn = 2.48 supercritical
Calculation of Critical Flow Condition
Half Central Angle (0<Theta-c<3.14) Theta-c = 1.34 radians
Critical flow area Ac = 0.63 sq ft
Critical top width Tc = 1.46 ft
Critical flow depth Yc = 0.58 ft
Critical flow velocity Vc = 3.73 fps
Critical Depth Froude Number Frc = 1.00
CIRCULAR CONDUIT FLOW (Normal & Critical Depth Computation)
Sievers Business Center
DP 7 Pipe from Outlet Structure
UD-Culvert_v3.04 DP 7 Pond Outfall.xlsm, Pipe 9/20/2017, 1:51 PM

Project:
Pipe ID:
Design Information (Input)
Pipe Invert Slope So = 0.0055 ft/ft
Pipe Manning's n-value n = 0.0130
Pipe Diameter D = 18.00 inches
Design discharge Q = 0.65 cfs
Full-flow Capacity (Calculated)
Full-flow area Af = 1.77 sq ft
Full-flow wetted perimeter Pf = 4.71 ft
Half Central Angle Theta = 3.14 radians
Full-flow capacity Qf = 7.81 cfs
Calculation of Normal Flow Condition
Half Central Angle (0<Theta<3.14) Theta = 0.91 radians
Flow area An = 0.24 sq ft
Top width Tn = 1.19 ft
Wetted perimeter Pn = 1.37 ft
Flow depth Yn = 0.29 ft
Flow velocity Vn = 2.68 fps
Discharge Qn = 0.65 cfs
Percent Full Flow Flow = 8.3% of full flow
Normal Depth Froude Number Frn = 1.04 supercritical
Calculation of Critical Flow Condition
Half Central Angle (0<Theta-c<3.14) Theta-c = 0.93 radians
Critical flow area Ac = 0.25 sq ft
Critical top width Tc = 1.20 ft
Critical flow depth Yc = 0.30 ft
Critical flow velocity Vc = 2.59 fps
Critical Depth Froude Number Frc = 1.00
CIRCULAR CONDUIT FLOW (Normal & Critical Depth Computation)
Seivers Business Center
Culvert at DP 6
UD-Culvert_v3.04 DP 7.xlsm, Pipe 9/20/2017, 1:25 PM

Project =
Inlet ID =
Design Information (Input) MINOR MAJOR
Type of Inlet Inlet Type =
Local Depression (additional to continuous gutter depression 'a' from 'Q-Allow') alocal = 3.00 3.00 inches
Number of Unit Inlets (Grate or Curb Opening) No = 2 2
Water Depth at Flowline (outside of local depression) Ponding Depth = 6 6 inches
Grate Information MINOR MAJOR
Length of a Unit Grate Lo (G) = N/A N/A feet
Width of a Unit Grate Wo = N/A N/A feet
Area Opening Ratio for a Grate (typical values 0.15-0.90) Aratio = N/A N/A
Clogging Factor for a Single Grate (typical value 0.50 - 0.70) Cf (G) = N/A N/A
Grate Weir Coefficient (typical value 2.15 - 3.60) Cw (G) = N/A N/A
Grate Orifice Coefficient (typical value 0.60 - 0.80) Co (G) = N/A N/A
Curb Opening Information MINOR MAJOR
Length of a Unit Curb Opening Lo (C) = 5.00 5.00 feet
Height of Vertical Curb Opening in Inches Hvert = 6.00 6.00 inches
Height of Curb Orifice Throat in Inches Hthroat = 6.00 6.00 inches
Angle of Throat (see USDCM Figure ST-5) Theta = 63.40 63.40 degrees
Side Width for Depression Pan (typically the gutter width of 2 feet) Wp = 2.00 2.00 feet
Clogging Factor for a Single Curb Opening (typical value 0.10) Cf (C) = 0.10 0.10
Curb Opening Weir Coefficient (typical value 2.3-3.7) Cw (C) = 3.60 3.60
Curb Opening Orifice Coefficient (typical value 0.60 - 0.70) Co (C) = 0.67 0.67
Grate Flow Analysis (Calculated) MINOR MAJOR
Clogging Coefficient for Multiple Units Coef = N/A N/A
Clogging Factor for Multiple Units Clog = N/A N/A
Grate Capacity as a Weir (based on UDFCD - CSU 2010 Study) MINOR MAJOR
Interception without Clogging Qwi = N/A N/A cfs
Interception with Clogging Qwa = N/A N/A cfs
Grate Capacity as a Orifice (based on UDFCD - CSU 2010 Study) MINOR MAJOR
Interception without Clogging Qoi = N/A N/A cfs
Interception with Clogging Qoa = N/A N/A cfs
Grate Capacity as Mixed Flow MINOR MAJOR
Interception without Clogging Qmi = N/A N/A cfs
Interception with Clogging Qma = N/A N/A cfs
Resulting Grate Capacity (assumes clogged condition) QGrate = N/A N/A cfs
Curb Opening Flow Analysis (Calculated) MINOR MAJOR
Clogging Coefficient for Multiple Units Coef = 1.25 1.25
Clogging Factor for Multiple Units Clog = 0.06 0.06
Curb Opening as a Weir (based on UDFCD - CSU 2010 Study) MINOR MAJOR
Interception without Clogging Qwi = 11.17 11.66 cfs
Interception with Clogging Qwa = 10.47 10.93 cfs
Curb Opening as an Orifice (based on UDFCD - CSU 2010 Study) MINOR MAJOR
Interception without Clogging Qoi = 19.51 19.66 cfs
Interception with Clogging Qoa = 18.29 18.43 cfs
Curb Opening Capacity as Mixed Flow MINOR MAJOR
Interception without Clogging Qmi = 13.73 14.08 cfs
Interception with Clogging Qma = 12.87 13.20 cfs
Resulting Curb Opening Capacity (assumes clogged condition) QCurb = 10.47 10.93 cfs
Resultant Street Conditions MINOR MAJOR
Total Inlet Length L = 10.00 10.00 feet
Resultant Street Flow Spread (based on sheet Q-Allow geometry) T = 18.7 19.1 ft
Resultant Flow Depth at Street Crown dCROWN = 0.0 0.0 inches
MINOR MAJOR
Total Inlet Interception Capacity (assumes clogged condition) Qa = 10.5 10.9 cfs
Inlet Capacity IS GOOD for Minor and Major Storms (>Q PEAK) Q PEAK REQUIRED = 6.0 10.8 cfs
INLET IN A SUMP OR SAG LOCATION
Sievers Business center
Design Point 1
CDOT Type R Curb Opening
H-VertH-Curb
W
Lo (C)
Lo (G)
Wo
WP
Override Depths
UD-Inlet_v3.14 DP 1.xlsm, Inlet In Sump 9/20/2017, 1:38 PM

Project =
Inlet ID =
Design Information (Input) MINOR MAJOR
Type of Inlet Inlet Type =
Local Depression (additional to continuous gutter depression 'a' from 'Q-Allow') alocal = 3.00 3.00 inches
Number of Unit Inlets (Grate or Curb Opening) No = 2 2
Water Depth at Flowline (outside of local depression) Ponding Depth = 6 6 inches
Grate Information MINOR MAJOR
Length of a Unit Grate Lo (G) = N/A N/A feet
Width of a Unit Grate Wo = N/A N/A feet
Area Opening Ratio for a Grate (typical values 0.15-0.90) Aratio = N/A N/A
Clogging Factor for a Single Grate (typical value 0.50 - 0.70) Cf (G) = N/A N/A
Grate Weir Coefficient (typical value 2.15 - 3.60) Cw (G) = N/A N/A
Grate Orifice Coefficient (typical value 0.60 - 0.80) Co (G) = N/A N/A
Curb Opening Information MINOR MAJOR
Length of a Unit Curb Opening Lo (C) = 5.00 5.00 feet
Height of Vertical Curb Opening in Inches Hvert = 6.00 6.00 inches
Height of Curb Orifice Throat in Inches Hthroat = 6.00 6.00 inches
Angle of Throat (see USDCM Figure ST-5) Theta = 63.40 63.40 degrees
Side Width for Depression Pan (typically the gutter width of 2 feet) Wp = 2.00 2.00 feet
Clogging Factor for a Single Curb Opening (typical value 0.10) Cf (C) = 0.10 0.10
Curb Opening Weir Coefficient (typical value 2.3-3.7) Cw (C) = 3.60 3.60
Curb Opening Orifice Coefficient (typical value 0.60 - 0.70) Co (C) = 0.67 0.67
Grate Flow Analysis (Calculated) MINOR MAJOR
Clogging Coefficient for Multiple Units Coef = N/A N/A
Clogging Factor for Multiple Units Clog = N/A N/A
Grate Capacity as a Weir (based on UDFCD - CSU 2010 Study) MINOR MAJOR
Interception without Clogging Qwi = N/A N/A cfs
Interception with Clogging Qwa = N/A N/A cfs
Grate Capacity as a Orifice (based on UDFCD - CSU 2010 Study) MINOR MAJOR
Interception without Clogging Qoi = N/A N/A cfs
Interception with Clogging Qoa = N/A N/A cfs
Grate Capacity as Mixed Flow MINOR MAJOR
Interception without Clogging Qmi = N/A N/A cfs
Interception with Clogging Qma = N/A N/A cfs
Resulting Grate Capacity (assumes clogged condition) QGrate = N/A N/A cfs
Curb Opening Flow Analysis (Calculated) MINOR MAJOR
Clogging Coefficient for Multiple Units Coef = 1.25 1.25
Clogging Factor for Multiple Units Clog = 0.06 0.06
Curb Opening as a Weir (based on UDFCD - CSU 2010 Study) MINOR MAJOR
Interception without Clogging Qwi = 11.17 11.17 cfs
Interception with Clogging Qwa = 10.47 10.47 cfs
Curb Opening as an Orifice (based on UDFCD - CSU 2010 Study) MINOR MAJOR
Interception without Clogging Qoi = 19.51 19.51 cfs
Interception with Clogging Qoa = 18.29 18.29 cfs
Curb Opening Capacity as Mixed Flow MINOR MAJOR
Interception without Clogging Qmi = 13.73 13.73 cfs
Interception with Clogging Qma = 12.87 12.87 cfs
Resulting Curb Opening Capacity (assumes clogged condition) QCurb = 10.47 10.47 cfs
Resultant Street Conditions MINOR MAJOR
Total Inlet Length L = 10.00 10.00 feet
Resultant Street Flow Spread (based on sheet Q-Allow geometry) T = 18.7 18.7 ft
Resultant Flow Depth at Street Crown dCROWN = 0.0 0.0 inches
MINOR MAJOR
Total Inlet Interception Capacity (assumes clogged condition) Qa = 10.5 10.5 cfs
Inlet Capacity IS GOOD for Minor and Major Storms (>Q PEAK) Q PEAK REQUIRED = 3.5 6.7 cfs
INLET IN A SUMP OR SAG LOCATION
Sievers Business Center
Design Point 2
CDOT Type R Curb Opening
H-VertH-Curb
W
Lo (C)
Lo (G)
Wo
WP
Override Depths
UD-Inlet_v3.14 DP 2.xlsm, Inlet In Sump 9/20/2017, 1:46 PM
Project =
Inlet ID =
Design Information (Input) MINOR MAJOR
Type of Inlet Inlet Type =
Local Depression (additional to continuous gutter depression 'a' from 'Q-Allow') alocal = 3.00 3.00 inches
Number of Unit Inlets (Grate or Curb Opening) No = 1 1
Water Depth at Flowline (outside of local depression) Ponding Depth = 6.0 6.0 inches
Grate Information MINOR MAJOR
Length of a Unit Grate Lo (G) = N/A N/A feet
Width of a Unit Grate Wo = N/A N/A feet
Area Opening Ratio for a Grate (typical values 0.15-0.90) Aratio = N/A N/A
Clogging Factor for a Single Grate (typical value 0.50 - 0.70) Cf (G) = N/A N/A
Grate Weir Coefficient (typical value 2.15 - 3.60) Cw (G) = N/A N/A
Grate Orifice Coefficient (typical value 0.60 - 0.80) Co (G) = N/A N/A
Curb Opening Information MINOR MAJOR
Length of a Unit Curb Opening Lo (C) = 5.00 5.00 feet
Height of Vertical Curb Opening in Inches Hvert = 6.00 6.00 inches
Height of Curb Orifice Throat in Inches Hthroat = 6.00 6.00 inches
Angle of Throat (see USDCM Figure ST-5) Theta = 63.40 63.40 degrees
Side Width for Depression Pan (typically the gutter width of 2 feet) Wp = 2.00 2.00 feet
Clogging Factor for a Single Curb Opening (typical value 0.10) Cf (C) = 0.10 0.10
Curb Opening Weir Coefficient (typical value 2.3-3.7) Cw (C) = 3.60 3.60
Curb Opening Orifice Coefficient (typical value 0.60 - 0.70) Co (C) = 0.67 0.67
Grate Flow Analysis (Calculated) MINOR MAJOR
Clogging Coefficient for Multiple Units Coef = N/A N/A
Clogging Factor for Multiple Units Clog = N/A N/A
Grate Capacity as a Weir (based on UDFCD - CSU 2010 Study) MINOR MAJOR
Interception without Clogging Qwi = N/A N/A cfs
Interception with Clogging Qwa = N/A N/A cfs
Grate Capacity as a Orifice (based on UDFCD - CSU 2010 Study) MINOR MAJOR
Interception without Clogging Qoi = N/A N/A cfs
Interception with Clogging Qoa = N/A N/A cfs
Grate Capacity as Mixed Flow MINOR MAJOR
Interception without Clogging Qmi = N/A N/A cfs
Interception with Clogging Qma = N/A N/A cfs
Resulting Grate Capacity (assumes clogged condition) QGrate = N/A N/A cfs
Curb Opening Flow Analysis (Calculated) MINOR MAJOR
Clogging Coefficient for Multiple Units Coef = 1.00 1.00
Clogging Factor for Multiple Units Clog = 0.10 0.10
Curb Opening as a Weir (based on UDFCD - CSU 2010 Study) MINOR MAJOR
Interception without Clogging Qwi = 5.98 5.98 cfs
Interception with Clogging Qwa = 5.38 5.38 cfs
Curb Opening as an Orifice (based on UDFCD - CSU 2010 Study) MINOR MAJOR
Interception without Clogging Qoi = 9.75 9.75 cfs
Interception with Clogging Qoa = 8.78 8.78 cfs
Curb Opening Capacity as Mixed Flow MINOR MAJOR
Interception without Clogging Qmi = 7.10 7.10 cfs
Interception with Clogging Qma = 6.39 6.39 cfs
Resulting Curb Opening Capacity (assumes clogged condition) QCurb = 5.38 5.38 cfs
Resultant Street Conditions MINOR MAJOR
Total Inlet Length L = 5.00 5.00 feet
Resultant Street Flow Spread (based on sheet Q-Allow geometry) T = 18.7 18.7 ft
Resultant Flow Depth at Street Crown dCROWN = 0.0 0.0 inches
MINOR MAJOR
Total Inlet Interception Capacity (assumes clogged condition) Qa = 5.4 5.4 cfs
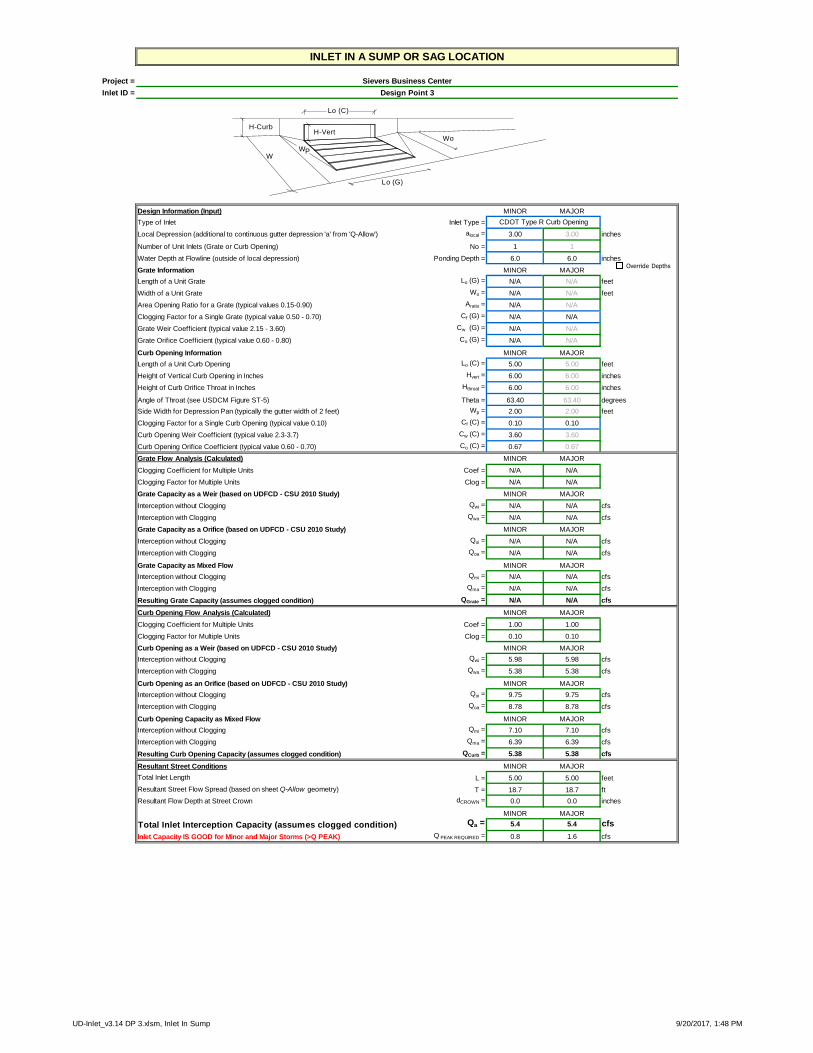
Inlet Capacity IS GOOD for Minor and Major Storms (>Q PEAK) Q PEAK REQUIRED = 0.8 1.6 cfs
INLET IN A SUMP OR SAG LOCATION
Sievers Business Center
Design Point 3
CDOT Type R Curb Opening
H-VertH-Curb
W
Lo (C)
Lo (G)
Wo
WP
Override Depths
UD-Inlet_v3.14 DP 3.xlsm, Inlet In Sump 9/20/2017, 1:48 PM

APPENDIX 3
REFERENCED INFORMATION
SITE

United StatesDepartment ofAgriculture
A product of the NationalCooperative Soil Survey,a joint effort of the UnitedStates Department ofAgriculture and otherFederal agencies, Stateagencies including theAgricultural ExperimentStations, and localparticipants
Custom Soil ResourceReport for
El Paso CountyArea, Colorado
NaturalResourcesConservationService
February 13, 2017
ContentsPreface.................................................................................................................... 2How Soil Surveys Are Made..................................................................................5Soil Map.................................................................................................................. 8
Soil Map................................................................................................................9Legend................................................................................................................10Map Unit Legend................................................................................................ 11Map Unit Descriptions.........................................................................................11
El Paso County Area, Colorado...................................................................... 1371—Pring coarse sandy loam, 3 to 8 percent slopes..................................1392—Tomah-Crowfoot loamy sands, 3 to 8 percent slopes..........................14
References............................................................................................................16
4

How Soil Surveys Are MadeSoil surveys are made to provide information about the soils and miscellaneousareas in a specific area. They include a description of the soils and miscellaneousareas and their location on the landscape and tables that show soil properties andlimitations affecting various uses. Soil scientists observed the steepness, length,and shape of the slopes; the general pattern of drainage; the kinds of crops andnative plants; and the kinds of bedrock. They observed and described many soilprofiles. A soil profile is the sequence of natural layers, or horizons, in a soil. Theprofile extends from the surface down into the unconsolidated material in which thesoil formed or from the surface down to bedrock. The unconsolidated material isdevoid of roots and other living organisms and has not been changed by otherbiological activity.
Currently, soils are mapped according to the boundaries of major land resourceareas (MLRAs). MLRAs are geographically associated land resource units thatshare common characteristics related to physiography, geology, climate, waterresources, soils, biological resources, and land uses (USDA, 2006). Soil surveyareas typically consist of parts of one or more MLRA.
The soils and miscellaneous areas in a survey area occur in an orderly pattern thatis related to the geology, landforms, relief, climate, and natural vegetation of thearea. Each kind of soil and miscellaneous area is associated with a particular kindof landform or with a segment of the landform. By observing the soils andmiscellaneous areas in the survey area and relating their position to specificsegments of the landform, a soil scientist develops a concept, or model, of how theywere formed. Thus, during mapping, this model enables the soil scientist to predictwith a considerable degree of accuracy the kind of soil or miscellaneous area at aspecific location on the landscape.
Commonly, individual soils on the landscape merge into one another as theircharacteristics gradually change. To construct an accurate soil map, however, soilscientists must determine the boundaries between the soils. They can observe onlya limited number of soil profiles. Nevertheless, these observations, supplementedby an understanding of the soil-vegetation-landscape relationship, are sufficient toverify predictions of the kinds of soil in an area and to determine the boundaries.
Soil scientists recorded the characteristics of the soil profiles that they studied. Theynoted soil color, texture, size and shape of soil aggregates, kind and amount of rockfragments, distribution of plant roots, reaction, and other features that enable themto identify soils. After describing the soils in the survey area and determining theirproperties, the soil scientists assigned the soils to taxonomic classes (units).Taxonomic classes are concepts. Each taxonomic class has a set of soilcharacteristics with precisely defined limits. The classes are used as a basis forcomparison to classify soils systematically. Soil taxonomy, the system of taxonomicclassification used in the United States, is based mainly on the kind and characterof soil properties and the arrangement of horizons within the profile. After the soil
5

scientists classified and named the soils in the survey area, they compared theindividual soils with similar soils in the same taxonomic class in other areas so thatthey could confirm data and assemble additional data based on experience andresearch.
The objective of soil mapping is not to delineate pure map unit components; theobjective is to separate the landscape into landforms or landform segments thathave similar use and management requirements. Each map unit is defined by aunique combination of soil components and/or miscellaneous areas in predictableproportions. Some components may be highly contrasting to the other componentsof the map unit. The presence of minor components in a map unit in no waydiminishes the usefulness or accuracy of the data. The delineation of suchlandforms and landform segments on the map provides sufficient information for thedevelopment of resource plans. If intensive use of small areas is planned, onsiteinvestigation is needed to define and locate the soils and miscellaneous areas.
Soil scientists make many field observations in the process of producing a soil map.The frequency of observation is dependent upon several factors, including scale ofmapping, intensity of mapping, design of map units, complexity of the landscape,and experience of the soil scientist. Observations are made to test and refine thesoil-landscape model and predictions and to verify the classification of the soils atspecific locations. Once the soil-landscape model is refined, a significantly smallernumber of measurements of individual soil properties are made and recorded.These measurements may include field measurements, such as those for color,depth to bedrock, and texture, and laboratory measurements, such as those forcontent of sand, silt, clay, salt, and other components. Properties of each soiltypically vary from one point to another across the landscape.
Observations for map unit components are aggregated to develop ranges ofcharacteristics for the components. The aggregated values are presented. Directmeasurements do not exist for every property presented for every map unitcomponent. Values for some properties are estimated from combinations of otherproperties.
While a soil survey is in progress, samples of some of the soils in the area generallyare collected for laboratory analyses and for engineering tests. Soil scientistsinterpret the data from these analyses and tests as well as the field-observedcharacteristics and the soil properties to determine the expected behavior of thesoils under different uses. Interpretations for all of the soils are field tested throughobservation of the soils in different uses and under different levels of management.Some interpretations are modified to fit local conditions, and some newinterpretations are developed to meet local needs. Data are assembled from othersources, such as research information, production records, and field experience ofspecialists. For example, data on crop yields under defined levels of managementare assembled from farm records and from field or plot experiments on the samekinds of soil.
Predictions about soil behavior are based not only on soil properties but also onsuch variables as climate and biological activity. Soil conditions are predictable overlong periods of time, but they are not predictable from year to year. For example,soil scientists can predict with a fairly high degree of accuracy that a given soil willhave a high water table within certain depths in most years, but they cannot predictthat a high water table will always be at a specific level in the soil on a specific date.
After soil scientists located and identified the significant natural bodies of soil in thesurvey area, they drew the boundaries of these bodies on aerial photographs and
Custom Soil Resource Report
6

identified each as a specific map unit. Aerial photographs show trees, buildings,fields, roads, and rivers, all of which help in locating boundaries accurately.
Custom Soil Resource Report
7

Soil MapThe soil map section includes the soil map for the defined area of interest, a list ofsoil map units on the map and extent of each map unit, and cartographic symbolsdisplayed on the map. Also presented are various metadata about data used toproduce the map, and a description of each soil map unit.
8
9
Custom Soil Resource ReportSoil Map
4328
310
4328
330
4328
350
4328
370
4328
390
4328
410
4328
430
4328
450
4328
470
4328
490
4328
310
4328
330
4328
350
4328
370
4328
390
4328
410
4328
430
4328
450
4328
470
4328
490
511750 511770 511790 511810 511830 511850 511870
511750 511770 511790 511810 511830 511850 511870
39° 6' 19'' N10
4° 5
1' 5
1'' W
39° 6' 19'' N
104°
51'
45'
' W
39° 6' 13'' N
104°
51'
51'
' W
39° 6' 13'' N
104°
51'
45'
' W
N
Map projection: Web Mercator Corner coordinates: WGS84 Edge tics: UTM Zone 13N WGS840 45 90 180 270
Feet0 10 20 40 60
MetersMap Scale: 1:936 if printed on A portrait (8.5" x 11") sheet.
Soil Map may not be valid at this scale.

MAP LEGEND MAP INFORMATION
Area of Interest (AOI)Area of Interest (AOI)
SoilsSoil Map Unit Polygons
Soil Map Unit Lines
Soil Map Unit Points
Special Point FeaturesBlowout
Borrow Pit
Clay Spot
Closed Depression
Gravel Pit
Gravelly Spot
Landfill
Lava Flow
Marsh or swamp
Mine or Quarry
Miscellaneous Water
Perennial Water
Rock Outcrop
Saline Spot
Sandy Spot
Severely Eroded Spot
Sinkhole
Slide or Slip
Sodic Spot
Spoil Area
Stony Spot
Very Stony Spot
Wet Spot
Other
Special Line Features
Water FeaturesStreams and Canals
TransportationRails
Interstate Highways
US Routes
Major Roads
Local Roads
BackgroundAerial Photography
The soil surveys that comprise your AOI were mapped at1:24,000.
Warning: Soil Map may not be valid at this scale.
Enlargement of maps beyond the scale of mapping can causemisunderstanding of the detail of mapping and accuracy of soilline placement. The maps do not show the small areas ofcontrasting soils that could have been shown at a more detailedscale.
Please rely on the bar scale on each map sheet for mapmeasurements.
Source of Map: Natural Resources Conservation ServiceWeb Soil Survey URL:Coordinate System: Web Mercator (EPSG:3857)
Maps from the Web Soil Survey are based on the Web Mercatorprojection, which preserves direction and shape but distortsdistance and area. A projection that preserves area, such as theAlbers equal-area conic projection, should be used if moreaccurate calculations of distance or area are required.
This product is generated from the USDA-NRCS certified data asof the version date(s) listed below.
Soil Survey Area: El Paso County Area, ColoradoSurvey Area Data: Version 14, Sep 23, 2016
Soil map units are labeled (as space allows) for map scales1:50,000 or larger.
Date(s) aerial images were photographed: Apr 15, 2011—Sep22, 2011
The orthophoto or other base map on which the soil lines werecompiled and digitized probably differs from the backgroundimagery displayed on these maps. As a result, some minorshifting of map unit boundaries may be evident.
Custom Soil Resource Report
10

Map Unit Legend
El Paso County Area, Colorado (CO625)
Map Unit Symbol Map Unit Name Acres in AOI Percent of AOI
71 Pring coarse sandy loam, 3 to 8percent slopes
0.0 0.4%
92 Tomah-Crowfoot loamy sands,3 to 8 percent slopes
3.2 99.6%
Totals for Area of Interest 3.3 100.0%
Map Unit DescriptionsThe map units delineated on the detailed soil maps in a soil survey represent thesoils or miscellaneous areas in the survey area. The map unit descriptions, alongwith the maps, can be used to determine the composition and properties of a unit.
A map unit delineation on a soil map represents an area dominated by one or moremajor kinds of soil or miscellaneous areas. A map unit is identified and namedaccording to the taxonomic classification of the dominant soils. Within a taxonomicclass there are precisely defined limits for the properties of the soils. On thelandscape, however, the soils are natural phenomena, and they have thecharacteristic variability of all natural phenomena. Thus, the range of someobserved properties may extend beyond the limits defined for a taxonomic class.Areas of soils of a single taxonomic class rarely, if ever, can be mapped withoutincluding areas of other taxonomic classes. Consequently, every map unit is madeup of the soils or miscellaneous areas for which it is named and some minorcomponents that belong to taxonomic classes other than those of the major soils.
Most minor soils have properties similar to those of the dominant soil or soils in themap unit, and thus they do not affect use and management. These are callednoncontrasting, or similar, components. They may or may not be mentioned in aparticular map unit description. Other minor components, however, have propertiesand behavioral characteristics divergent enough to affect use or to require differentmanagement. These are called contrasting, or dissimilar, components. Theygenerally are in small areas and could not be mapped separately because of thescale used. Some small areas of strongly contrasting soils or miscellaneous areasare identified by a special symbol on the maps. If included in the database for agiven area, the contrasting minor components are identified in the map unitdescriptions along with some characteristics of each. A few areas of minorcomponents may not have been observed, and consequently they are notmentioned in the descriptions, especially where the pattern was so complex that itwas impractical to make enough observations to identify all the soils andmiscellaneous areas on the landscape.
The presence of minor components in a map unit in no way diminishes theusefulness or accuracy of the data. The objective of mapping is not to delineatepure taxonomic classes but rather to separate the landscape into landforms orlandform segments that have similar use and management requirements. Thedelineation of such segments on the map provides sufficient information for the
Custom Soil Resource Report
11

development of resource plans. If intensive use of small areas is planned, however,onsite investigation is needed to define and locate the soils and miscellaneousareas.
An identifying symbol precedes the map unit name in the map unit descriptions.Each description includes general facts about the unit and gives important soilproperties and qualities.
Soils that have profiles that are almost alike make up a soil series. Except fordifferences in texture of the surface layer, all the soils of a series have majorhorizons that are similar in composition, thickness, and arrangement.
Soils of one series can differ in texture of the surface layer, slope, stoniness,salinity, degree of erosion, and other characteristics that affect their use. On thebasis of such differences, a soil series is divided into soil phases. Most of the areasshown on the detailed soil maps are phases of soil series. The name of a soil phasecommonly indicates a feature that affects use or management. For example, Alphasilt loam, 0 to 2 percent slopes, is a phase of the Alpha series.
Some map units are made up of two or more major soils or miscellaneous areas.These map units are complexes, associations, or undifferentiated groups.
A complex consists of two or more soils or miscellaneous areas in such an intricatepattern or in such small areas that they cannot be shown separately on the maps.The pattern and proportion of the soils or miscellaneous areas are somewhat similarin all areas. Alpha-Beta complex, 0 to 6 percent slopes, is an example.
An association is made up of two or more geographically associated soils ormiscellaneous areas that are shown as one unit on the maps. Because of presentor anticipated uses of the map units in the survey area, it was not consideredpractical or necessary to map the soils or miscellaneous areas separately. Thepattern and relative proportion of the soils or miscellaneous areas are somewhatsimilar. Alpha-Beta association, 0 to 2 percent slopes, is an example.
An undifferentiated group is made up of two or more soils or miscellaneous areasthat could be mapped individually but are mapped as one unit because similarinterpretations can be made for use and management. The pattern and proportionof the soils or miscellaneous areas in a mapped area are not uniform. An area canbe made up of only one of the major soils or miscellaneous areas, or it can be madeup of all of them. Alpha and Beta soils, 0 to 2 percent slopes, is an example.
Some surveys include miscellaneous areas. Such areas have little or no soilmaterial and support little or no vegetation. Rock outcrop is an example.
Custom Soil Resource Report
12

El Paso County Area, Colorado
71—Pring coarse sandy loam, 3 to 8 percent slopes
Map Unit SettingNational map unit symbol: 369kElevation: 6,800 to 7,600 feetFarmland classification: Not prime farmland
Map Unit CompositionPring and similar soils: 85 percentEstimates are based on observations, descriptions, and transects of the mapunit.
Description of Pring
SettingLandform: HillsLandform position (three-dimensional): Side slopeDown-slope shape: LinearAcross-slope shape: LinearParent material: Arkosic alluvium derived from sedimentary rock
Typical profileA - 0 to 14 inches: coarse sandy loamC - 14 to 60 inches: gravelly sandy loam
Properties and qualitiesSlope: 3 to 8 percentDepth to restrictive feature: More than 80 inchesNatural drainage class: Well drainedRunoff class: LowCapacity of the most limiting layer to transmit water (Ksat): High (2.00 to 6.00
in/hr)Depth to water table: More than 80 inchesFrequency of flooding: NoneFrequency of ponding: NoneAvailable water storage in profile: Low (about 6.0 inches)
Interpretive groupsLand capability classification (irrigated): None specifiedLand capability classification (nonirrigated): 3eHydrologic Soil Group: BEcological site: Loamy Park (R048AY222CO)Hydric soil rating: No
Minor Components
PleasantPercent of map unit: Landform: DepressionsHydric soil rating: Yes
Other soilsPercent of map unit: Hydric soil rating: No
Custom Soil Resource Report
13

92—Tomah-Crowfoot loamy sands, 3 to 8 percent slopes
Map Unit SettingNational map unit symbol: 36b9Elevation: 7,300 to 7,600 feetFarmland classification: Not prime farmland
Map Unit CompositionTomah and similar soils: 50 percentCrowfoot and similar soils: 30 percentEstimates are based on observations, descriptions, and transects of the mapunit.
Description of Tomah
SettingLandform: Alluvial fans, hillsLandform position (three-dimensional): Side slope, crestDown-slope shape: LinearAcross-slope shape: LinearParent material: Alluvium derived from arkose and/or residuum weathered from
arkose
Typical profileA - 0 to 10 inches: loamy sandE - 10 to 22 inches: coarse sandC - 48 to 60 inches: coarse sand
Properties and qualitiesSlope: 3 to 8 percentDepth to restrictive feature: More than 80 inchesNatural drainage class: Well drainedRunoff class: MediumCapacity of the most limiting layer to transmit water (Ksat): Moderately high to
high (0.60 to 2.00 in/hr)Depth to water table: More than 80 inchesFrequency of flooding: NoneFrequency of ponding: NoneAvailable water storage in profile: Very low (about 2.0 inches)
Interpretive groupsLand capability classification (irrigated): None specifiedLand capability classification (nonirrigated): 4eHydrologic Soil Group: BEcological site: Sandy Divide (R049BY216CO)Hydric soil rating: No
Description of Crowfoot
SettingLandform: Alluvial fans, hills
Custom Soil Resource Report
14

Landform position (three-dimensional): Side slope, crestDown-slope shape: LinearAcross-slope shape: LinearParent material: Alluvium
Typical profileA - 0 to 12 inches: loamy sandE - 12 to 23 inches: sandBt - 23 to 36 inches: sandy clay loamC - 36 to 60 inches: coarse sand
Properties and qualitiesSlope: 3 to 8 percentDepth to restrictive feature: More than 80 inchesNatural drainage class: Well drainedRunoff class: MediumCapacity of the most limiting layer to transmit water (Ksat): Moderately high to
high (0.60 to 2.00 in/hr)Depth to water table: More than 80 inchesFrequency of flooding: NoneFrequency of ponding: NoneAvailable water storage in profile: Low (about 4.7 inches)
Interpretive groupsLand capability classification (irrigated): None specifiedLand capability classification (nonirrigated): 4eHydrologic Soil Group: BEcological site: Sandy Divide (R049BY216CO)Hydric soil rating: No
Minor Components
Other soilsPercent of map unit: Hydric soil rating: No
PleasantPercent of map unit: Landform: DepressionsHydric soil rating: Yes
Custom Soil Resource Report
15

T
W
T
E
LOT 3, GREATER EUROPE
MISSION
FLG. NO. 1
(3.2654
AC)
DE
ER
CR
EE
K R
OA
D
(60' R
.O.W
.)
LOT 18A, MONUMENT BUSINESS
TECHNOLOGICAL PARK 3
MO
NU
ME
NT
H
ILL R
OA
D
A PART OF LOT 20A, WOODMOOR BUSINESS
TECHNOLOGICAL PARK FILING NO. 1A
E1
E4
E3
E2
E4
5460
5461
GRAPHIC SCALE
0
1 INCH = FEET
30 30
30
15
NORTH
SHEET
SHEET NUMBER
PROJECT NUMBER
PREPARED FOR:
FAX:
PH:
KELLY DEVELOPMENT SERVICES, LLC9301 SCRUB OAK DR
LONE TREE, CO 80124303-888-6338
CAUTION NOTICE TO CONTRACTORS
T H E C O N T R A C T O R I S S P E C I F I C A L L Y
CAUTIONED THAT THE LOCATION AND/OR
ELEVATION OF EXISTING UTILITIES AS SHOWN
ON THESE PLANS IS BASED ON RECORDS OF
THE VARIOUS UTIL ITY COMPANIES AND,
WHERE POSSIBLE, MEASUREMENTS TAKEN IN THE FIELD. THE INFORMATION IS NOT
TO BE RELIED ON AS BEING EXACT OR COMPLETE. THE CONTRACTOR MUCH CALL 811
AT LEAST 72 HOURS BEFORE ANY EXCAVATION TO REQUEST EXACT FIELD
LOCATIONS OF THE UTILITIES. IT SHALL BE THE RESPONSIBILITY OF THE
CONTRACTOR TO RELOCATED ALL EXISTING UTILITIES WHICH CONFLICT WITH THE
P R O P O S E D I M P R O V E M E N T S S H O W N O N T H E S E P L A N S .
MONUMENT HILL BUSINESS CENTER
1704.01
HOVER ARCHITECTURE
8089 S. LINCOLN ST., SUITE 201
720-773-2801
LITTLETON, CO 80122
LOT 3, GREATER EUROPE MISSION FILING NO. 1
TROY KIRSCHMAN
EL PASO COUNTY, CO
EDP
1 OF 2
EXISTING DRAINAGE PLAN
A
1
"THIS REPORT AND PLAN FOR THE FINAL DRAINAGE DESIGN OF THE SIEVERS BUSINESS
CENTER WAS PREPARED BY ME (OR UNDER MY DIRECT SUPERVISION) IN ACCORDANCE
WITH THE PROVISIONS OF EL PASO COUNTY'S DRAINAGE DESIGN AND TECHNICAL
CRITERIA FOR THE OWNERS THEREOF. I UNDERSTAND THAT EL PASO COUNTY DOES NOT
ASSUME LIABILITY FOR DRAINAGE FACILITIES DESIGNED BY OTHERS."
SIGNATURE: _______________________________________________________
REGISTERED PROFESSIONAL ENGINEER STATE OF COLORADO NO. 15813
11/30/2017

7
1
2
5
7
1
2
5
7
1
2
5
7125
7
1
2
0
7120
7
1
2
0
7121
7120
7
1
1
5
7
1
1
5
7
1
2
0
7
1
2
0
7
1
2
4
7
1
2
3
7
1
2
2
7122
7
1
2
2
7
1
2
2
7
1
2
3
7
1
2
3
7
1
2
4
7
1
2
1
7
1
2
27
1
2
3
7
1
2
1
7119
7
1
1
8
7117
7116
7116
7117
7118
7119
7118
7119
7
1
2
1
7
1
1
8
7
1
1
9
7117
7
1
1
4
7
1
2
1
7127
7128
7
1
2
9
7
1
2
7
7
1
2
4
7
1
2
4
7
1
2
3
7121
7119
7116
7117
7119
7115
7120
T
W
T
E
DE
ER
CR
EE
K R
OA
D
(60' R
.O.W
.)
LOT 18A, MONUMENT BUSINESS
TECHNOLOGICAL PARK 3
MO
NU
ME
NT
H
ILL R
OA
D
A PART OF LOT 20A, WOODMOOR BUSINESS
TECHNOLOGICAL PARK FILING NO. 1A
A
B
C
D
E
F
1
2
3
7
6
OS2
4
5460
5461
GRAPHIC SCALE
0
1 INCH = FEET
30 30
30
15
NORTH
SHEET
SHEET NUMBER
PROJECT NUMBER
PREPARED FOR:
FAX:
PH:
KELLY DEVELOPMENT SERVICES, LLC9301 SCRUB OAK DR
LONE TREE, CO 80124303-888-6338
CAUTION NOTICE TO CONTRACTORS
T H E C O N T R A C T O R I S S P E C I F I C A L L Y
CAUTIONED THAT THE LOCATION AND/OR
ELEVATION OF EXISTING UTILITIES AS SHOWN
ON THESE PLANS IS BASED ON RECORDS OF
THE VARIOUS UTIL ITY COMPANIES AND,
WHERE POSSIBLE, MEASUREMENTS TAKEN IN THE FIELD. THE INFORMATION IS NOT
TO BE RELIED ON AS BEING EXACT OR COMPLETE. THE CONTRACTOR MUCH CALL 811
AT LEAST 72 HOURS BEFORE ANY EXCAVATION TO REQUEST EXACT FIELD
LOCATIONS OF THE UTILITIES. IT SHALL BE THE RESPONSIBILITY OF THE
CONTRACTOR TO RELOCATED ALL EXISTING UTILITIES WHICH CONFLICT WITH THE
P R O P O S E D I M P R O V E M E N T S S H O W N O N T H E S E P L A N S .
MONUMENT HILL BUSINESS CENTER
1704.01
HOVER ARCHITECTURE
8089 S. LINCOLN ST., SUITE 201
720-773-2801
LITTLETON, CO 80122
LOT 3, GREATER EUROPE MISSION FILING NO. 1
TROY KIRSCHMAN
EL PASO COUNTY, CO
FDP
1
FINAL DRAINAGE PLAN
A
1
"THIS REPORT AND PLAN FOR THE FINAL DRAINAGE DESIGN OF THE SIEVERS BUSINESS
CENTER WAS PREPARED BY ME (OR UNDER MY DIRECT SUPERVISION) IN ACCORDANCE
WITH THE PROVISIONS OF EL PASO COUNTY'S DRAINAGE DESIGN AND TECHNICAL
CRITERIA FOR THE OWNERS THEREOF. I UNDERSTAND THAT EL PASO COUNTY DOES NOT
ASSUME LIABILITY FOR DRAINAGE FACILITIES DESIGNED BY OTHERS."
SIGNATURE: _______________________________________________________
REGISTERED PROFESSIONAL ENGINEER STATE OF COLORADO NO. 15813
PCD PROJECT NO. PPR-17-007
11/30/2017