final fort bragg preliminary community impact assessment
TRANSCRIPT

Fort Bragg and Pope Air Force Base Base Realignment and Closure (BRAC)
and Modular Force Transformation
Preliminary Community Impact Assessment
Spencer M. Cowan William M. Rohe
The Center for Urban and Regional Studies
The University of North Carolina at Chapel Hill
August 17, 2006
CURS Report No. 2006-01

EXECUTIVE SUMMARY This study is to provide a preliminary assessment of the impact of personnel changes at Fort Bragg and Pope Air Force Base on the communities surrounding those facilities, with particular emphasis on how those changes may affect the public schools in the eleven surrounding counties. The personnel changes considered include those related to Base Realignment and Closure (BRAC) activities and to the Modular Force Transformation, including both military and civilian personnel. The results of our analysis suggest that most of the impact will occur within the first two years, during FY 2005 - 2006. During that period, there will be substantial increases in the numbers of military personnel living off-base, with most of the impact in Cumberland, Harnett, Hoke, Moore, and Richmond Counties. During FY 2008 – 2009, fewer new military personnel will be coming to the region, and in FY 2010 – 2011 there will be a net loss of military personnel as units are transferred to other locations. However, there will be large influx of new civilian personnel with the arrival of FORSCOM in FY 2010, which will offset the departure of the military personnel. The net result over the last four years of the study period is the loss of about 1,100 military personnel and a gain of just over 1,200 new civilian personnel. Changes to base housing and schools, however, will substantially affect how the public schools are impacted. Base housing in the Cantonment Area is being altered to accommodate larger families, meaning more children of soldiers can live on-base and attend base schools. Housing is also being developed in the Northern Training Area in Harnett County, with the first units available in FY 2007 or 2008, opening additional on-base living opportunities. One elementary school in the Northern Training area has been funded, which will serve some of the children living in the new housing. Funding has been requested for two additional schools in the Northern Training Area. The impact on the schools will be most noticeable in the first two years in the five counties mentioned earlier. In those two years, the changes in personnel are predicted to increase the number of elementary school student by almost 1,200, the number of middle school students by over 600, and the number of high school students by almost 400. After that, with the opening of new housing opportunities on-base and a new base school, the number of elementary school students attributable to the personnel changes will decline by over 300. If the second elementary school is built in the Northern Training Area, the decline will be even greater. The impact on the number of middle school students follows the same pattern of significant growth in the first two years. After that, the impact depends on whether the requested middle school is funded and built. If not, then Harnett County, the site of the new base housing, will experience an influx of over 100 new students a year for the period between FY 2008 and FY 2011. At the high school level, the pattern is the same as for the middle schools, except that no high school is planned for the Northern Training Area, and so the changes are predicted to add between 60 and 90 new high school students per year in Harnett County.

FORT BRAGG AND POPE AIR FORCE BASE PERSONNEL CHANGE PRELIMINARY COMMUNITY IMPACT ASSESSMENT
FOCUS
This study is to provide a preliminary assessment of the impact of personnel changes at Fort
Bragg and Pope Air Force Base on the communities surrounding those facilities, with particular
emphasis on how those changes may affect the public schools in the eleven surrounding
counties. Our analysis of where the new military and civilian personnel1 are projected to live is
at the census tract level to show where the impact will fall within the counties. The personnel
changes considered include those related to Base Realignment and Closure (BRAC) activities
and to the Modular Force Transformation, including both military and civilian personnel. The
impacts of the changes in military and civilian personnel, however, are calculated separately, as
shown in the tables in Appendix A, and then added to obtain the projection for the impact of the
two groups combined.
METHODOLOGY
Data Sources:
This preliminary assessment of the impact of personnel changes at Fort Bragg over the period
from October 1, 2005, through the end of September, 2011, is based upon data updated to May
19, 2006, from the following sources:
$ 1990 and 2000 Decennial Censuses;
$ U. S. Army, Modular Force Integrator, Fort Bragg Garrison;
$ 43rd AW/CCB;
$ Counties participating in the Regional Task Force;
$ Picerne Military Housing; and
$ NC Dependent Domestic Elementary and Secondary School System.
1 The phrase “military personnel” or “civilian personnel” will be used throughout this report to refer to the soldiers or civilians employed at the base who are transferring in or out of the region as part of BRAC or Modular Force Transformation changes. We will use the phrase “military population” or “civilian population” to refer to soldiers or civilians living in the region.

- 2 -
Baseline Distribution:
Since this study is to determine the impact of changes in military and civilian personnel, the first
step was to establish a baseline from which the change could be measured. The baseline is
estimated separately for the military population and the civilian population.
Location of the Military Population Living Off-Base in 2005
While there are many factors which affect a family’s choice of where to live, one key indicator
for members of the military is the presence of other members of the military in the vicinity. The
choice of this indicator is based on three lines of reasoning.
1. Soldiers, like most people, will have a preference for associating with people with whom
they have common interests, activities, or personal attributes. The military has a
distinctive culture and norms which distinguish those who volunteer and remain on active
duty from members of the broader society. The presence of soldiers in a neighborhood
would provide a family with ready access to people with whom they have something
distinctive in common.
2. The presence of soldiers in an area suggests that the services, employment opportunities,
schools, and mutual support networks that military families need and want are available
in the area.
3. The presence of substantial numbers of soldiers in limited geographic areas around Fort
Bragg, Pope Air Force Base, and Camp Mackall suggest that housing in those areas is
affordable for families earning military pay and that transportation from those areas to the
bases is convenient for the military population who choose to live there.
Using Decennial Census data from 1990 and 2000, we determined the active duty military
population living in each census tract for the eleven counties that are part of the Base
Realignment and Closure (BRAC) Regional Task Force: Bladen, Cumberland, Harnett, Hoke,
Lee, Montgomery, Moore, Richmond, Robeson, Sampson, and Scotland. We adjusted the data

- 3 -
for Cumberland County to exclude from our calculations the military population living on-base
at Fort Bragg and Pope Air Force Base.
From those data, we determined how the military population in each county and census tract had
changed over the period between the censuses. Knowing how the off-base military population
had changed over time allowed us to estimate the military population living in each tract in 2005
using four different approaches.
1. The first method was to take the total change in the active duty military population in the
census tract and divide it by ten, the number of years between the two data points. This
gave us a linear estimate of the average annual increase in the military population in the
tract. We then projected forward five years, using the average annual change, to estimate
the military population in the Tract as of 2005. This assumes that the military population
increases/decreases steadily in each census tract.
2. The second method was also a linear estimate, similar to the first, except that the data
were aggregated at the county level, to determine the average annual change in the active
duty military population living in the county. For each census tract, we calculated the
percentage of the military population in the county that resided in the tract in 2000, and
added or subtracted, as appropriate, that percentage of the county change over a five year
period to the tract. This assumes that the military population increases/decreases steadily
in each county, with the increase/decrease allocated to each tract in proportion to its
percentage of the county military population in 2000.
3. The third method was based on the exponential change in the military population in the
county between 1990 and 2000, calculated on an annual basis. The military population in
each tract was then projected forward five years using that annual exponential rate of
change. This assumes that the rate of growth of the military population in each county is
steady over the period, with the rate of growth applied to the military population in the
tract as of 2000.
- 4 -
4. The fourth method is based on the trend in the distribution of the military population
among the counties. Each county’s percentage of the military population living off-base
was determined for 1990 and 2000. The difference between the two was then divided by
10 to produce the average annual change in each county’s percent of the off-base military
population. We projected that trend forward to 2005, and then allocated the change in
military population to each county in proportion to the linear projection of its share of the
regional military population in 2005. This assumes that the growth in off-base military
population will follow the existing trends of preferences among the counties in the
region.
Because of the mathematical differences between linear and an exponential models, the
exponential model will always lead to larger differences between projections over time than the
linear model. We averaged the four estimates to project the distribution of the military
population living in each census tract off-base. The projection of the military population in each
census tract produced a total off-base military population of 25,105. From statistics obtained
from the Public Affairs Office2, we knew that 31,498 soldiers assigned to Fort Bragg lived off-
base in 2005, and so we multiplied the projections we derived for each census tract by the ratio
of 31,498/25,105 to obtain the final estimate of where the military population was living off-base
in 2005, as shown in Table 1.3
2 (http://www.bragg.army.mil/pao/FY%2005%20stats.html)
3 The distribution in 2005 by census tract is shown in Table 1 in Appendix A and on Map 1 in Appendix B.

- 5 -
Table 1 - Military Population Living Off-base County 1990 2000 2005 (Est.)
Bladen 42 (0.18%) 24 (0.10%) 28 (0.09%)
Cumberland (total) 43,265 36,572
Fort Bragg (22,822) (17,963)
Cumberland (off-base) 20,443 (88.28%) 18,609 (77.83%) 22,243 (70.62%)
Harnett 1,625 (7.02%) 2,417 (10.11%) 3,588 (11.39%)
Hoke 319 (1.38%) 1,478 (6.18%) 3,052 (9.69%)
Lee 128 (0.55%) 201 (0.84%) 304 (0.97%)
Montgomery 12 (0.05%) 14 (0.06%) 21 (0.07%)
Moore 214 (0.92%) 550 (2.30%) 969 (3.08%)
Richmond 44 (0.19%) 438 (1.83%) 1,113 (3.53%)
Robeson 170 (0.73%) 77 (0.32%) 69 (0.22%)
Sampson 128 (0.55%) 59 (0.25%) 46 (0.15%)
Scotland 32 (0.14%) 42 (0.18%) 65 (0.21%)
Total 23,157 23,909 31,498
Location of the Civilian Population in 2005
The Census Bureau publishes an estimate for the population of every county in the region, and so
that is what we used as the basis for the distribution of the civilian population in 2005. For the
civilian population in each census tract, we based our estimates on the change in the tract
population between 1990 and 2000, using the same four methods that we used for the estimate
of military personnel, averaging the four to produce the final estimate. To obtain the civilian
population, we subtracted the combined average projected military population for the county
from the county population estimate. For Cumberland County, we also subtracted the estimated
military population residing on-base at Fort Bragg, calculated as the military population in
Census tract 34 plus the change in the military population at Fort Bragg between 2000 and 2005.
We used the Census Bureau estimates as the limit for the 2005 county population, adjusting the
tract estimates derived from each method by the ratio between the county population that our
estimate produced and the official estimate so that the sum of the tract populations was equal to

- 6 -
the Census Bureau estimate for the county regardless of the method used. This is similar to the
adjustment for the off-base military population, except that the estimate for the latter was based
on the entire region and not separately for each county.
Projected Annual Change in Personnel (FY 2006 - FY 2011):
Having estimated where the military population and the civilian population were living in 2005,
the next step was to determine the personnel changes to be expected over the coming years. That
determination, by fiscal year, is based on data provided by the Modular Force Integrator, Fort
Bragg Garrison, and the 43rd AW/CCB, updated to May 19, 2006. The staffing levels for each
Army unit affected by the BRAC activities and/or the Transformation to Modular Force were
listed for each year, and the changes in total staffing for each fiscal year was then calculated for
both military and civilian personnel. For the units at Pope Air Force Base, the data indicated the
baseline level of staffing in FY 2005 and the staffing at the end of FY 2010, when all BRAC-
related changes are required to be completed. To estimate the changes in personnel at Pope Air
Force Base for the period between those two data points, we used a linear interpolation over a
three-year period. The resulting estimates account for the probability that some personnel will
transfer out before the FY 2010 deadline. The projected changes in personnel are shown in
Table 2, with negative numbers indicating that more personnel are transferring out of the region
than are being transferred in.4
Table 2 - Projected Changes in Personnel FY 2006 FY 2007 FY 2008 FY 2009 FY 2010 FY 2011 Total
Military 2,856 935 306 310 (817) (945) 2,644
Civilian 84 377 (13) (44) 1,292 26 1,722
Total 2,940 1,312 293 266 475 (919) 4,366
4 The figures in this and all the succeeding tables are rounded to the nearest integer, and so the totals may not equal the sum of the annual figures.

- 7 -
Projected Number and Location of New Personnel Living Off-Base:
New Military Personnel
The next step in the analysis was to determine the probable locations in which the relocated
personnel were apt to reside. The projections are based on the same assumptions about the
residential preferences of members of the military that we used to estimate the baseline
distribution of the military population living off-base in 2005.
To project the change in the military population in each census tract for FY 2006, we used three
of the estimates for 2005, the ones based on the linear change in the military population in the
tract and on the linear and exponential change in the military population in the county, as starting
points. Using the three different estimates, we calculated what each tract’s percentage of the
regional military population living off-base would be. We then allocated the overall change in
military personnel for 2006 to each census tract based on the tract’s percentage of the regional
military population living off-base. That gave us three different projections for the military
population in the tract, reflecting the variation resulting from the different methods used to
generate the initial estimates.
We also projected the tract’s allocation of incoming military personnel based on the average
annual change in the county’s percentage of the regional military population. We calculated the
county’s percentage of the regional military population living off-base, based on the final
estimate for 2005. We then calculated the average annual change in the county’s percentage of
the regional military population living off-base, based on the change from the 2000 Decennial
Census to the final average estimate for 2005, and added that to the percentage estimated for
2005. The change in military personnel for 2006 was then allocated to each county in proportion
to its estimated percentage of the regional military population living off-base in 2006, and that
share was allocated to each tract in proportion to its share of the county’s military population.
The final projection of the military population in each tract in 2006 is the average of the four
projections. For each succeeding year, we repeated the process outlined above, using the prior
year’s projections as the starting figure, to produce our projections for the change in the number

- 8 -
of military personnel living in each county, as shown in Table 3.5 The table shows the influx of
military personnel occurring between FY 2006 and FY 2009, followed by an out-migration of
military personnel as units are transferred to other bases.
Table 3 - Projected Location of New Military Personnel Living Off-Base County FY 2006 FY 2007 FY 2008 FY 2009 FY 2010 FY 2011 Total
Bladen 3 1 0 0 (1) (1) 2
Cumberland 2,009 663 220 219 (559) (658) 1,894
Harnett 327 106 34 35 (97) (110) 297
Hoke 280 89 27 30 (88) (96) 243
Lee 28 9 3 3 (8) (9) 25
Montgomery 2 1 0 0 (1) (1) 2
Moore 89 29 9 10 (27) (30) 79
Richmond 102 32 10 11 (33) (35) 86
Robeson 6 2 1 1 (2) (2) 6
Sampson 4 1 0 0 (1) (1) 4
Scotland 6 2 1 1 (2) (2) 5
Total 2,856 935 306 310 (817) (945) 2,644
Project the Probable Choice of Residential Location for the New Civilian Personnel
We did not have data on where civilians who work at the two bases reside, and so we could not
use an allocation method similar to that for the military personnel who are separately accounted
for in the decennial census data. Instead, we used an allocation based on the commuting times
reported in the 2000 Decennial Census. Over 80 percent of all workers over the age of 16 in the
eleven county region report commuting less than 34 minutes to work. Allowing about 5 minutes
to clear security and travel on-base to his/her place of work, and using an average off-base travel
speed of 40 miles per hour, we estimated that about 80 percent of the civilian personnel would
5 Tract level data are in Table 2 in Appendix A, with the total change shown on Map 2 in Appendix B.

- 9 -
live within 20 miles of the base. Therefore, we allocated 80 percent of the change in the civilian
personnel to census tracts that were within that 20 mile distance, with the remaining 20 percent
allocated to tracts outside of that distance.
As with the allocation of military personnel, we used the three estimates, one based on the linear
rate of change in the tract civilian population, one based on the linear rate of change in the
county population, and one based on the exponential rate of growth in the county population.
The final estimate of the change in the civilian population in each tract resulting from the
changes in civilian personnel at the two bases is the average of the three estimates, as shown in
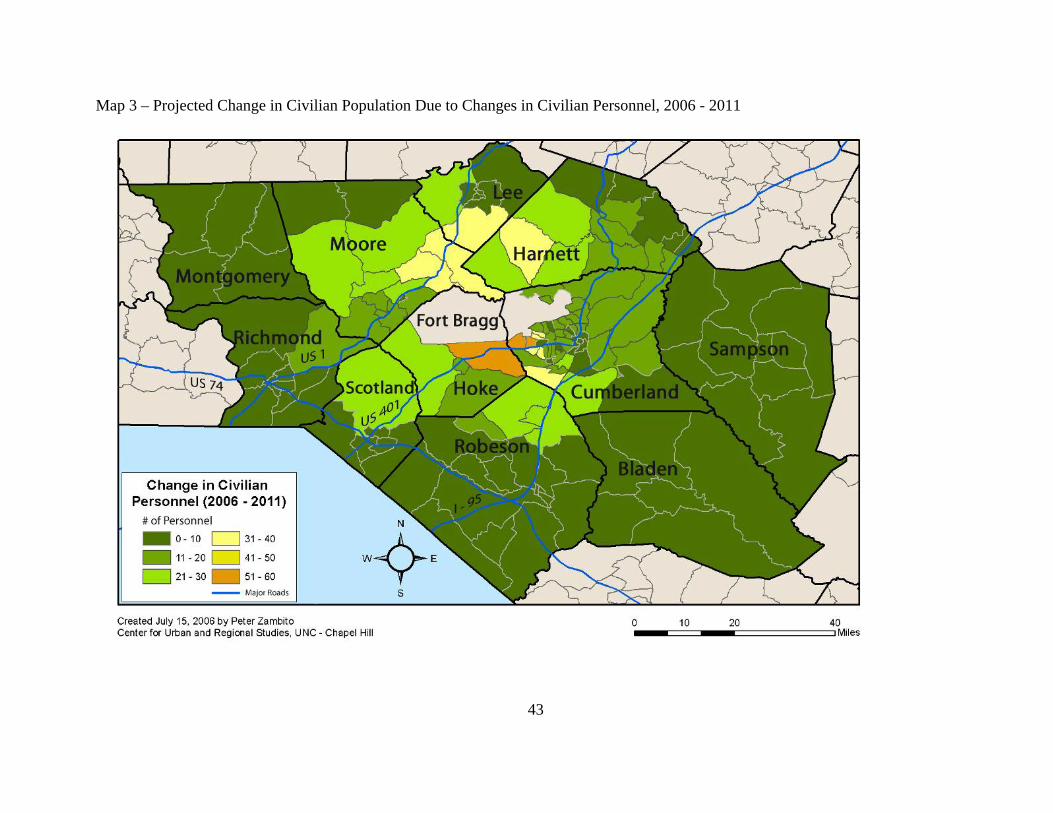
Table 4.6 The combined total, both military and civilian personnel, is shown on Table 5.7
Table 4 - Projected Location of New Civilian PersonnelCounty FY 2006 FY 2007 FY 2008 FY 2009 FY 2010 FY 2011 Total
Bladen 1 6 (0) (1) 22 0 29
Cumberland 36 160 (6) (19) 547 11 729
Harnett 11 48 (2) (6) 163 3 217
Hoke 5 24 (1) (3) 83 2 110
Lee 4 19 (1) (2) 67 1 89
Montgomery 1 5 (0) (1) 18 0 24
Moore 10 46 (2) (5) 159 3 212
Richmond 2 10 (0) (1) 36 1 47
Robeson 8 35 (1) (4) 121 2 162
Sampson 3 12 (0) (1) 41 1 55
Scotland 2 11 (0) (1) 36 1 48
Total 84 377 (13) (44) 1,292 26 1,722
6 Tract level data are in Table 3 in Appendix A, with the total change shown on Map 3 in Appendix B.
7 Tract level data are in Table 4 in Appendix A, with the total change shown on Map 4 in Appendix B.

- 10 -
Table 5 - Projected Location of New Civilian Personnel and Military Personnel Living Off-BaseCounty FY 2006 FY 2007 FY 2008 FY 2009 FY 2010 FY 2011 Total
Bladen 4 7 0 (0) 21 (0) 31
Cumberland 2,045 822 215 200 (11) (647) 2,624
Harnett 338 154 33 30 66 (106) 514
Hoke 286 113 27 27 (5) (94) 353
Lee 32 28 2 1 59 (8) 114
Montgomery 3 6 0 (0) 17 (0) 26
Moore 99 75 7 4 132 (27) 290
Richmond 105 43 9 10 2 (35) 134
Robeson 14 37 (1) (3) 120 1 168
Sampson 7 13 0 (1) 40 (0) 59
Scotland 8 13 0 (1) 35 (1) 54
Total 2,940 1,312 293 266 475 (919) 4,366
Projection of the Impact of Personnel Changes on School Enrollment:
Estimating the Number of Dependents and School-Age Children
Using the projections of new military and civilian personnel for FY 2006 through FY 2011, we
used the Army formulas, listed below, to calculate the numbers of dependents, children, and
school-age children for each year.8 The formulas for soldiers and civilians are:
Number of Soldiers From our calculations
Number of Family Members Number of Soldiers times 1.8
Number of Soldiers with Children Number of Soldiers times 0.48
Number of Children Number of Soldiers with Children times 1.6
Number of School-age Children Number of Children times 0.63
Number of Civilians From our calculations
Number of Family Members Number of Civilians times 2.0
8 The formulas are from the School Transition Workbook: Communities Preparing for Major Army Moves, developed by the U. S. Army Community and Family Support Center, and were used in a presentation to the BRAC Regional Task Force on April 27, 2006.

- 11 -
Number of Civilians with Children Number of civilians times 0.80
Number of Children Number of Civilians with Children times 1.5
Number of School-age Children Number of Children times 0.75
Using those formulas, we arrived at an initial projection how the changes in personnel at Fort
Bragg and Pope Air Force Base would affect the population in each county, including the new
personnel and their dependents, as shown in Table 6. We then projected the change in the
number of school-age children in each county, including the children of military personnel living
off-base and the additional civilian personnel coming to work at the bases. That projection is a
preliminary estimate of the number of additional children who would potentially attend the
public schools in each county and reflects what the situation would be in the absence of any
change in the availability of housing at Fort Bragg, as shown in Table 6.
Table 6 - Preliminary Projected Number of Children of Military and Civilian Personnel County FY 2006 FY 2007 FY 2008 FY 2009 FY 2010 FY 2011 Total
Bladen 4 8 (0) (1) 25 (0) 36
Cumberland 1,586 701 162 146 228 (492) 2,330
Harnett 264 139 24 20 121 (80) 489
Hoke 222 98 20 20 32 (72) 319
Lee 27 30 1 (0) 74 (6) 126
Montgomery 3 7 (0) (1) 21 (0) 30
Moore 81 78 5 1 170 (19) 314
Richmond 81 37 7 7 17 (26) 123
Robeson 14 44 (1) (4) 145 1 199
Sampson 6 15 (0) (1) 49 0 69
Scotland 7 14 0 (1) 42 (1) 62
Total 2,294 1,170 219 185 923 (695) 4,097
Projected Changes to Base Housing
The amount of base housing, however, is projected to increase by the end of FY 2011, and so the
projections must be adjusted to reflect those changes. There are two major changes underway or
- 12 -
anticipated, and they will have a substantial impact on the number of school-age children who
may attend the public schools. The changes to base housing through the end of the entire project
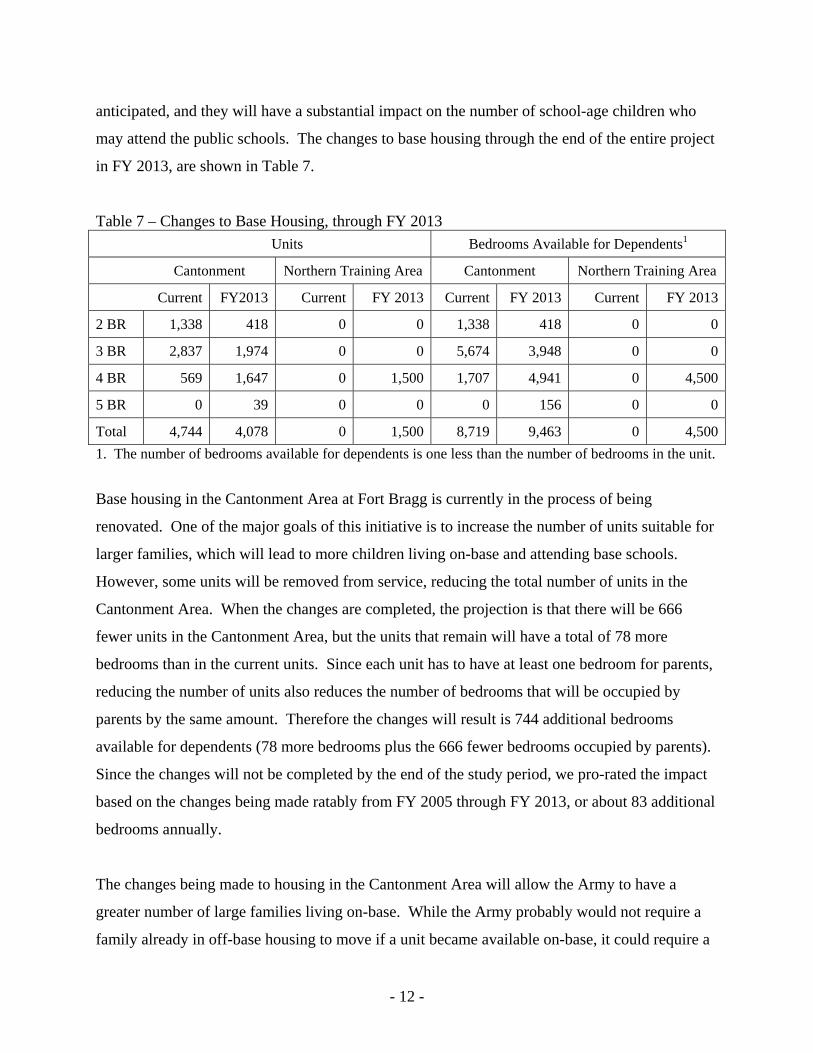
in FY 2013, are shown in Table 7.
Table 7 – Changes to Base Housing, through FY 2013 Units Bedrooms Available for Dependents1
Cantonment Northern Training Area Cantonment Northern Training Area
Current FY2013 Current FY 2013 Current FY 2013 Current FY 2013
2 BR 1,338 418 0 0 1,338 418 0 0
3 BR 2,837 1,974 0 0 5,674 3,948 0 0
4 BR 569 1,647 0 1,500 1,707 4,941 0 4,500
5 BR 0 39 0 0 0 156 0 0
Total 4,744 4,078 0 1,500 8,719 9,463 0 4,5001. The number of bedrooms available for dependents is one less than the number of bedrooms in the unit.
Base housing in the Cantonment Area at Fort Bragg is currently in the process of being
renovated. One of the major goals of this initiative is to increase the number of units suitable for
larger families, which will lead to more children living on-base and attending base schools.
However, some units will be removed from service, reducing the total number of units in the
Cantonment Area. When the changes are completed, the projection is that there will be 666
fewer units in the Cantonment Area, but the units that remain will have a total of 78 more
bedrooms than in the current units. Since each unit has to have at least one bedroom for parents,
reducing the number of units also reduces the number of bedrooms that will be occupied by
parents by the same amount. Therefore the changes will result is 744 additional bedrooms
available for dependents (78 more bedrooms plus the 666 fewer bedrooms occupied by parents).
Since the changes will not be completed by the end of the study period, we pro-rated the impact
based on the changes being made ratably from FY 2005 through FY 2013, or about 83 additional
bedrooms annually.
The changes being made to housing in the Cantonment Area will allow the Army to have a
greater number of large families living on-base. While the Army probably would not require a
family already in off-base housing to move if a unit became available on-base, it could require a

- 13 -
soldier with a large family transferring to the base to live in base housing. That would have the
same effect of reducing the number of children of soldiers living off-base. It will also make it
possible for more children of soldiers to attend the elementary and middle schools already
operating at Fort Bragg.
More significantly, the Army is beginning the process of developing new housing in the
Northern Training Area, in Harnett County. The plan is to build 1,500 units with a total of 6,000
bedrooms, beginning in FY 2007, with the first units becoming available late that year or in FY
2008. The project is expected to be completed in FY 2013, with units being completed at a
relatively steady rate over the life of the project, about 250 units with 750 dependent bedrooms
per year, which means that 1,000 of the units with 3,000 dependent bedrooms will become
available during the study period. As with the Cantonment Area, the Army probably will not
require families already living off-base to move to the new units in the Northern Training Area,
but it will make soldiers transferring into the base live in an on-base unit if one is available.
In estimating the impact of the changes in on-base housing, we assumed that, on average, each
dependent bedroom will be occupied by one child. The Army uses a formula to determine the
actual number of bedrooms for each family, depending on the ages and genders of the children.
Some children get a room to themselves, while others may share a bedroom with a sibling, and
some bedrooms might be temporarily vacant or occupied by a dependent who is not a child. At
present, there is an average of 1.97 children per unit, or about 9,300 children, living in base
housing. Since there are 8,719 bedrooms available for dependents in the housing as currently
configured, as shown in Table 7, the assumption of one child per bedroom is consistent with
existing usage.
To adjust for those changes, we allocated 83 children of soldiers per year to base housing in the
Cantonment Area to Cumberland County and 750 children of soldiers who will be able to live in
the new housing in the Northern Training Area to Harnett County. We assumed that the number
of children of soldiers living in the other counties would be reduced in proportion to their share
of the projected number of additional children of soldiers living off-base. The results of the
allocation are shown in Table 8 (on-base) Table 9 (off-base) and Table10 (combined).

- 14 -
Table 8 - Change in the Number of Children of Military Personnel, On-Base County FY 2006 FY 2007 FY 2008 FY 2009 FY 2010 FY 2011 Total
Bladen 0 0 0 0 0 0 0
Cumberland 83 83 83 83 83 83 496
Harnett 0 0 750 750 750 750 3,000
Hoke 0 0 0 0 0 0 0
Lee 0 0 0 0 0 0 0
Montgomery 0 0 0 0 0 0 0
Moore 0 0 0 0 0 0 0
Richmond 0 0 0 0 0 0 0
Robeson 0 0 0 0 0 0 0
Sampson 0 0 0 0 0 0 0
Scotland 0 0 0 0 0 0 0
Total 83 83 833 833 833 833 3,496
Table 9 - Change in the Number of Children of Military Personnel, Off-Base County FY 2006 FY 2007 FY 2008 FY 2009 FY 2010 FY 2011 Total
Bladen 2 1 (1) (1) (1) (1) (1)
Cumberland 1,485 450 (431) (420) (998) (1,085) (999)
Harnett 242 72 (67) (68) (173) (181) (174)
Hoke 207 61 (54) (57) (157) (158) (159)
Lee 21 6 (6) (6) (15) (15) (15)
Montgomery 1 0 (0) (0) (1) (1) (1)
Moore 66 19 (18) (18) (49) (50) (49)
Richmond 76 22 (19) (21) (59) (58) (60)
Robeson 4 1 (1) (1) (3) (3) (3)
Sampson 3 1 (1) (1) (2) (2) (2)
Scotland 4 1 (1) (1) (3) (3) (3)
Total 2,111 635 (598) (595) (1,460) (1,558) (1,465)

- 15 -
Table 10 - Change in the Number of Children of Military Personnel, On- and Off-Base County FY 2006 FY 2007 FY 2008 FY 2009 FY 2010 FY 2011 Total
Bladen 2 1 (1) (1) (1) (1) (1)
Cumberland 1,567 533 (348) (338) (915) (1,002) (503)
Harnett 242 72 683 682 577 569 2,826
Hoke 207 61 (54) (57) (157) (158) (159)
Lee 21 6 (6) (6) (15) (15) (15)
Montgomery 1 0 (0) (0) (1) (1) (1)
Moore 66 19 (18) (18) (49) (50) (49)
Richmond 76 22 (19) (21) (59) (58) (60)
Robeson 4 1 (1) (1) (3) (3) (3)
Sampson 3 1 (1) (1) (2) (2) (2)
Scotland 4 1 (1) (1) (3) (3) (3)
Total 2,193 718 235 238 (628) (726) 2,031
Having adjusted the additional number of children of soldiers in each county to account for
changes in base housing, we then added the projection to the projection for the children of the
new civilians to obtain the adjusted estimate of where the additional children will live within in
the region. Table 11 shows the projected number of additional children of soldiers and civilians
living in each county as a result of the personnel changes at Fort Bragg and Pope Air Force Base,
adjusted for the changes in base housing. The most significant difference is the large increase in
the number of children in Harnett County because of the additional base housing in the Northern
Training Area.

- 16 -
Table 11 - Change in the Number of Children of Military and Civilian Personnel, Adjusted for Changes in Base Housing County FY 2006 FY 2007 FY 2008 FY 2009 FY 2010 FY 2011 Total
Bladen 4 8 (1) (1) 25 (1) 33
Cumberland 1,610 725 (355) (360) (259) (989) 372
Harnett 255 129 681 675 773 573 3,087
Hoke 214 90 (55) (61) (58) (156) (27)
Lee 26 29 (6) (8) 65 (14) 92
Montgomery 3 7 (1) (1) 20 (1) 28
Moore 78 75 (19) (25) 142 (46) 205
Richmond 78 34 (19) (22) (17) (58) (3)
Robeson 14 44 (3) (6) 143 (0) 192
Sampson 6 15 (1) (3) 48 (1) 64
Scotland 7 14 (2) (3) 40 (2) 55
Total 2,294 1,170 219 185 923 (695) 4,097
Distribution by School Level and the Differences in Personnel
Table 11 shows the total number of additional children, not just school-age children, projected
for each county, living both on- and off-base. Based on Army formulas, only 63 percent of the
children of soldiers and 75 percent of the children of civilians are school-age. Of the 90
additional children projected for Hoke County in FY 2007, 61 are children of soldiers, and 29 are
children of civilians. Using the Army formulas, that means that there will be 60 additional
school-age children among those 90.
We then allocated the additional school-age children among the levels of schools which they
would attend. The standard Army formula projects 55 percent of the school-age children will be
in elementary school, 28 percent in middle school, and 17 percent in high school.9 We have used
the formula although differences in the types of personnel coming to Fort Bragg over the study
9 The formulas are from the School Transition Workbook: Communities Preparing for Major Army Moves, developed by the U. S. Army Community and Family Support Center, and were used in a presentation to the BRAC Regional Task Force on April 27, 2006.

- 17 -
period, based on data provided by the Modular Force Integrator, Fort Bragg Garrison, suggest
that the distribution may deviate from that formula. For FY 2006 and 2007, about 71 percent of
the soldiers coming to Fort Bragg will be junior enlisted (pay grades E3 to E5) and about 10
percent will be junior commissioned officers (pay grades O1 to O3). Since people in those pay
grades tend to be younger, their children may also be younger than average, resulting in a higher
percentage attending elementary schools. For FY 2010, the year FORSCOM is projected to
arrive, the situation may be reversed. The average age of the people expected with FORSCOM
is 54, and so their children should be expected to be older than average, which may increase the
percentage attending high school. Tables 12 through 14 show the total number of additional
students in elementary, middle, and high school, living off-base, while Tables 15 through 17
show the number living on-base in Cumberland and Harnett Counties.
Table 12 - Projected Change in the Number of Elementary School Students Living Off-Base County FY 2006 FY 2007 FY 2008 FY 2009 FY 2010 FY 2011 Total
Bladen 1 3 (0) (1) 10 (0) 14
Cumberland 532 235 (152) (155) (75) (370) 15
Harnett 89 49 (24) (26) 21 (61) 47
Hoke 74 33 (19) (21) (14) (54) (1)
Lee 9 12 (2) (3) 28 (5) 39
Montgomery 1 3 (0) (0) 8 (0) 11
Moore 28 30 (7) (9) 62 (16) 88
Richmond 27 13 (7) (8) (3) (20) 3
Robeson 5 18 (1) (2) 59 0 79
Sampson 2 6 (1) (1) 20 (0) 27
Scotland 3 6 (1) (1) 17 (1) 23
Total 773 407 (214) (228) 134 (527) 345

- 18 -
Table 13 - Projected Change in the Number of Middle School Students Living Off-Base County FY 2006 FY 2007 FY 2008 FY 2009 FY 2010 FY 2011 Total
Bladen 1 2 (0) (0) 5 (0) 7
Cumberland 271 120 (77) (79) (38) (189) 8
Harnett 45 25 (12) (13) 11 (31) 24
Hoke 38 17 (10) (11) (7) (28) (0)
Lee 5 6 (1) (2) 14 (2) 20
Montgomery 1 1 (0) (0) 4 (0) 6
Moore 14 15 (3) (5) 31 (8) 45
Richmond 14 6 (3) (4) (1) (10) 1
Robeson 3 9 (1) (1) 30 0 40
Sampson 1 3 (0) (1) 10 (0) 14
Scotland 1 3 (0) (1) 9 (0) 12
Total 394 207 (109) (116) 68 (268) 175
Table 14 - Projected Change in the Number of High School Students Living Off-Base County FY 2006 FY 2007 FY 2008 FY 2009 FY 2010 FY 2011 Total
Bladen 0 1 (0) (0) 3 (0) 4
Cumberland 164 73 (47) (48) (23) (114) 5
Harnett 28 15 (7) (8) 6 (19) 15
Hoke 23 10 (6) (7) (4) (17) (0)
Lee 3 4 (1) (1) 9 (1) 12
Montgomery 0 1 (0) (0) 3 (0) 4
Moore 9 9 (2) (3) 19 (5) 27
Richmond 8 4 (2) (2) (1) (6) 1
Robeson 2 6 (0) (1) 18 0 24
Sampson 1 2 (0) (0) 6 (0) 8
Scotland 1 2 (0) (0) 5 (0) 7
Total 239 126 (66) (70) 41 (163) 107

- 19 -
Table 15 - Projected Change in the Number of Elementary School Students Living On-Base County FY 2006 FY 2007 FY 2008 FY 2009 FY 2010 FY 2011 Total
Cumberland 29 29 29 29 29 29 172
Harnett 0 0 260 260 260 260 1,040
Total 29 29 289 289 289 289 1,212
Table 16 - Projected Change in the Number of Middle School Students Living On-Base County FY 2006 FY 2007 FY 2008 FY 2009 FY 2010 FY 2011 Total
Cumberland 15 15 15 15 15 15 87
Harnett 0 0 132 132 132 132 529
Total 15 15 147 147 147 147 617
Table 17 - Projected Change in the Number of High School Students Living On-Base County FY 2006 FY 2007 FY 2008 FY 2009 FY 2010 FY 2011 Total
Cumberland 9 9 9 9 9 9 53
Harnett 0 0 80 80 80 80 321
Total 9 9 89 89 89 89 374
The Impact of Base Schools
The Army operates seven elementary, one middle, and one junior high school at Fort Bragg to
serve children living in the Cantonment Area. Those schools have a combined capacity of about
3,380 elementary school students and 1,340 middle/junior high school students. Most of the
high school students living in the Cantonment Area attend Cumberland County public schools,
although some may attend private schools or be home-schooled. In addition, the Army is
building a new elementary school in the Northern Training Area, and it should be completed
about the same time as the first housing units. The Army has also requested funding for an
additional elementary and middle school for the Northern Training Area, and that request is still
pending.
The assessment of impact on the elementary and middle schools depends on whether the Fort
Bragg schools are able to accommodate the additional students living on-base. The numbers of

- 20 -
students projected to live in the Cantonment Area is relatively small, representing about 5 to 6
percent of the capacity of the existing base schools. Therefore, it is reasonable to assume that
those students will attend the base schools and not Cumberland County schools.
The situation in Harnett County is not as certain for two reasons. First, the numbers of students
projected to live in the Northern Training Area is significantly larger, over 30 percent of the
existing elementary school capacity, and nearly 40 percent of the existing middle/junior high
school capacity. Second, only one elementary school has been funded and is under construction
in the Northern Training Area. For elementary school students, the new school should be able to
handle the influx of students through FY 2009, at least, allowing time for the funding and
construction of a second elementary school for students arriving in FY 2010 and FY 2011. If the
second elementary school is not built, however, either Harnett County or the Fort Bragg schools
would need to accommodate some of the additional students arriving in those later years.
The situation for middle school students moving to the Northern Training Area is not as clear.
Each year, starting in FY 2008, we project an additional 132 middle school students in that new
housing, about 10 percent of the capacity of the existing base schools. There is, at present, no
funding for a new middle school, which means that it is possible that there will not be one built
in time to serve the first of the new students. If not, then those students will either have to be
transported to the existing Fort Bragg schools or will attend Harnett County schools. As Table
14 shows, the number of additional middle school students will increase substantially over time,
with a total of over 500 new middle school students projected by the end of FY 2011, and the
difficulty of meeting their needs without new or enlarged facilities will also increase.
There is no high school on-base, nor are there plans to build one. Most high school students
living on-base now attend school in Cumberland County, and, for those moving to the
Cantonment Area, that will probably continue to be true. Harnett County public schools will
probably serve most of the new high school students living in the Northern Training Area.
Based on the projections in Table 15, there will be about 80 additional high school students a
year living on-base, beginning in FY 2008, reaching a total of over 300 students by the end of
FY 2011.

- 21 -
Additional Impacts and Considerations:
This analysis only covers the projected impact of the changes on the schools in the region from
the personnel changes at the two bases. Those personnel changes, however, will not be the only
ones that result from the BRAC activities and the Modular Force Transformation. The most
obvious impact will be in the numbers of dependents who come with the new personnel. The
4,366 military and civilian personnel who are moving to the region will bring with them an
additional 8,200 dependents.10
There will also be indirect impacts. The families moving to the base will generate additional
demand for goods and services, resulting in indirect job creation. Those new businesses will, in
turn, purchase additional goods from suppliers in the region, inducing the creation of additional
jobs. Those are relatively permanent impacts. In addition, there will be temporary impacts, such
as the influx of construction workers to build new facilities on- and off-base, including the
housing in the Northern Transition Area and surrounding communities for all of the new
personnel.
Without more study, it is not possible to provide an accurate estimate of the multiplier effect that
the changes may have. The Department of Defense projected that an increase of 4,078 military
and 247 civilian jobs at Fort Bragg would result in an indirect increase of 2,915 additional jobs, a
multiplier of 0.67, while the loss of 4,821 military and 132 mission contractor jobs and gain of
808 civilian jobs at Pope Air Force Base would result in the indirect loss of 2,657 jobs, for a
multiplier of 0.64. Based on those estimates, the impacts on the schools could be about two-
thirds again what we have projected. The impact on schools may be even larger because the
indirect and induced jobs would be filled by civilians, and the Army formulas indicate that
civilians have almost twice as many school-age children as soldiers.11 Also, those children
would not live in base housing, meaning they would not attend base schools.
10 On average, each soldier will have 1.8 dependents, and each civilian will have 2.0 dependents.
11 For every 100 soldiers, 48 have children; those 48 soldiers have an average of 1.6 children (48 x 1.6 = 76.8); of those children, 48 are school-age (76.8 x 0.63 –48). For every 100

- 22 -
The additional families moving into the region will also impact more than the schools. For
example, they will drive cars, and so traffic should increase. They will participate in youth
sports, and so demand for playing fields and other recreational facilities will increase. They will
help with community services, and so more people will be available to bring meals to the elderly
or volunteer in the schools. What those other impacts will be is beyond the scope of this
preliminary report and will require further study to anticipate.
civilians, 80 have children; those 80 civilians have an average of 1.5 children (80 x 1.5 = 120); of those children, 90 are school-age (120 x 0.75 = 90).

23
APPENDIX A Table 1 – Military Population Living Off-Base, Estimate for 2005 Bladen County Cumberland County Census Tract 9501 5 Census Tract 27 78 Census Tract 9502 0 Census Tract 28 60 Census Tract 9503 0 Census Tract 29 43 Census Tract 9504 0 Census Tract 30 100 Census Tract 9505 0 Census Tract 31 879 Census Tract 9506 23 Census Tract 32.01 706 Census Tract 32.02 1,129 Cumberland County Census Tract 32.03 516 Census Tract 1 0 Census Tract 33.01 2,556 Census Tract 2 17 Census Tract 33.02 267 Census Tract 4 0 Census Tract 33.03 2,679 Census Tract 5 74 Census Tract 33.04 992 Census Tract 6 558 Census Tract 33.05 999 Census Tract 7 345 Census Tract 34 Fort BraggCensus Tract 8 126 Census Tract 35 833 Census Tract 9 331 Census Tract 36 559 Census Tract 10 25 Census Tract 37 396 Census Tract 11 15 Census Tract 12 203 Harnett County Census Tract 13 17 Census Tract 701 10 Census Tract 14 85 Census Tract 702 6 Census Tract 15 48 Census Tract 703 21 Census Tract 16.01 335 Census Tract 704 10 Census Tract 16.02 629 Census Tract 705 0 Census Tract 17 334 Census Tract 706 234 Census Tract 18 77 Census Tract 707 112 Census Tract 19.01 228 Census Tract 708 8 Census Tract 19.02 306 Census Tract 709 85 Census Tract 19.03 210 Census Tract 710 31 Census Tract 20 825 Census Tract 711 98 Census Tract 21 349 Census Tract 712 1,064 Census Tract 22 243 Census Tract 713 1,299 Census Tract 23 395 Census Tract 714 610 Census Tract 24 956 Census Tract 25.01 669 Hoke County Census Tract 25.02 866 Census Tract 9701 2,771 Census Tract 25.03 645 Census Tract 9702 63 Census Tract 25.04 518 Census Tract 9703 84

24
Census Tract 26 21 Census Tract 9704 134

25
Table 1 (cont.) - Military Population Living Off-Base, Estimate for 2005 Lee County Robeson County Census Tract 301 109 Census Tract 9601 3 Census Tract 302 0 Census Tract 9602 4 Census Tract 303 0 Census Tract 9603 34 Census Tract 304 17 Census Tract 9604 0 Census Tract 305 135 Census Tract 9605 0 Census Tract 306 12 Census Tract 9606 0 Census Tract 307 32 Census Tract 9607 0 Census Tract 9608 0 Montgomery County Census Tract 9609 15 Census Tract 9601 21 Census Tract 9610 0 Census Tract 9602 0 Census Tract 9611 0 Census Tract 9603 0 Census Tract 9612 0 Census Tract 9604 0 Census Tract 9613 0 Census Tract 9605 0 Census Tract 9614 7 Census Tract 9615 0 Moore County Census Tract 9616 0 Census Tract 9501 27 Census Tract 9617 0 Census Tract 9502 0 Census Tract 9618 0 Census Tract 9503 28 Census Tract 9619 5 Census Tract 9504 22 Census Tract 9620 0 Census Tract 9505 283 Census Tract 9506 140 Sampson County Census Tract 9507 35 Census Tract 9701 0 Census Tract 9508 30 Census Tract 9702 7 Census Tract 9509 111 Census Tract 9703 7 Census Tract 9510 80 Census Tract 9704 7 Census Tract 9511 166 Census Tract 9705 9 Census Tract 9512 49 Census Tract 9706 0 Census Tract 9707 12 Richmond County Census Tract 9708 0 Census Tract 9701 1,029 Census Tract 9709 4 Census Tract 9702 18 Census Tract 9710 0 Census Tract 9703 0 Census Tract 9704 0 Scotland County Census Tract 9705 0 Census Tract 101 61 Census Tract 9706 0 Census Tract 102 0 Census Tract 9707 0 Census Tract 103 4 Census Tract 9708 50 Census Tract 104 0 Census Tract 9709 0 Census Tract 105 0 Census Tract 9710 17 Census Tract 106 0

26
Census Tract 9711 0

27
Table 2 – Projected Location of New Military Personnel Living Off-Base FY 2006 FY 2007 FY 2008 FY 2009 FY 2010 FY 2011 Total Bladen County Census Tract 9501 0 0 0 0 (0) (0) 0 Census Tract 9502 0 0 0 0 0 0 0 Census Tract 9503 0 0 0 0 0 0 0 Census Tract 9504 0 0 0 0 0 0 0 Census Tract 9505 0 0 0 0 0 0 0 Census Tract 9506 2 1 0 0 (1) (1) 2 Cumberland County Census Tract 1 0 0 0 0 0 0 0 Census Tract 2 2 1 0 0 (0) (1) 1 Census Tract 4 0 0 0 0 0 0 0 Census Tract 5 7 2 1 1 (2) (2) 6 Census Tract 6 50 17 6 6 (14) (17) 48 Census Tract 7 31 10 3 3 (9) (10) 29 Census Tract 8 11 4 1 1 (3) (4) 11 Census Tract 9 30 10 3 3 (8) (10) 28 Census Tract 10 2 1 0 0 (1) (1) 2 Census Tract 11 1 0 0 0 (0) (0) 1 Census Tract 12 18 6 2 2 (5) (6) 17 Census Tract 13 2 1 0 0 (0) (1) 1 Census Tract 14 8 3 1 1 (2) (3) 7 Census Tract 15 4 1 0 0 (1) (1) 4 Census Tract 16.01 30 10 3 3 (8) (10) 29 Census Tract 16.02 57 19 6 6 (16) (19) 54 Census Tract 17 30 10 3 3 (8) (10) 28 Census Tract 18 7 2 1 1 (2) (2) 7 Census Tract 19.01 21 7 2 2 (6) (7) 19 Census Tract 19.02 28 9 3 3 (8) (9) 26 Census Tract 19.03 19 6 2 2 (5) (6) 18 Census Tract 20 74 24 8 8 (21) (24) 70 Census Tract 21 31 10 3 3 (9) (10) 30 Census Tract 22 22 7 2 2 (6) (7) 21 Census Tract 23 36 12 4 4 (10) (12) 33 Census Tract 24 86 28 9 9 (24) (28) 81 Census Tract 25.01 60 20 7 7 (17) (20) 57 Census Tract 25.02 78 26 9 9 (22) (26) 74 Census Tract 25.03 58 19 6 6 (16) (19) 55 Census Tract 25.04 47 15 5 5 (13) (15) 44 Census Tract 26 2 1 0 0 (1) (1) 2

28

29
Table 2 (cont.) – Projected Location of New Military Personnel Living Off-Base FY 2006 FY 2007 FY 2008 FY 2009 FY 2010 FY 2011 Total Cumberland County Census Tract 27 7 2 1 1 (2) (2) 7 Census Tract 28 5 2 1 1 (1) (2) 5 Census Tract 29 4 1 0 0 (1) (1) 4 Census Tract 30 9 3 1 1 (3) (3) 9 Census Tract 31 80 26 9 9 (22) (26) 75 Census Tract 32.01 64 21 7 7 (18) (21) 60 Census Tract 32.02 102 34 11 11 (28) (33) 96 Census Tract 32.03 47 15 5 5 (13) (15) 44 Census Tract 33.01 231 76 25 25 (64) (76) 218 Census Tract 33.02 24 8 3 3 (7) (8) 23 Census Tract 33.03 242 80 27 26 (67) (79) 228 Census Tract 33.04 90 30 10 10 (25) (29) 85 Census Tract 33.05 90 30 10 10 (25) (30) 85 Census Tract 34 Census Tract 35 75 25 8 8 (21) (25) 71 Census Tract 36 50 17 5 5 (14) (16) 47 Census Tract 37 36 12 4 4 (10) (12) 34 Harnett County Census Tract 701 1 0 0 0 (0) (0) 1 Census Tract 702 1 0 0 0 (0) (0) 0 Census Tract 703 2 1 0 0 (1) (1) 2 Census Tract 704 1 0 0 0 (0) (0) 1 Census Tract 705 0 0 0 0 0 0 0 Census Tract 706 21 7 2 2 (6) (7) 19 Census Tract 707 10 3 1 1 (3) (3) 9 Census Tract 708 1 0 0 0 (0) (0) 1 Census Tract 709 8 3 1 1 (2) (3) 7 Census Tract 710 3 1 0 0 (1) (1) 3 Census Tract 711 9 3 1 1 (3) (3) 8 Census Tract 712 97 31 10 10 (29) (32) 88 Census Tract 713 119 39 12 13 (35) (40) 108 Census Tract 714 56 18 6 6 (16) (19) 51 Hoke County Census Tract 9701 254 81 25 27 (80) (87) 220 Census Tract 9702 6 2 1 1 (2) (2) 5 Census Tract 9703 8 2 1 1 (2) (3) 7 Census Tract 9704 12 4 1 1 (4) (4) 11

30

31
Table 2 (cont.) – Projected Location of New Military Personnel Living Off-Base FY 2006 FY 2007 FY 2008 FY 2009 FY 2010 FY 2011 Total Lee County Census Tract 301 10 3 1 1 (3) (3) 9 Census Tract 302 0 0 0 0 0 0 0 Census Tract 303 0 0 0 0 0 0 0 Census Tract 304 2 0 0 0 (0) (1) 1 Census Tract 305 12 4 1 1 (4) (4) 11 Census Tract 306 1 0 0 0 (0) (0) 1 Census Tract 307 3 1 0 0 (1) (1) 3 Montgomery County Census Tract 9601 2 1 0 0 (1) (1) 2 Census Tract 9602 0 0 0 0 0 0 0 Census Tract 9603 0 0 0 0 0 0 0 Census Tract 9604 0 0 0 0 0 0 0 Census Tract 9605 0 0 0 0 0 0 0 Moore County Census Tract 9501 2 1 0 0 (1) (1) 2 Census Tract 9502 0 0 0 0 0 0 0 Census Tract 9503 3 1 0 0 (1) (1) 2 Census Tract 9504 2 1 0 0 (1) (1) 2 Census Tract 9505 26 8 3 3 (8) (9) 23 Census Tract 9506 13 4 1 1 (4) (4) 11 Census Tract 9507 3 1 0 0 (1) (1) 3 Census Tract 9508 3 1 0 0 (1) (1) 2 Census Tract 9509 10 3 1 1 (3) (3) 9 Census Tract 9510 7 2 1 1 (2) (2) 6 Census Tract 9511 15 5 2 2 (5) (5) 13 Census Tract 9512 4 1 0 0 (1) (2) 4 Richmond County Census Tract 9701 95 30 9 10 (31) (33) 80 Census Tract 9702 2 1 0 0 (1) (1) 1 Census Tract 9703 0 0 0 0 0 0 0 Census Tract 9704 0 0 0 0 0 0 0 Census Tract 9705 0 0 0 0 0 0 0 Census Tract 9706 0 0 0 0 0 0 0 Census Tract 9707 0 0 0 0 0 0 0 Census Tract 9708 5 1 0 0 (1) (2) 4 Census Tract 9709 0 0 0 0 0 0 0

32
Census Tract 9710 2 0 0 0 (0) (1) 1 Census Tract 9711 0 0 0 0 0 0 0
Table 2 (cont.) – Projected Location of New Military Personnel Living Off-Base FY 2006 FY 2007 FY 2008 FY 2009 FY 2010 FY 2011 Total Robeson County Census Tract 9601 0 0 0 0 (0) (0) 0 Census Tract 9602 0 0 0 0 (0) (0) 0 Census Tract 9603 3 1 0 0 (1) (1) 3 Census Tract 9604 0 0 0 0 0 0 0 Census Tract 9605 0 0 0 0 0 0 0 Census Tract 9606 0 0 0 0 0 0 0 Census Tract 9607 0 0 0 0 0 0 0 Census Tract 9608 0 0 0 0 0 0 0 Census Tract 9609 1 0 0 0 (0) (0) 1 Census Tract 9610 0 0 0 0 0 0 0 Census Tract 9611 0 0 0 0 0 0 0 Census Tract 9612 0 0 0 0 0 0 0 Census Tract 9613 0 0 0 0 0 0 0 Census Tract 9614 1 0 0 0 (0) (0) 1 Census Tract 9615 0 0 0 0 0 0 0 Census Tract 9616 0 0 0 0 0 0 0 Census Tract 9617 0 0 0 0 0 0 0 Census Tract 9618 0 0 0 0 0 0 0 Census Tract 9619 0 0 0 0 (0) (0) 0 Census Tract 9620 0 0 0 0 0 0 0 Sampson County Census Tract 9701 0 0 0 0 0 0 0 Census Tract 9702 1 0 0 0 (0) (0) 1 Census Tract 9703 1 0 0 0 (0) (0) 1 Census Tract 9704 1 0 0 0 (0) (0) 1 Census Tract 9705 1 0 0 0 (0) (0) 1 Census Tract 9706 0 0 0 0 0 0 0 Census Tract 9707 1 0 0 0 (0) (0) 1 Census Tract 9708 0 0 0 0 0 0 0 Census Tract 9709 0 0 0 0 (0) (0) 0 Census Tract 9710 0 0 0 0 0 0 0 Scotland County Census Tract 101 6 2 1 1 (2) (2) 5 Census Tract 102 0 0 0 0 0 0 0 Census Tract 103 0 0 0 0 (0) (0) 0

33
Census Tract 104 0 0 0 0 0 0 0 Census Tract 105 0 0 0 0 0 0 0 Census Tract 106 0 0 0 0 0 0 0

34
Table 3 – Projected Location of New Civilian Personnel FY 2006 FY 2007 FY 2008 FY 2009 FY 2010 FY 2011 Total Bladen County Census Tract 9501 0 1 (0) (0) 3 0 4 Census Tract 9502 0 1 (0) (0) 2 0 3 Census Tract 9503 0 1 (0) (0) 4 0 5 Census Tract 9504 0 1 (0) (0) 4 0 5 Census Tract 9505 0 1 (0) (0) 4 0 6 Census Tract 9506 0 1 (0) (0) 5 0 6 Cumberland County Census Tract 1 0 1 (0) (0) 2 0 3 Census Tract 2 0 2 (0) (0) 5 0 7 Census Tract 4 0 1 (0) (0) 2 0 2 Census Tract 5 0 1 (0) (0) 5 0 6 Census Tract 6 1 3 (0) (0) 11 0 15 Census Tract 7 1 4 (0) (1) 15 0 20 Census Tract 8 0 2 (0) (0) 6 0 7 Census Tract 9 1 3 (0) (0) 9 0 12 Census Tract 10 0 2 (0) (0) 5 0 7 Census Tract 11 1 3 (0) (0) 10 0 13 Census Tract 12 1 3 (0) (0) 12 0 15 Census Tract 13 0 1 (0) (0) 2 0 3 Census Tract 14 1 3 (0) (0) 12 0 15 Census Tract 15 0 2 (0) (0) 6 0 8 Census Tract 16.01 1 3 (0) (0) 11 0 14 Census Tract 16.02 1 5 (0) (1) 19 0 25 Census Tract 17 1 4 (0) (0) 13 0 18 Census Tract 18 0 1 (0) (0) 5 0 6 Census Tract 19.01 0 2 (0) (0) 6 0 7 Census Tract 19.02 1 3 (0) (0) 10 0 13 Census Tract 19.03 1 2 (0) (0) 8 0 11 Census Tract 20 1 4 (0) (1) 15 0 20 Census Tract 21 1 2 (0) (0) 8 0 11 Census Tract 22 0 2 (0) (0) 5 0 7 Census Tract 23 1 3 (0) (0) 10 0 13 Census Tract 24 1 3 (0) (0) 11 0 15 Census Tract 25.01 1 4 (0) (0) 15 0 20 Census Tract 25.02 1 3 (0) (0) 11 0 14 Census Tract 25.03 1 3 (0) (0) 10 0 13 Census Tract 25.04 1 3 (0) (0) 11 0 14 Census Tract 26 1 3 (0) (0) 9 0 12

35

36
Table 3 (cont.) – Projected Location of New Civilian Personnel FY 2006 FY 2007 FY 2008 FY 2009 FY 2010 FY 2011 Total Cumberland County Census Tract 27 1 4 (0) (0) 14 0 19 Census Tract 28 1 3 (0) (0) 12 0 16 Census Tract 29 0 1 (0) (0) 3 0 4 Census Tract 30 1 6 (0) (1) 22 0 29 Census Tract 31 2 8 (0) (1) 28 1 37 Census Tract 32.01 1 4 (0) (1) 15 0 20 Census Tract 32.02 2 7 (0) (1) 24 0 31 Census Tract 32.03 1 3 (0) (0) 11 0 14 Census Tract 33.01 3 12 (0) (1) 41 1 55 Census Tract 33.02 0 2 (0) (0) 7 0 10 Census Tract 33.03 2 7 (0) (1) 25 1 33 Census Tract 33.04 1 4 (0) (0) 14 0 19 Census Tract 33.05 1 3 (0) (0) 12 0 16 Census Tract 34 1 3 (0) (0) 9 0 12 Census Tract 35 1 3 (0) (0) 9 0 12 Census Tract 36 1 3 (0) (0) 11 0 14 Census Tract 37 1 4 (0) (0) 14 0 18 Harnett County Census Tract 701 1 3 (0) (0) 10 0 13 Census Tract 702 0 1 (0) (0) 2 0 3 Census Tract 703 0 1 (0) (0) 3 0 4 Census Tract 704 0 2 (0) (0) 7 0 9 Census Tract 705 1 4 (0) (0) 13 0 18 Census Tract 706 1 3 (0) (0) 10 0 13 Census Tract 707 1 3 (0) (0) 12 0 16 Census Tract 708 1 4 (0) (0) 13 0 17 Census Tract 709 0 2 (0) (0) 7 0 9 Census Tract 710 0 1 (0) (0) 4 0 6 Census Tract 711 1 5 (0) (1) 17 0 23 Census Tract 712 1 6 (0) (1) 21 0 28 Census Tract 713 2 7 (0) (1) 25 1 34 Census Tract 714 1 5 (0) (1) 18 0 24 Hoke County Census Tract 9701 2 11 (0) (1) 38 1 51 Census Tract 9702 1 6 (0) (1) 19 0 25 Census Tract 9703 1 3 (0) (0) 11 0 15 Census Tract 9704 1 4 (0) (1) 15 0 20

37

38
Table 3 (cont.) – Projected Location of New Civilian Personnel FY 2006 FY 2007 FY 2008 FY 2009 FY 2010 FY 2011 Total Lee County Census Tract 301 0 2 (0) (0) 6 0 8 Census Tract 302 0 1 (0) (0) 3 0 4 Census Tract 303 0 1 (0) (0) 2 0 3 Census Tract 304 0 2 (0) (0) 6 0 9 Census Tract 305 2 8 (0) (1) 26 1 34 Census Tract 306 1 5 (0) (1) 18 0 24 Census Tract 307 0 2 (0) (0) 6 0 8 Montgomery County Census Tract 9601 0 1 (0) (0) 4 0 5 Census Tract 9602 0 1 (0) (0) 5 0 6 Census Tract 9603 0 1 (0) (0) 2 0 3 Census Tract 9604 0 1 (0) (0) 3 0 4 Census Tract 9605 0 1 (0) (0) 4 0 5 Moore County Census Tract 9501 0 1 (0) (0) 2 0 2 Census Tract 9502 0 1 (0) (0) 5 0 6 Census Tract 9503 1 6 (0) (1) 22 0 29 Census Tract 9504 1 5 (0) (1) 17 0 23 Census Tract 9505 2 9 (0) (1) 30 1 40 Census Tract 9506 1 5 (0) (1) 18 0 23 Census Tract 9507 1 4 (0) (0) 14 0 18 Census Tract 9508 1 5 (0) (1) 17 0 23 Census Tract 9509 0 2 (0) (0) 5 0 7 Census Tract 9510 1 3 (0) (0) 9 0 12 Census Tract 9511 1 3 (0) (0) 12 0 15 Census Tract 9512 1 3 (0) (0) 9 0 13 Richmond County Census Tract 9701 1 2 (0) (0) 8 0 11 Census Tract 9702 0 1 (0) (0) 3 0 4 Census Tract 9703 0 1 (0) (0) 3 0 4 Census Tract 9704 0 1 (0) (0) 3 0 4 Census Tract 9705 0 1 (0) (0) 2 0 2 Census Tract 9706 0 1 (0) (0) 3 0 3 Census Tract 9707 0 1 (0) (0) 2 0 3 Census Tract 9708 0 1 (0) (0) 3 0 4 Census Tract 9709 0 1 (0) (0) 3 0 4

39
Census Tract 9710 0 1 (0) (0) 3 0 4 Census Tract 9711 0 1 (0) (0) 3 0 4
Table 3 (cont.) – Projected Location of New Civilian Personnel FY 2006 FY 2007 FY 2008 FY 2009 FY 2010 FY 2011 Total Robeson County Census Tract 9601 1 5 (0) (1) 18 0 24 Census Tract 9602 1 7 (0) (1) 23 0 30 Census Tract 9603 1 4 (0) (0) 14 0 19 Census Tract 9604 0 2 (0) (0) 6 0 8 Census Tract 9605 0 2 (0) (0) 6 0 8 Census Tract 9606 0 1 (0) (0) 4 0 5 Census Tract 9607 0 2 (0) (0) 5 0 7 Census Tract 9608 0 1 (0) (0) 5 0 6 Census Tract 9609 0 0 (0) (0) 1 0 2 Census Tract 9610 0 0 (0) (0) 1 0 2 Census Tract 9611 0 0 (0) (0) 2 0 2 Census Tract 9612 0 0 (0) (0) 2 0 2 Census Tract 9613 0 2 (0) (0) 6 0 8 Census Tract 9614 0 1 (0) (0) 2 0 3 Census Tract 9615 0 1 (0) (0) 4 0 5 Census Tract 9616 0 1 (0) (0) 5 0 6 Census Tract 9617 0 1 (0) (0) 4 0 5 Census Tract 9618 0 2 (0) (0) 7 0 9 Census Tract 9619 0 1 (0) (0) 3 0 4 Census Tract 9620 0 1 (0) (0) 5 0 6 Sampson County Census Tract 9701 0 1 (0) (0) 5 0 6 Census Tract 9702 0 1 (0) (0) 4 0 5 Census Tract 9703 0 2 (0) (0) 8 0 10 Census Tract 9704 0 1 (0) (0) 4 0 5 Census Tract 9705 0 1 (0) (0) 4 0 5 Census Tract 9706 0 1 (0) (0) 3 0 4 Census Tract 9707 0 1 (0) (0) 4 0 5 Census Tract 9708 0 1 (0) (0) 5 0 6 Census Tract 9709 0 1 (0) (0) 2 0 3 Census Tract 9710 0 1 (0) (0) 4 0 5 Scotland County Census Tract 101 0 2 (0) (0) 5 0 7 Census Tract 102 0 1 (0) (0) 3 0 4 Census Tract 103 0 1 (0) (0) 3 0 4

40
Census Tract 104 0 1 (0) (0) 2 0 3 Census Tract 105 0 1 (0) (0) 5 0 7 Census Tract 106 1 5 (0) (1) 17 0 23

41
Map 1 – Military Population Living Off-Base, 2005

42
Map 2 – Projected Change in Military Population Due to Military Personnel Changes, 2006 - 2011
43
Map 3 – Projected Change in Civilian Population Due to Changes in Civilian Personnel, 2006 - 2011

44
Map 4 – Projected Change in Military and Civilian Population Due to Changes in Personnel, 2006 - 2011

45