final ohv report - california department of … frick, co-director . ... 2.2.1 classification and...
TRANSCRIPT


Assessing the State Fuel Tax Paid on Gasoline Used for Off-Highway Vehicle
(OHV) Recreation
Prepared by University of California Transportation Center
for the California State Legislature

1
Contractor’s Principal Investigator Karen Frick, Co-Director University of California Transportation Center (UCTC) 2614 Dwight Way Berkeley, CA 94720 510-642-0913 (office) [email protected]
Key Staff: Assistant Contractor Principal Investigators Andrea Broaddus, PhD Candidate UC Berkeley Department of City & Regional Planning 230 Wurster Hall, #1820 Berkeley, CA 94720 510-314-1065 (cell) [email protected]
Nicola Szibbo, PhD, Postdoctoral Researcher UC Berkeley Department of City & Regional Planning 230 Wurster Hall, #1820 Berkeley, CA 94720 301-538-8540 (cell) [email protected]
Agreement Number: 65A0528, Task Order 020

2
Executive Summary ............................................................................................................. 4
Background ......................................................................................................................... 8
Section 1.0: Identifying Issues & Questions ...................................................................... 10 1.1 Overview of two OHV fuel use estimation studies ..................................................................... 10
1.1.1 Study by Tyler & Associates, 1990 .......................................................................................... 10 1.1.2 Study by ICF International, 2006 ............................................................................................. 10 1.1.3 Key research questions ............................................................................................................... 10
1.2 A review of the two studies ........................................................................................................................ 11
Section 2.0: Detailed Review of the 1990 and 2006 Studies ............................................ 13 2.1 Assessing methodologies............................................................................................................................. 13
2.1.1 Method for estimating the ratio of registered to unregistered OHVs ................................. 13 2.1.2 Method for estimating use of highway registered vehicles as OHVs ................................. 14 2.1.3 Method for estimating monthly fuel purchases for OHV use ............................................... 14 2.1.4 Method for estimating fuel used to access recreation areas ................................................. 15 2.1.5 Method for estimating fuel use by unregistered OHVs ........................................................... 15
2.2 Assessing the reliability of the methods ................................................................................................ 16 2.2.1 Classification and Counting of Vehicles: Unregistered vs. Registered OHVs .................. 16 2.2.2 Vehicle Classification: Unregistered vs. Registered OHVs ..................................................... 17 2.2.3 User demographics and measurement error .............................................................................. 18
2.3 Should the 2006 methods be used to estimate current use patterns? ...................................... 18
Section 3.0: Reviewing Current Trends ............................................................................. 20 3.1 Reviewing OHV registration trends ........................................................................................................ 20
3.1.1 Vehicle Registration Data Provided by OHMVR ......................................................................... 20 3.1.2 Vehicle Registration Data Provided by CEC ................................................................................. 22 3.1.3 Vehicle Registration Data Provided by CARB ............................................................................. 24 3.1.4 OHV Registrations by sticker type ................................................................................................... 25 3.1.5 OHV Registrations by County ............................................................................................................ 26 3.1.6 Motorcycle registrations ..................................................................................................................... 28 3.1.7 Four wheel drive car and truck registrations ............................................................................. 30 3.1.8 Alternative fuel vehicles ...................................................................................................................... 31
3.3 SVRA OHV Area Attendance Trends (2006-2014) ............................................................................ 31 3.3.1 Method of Measuring Attendance at SVRAs ................................................................................ 34
3.4 Federal Bureau of Land Management OHV Area Attendance Trends (2006-2014) ............ 34 3.5 National Forest OHV Area Attendance Trends (2006-2014) ........................................................ 38
3.5.1 Method of Measuring Attendance at National Forests ............................................................ 40 3.6 Consideration of County and Municipal OHV areas .......................................................................... 40
Section 5.0: Future Outlook .............................................................................................. 41 5.1 Cyclic OHV use patterns based on economic conditions ................................................................. 41
5.1.1 Post-recession recovery ...................................................................................................................... 41 5.1.2 Fuel prices ................................................................................................................................................. 43

3
5.1.3 Alternative fuel vehicles ...................................................................................................................... 44 5.2 Growth of OHV users ..................................................................................................................................... 44
5.2.1 OHV User Traditions ............................................................................................................................. 44 5.2.2 Demographic shifts................................................................................................................................ 45 5.2.3 Millennials ................................................................................................................................................. 46
Section 6.0: Conclusions.................................................................................................... 47
Works Cited ....................................................................................................................... 49
Appendix A ........................................................................................................................ 51
Appendix B ........................................................................................................................ 52
Tables and Figures
Table 1: Review of studies estimating OHV fuel use .................................................................... 11 Figure 1. Active OHV registrations (OHMVR) ............................................................................. 21 Figure 2. Inactive OHV registrations (OHMVR) ........................................................................... 21 Figure 3. Active OHV registrations (CEC) .................................................................................... 23 Table 2. 2013 OHV vehicle registration data from OHMVR, CEC, and CARB ........................... 24 Table 3. OHV estimates from CEC and CARB compared to those from OHMVR ....................... 24 Figure 4. OHV registration trend by sticker type (CEC) ................................................................ 25 Figure 5. OHV red sticker registration trend (CEC) ...................................................................... 26 Figure 6. OHV registrations by vehicle body type and sticker type (CEC) ................................... 26 Figure 7. OHV registration by county (CEC) ................................................................................ 27 Figure 8. Motorcycle registrations by vehicle category (CEC) ...................................................... 28 Figure 9. Motorcycle registrations by body type, 2014 (CEC) ...................................................... 29 Figure 10. Four Wheel Drive (4WD) Vehicle Registration Trend (CEC)...................................... 30 Table 4. Motorcycle registrations by fuel type (CEC) ................................................................... 31 Figure 11. Attendance at SVRA Parks (OHMVR) ........................................................................ 32 Figure 12. Ten year trend in SVRA attendance (OHMVR) ........................................................... 33 Figure 13. Attendance at SVRA Parks by park (OHMVR) ........................................................... 33 Table 5. Bureau of Land Management Field Offices (BLM) ......................................................... 34 Figure 14. OHV use on BLM lands (BLM) ................................................................................... 36 Figure 15. OHV counts by El Centro field office (BLM) .............................................................. 36 Figure 16. OHV counts by other BLM field offices (BLM) .......................................................... 37 Figure 17. OHV use on BLM lands by vehicle type (BLM) .......................................................... 37 Figure 18. Activities reported by visitors to National Forests (NFS) ............................................. 39 Figure 19. OHV use on Forest Service lands, by forest (NFS) ...................................................... 39 Figure 20. Comparison of off-road motorcycle sales data (MIC) with OHV population forecast (RV2013) (Source: CARB 2015) .................................................................................................. 41 Figure 21. Active OHV registrations (OHMVR) ........................................................................... 42 Figure 22. Active OHV registrations (CEC) .................................................................................. 43 Figure 23. Average Weekly Retail Price for Regular Conventional Gasoline on the West Coast (Dollars per gallon) (EIA) .............................................................................................................. 44

4
Executive Summary
This report was produced as a result of Senate Bill (SB) 853 of 2014, which required the Department of Transportation (Caltrans), in cooperation with the Department of Parks and Recreation (Parks) and the Department of Motor Vehicles (DMV) to undertake a study to determine if an adjustment is required to the amount of money transferred from the Motor Vehicle Fuel Account (MVFA) to the Off- Highway Vehicle Trust Fund (OHVTF). Caltrans commissioned the University of California Transportation Center (UCTC) to complete the study requested by the Legislature. The study was required to review four factors that determine the amount of transfer: 1) the number of registered Off-Highway Vehicles (OHVs), 2) highway registered ‘street legal’ vehicles with the capacity to be used as OHVs (i.e. four wheel drive, dual sport motorcycles, etc.), 3) attendance at State Vehicle Recreation Areas (SVRAs), and 4) OHV use on federal lands.
The report also reviews two previous studies commissioned by Parks to estimate the amount of fuel tax that should be transferred to the OHVTF (fuel tax transfer). In 1990, Tyler and Associates conducted a study on OHV fuel use and developed a fuel tax transfer model, which was adopted. In 2006, ICF International conducted a similar, but more rigorous study, accounting for data limitations and counting errors.
Comparison of fuel tax transfer estimation methods
In this report, UCTC reviews the two studies completed in 1990 and 2006, comparing and contrasting the methodology used to estimate the fuel tax transfer. The first component of the report re-evaluates the past two studies for competency in research design, data accuracy and internal validity. We found the 2006 study to have a more rigorous study design, using a stratified sample and weighting procedures, and correcting for data deficiencies in the 1990 study. The study collected data from a larger number and wider range of California households. It also corrected for several confounding factors in the 1990 study, including significant misclassification of vehicles in the DMV registration database, by independently cross-checking vehicle counts. The 1990 Tyler and Associates report scored ‘mediocre’ in terms of research design and internal validity, and only ‘fair’ with respect to range and soundness of data examined, according to our assessment parameters. In contrast, the 2006 ICF International report scored an ‘excellent’ in terms of research design, ‘fair’ in terms of internal validity, and ‘good’ with respect to range and soundness of data examined.
We found that the 1990 fuel tax transfer model systematically over-estimates fuel use by OHVs. Two important factors changed between 1990 and 2006 without adjustment to the model. The first factor was enhanced enforcement efforts, which ensured that unregistered OHVs became registered. For example, the 1990 model was found to over-estimate the number of unregistered OHV motorcycles by a factor of six. Fuel use by these ‘phantom’ OHVs was estimated at the same rate as registered OHVs. The 2006 study found that the few remaining unregistered OHVs are used less and therefore use less fuel. The second major change factor was the growing popularity of four-wheel drive (4WD) vehicles for everyday use. The 1990 model estimates that 36% of highway-licensed 4WD vehicles are used for off-highway recreation, but the 2006 study

5
found that only 11% were. This means that fuel use by 4WDs in the fuel tax transfer model is over-estimated by a factor of three.
The 2006 study also found two ways the 1990 study systematically under-estimated OHV fuel use, both due to misclassification of vehicles. Both studies estimated vehicle populations from the DMV database using Vehicle Identification Numbers (VINs) to classify them by make and model. In the 1990 study, all-terrain vehicles (ATVs) were frequently misclassified as motorcycles, resulting in a severe under-count of ATVs. As ATVs use more fuel than motorcycles, and have higher rates of off-highway use, fuel use was also underestimated. Similarly, highway-licensed 4WD vehicles were frequently misclassified as two-wheel drive vehicles, which engage in far less off-highway driving, and so their fuel use for off-highway activities was underestimated. However, when corrections were made and all vehicles were classified and counted correctly, the over-estimation factors were found to outweigh the under- estimation factors. The net effect of all the various counting errors was an overestimation of the fuel tax transfer.
The Legislature has a clear stance that the fuel tax transfer should include fuel used off-highway for two purposes: 1) driving as a recreational activity, and 2) driving to access other types of recreational activities. The latter was not estimated in the 1990 study. The 2006 study asked respondents to keep a fuel logbook and report 22 categories of off-highway recreational activities such as camping, fishing, and mountain biking. Fuel used to access these activities was included in the study’s estimations for the fuel tax transfer model. Under this methodology, highway registered vehicles, mainly Sport Utility Vehicles and trucks, accounted for the majority (83%) of recreational off-highway fuel use, as opposed to the 25% predicted in the 1990 model. Recreational pursuits which had relatively high gasoline use included camping, fishing, and hunting/target practice.
Current trends in OHV use
In addition to reviewing the fuel tax transfer methodology, UCTC was tasked with analyzing current trends in OHV use. To estimate the OHV population, we utilized data sets from California’s Off-Highway Motor Vehicle Recreation (OHMVR) division and the California Energy Commission (CEC). When a major discrepancy was found between these two data sources, due to vehicle misclassification errors, the researchers used a third OHV estimation produced by California Air Resources Board (CARB) to resolve it. The data from all these sources showed the same trends.
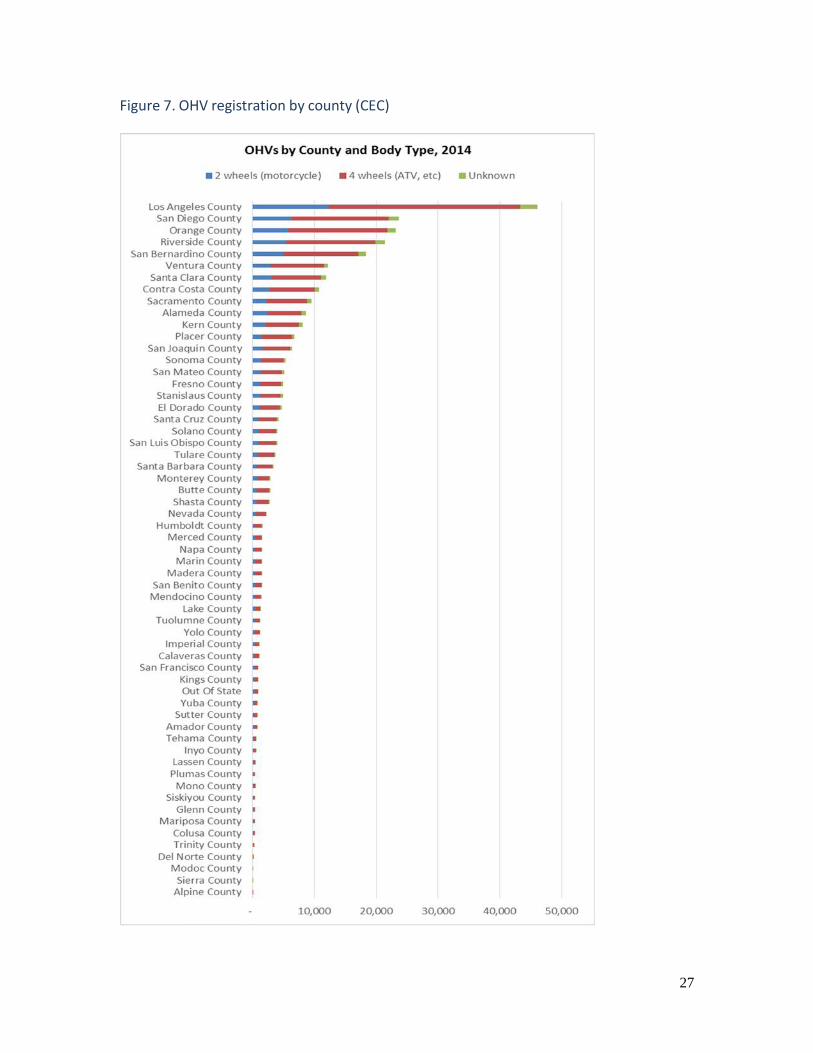
Current trends in data from 2008-2014 suggest OHV registrations have been in a downward trend since peaking in 2008, most likely due to the economic recession which hit that year. OHV registrations fell from 1,135,919 in 2008 to 879,752 in 2014, a decline of 23%. In 2014, Los Angeles County had the highest number of OHVs in the state (46,074), nearly twice as many as the next highest, San Diego County (23,654).
The economic recession is the most likely reason that OHV registrations and use have been in decline. OHV sales and use are linked to the economic cycle. Under favorable economic conditions, when people have more disposable income, OHV sales and use rise. OHV sales are believed to be linked to the new housing starts trend, and as these rebound from the recession,

6
OHV registrations are likely to rise. We did not find robust evidence that the tide has begun to turn for OHVs—registrations for 2014, the most recent year available, were lower than in 2013. However we did not have access to OHV sales data for this study.
On the other hand, there is growth in highway registered vehicles that may be used for off- highway recreation. Motorcycles and 4WD vehicle registrations have been on a steady upward trend during the recession. In 2010 there were 758,539 motorcycle registrations, but this number increased to 816,187 in 2014, an 8% growth. 4WD and all-wheel drive vehicle registrations grew from 4,109,109 in 2010 to 4,527,803 in 2014, or 10% growth. These vehicles grew as a proportion of all highway registered vehicles, from 15.6% in 2010 to 17% in 2014. However, this does not imply a proportional rise in off-highway driving. The fastest growing class of 4WD are ‘cross utility vehicles’, which handle like a car and have limited capability for off-highway driving.
Fuel efficiency is not a major factor affecting OHV recreation. Due to data limitations, we were not able to assess trends in alternative fuel use among OHVs, but only highway registered motorcycles. The vast majority of motorcycle registrations are for gasoline or diesel powered vehicles which pay the state gasoline tax. Only a small proportion (.12%) are powered by alternative fuels such as methanol, propane, butane or natural gas, or by battery.
Attendance trends at OHV recreation areas California’s OHV parks (SVRAs) experienced tremendous growth in visitation from 1999 to 2007, when the number of annual visitors peaked at 4.09 million. Attendance then declined from 2008 to 2010, and leveled off at about 2.7 million visitors per year, 34% below the peak. When the attendance data were broken down by the individual parks, we found the growth and decline trends were driven by spikes at the two most heavily visited parks, Oceano Dunes and Ocotillo Wells, and to a lesser extent, Hungry Valley. Attendance at the other SVRAs has been relatively stable over time, ranging from 25,000 to 225,000 visitors per year.
OHV visitation trends on federal lands were similar. In 2007, visitors used an estimated 4.1 million OHVs on BLM lands, and peaked in 2010 with 4.3 million vehicles. Since then, use has declined to a low of 2.5 million vehicles in 2014. A resurgence may be underway in 2015, as an estimated 3 million estimated vehicles had visited BLM lands by October. Over half of the vehicles used in any given year were counted by the El Centro field office, which is likely driving the overall trend. Two BLM offices typically report 300,000 to 600,000 OHVs (Ridgecrest and Barstow), and all others report fewer than 200,000.
An estimated 23.43 million people visit National Forests in California each year. Approximately one-third of visitors (5.51 million) report participating in one or more of six motorized activities during their visit, most commonly driving for pleasure, followed by OHV use and motorized trail activity. In 2014, OHV use was reported as the main activity by nearly 400,000 visitors, or 2% of the total. San Bernardino National Forest is used by over 265,000 visitors for OHV activities annually, followed by Angeles National Forest with over 155,000. The majority of National Forest areas attract 10,000 to 50,000 OHV users per year.

7
In addition, there are seven municipal OHV recreation parks in California. We were not able to obtain attendance data from these parks.
The future outlook for OHV users depends on the youngest user groups, which account for about half of all users. However the traditional demographic of OHV users does not match the demographic growth trends of California, as the most rapid growth is among racial minorities with low rates of OHV use. Similarly, the largest generation of young people (Millennials) have much lower rates of driving and car ownership than previous generations. It is unclear whether new OHV users will replace those who age out at a sufficient rate to maintain past OHV growth trends.
Conclusions Overall, we find that the 1990 fuel tax estimation methodology is problematic and systematically overestimates the amount of fuel used by OHVs. The amount of error in the fuel tax transfer has only increased over the past ten years as the vehicle population and use patterns have continued to change. It is unlikely that OHV registration and use will recover to the historically high levels seen in 2006 any time soon.
Conclusions
• Surveys should be conducted every few years to update data on unregistered OHVs and OHV driving for off-highway recreation
• Similar surveys should be done to update data on use of highway-registered 4WD and all- wheel drive vehicles for off-highway driving for recreation and driving to access off- highway recreation areas and activities
• The DMV’s VIN decoder needs to be updated, to correct for major misclassification of OHVs and four-wheel drive vehicle counts
• Direct user fees for OHV recreation, which are relatively low, would be an appropriate substitute to the fuel tax (OHV registration fees are currently $50 every other year)

8
Background
California’s excise tax on vehicle fuel sales is an important source of revenues supporting the state’s transportation infrastructure and economic activities. Currently the tax rate is $.30 per gallon on motor vehicle fuel and $.13 on diesel fuel1. About $3 billion in fuel tax revenues is collected annually, which is split between the State Highway Account and local entities according to a statutory formula (Caltrans 2014). These revenues have been in a long-term decline as the state’s vehicle fleet has become more fuel efficient, and also in real terms, due to inflation.
Starting with the Off-Highway Motor Vehicle Recreation Act of 1988, a portion of fuel tax sales has been used for the acquisition, operation, and funding of state OHV recreation areas and trails. Every month, a portion of fuel tax revenues is transferred from the Motor Vehicle Fuel Account into the Off-Highway Vehicle Trust Fund (OHVTF). The amount of the transfer is based upon an estimate of the tax revenues collected from fuel sales related to the operation of motor vehicles off highway, for which a refund was not claimed2. Fuel taxes represent roughly 70% of annual income to the OHVTF; the other major sources are OHV registration fees (25%) and OHV park entrance fees (5%). In FY 2011/12, the amount of the fuel tax transfer was estimated as $55.2 million (OHMVR Commission 2014). These revenues support nine State Vehicle Recreation Areas (SVRAs) and other California state parks activities.
In 1990, Tyler and Associates developed a method to estimate the amount of fuel tax that should be transferred into the OHVTF, based on estimated fuel sales for OHV use. The methodology that they developed was adopted and is still in use today. In 2006, ICF International was contracted to review and update the OHV fuel tax estimation method. ICF International conducted several original data collection surveys to estimate the population of registered and unregistered OHVs and fuel use per OHV.
This report represents the most recent review of the methodology for estimating fuel use by OHVs. The impetus for this report came in 2014, with California Senate Bill 8533, which mandated a study. The legislation says,
“In the 2014–15 fiscal year, the Department of Transportation, in consultation with the Department of Parks and Recreation and the Department of Motor Vehicles, shall undertake a study to determine the appropriate adjustment to the amount transferred [on a monthly basis from the Motor Vehicle Fuel Account to the OHVTF] and to update the estimate of the amount attributable to taxes imposed upon distributions of motor vehicle fuel used in the operation of motor vehicles off highway and for which a refund has not been claimed. The department shall provide a copy of this study to the Legislature no later than January 1, 2016.” (SB 853)
1 California State Board of Equalization, http://www.boe.ca.gov/pdf/l413.pdf 2 Some fuel purchases for off-highway uses qualify for a refund, such as use by farm vehicles. Fuel sales for recreational off-highway uses, such as the OHVs discussed in this report, do not qualify for a refund. California Controller’s Office, http://www.sco.ca.gov/ardtax_gastax_faq_gen.html#sect2671 3 California Legislative Information, http://leginfo.legislature.ca.gov/faces/billNavClient.xhtml?bill_id=201320140SB853

9
The first part of the study, to ‘determine the appropriate adjustment’, refers to the possibility of adjusting the amount of the monthly fuel tax transfer. The legislation goes on to specify,
“Every five years, starting in the 2013–14 fiscal year, the percentage transferred may be adjusted by the Department of Transportation in cooperation with the Department of Parks and Recreation and the Department of Motor Vehicles. Adjustments shall be based on, but not limited to, the changes in the following factors since the 2006–07 fiscal year or the last adjustment, whichever is more recent:
(1) The number of vehicles registered as off-highway motor vehicles.
(2) The number of registered street-legal vehicles that are anticipated to be used off highway, including four-wheel drive vehicles, all-wheel drive vehicles, and dual-sport motorcycles.
(3) Attendance at the state vehicular recreation areas.
(4) Off-highway recreation use on federal lands as indicated by the United States Forest Service’s National Visitor Use Monitoring and the United States Bureau of Land Management’s Recreation Management Information System.” (SB 853)
For these reasons, this report includes a review of registration trends for the full range of motorized vehicles that may be used for off-highway recreation, including registered and unregistered OHVs as well as highway registered ‘street legal’ vehicles with the capacity to be used as OHVs (i.e. four wheel drive, dual sport motorcycles, etc.). It also includes a review of attendance trends at state OHV parks and for OHV use on federal lands.
The legislation further sought to clarify what types of activities should be included in the methodology to estimate the amount of the monthly fuel tax transfer. As stated in the legislation,
“It is the intent of the Legislature that transfers from the Motor Vehicle Fuel Account to the Off- Highway Vehicle Trust Fund should reflect the full range of motorized vehicle use off highway for both motorized recreation and motorized off-road access to other recreation opportunities.”
For this reason, this report considers fuel used directly for OHV recreation is counted, as well as fuel used by vehicles using unpaved roads to access other recreational opportunities such as camping, hunting, and fishing.
10
Section 1.0: Identifying Issues & Questions 1.1 Overview of two OHV fuel use estimation studies
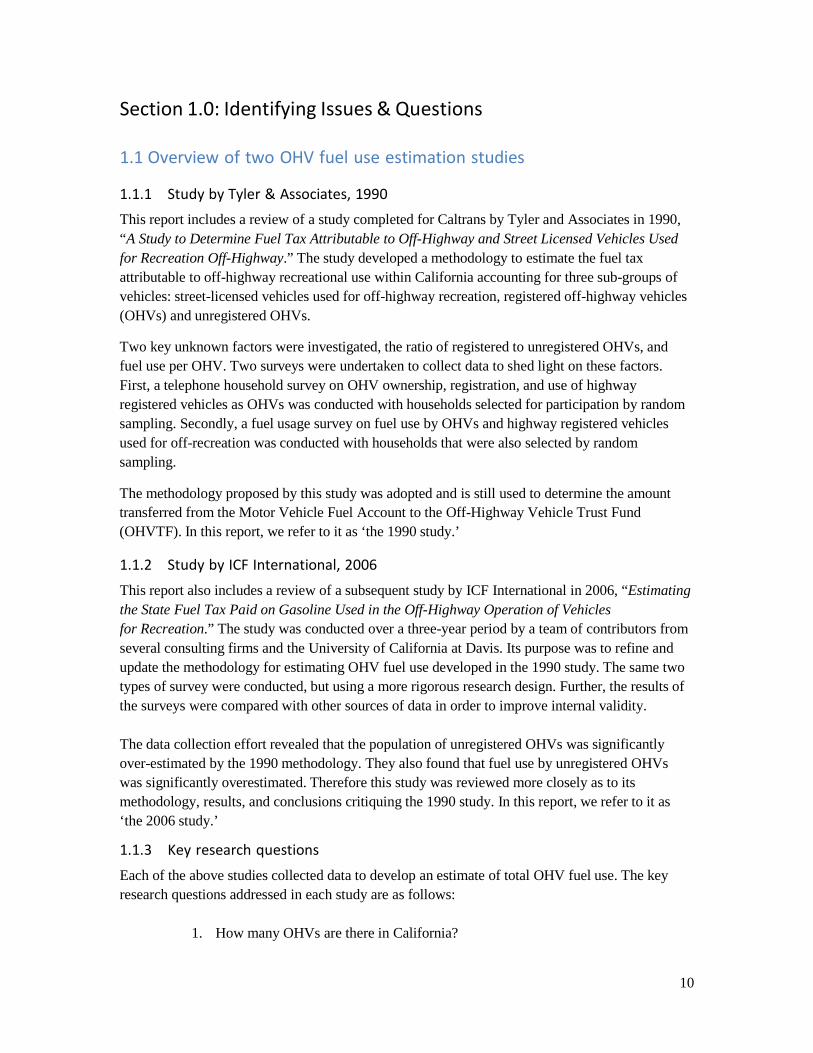
1.1.1 Study by Tyler & Associates, 1990 This report includes a review of a study completed for Caltrans by Tyler and Associates in 1990, “A Study to Determine Fuel Tax Attributable to Off-Highway and Street Licensed Vehicles Used for Recreation Off-Highway.” The study developed a methodology to estimate the fuel tax attributable to off-highway recreational use within California accounting for three sub-groups of vehicles: street-licensed vehicles used for off-highway recreation, registered off-highway vehicles (OHVs) and unregistered OHVs.
Two key unknown factors were investigated, the ratio of registered to unregistered OHVs, and fuel use per OHV. Two surveys were undertaken to collect data to shed light on these factors. First, a telephone household survey on OHV ownership, registration, and use of highway registered vehicles as OHVs was conducted with households selected for participation by random sampling. Secondly, a fuel usage survey on fuel use by OHVs and highway registered vehicles used for off-recreation was conducted with households that were also selected by random sampling.
The methodology proposed by this study was adopted and is still used to determine the amount transferred from the Motor Vehicle Fuel Account to the Off-Highway Vehicle Trust Fund (OHVTF). In this report, we refer to it as ‘the 1990 study.’
1.1.2 Study by ICF International, 2006 This report also includes a review of a subsequent study by ICF International in 2006, “Estimating the State Fuel Tax Paid on Gasoline Used in the Off-Highway Operation of Vehicles for Recreation.” The study was conducted over a three-year period by a team of contributors from several consulting firms and the University of California at Davis. Its purpose was to refine and update the methodology for estimating OHV fuel use developed in the 1990 study. The same two types of survey were conducted, but using a more rigorous research design. Further, the results of the surveys were compared with other sources of data in order to improve internal validity.
The data collection effort revealed that the population of unregistered OHVs was significantly over-estimated by the 1990 methodology. They also found that fuel use by unregistered OHVs was significantly overestimated. Therefore this study was reviewed more closely as to its methodology, results, and conclusions critiquing the 1990 study. In this report, we refer to it as ‘the 2006 study.’
1.1.3 Key research questions Each of the above studies collected data to develop an estimate of total OHV fuel use. The key research questions addressed in each study are as follows:
1. How many OHVs are there in California?

11
a. Registered OHVs b. Unregistered OHVs c. Highway registered vehicles that may be used as OHVs
2. How much fuel is used for OHV recreation? a. By registered OHVs b. By unregistered OHVs c. By highway registered vehicles that may be used as OHVs
3. How can we create a formula for estimating the amount of tax to be transferred? a. For registered OHVs b. For unregistered OHVs c. For highway registered vehicles that may be used as OHVs
1.2 A review of the two studies
The 1990 and the 2006 studies were reviewed based on a set of criteria developed to compare and evaluate the two reports. Each criterion shall be discussed in turn. Table 1 shows the results of our review in a paired comparison format.
Table 1: Review of studies estimating OHV fuel use
Criteria 1990 Taylor & Associates 2006 ICF International
Research Design Mediocre Excellent
Internal Validity Mediocre Fair
Range and Soundness of Data Examined
Fair Good
Research Design The 2006 study stood out as having a more rigorous study design. The limitations of the research design were fully acknowledged, and elements that required corroboration were cross-checked, such as the matching process completed by Robert Cenzer for unregistered vehicle counts. Potential errors in measuring and sampling were also noted in great detail. Both studies used good procedures to ensure random selection of participants, but the 2006 study did a better job of achieving a stratified sample accurately representing different vehicle and household types. Weighting procedures were used to ensure accurate estimations for each vehicle category.
The 1990 study randomly selected 20,394 households from DMV registration data for telephone interviews, and then selected among these to identify participants for a fuel usage logbook survey. In comparison, in the 2006 survey, there was a pre-recruiting process for 151,215 highway registered vehicle households and 9,863 OHV registered vehicle households for participation. These households were selected in a random manner using a stratified probability sample from the DMV vehicle registration database.

12
Internal Validity Multiple confounding factors seemed to be an issue in the 1990 Tyler and Associates study. The 2006 ICF International report first identified and then corrected for these confounding factors. For example, no data was collected to develop a method of estimating fuel use by unregistered vehicles in 1990—the researchers simply assumed that registered and unregistered OHVs consumed the same amount of fuel. In the 2006 study, separate fuel use estimations were made for registered and unregistered vehicles. In addition, there were numerous vehicle classification errors in the 1990 study, which were corrected for in the 2006 study by cross-checking vehicle counts with the DMV database.
Range and Soundness of Data Examined The 1990 study was based on one year’s worth of data from three main sources. Data collection included a) 12,156 telephone interviews on OHV use during 1989 and b) a fuel usage survey with 2,800 households tracking fuel use for three-month periods during the 1989 calendar year. A single source of data, DMV registrations from 1989, was used to estimate the OHV population. In contrast, the 2006 study spanned three years and utilized data from multiple sources to estimate vehicle registrations. Data collection included a) 15,691 telephone interviews conducted from July 2003 to December 2003, and b) fuel use logbooks collected for 15,809 vehicles between April 2004 and March 2005.
Application of Estimators To date, the estimators and fuel tax transfer methodology from the 2006 study has not been adopted or applied. Section 2 of the report assesses in detail the methods used by each of these studies to estimate a) the number of registered OHVs b) the number of unregistered OHVs c) the use of street-legal vehicles as OHVs d) monthly fuel purchases for OHV use and e) fuel use by OHVs to access recreation areas.

13
Section 2.0: Detailed Review of the 1990 and 2006 Studies 2.1 Assessing methodologies
2.1.1 Method for estimating the ratio of registered to unregistered OHVs In the 1990 study, the number of unregistered OHVs was estimated using a correction factor developed from the data collected during in-depth telephone interviews with OHV owning households. During the interviews, detailed information was collected about OHVs owned by the household. The researchers then attempted to find the vehicles in the DMV registration database. If a near-match could not be found, the vehicle was considered unregistered. To calculate the correction factor, the number of unregistered OHVs in a vehicle class was divided by the number of registered OHVs in the same vehicle class. The report concluded that there were substantial numbers of unregistered OHVs in California, with an estimated 5.9 unregistered OHVs estimated for every one registered.
Similarly, the 2006 study estimated the ratio of registered to unregistered OHVs by comparing the results of a telephone survey to DMV registration data. The determination of unregistered OHVs was confirmed through a matching process undertaken by Robert Cenzer detailed in the report. A vehicle was considered verified unregistered if the household was found in the DMV database as owning a highway licensed vehicle or OHV, but the vehicle could not matched using a set of defined parameters.4 The report concluded that the vast majority of OHVs in California were registered, with only .62 unregistered off-highway motorcycles estimated for every one registered.
The 2006 study determined that counts for unregistered OHVs had become grossly inflated from using the 1990 estimators. An error in the model was found, where unregistered OHVs were being systematically over-estimated. The 1990 model uses a fixed unregistered to registered vehicle ratio to estimate the population of unregistered vehicles. For example, for every motorcycle added to the count of registered vehicles, another 5.9 motorcycles are added to the count of unregistered vehicles. Thus when an unregistered vehicle becomes registered, the count of unregistered vehicles increases by a factor of 6.
The 2006 study also noted a significant change since the 1990 study that affected registration rates. Enhanced enforcement measures at OHV recreation areas such as State Vehicular Recreation Areas (SVRAs), county parks, and US Forest Service and Bureau of Land Management land have produced higher rates of vehicle registration and forced many unregistered vehicle owners to register their vehicles. Unregistered OHVs were also reduced because it became possible to register the vehicle with the State at the time of purchase. The 1990 model was not adjusted to account for unregistered vehicles becoming registered between the 1990 study and the 2006 study.
4 The matching parameters can be viewed in Section 4-34 to Section 4-37 of the 2006 ICF International Report.

14
2.1.2 Method for estimating use of highway registered vehicles as OHVs In both studies, the primary method for estimating the use of highway registered, or ‘street legal,’ vehicles as OHVs was a telephone household survey. The 1990 study found that approximately 36% of the four wheel drive (4WD) vehicles owned by surveyed households were used for recreational off-road driving. To estimate the proportion of monthly off-highway recreation for each DMV vehicle category, the researchers divided the number of highway registered vehicles used in a given month by the total ever used off-road. Fuel usage by highway registered vehicles known to be used off-road recreation was tracked during the course of the fuel usage study.
Telephone survey results from the 2006 study were used to estimate the percentage of households that used a highway registered vehicle to engage in off-highway recreation. Findings revealed that 4WD vehicle use had changed significantly since 1990; in 2006, only 11% of 4WD vehicles were used for off-highway recreation. The authors noted that in 1989, 4WD vehicles were mainly used when people wanted to recreate off-highway or needed them for work. In 2006, people tended to use 4WD SUVs to commute to work and drive the kids to school, but rarely take them off- highway. The researchers found a reduction in fuel use by 4WD vehicles for off-highway recreation, which they expected to continue.
A new finding in the 2006 study was significant error in the DMV classification of 4WD vehicles. The model used to translate DMV registration data into the fuel tax transfer model was found to be seriously out of date, in terms of vehicle classification. As a result, many vehicles were misclassified—both highway registered vehicles (4WD versus 2WD), and registered OHVs (motorcycles versus ATVs). The authors increased the number of highway registered categories from five (as in the 1990 study) to eleven, providing better resolution for percent changes in vehicle ownership data. This enabled them to clearly delineate the vehicle categories in their model that generated the most tax revenue. Highway registered vehicles were estimated to account for 83% of fuel use for off-highway recreation, as opposed to the 25% predicted in the 1990 model.
2.1.3 Method for estimating monthly fuel purchases for OHV use One of the principal objectives of both studies was to derive the average monthly fuel consumption for each type of vehicle being used for OHV recreation or to access off-highway recreation opportunities in California on public lands. In both, the primary method for estimating the fuel use for off-highway recreation was a fuel use logbook survey where vehicle owners tracked fuel purchases and vehicle uses in a logbook.
In the 1990 study, a total of 8,343 fuel usage interviews were completed, for five vehicle categories. Participants were given a logbook to track fuel consumption, and the data was collected by telephone interviews. Each participant was interviewed about their fuel usage in four consecutive three-month ‘waves’ from July 1989 to January 1990. Overall, 53% of those who completed wave 1 stayed in the study to compete wave 4.
In the 2006 study, 15,809 vehicles were selected in eleven different vehicle categories. Surveys were administered six consecutive, two month periods (waves) beginning in April 2004 and ending in March 2005. For a selected vehicle, respondents were asked to record off-highway driving activity for a two-month period. Logbooks were mailed to households and they were

15
requested to mail them back, and those who did not return the logbooks were called to collect the data by telephone. Respondents were asked to provide information about a selected vehicle, logging both fuel purchases and off-highway recreational. Each vehicle owner provided information on “gallons used per recreational day,” including fuel used to access recreational areas and for recreation, on public lands in California. The formula for estimating fuel used in a ‘wave’ was:
Estimated Household Fuel Use in month or wave = Number of vehicles × Month or wave fuel use on logbook vehicle (gallons)
In the 2006 study, the fuel diaries defined twenty-two potential recreational pursuits. For each day of recreational OHV use, participants could list up to three recreational pursuits. Gasoline usage for that day was divided equally among the various pursuits. Registered OHVs accounted for 13% of total recreational fuel use, mainly by ATVs and motorcycles.
Fuel use by county was also recorded, with the highest fuel use in Los Angeles County, followed by San Bernardino, Imperial and Kern. Findings from the 2006 study also revealed that the six OHV recreational areas with highest fuel use are Angeles National Forest, Imperial Sand Dunes, San Bernardino National Forest, Hungry Valley SVRA, Ocotillo Wells SVRA, and Jawbone Canyon/Dove Springs.
2.1.4 Method for estimating fuel used to access recreation areas
The 1990 study did not estimate fuel use for off-highway driving to access recreation areas or activities. As described above, a fuel logbook was used in 2006 to gather information about fuel use for these types of trips for the first time. The fuel logbooks distinguished between "driving to recreate" and "for the purpose of recreation.” The 2006 study defined “driving to recreate” as referring to off-highway driving to access recreation activities or areas. In this case, they considered any driving the respondents did off-highway as not an official form of recreation by itself, but as a means to an end. In contrast, driving “for the purpose of recreation” was defined as off-highway driving being the primary recreation activity—riding an ATV or dune buggy, for example.
The 2006 study found that highway registered vehicles dominated fuel use, under this methodology. Highway registered vehicles accounted for the majority (83%) of recreational off- highway fuel use, largely by SUVs and trucks. Recreational pursuits which had relatively high gasoline use included camping, fishing, and hunting/target practice.
2.1.5 Method for estimating fuel use by unregistered OHVs The 1990 study did not survey fuel use by unregistered vehicles, as participants in the fuel use study were randomly selected from the DMV registration database. In order to estimate fuel use by unregistered OHVs, the researchers simply assumed similar use patterns.
In the 2006 study, a three-step method was used for estimating fuel use by unregistered OHVs. First, the population of unregistered vehicles was estimated, as described in Section 2.1.

16
Secondly, the amount of fuel used by unregistered vehicles for recreational OHV purposes was estimated using a fuel use logbook as described in Section 2.3. Finally, the population estimate was multiplied by the fuel use estimate to produce an estimate of total fuel use by unregistered OHVs.
Findings revealed that the annual fuel usage per vehicle of an unregistered OHV was estimated to be 62% less than that of a registered OHV. This significant drop in fuel use by unregistered OHVs was attributed to a dramatic reduction in the ratio of unregistered to registered vehicles and the correct classification of ATVs (which had previously been classified as motorcycles). The 2006 study noted that software used by the DMV to identify vehicle types by vehicle identification number (VIN) had not been updated since 1990. Unregistered vehicles were estimated to account for 4% of recreational fuel use.
2.2 Assessing the reliability of the methods
2.2.1 Classification and Counting of Vehicles: Unregistered vs. Registered OHVs There are major discrepancies between the 1990 study and the 2006 study with regard to how the unregistered OHVs were measured. In the 1990 study, there was no measuring of unregistered vehicles, and the researchers assumed that registered and unregistered OHVs consume the same amount of fuel. The 2006 study illustrated that this was not the case.
In addition to correcting unregistered vehicle counts, the 2006 study determined fuel use rates for unregistered vehicles separately from registered vehicles. The 1990 model assumed that all OHVs used fuel at the same rate, while the 2006 study found that unregistered OHV fuel use per vehicle was 51% less than registered OHV fuel use per vehicle (except for 4 wheel vehicles).
Telephone Survey Methods
It is evident from the structure of the 2006 study that the survey methods were outlined with reliable end results in mind, for instance by the use of strategic over-sampling versus proportional sampling. The survey design was well vetted, and included elements such as language translation, pre-testing, interviewer training and quality control measures.
Fuel Use Logbook Survey Methods
The 1990 Study used the same respondents for each wave of the fuel use survey while ICF International used different respondents. This led to a large drop in subsequent waves in the 1990 Study.
Additionally, by using substantial incentives to complete the fuel use logbook, the 2006 study was able to boost response rates and get a more representative sample that included people who did not travel off-highway and might not have been otherwise motivated to send back a logbook. Households that returned a completed fuel use log book or read their log book over the telephone were entered into a sweepstakes drawing. Each of the six waves had a $5,000 prize plus five $1,000 prizes. In addition there was a $25,000 grand prize awarded at the end of the study. In contrast, the 1990 Study rewarded participants with a free map. The 2006 study also offered participants a telephone helpline, which increased the accuracy of participant responses.

17
2.2.2 Vehicle Classification: Unregistered vs. Registered OHVs Because there was not enough data to distinguish between registered and unregistered fuel use for non-highway registered ‘other’ vehicles, the 2006 study assumed that registered and unregistered ‘others’ had the same fuel use. They noted in the study that this is a small category and the impact of that assumption is negligible.
Telephone Survey Limitations--Classification
The 2006 study used some vehicle categories which resulted in confusion on the part of participants. The categories of “Extreme 4x4” and “Off-Road Cart” were confusing, and had to be studied record-by-record to determine the correct vehicle category. The “Extreme 4x4” category was intended to capture highway registered trucks and SUVs. However, respondents used this category for anything from a highway registered truck or SUV to an ATV. The “Off- Road Cart” category was intended to capture modified golf carts, however people responded to this category for dune buggies, sand or desert rails, go-carts, ATVs and golf carts.
Telephone Survey Limitations--Random Digital Dialing (RDD) Method
The 2006 study used random digital dialing (RDD) to select households for participation. It noted that there are specific limitations in the RDD method in that RDD samples are generated using a probability sample of phone numbers, not households or people. Thus the Random Digital Dialing Method effectively samples phone numbers, but not every household or person has an equal probability of being selected. The 2006 study acknowledges this potential bias, although less than 1.5% of households in California are without phone service (according to data from the 2000 Census). There is also a source of bias in a RDD sample as many households have more than one telephone line, and so a household’s probability of selected is directly related to the number of phone lines it has.
Fuel Logbook Limitations
The fuel logbook methodology was noted in the 2006 study as having several limitations. First, while logbooks normally measure repetitive behavior and behavioral patterns over a few days, the intent here was to measure intermittent use of a designated vehicle over a longer period of two months. The study mentions little or nothing about logbook fatigue, similar to survey fatigue for participants. Additionally, the logbook was intended to capture behavior, which often took place in remote locations or during vacation periods when participants were focused on new activities. Third, the logbook had to communicate clearly to a wide range of OHV users, including snowmobilers, dirt bikers, jeep users, sand rails, and ATV users as well as other drivers using normal street vehicles off-highway to access recreational activities such as camping, hiking, fishing, and mountaineering.
Further challenges were to define clearly for users when they were on a qualifying road (and non- road/off-road/off-highway) surface. Many types of OHVs do not have fuel gauges and thus the design had to offer an alternative means to record and calculate fuel use for a measured fuel use event. Vehicles also used different types of fuels.

18
Within the logbook results, there was a large margin of error for annual gasoline use estimated for off-highway for recreation in California. Gasoline used for off-highway recreation in California was estimated as 150,969,270 gallons per year, with a 16.80% margin of error. The high margin of error was attributed to a poor response rate to the initial invitation letters, which then affected the subsequent sampling rate. The researchers also noted that the use of State letterhead would likely have resulted in a higher response rate.
2.2.3 User demographics and measurement error User Demographics
The user demographics for OHV use in the 2006 study were not stated, discussed or analyzed at length. It would be helpful if future studies could incorporate and assess the basic demographics of OHV users, as collected in the SVRA Attendance Study and the National Forest, so that a basic user profile can be created for OHV users and to predict user trends. Helpful data categories would include a) age, b) income, c) household size, d) gender, e) race, f) ethnicity, g) zip code, h) number of number of family household members over 18, i) number of household members under 18, j) number of household members engaged in OHV use in household over 18, and k) number of household member engaged in OHV use under the age of 18.
Measurement Error
The 2006 study acknowledged that measurement error is a likely issue in both the 1990 and the 2006 studies. Most participants filling out fuel logs would assess the fuel gauge and/or complete a visual inspection to relay how much fuel they used (visual inspection is more common with motorcycles and OHVs that do not have a fuel gauge). Thus, studies such as this one are prone to both underestimation and overestimation errors for fuel use. This can affect study accuracy, where the difference between what is observed and the true value is unknown. The researchers noted that one person’s underestimation likely compensated for another person’s overestimation, however they recommend more attention be given to this issue in the future.
2.3 Should the 2006 methods be used to estimate current use patterns?
We believe the methods applied by the 2006 study are the most applicable toward estimating current use patterns. The data collected in 2006 is more valid, simply because it is more recent. The 2006 study found several significant changes to OHV and 4WD registrations and use patterns, many of which still apply today.
This report has reviewed these methods used to estimate OHV use patterns, and confirms that the overall the 2006 methods are valid, as they are based on sound and more rigorous methodology and more current data as compared to the 1990 Tyler & Associates study. Improvements are still needed with regard to data collection and classification, as acknowledged by the 2006 report, in terms of DMV classifications, and limitations on data collection, sampling and analysis in the research design.

19
Given the continuation of some trends revealed by the 2006 study, such as the rising popularity of 4WD and all-wheel drive vehicles, and the fact that ten years have passed already, it would be prudent to update the household survey and fuel use logbook surveys once again, in the future.
New Methods
Recent attendance studies, such as the SVRA Attendance Study and the United States Department of Agriculture National Forest Study, have pioneered new methods for measuring OHV counts in SVRAs. Such studies have used counting techniques which are done through aerial photography. Future methods could consider such vehicle counting techniques, but it should be noted that such techniques are extremely cost-intensive.

20
Section 3.0: Reviewing Current Trends 3.1 Reviewing OHV registration trends
Any vehicle operated on lands accessible for OHV recreation, either publicly or privately owned, must have either a highway license or an OHV sticker issued by the California Department of Motor Vehicles (DMV)5. Most ‘street legal’ four-wheel drive vehicles will have a highway license, while specialty vehicles used as dedicated OHVs have a sticker. OHV registration stickers cost $52 per vehicle and are valid for a two-year period. There are two types of sticker issued, indicating whether the vehicle is certified to California’s OHV emissions standards or not. A red sticker is issued to non-compliant vehicles of 2003 year model and newer; all other OHVs get a green sticker (including older non-compliant vehicles). Vehicles with a red sticker are only permitted to use state recreational vehicle areas (SVRAs) on a seasonal basis. Enforcement efforts ensure that all vehicles operated on public lands are registered appropriately is conducted by California State Parks, the Forest Service and the Bureau of Land Management.
For this study, trends in OHV registration were reviewed using data sourced from the DMV. The DMV does not produce its own reports about OHV registration, but provides data to other state agencies for analysis. Two state agencies provided vehicle registration data for this study: the Off-Highway Motor Vehicle Recreation Division of California State Parks (OHMVR) and the California Energy Commission (CEC). A third agency, the California Air Resources Board (CARB) also provided data for the year 2013, to help reconcile discrepancies in vehicle counts between the other two sources. Trends within each dataset shall be discussed in turn, as well as a discussion of differences between them.
3.1.1 Vehicle Registration Data Provided by OHMVR The data provided by OHMVR was a series of annual snapshots of the OHV registration database on or about May 31 of each year from 2008 to 2013. The 2014 report is provided as an example in Appendix A. These annual snapshots are a static view of the database at a similar part of the season, allowing for tracking of trends over time. Each report gives a breakdown of OHV registration by county and by broad vehicle category: motorcycle, 3 or 4 wheel motorcycle (ATV), snowmobile, and others. The data is further categorized into active and inactive registrations. An ‘active’ registration means vehicles with an unexpired OHV sticker at the time of the report, and ‘inactive’ means previously registered vehicles with an expired OHV sticker. All OHV registrations expire annually on June 30, so the June 1 reports include all vehicle registrations that are about to expire. In addition, OHMVR staff provided the active OHV registration totals for 2006 and 2007. Figures 1 and 2 show active and inactive OHV registrations.
5 Registration of off highway vehicles is governed by California Vehicle Code Division 16.5.

21
Figure 1. Active OHV registrations (OHMVR)
Figure 2. Inactive OHV registrations (OHMVR)

22
Active registrations grew from 1,013,863 in 2006 to 1,135,919 in 2008, where they peaked. Since that year, active OHV registrations have declined 23%, totaling 879,752 in 2014. Out of state vehicles represent about 1% of OHV active registrations each year. The basic mix of vehicle types is evident from these charts—the majority of OHVs are ATVs and motorcycles, comprising about 85-90% of active registrations in any given year. Trends in the total population of vehicles are also evident.
Meantime, inactive registrations increased, indicating that many people may have not renewed their registrations. The year 2008 was the beginning of the economic recession, which may explain these paired trends. Inactive registrations grew from 300,596 in 2008 to 501,191 in 2011 when they peaked, a difference of about 200,000. Inactive registrations have been declining since then, indicating that some people may have been re-registering their OHVs as the economy recovered. There were 377,707 inactive registrations in 2014, so perhaps some 125,000 have been re-activated. Out of state OHVs represent 4% to 6% of inactive registrations each year.
Even with inactive registrations declining, the total number of active registrations is still in a long-term decline. This could be due to fewer people registering new vehicles during the recession. It may be too soon to see whether vehicle sales will pick up to return California’s active registered OHV population to its historic high in 2008. This issue shall be discussed further in Section 5.1.1.
3.1.2 Vehicle Registration Data Provided by CEC CEC is responsible for monitoring energy consumption by motorized vehicles in California. In order to perform this duty, the DMV provides CEC with a full copy of its registration database twice annually, on October 1 and April 1. The April data is used to update the October data in order to produce complete registration counts for a yearlong period. For instance, about 10% of vehicles that are classified as ‘pending’ in October have completed the registration process by April and can be added back in and counted as ‘active’ in April (Eggers 2015). Rather than a snapshot at a single point in time, as available to OHVMR, CEC has access to the entire DMV database and produces comprehensive registration counts representing a full year.
In order to estimate energy usage, CEC needs to know more specifics about registered vehicles, such as engine size and whether it is four wheel drive, than are collected by DMV during vehicle registration. Therefore CEC processes the raw DMV data using vehicle identification number (VIN) numbers to identify vehicle characteristics. Each VIN encodes the manufacturer, make, and model of the vehicle, allowing CEC to identify the exact engine and pollution system for each vehicle. For example the broad vehicle classifications used by the DMV, such as ‘pickup’ are refined into more specific categories such as ‘standard’ or ‘heavy’, based on the vehicle weight. The vehicle classification system used by CEC is shown in Appendix B.
For this study, CEC provided OHV registration data from 2010 to 2014. For each year, the total OHV population was categorized by county, vehicle body type (dirtbike, motocross, three- wheeler, etc), and type of registration sticker (green or red). Data was also provided for two types of ‘street legal’ vehicles that are likely to be used as OHVs: motorcycles and four-wheel drive vehicles (4WD). Motorcycle and 4WD registration data was categorized by county and vehicle body type, allowing for comparisons among motorcycles and OHVs. Thus this data allowed for a

23
much more detailed analysis of trends among OHVs and other types of vehicles used for recreation on public lands.
An important issue with the CEC data is that the data cleaning process results in somewhat lower vehicle counts than the raw DMV data. This is because the VIN matching program used by CEC is not capable of identifying 100% of the VINs registered with DMV. There is some expected level of error due to typos, but for the most part error is due to unknown manufacturers or models. This is especially an issue with OHVs, which have a wide range of budget manufacturers that may not be registered with California pollution control. Therefore OHV counts were expected to be lower in the CEC data, compared to the OHVMR data.
Figure 3 shows CEC data for active OHV registrations by vehicle category. A trend of declining OHV registrations is evident, from 822,465 in 2010 to 723,573 in 2014, a percent change of -12%. As noted in the previous section, these counts are lower than active OHV counts in the DMV snapshot data provided by OHMVR. For instance, in that data California’s OHV population was estimated to be 879,752 vehicles, about 22% higher than CEC estimates. The most likely reason for this discrepancy is a loss of information from failure to match VIN codes.
Figure 3. Active OHV registrations (CEC)
A changing OHV mix is evident in Figure 3. The majority of vehicles (91%) were ATVs and motorcycles in 2010, but only 87% in 2014 due to the rising popularity of utility and side by side vehicles in this timeframe. Side by sides nearly tripled from 7,000 in 2010 to 19,500 in 2014, while utility vehicles grew from 28,000 in 2010 to 32,000 in 2014. The population of all other vehicle types declined, most significantly ATVs and motorcycles, which fell from 400,457 and 344,213 in 2010, to 344,821 and 288,023 in 2014, respectively.

24
CARB Counts OHMVR counts CEC counts 2013
3.1.3 Vehicle Registration Data Provided by CARB The researchers contacted a third California state agency which deals with DMV data, the California Air Resources Board (CARB), to help reconcile the discrepancy in vehicle counts between OHMVR and CEC data. Similar to CEC, CARB staff have developed a ‘VIN decoder’ to convert raw DMV data in order to gather detailed information about OHVs, such as body type, model and engine size. Staff have only recently begun developing the capacity to do this, and so only had results available for the year 2013. However that enabled a comparison to be made among three sources of OHV registration data, shown in Table 2.
Table 2. 2013 OHV vehicle registration data from OHMVR, CEC, and CARB
Active Inactive Active Inactive Active
Motorcycle 334,419 170,802 350,324 194,079 299,313
ATV 327,679 146,577 422,569 177,613 356,452
All others 65,678 18,510 113,419 54,681 69,558
Snowmobile 18,138 6,374 19,792 8,581 17,376
Total 745,914 342,263 906,104 434,954 742,699
Table 3. OHV estimates from CEC and CARB compared to those from OHMVR
Table 3 shows a calculation of the difference between OHV estimates provided by OHMVR, and those provided by CEC and CARB. It can be seen that the CARB estimates were closest to CEC estimates. CARB staff offered several reasons that both of these estimates might be lower than the raw DMV data provided by OHMVR (George, 2015):
• Misclassification of vehicle type (e.g. denoted as on-road motorcycle but should have been off-highway motorcycle)
• Rise of dual sports vehicles and lack of clarity surrounding their designation • Difficulty in distinguishing between body types of 4-wheeled vehicles (ATV, UTV/SXS,
dune buggy, golf cart, etc.) • Increase in the number of Chinese manufacturers in recent years with inconsistent VINs
CARB Counts CEC counts 2013
Active Active
Motorcycle ATV
-5% -29%
-17% -19%
All others -73% -63%
Snowmobile -9% -14%
Total -21% -22%

25
• Lack of accessible information regarding VIN format for small manufacturers
To improve their results in future years, CARB staff are in the process of obtaining the Motorcycle Industry Council’s model attribute matrix (MAX) to help with identifying vehicle characteristics and designations that may change between model years (George, 2015).
3.1.4 OHV Registrations by sticker type
The majority of registered OHVs have green stickers (89-92%), as shown in Figure 4. Although the overall number of OHVs with red stickers has declined from 83,694 in 2010 to 80,568 in 2013, they have slightly increased as a proportion of the OHV population, as the overall population shrinks. This trend is illustrated in Figure 5. Figure 6 shows registered OHVs in 2014 by body type. It can be seen that the most popular type of OHV is the ATV, which was 48% of OHVs in 2014. It is followed by two-wheeled vehicles: motocross bikes, trail and dirt bikes, and enduro bikes. Motorcycles were the most likely type of OHV to have a red sticker. For example, over half of motocross motorcycles (56%) were issued red stickers.
Figure 4. OHV registration trend by sticker type (CEC)

26
Figure 5. OHV red sticker registration trend (CEC)
Figure 6. OHV registrations by vehicle body type and sticker type (CEC)
3.1.5 OHV Registrations by County
The population of OHVs tends to be higher in areas near state OHV recreation areas (SVRAs). Figure 7 shows 2014 OHV registrations by body type and by county. In 2014, Los Angeles county had the highest number of OHVs in the state (46,074), nearly twice as many as the next highest county, San Diego County (23,654). In 2014, 858 OHVs registered out of state were issued stickers, outnumbering OHV registrations in fifteen counties.
27
Figure 7. OHV registration by county (CEC)

28
3.1.6 Motorcycle registrations
Many of the vehicles using public lands available for OHV use are not specially registered as OHVs, but as ‘street legal’ motorcycles, trucks or cars. Use of OHV areas by these highway- registered vehicles is more difficult to assess, as they do not require a sticker or other method of tracking use. Motorcycles are the most likely vehicles to be used as OHVs without being registered as OHVs.
Figure 8 show motorcycle registrations for the most recent years available, 2010 to 2014. A trend of increasing motorcycle registrations is clear over this timeframe. In 2010 there were 758,539 motorcycle registrations, but this number increased to 816,187 in 2014, growth of 8%. About .4% of annual motorcycle registrations are for four wheel vehicles such as ATVs and dune buggies, either erroneously or because these vehicles meet highway licensing standards.
Figure 8. Motorcycle registrations by vehicle category (CEC)
This trend of increasing motorcycle registrations may be related to the trend of decreasing OHV registrations. It could be that people are increasingly registering motorcycles for highway use, rather than as dedicated OHVs. From 2010 to 2014, the total population of motorcycles in California has been stable with approximately 1.1 million registrations overall. However, the

29
proportion of motorcycles registered as OHVs to ‘street legal’ motorcycles has changed. In 2010, 31% of motorcycles were registered as OHVs, but this proportion declined to 26% by 2014. The number of motorcycle OHV registrations declined by 56,191 over this timeframe while the number of motorcycle registrations increased by a similar amount, 59,659. Many of these motorcycle registrations may have simply changed registration status from OHV to motorcycle, in order to become ‘street legal’ rather than dedicated OHVs.
The proportions of motorcycles by body type is relatively stable over time. Figure 9 shows 2014 motorcycle registrations by body type. The most popular type of motorcycle is the road/street motorcycle, followed by racers, motor scooters, and road/trail bikes. Road/street motorcycles account for approximately 60% of annual motorcycle registrations, and racers for 14%. Of motorcycle body types, the most likely to be used as OHVs are road/trail bikes, enduro, dirt, and motocross bikes, which together accounted for about 10% of the ‘street legal’ motorcycle population, or roughly 90,000 vehicles. The only notable change in proportion of body types over time was the growth of enduro cycles from 2.6% of motorcycles in 2010 to 3.9% in 2014. Notably, are often used as OHVs.
Figure 9. Motorcycle registrations by body type, 2014 (CEC)
30
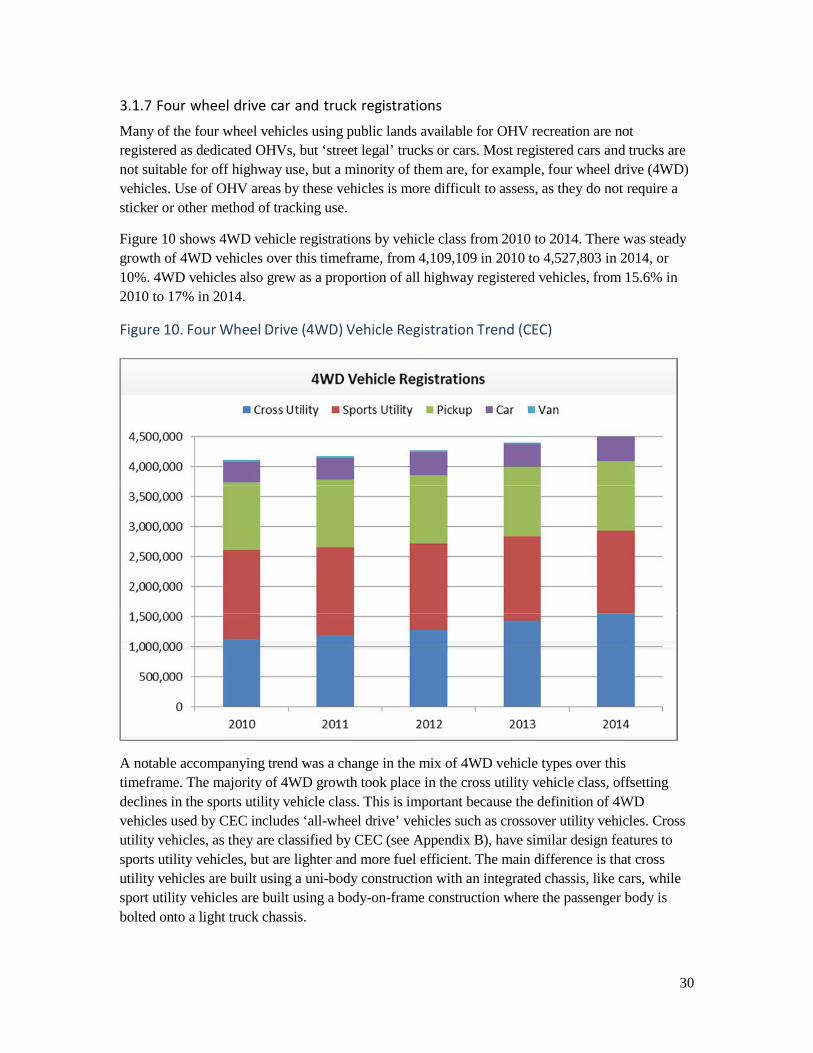
3.1.7 Four wheel drive car and truck registrations
Many of the four wheel vehicles using public lands available for OHV recreation are not registered as dedicated OHVs, but ‘street legal’ trucks or cars. Most registered cars and trucks are not suitable for off highway use, but a minority of them are, for example, four wheel drive (4WD) vehicles. Use of OHV areas by these vehicles is more difficult to assess, as they do not require a sticker or other method of tracking use.
Figure 10 shows 4WD vehicle registrations by vehicle class from 2010 to 2014. There was steady growth of 4WD vehicles over this timeframe, from 4,109,109 in 2010 to 4,527,803 in 2014, or 10%. 4WD vehicles also grew as a proportion of all highway registered vehicles, from 15.6% in 2010 to 17% in 2014.
Figure 10. Four Wheel Drive (4WD) Vehicle Registration Trend (CEC)
A notable accompanying trend was a change in the mix of 4WD vehicle types over this timeframe. The majority of 4WD growth took place in the cross utility vehicle class, offsetting declines in the sports utility vehicle class. This is important because the definition of 4WD vehicles used by CEC includes ‘all-wheel drive’ vehicles such as crossover utility vehicles. Cross utility vehicles, as they are classified by CEC (see Appendix B), have similar design features to sports utility vehicles, but are lighter and more fuel efficient. The main difference is that cross utility vehicles are built using a uni-body construction with an integrated chassis, like cars, while sport utility vehicles are built using a body-on-frame construction where the passenger body is bolted onto a light truck chassis.

31
While nearly all sports utility vehicles are equipped with four wheel drive and high clearance, cross utility vehicles offer consumers a choice of front-, rear-, or all-wheel drive and usually low clearance. As a result, while most sports utility vehicles could potentially be used as OHVs, this cannot be said of cross utility vehicles. Cross utility vehicles may have all wheel drive, but they handle like a car and are capable of only light off-road driving. There is considerable variation in cross utility vehicle design, with many similar to sport utility vehicles with high clearance, for example Ford Escape and Toyota RAV4, and others more similar to station wagons, with folding seats and a rear liftgate, for example Subaru Legacy or Toyota Matrix.
3.1.8 Alternative fuel vehicles
The CEC data provided information about fuel type for only one vehicle category—motorcycles. There may be some 4WD vehicles using alternative fuels, but to date none are electric. There may be many dedicated OHVs using alternative fuels, for example golf carts and motorcycles, but the researchers were not provided with this information. Therefore, in this report, assessment of trends in alternative fuel use were limited to trends among ‘street legal’ motorcycles.
The vast majority of motorcycle registrations are for gasoline or diesel powered vehicles which pay the state gasoline tax. As shown in Table 4, a small proportion of vehicles (.12%) are powered by alternative fuels such as methanol, propane, butane or natural gas, or by battery. The proportion of alternative fuel vehicles was stable over the 2010 to 2014 timeframe, with some slight increase in the number of battery electric vehicles. Due to the small proportion of alternative fuel motorcycles, and the unknown factor of what percentage of these street legal vehicles are used as OHVs, alternative fuel sales not considered a significant factor affecting future fuel sale receipts for OHVs.
Table 4. Motorcycle registrations by fuel type (CEC)
Fuel type 2010 2011 2012 2013 2014 Gasoline or diesel 760,469 772,344 787,715 803,918 817,981
Methanol, propane, butane or natural gas 215 220 221 222 219 Battery electric vehicles 604 614 686 751 753 Percent alternative fuel 0.11% 0.11% 0.12% 0.12% 0.12%
3.3 SVRA OHV Area Attendance Trends (2006-2014)
There are eight off-highway state vehicle recreation areas (SVRAs) operated by the Off-highway Motor Vehicular Recreation (OMVHR) Division of California State Parks. Each SRVA provides services such as trails, campsites, restrooms and water facilities, and educational activities. SVRAs are located in the following counties:
• Carnegie; Alameda and San Joaquin counties • Clay Pit; Butte County • Heber Dunes, Imperial County • Hollister Hills; San Benito County

32
• Hungry Valley, Los Angeles and Ventura counties • Oceano Dunes; San Luis Obispo County • Ocotillo Wells; San Diego County • Prairie City; Sacramento County
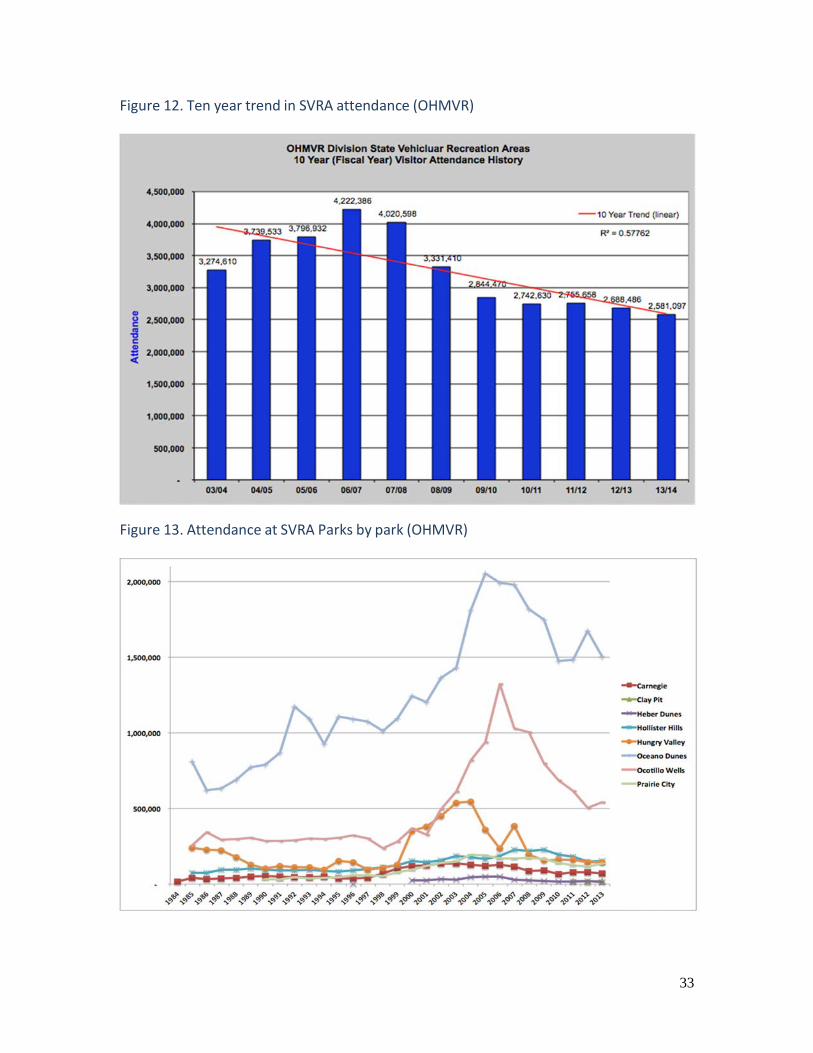
The total attendance at SVRAs from 1985 to 2013 is shown in Figure 11, using data provided by OMVHR. It can be seen that the parks experienced tremendous growth in visitation from 1999 to 2007, when the number of annual visitors peaked at 4.09 million. Attendance then declined from 2008 to 2010, and since then has leveled off at about 2.7 million visitors per year. Looking at just the past ten years, there is a clear trend of declining attendance at SVRAs, as shown in Figure 12.
When the attendance data are broken down by the individual parks, a more nuanced picture of this trend emerges. As shown in Figure 13, the growth and decline trends in attendance were driven by spikes at the two most heavily visited parks, Oceano Dunes and Ocotillo Wells, and to a lesser extent, Hungry Valley. Attendance at the other SVRAs has been relatively stable over time, ranging from 25,000 to 225,000 visitors per year.
Figure 11. Attendance at SVRA Parks (OHMVR)
33
Figure 12. Ten year trend in SVRA attendance (OHMVR)
Figure 13. Attendance at SVRA Parks by park (OHMVR)

34
3.3.1 Method of Measuring Attendance at SVRAs
Attendance at SVRAs is estimated by counting the number of vehicles entering the park, multiplied by a conversion factor representing vehicle occupancy. A recent study by researchers a the California State University at Sacramento reviewed the methodology and conversion factors used by OHMVR and found that they systematically over-estimated attendance by up to 20%. (CSUS 2014, page 44) The main reason was that vehicle occupancy has decreased over time since the conversion factors were first introduced in 19966 (CSUS 2014, page 21). The report recommended that new conversion factors be adopted to more accurately estimate visitor attendance at SVRAs. For example, the report estimated total attendance from October 2012 to September 2013 as 2.11 million, while the OHMVR data shown in the figures estimated attendance as 2.58 million for the calendar year 2013 and 2.69 million for the fiscal year 12/13.
3.4 Federal Bureau of Land Management OHV Area Attendance Trends (2006-2014)
Most of the OHV off-road recreational areas in California are owned and managed by the federal government. The Bureau of Land Management (BLM) allows recreational OHV use at sixteen federally managed lands around California. Each of these areas contain hundreds of miles of trails, and OHV use on other open lands managed by BLM is permitted on a limited basis. Table 5 shows the fourteen BLM field offices which keep track of visitation at OHV parks and other open lands where motorized recreation is permitted.
Table 5. Bureau of Land Management Field Offices (BLM)
BLM Field Office County OHV Recreational Area
Alturas Modoc Surprise Arcata Humboldt Samoa Dunes Bakersfield Kern Keyesville Bakersfield San Luis Obispo Carrizo Plain National Monument
Barstow
San Bernardino Dumont Dunes, El Mirage, Johnson Valley,
Stoddard Valley
Bishop Inyo Poleta Eagle Lake Lassen Fort Sage, Rice Canyon
El Centro San Diego and Imperial
Imperial Dunes, Plaster City, Superstition Mountain
Hollister San Benito Clear Creek, limited access Mother Lode El Dorado Limited access
Needles San Bernardino Needles Area
6 Since 1996, attendance at SVRAs has been tracked using CA Dept of Parks and Recreation Form 449, the Monthly Visitor Attendance Report. Vehicle counts were multiplied by conversion factors representing vehicle occupancy on the form.

35
Palm Springs Riverside Desert district, Meccacopia
Palm Springs Riverside Santa Rosa & San Jacinto Mountains National Monument
Redding Shasta Chappie-Shasta OHV Area
Ridgecrest Kern Dove Springs, Jawbone Canyon, Spangler Hills
Surprise Modoc Surprise Valley Ukiah Lake,
Mendocino, Napa
Cow Mountain, Knoxville
For this study, BLM provided OHV visitor data collected by field offices from 2007 to 2015. Visitation at certain national monuments was tracked separately, namely Carrizo Plain and Santa Rosa and San Jacinto Mountains. The BLM also provided the conversion factors used to estimate the number of vehicles used by participants. The ratio of average occupancy by vehicle type was used to estimate the number of vehicles used in BLM lands, from the visitor data. For most types of OHV, an occupancy of 1 was used. The exceptions were dune buggies and racing cars/trucks/buggies, which had an average occupancy of 1.5, and cars/trucks/SUVs, which had an average occupancy of 2.5.
The total annual number of vehicles used in all California BLM lands is shown in Figure 14. In 2007, an estimated 4.1 million vehicles were used by visitors to BLM lands, and although use declined over the next couple of years, use peaked in 2010 with an estimated 4.3 million vehicles. A general trend of declining use over the next several years ended with a low usage of 2.5 million vehicles in 2014. There appears to have been a resurgence of use in 2015, as even though the year is not yet over, an estimated 3 million estimated vehicles have visited BLM lands so far.
When the data is broken down by BLM field office, the most popular areas can be seen. Over half of the vehicles used in any given year were tracked by the El Centro field office. Figure 15 shows the trend at this office, which is likely driving the overall trend. Annual vehicle counts reported by the remaining BLM field offices is shown in Figure 16.
Another way to understand changing trends in OHV use on BLM lands is by vehicle type, as shown in Figure 17. Historically, ATVs were the most popular vehicle, but use dropped off steeply from 2010 to 2014, a factor which is driving the overall trend shown in Figure 14. In recent years ATVs have been used by a declining proportion of OHV visitors. From 2014 to 2015, there appears to be a resurgence of interest in ATVs, and also motorcycles, dune buggies, and OHV racing with cars, trucks, and dune buggies.

36
Figure 14. OHV use on BLM lands (BLM)
Figure 15. OHV counts by El Centro field office (BLM)

37
Figure 16. OHV counts by other BLM field offices (BLM)
Figure 17. OHV use on BLM lands by vehicle type (BLM)

38
3.5 National Forest OHV Area Attendance Trends (2006-2014)
OHV use is permitted in the eighteen National Forests and other public lands managed by the National Forest Service in California. OHV use is unrestricted in some ‘OHV Open Areas’. In other areas, OHV use is restricted to vehicle access for outdoor activities such as hiking, hunting and fishing.
• Angeles National Forest • Cleveland National Forest • Eldorado National Forest • Inyo National Forest • Klamath National Forest • Lake Tahoe Basin Management Unit • Lassen National Forest • Los Padres National Forest • Mendocino National Forest • Modoc National Forest • Plumas National Forest • San Bernardino National Forest • Sequoia National Forest • Shasta-Trinity National Forest • Sierra National Forest • Six Rivers National Forest • Stanislaus National Forest • Tahoe National Forest
An estimated 23.43 million people visit these National Forests in California each year (Forest Service 2015). Approximately one-third of visitors (5.51 million) report participating in one or more of six motorized activities during their visit, as shown in Figure 18. The most common activity is driving for pleasure, followed by OHV use and motorized trail activity. When visitors were asked to report the main activity they engaged in during their visit, OHV use was reported as the main activity by nearly 400,000 National Forest visitors in total (1.7%).
When the data is broken down by National Forest, some areas emerge as far more popular for OHV use. As shown in Figure 19, San Bernardino National Forest is used by over 265,000 visitors for OHV activities annually, followed by Angeles National Forest with over 155,000. On the other hand, several areas see hardly any OHV use, including Six Rivers, Klamath, and Modoc National Forests. The majority of National Forest areas attract 10,000 to 50,000 OHV users per year, far fewer than California’s SVRAs.
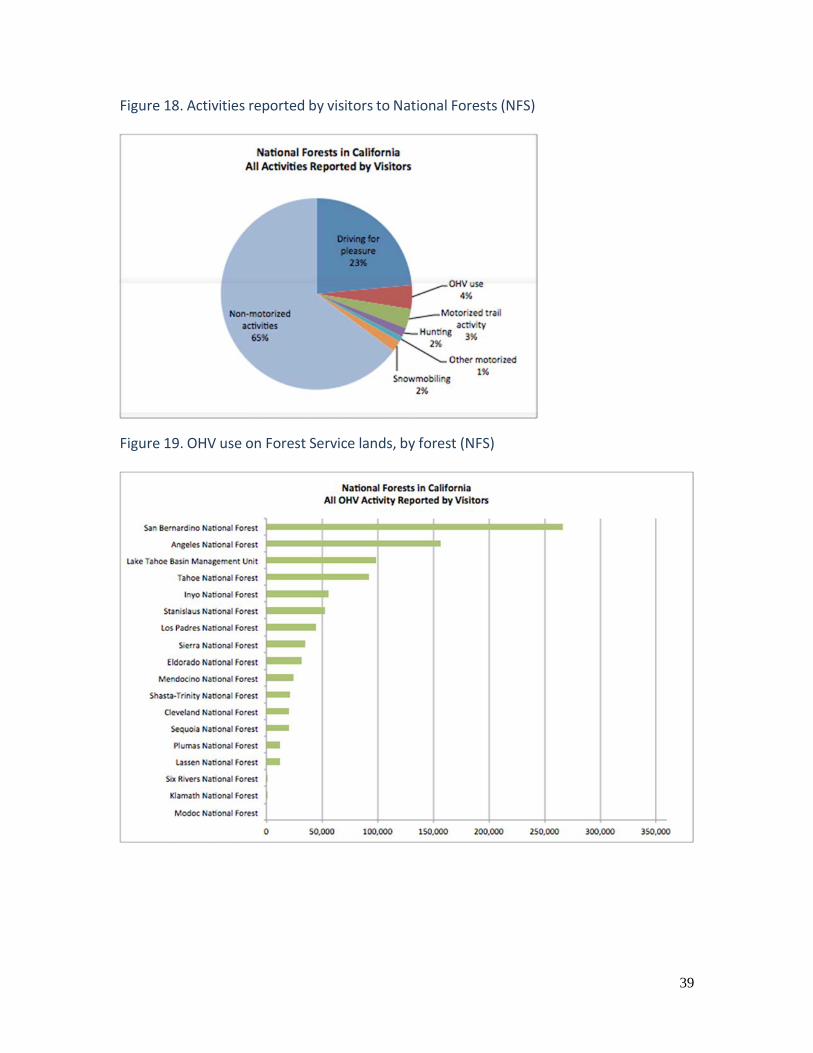
39
Figure 18. Activities reported by visitors to National Forests (NFS)
Figure 19. OHV use on Forest Service lands, by forest (NFS)

40
3.5.1 Method of Measuring Attendance at National Forests
The National Forest Service conducts a monitoring program called the National Visitor Use Monitoring (NVUM) program7. Data is collected at each area around the U.S. using a standardized sampling and interview procedure, in five-year cycles. This means the NVUM is being conducted on a rolling basis at all times, scheduled for each National Forest once every five years. Monitoring involves collecting both vehicle counts and sampling visitors for a voluntary 16-question survey. The survey asks visitors about their activities, spending, and satisfaction, and records demographic information. Monitoring results are considered to be high quality because survey procedures are standardized across sites, and all interviewers must participate in a training. However, data is not available on an annual basis to track trends over time.
3.6 Consideration of County and Municipal OHV areas
Several local governments own and operate OHV parks in California. Some of these provide trails similar to the state and federal lands, but some are racing tracks designed to host for motorcycle and dirt bike competitions. Visitor data from these locations was not available for inclusion in this study.
• Tulare Cycle Park; City of Tulare • Porterville OHV Park; City of Porterville • Glen Helen OHV Park; San Bernardino County • Park Moabi; San Bernardino County • Motorcycle County Park; Santa Clara County • Frank Raines Park; Stanislaus County • La Grange Park; Stanislaus County
7 More information about how the survey is conducted and the questionnaire are available online, http://www.fs.fed.us/recreation/programs/nvum/.

41
Section 5.0: Future Outlook 5.1 Cyclic OHV use patterns based on economic conditions
5.1.1 Post-recession recovery OHV sales and use are linked to the economic cycle. Under favorable economic conditions, when people have more disposable income, OHV sales and use rise. They fall when economic conditions are poor, as in the high unemployment and low wage rate during the Great Recession caused by the global financial crisis of 2007-2008, and the subprime mortgage crisis of 2007- 2009. Data from this analysis illustrates this cycle, with OHV use increasing steadily from the early 2000s and 2007, and decreased then decreasing rapidly.
An analysis of OHV sales trends by the California Air Resources Board found a correlation with the trend in new housing starts, a commonly used indicator of favorable economic conditions. As stated in the report, “Specifically, staff found there is a good correlation between historical annual vehicle sales data [for off-road motorcycles] in California (based on 2000 to 2010 DMV data) with historical nationwide new housing starts over the same period” (CARB 2013). Using data on new housing starts obtained from the 2012 UCLA economic forecast and data on off-road motorcycle sales provided by the Motorcycle Industry Council, CARB staff first checked the correlation with a backcast, and then developed a model to forecast future OHV population growth, called RV2013. Their results are shown in Figure 20.
Figure 20. Comparison of off-road motorcycle sales data (MIC) with OHV population forecast (RV2013) (Source: CARB 2015)
In Figure 20, the population of off-highway motorcycles shown from 2000 to 2010 is based on actual DMV registration data, while the population for calendar years 1999 to 1990 was backcasted from 2000 using assumed vehicle survival rates. Note that CARB’s RV2013 backcast fits the MIC sales data fairly well. The forecasted population of off-highway motorcycles begins in the year 2011. Sales were projected to recover along with the economy, rapidly increasing to

42
pre-recession levels from 2011 to 2015, and then leveling off to a steady rate of growth based on historic population growth trends. The analysis concluded, “By 2014, we estimate the total population of OMCs operating in California will start to grow again as new vehicle sales driven by a recovering economy and human population growth outpace fleet attrition.” (CARB 2013)
Given that we now have data for the years 2011 to 2014, a comparison may be made in order to determine whether this trend has turned yet. Sales data for off-highway motorcycles or other OHVs was not available for this study, but we do have registration data. Registration trends are not be a complete and accurate reflection of sales trends, as OHVs may be purchased but not registered. However registration data should serve as an adequate proxy to determine whether ‘the tide has turned’ in terms of OHV use. Figures 21 and 22 show OHV registration data from the two sources provided for this study, by vehicle type8. In both data sources, the trend for off- highway motorcycle registrations, along with ATVs, is still in a decline from 2010 levels. This evidence does not support CARB’s prediction that the recovery would be underway by 2014. Evidence that OHV sales and use have begun to recover from a downturn during the economic recession is still lacking.
Figure 21. Active OHV registrations (OHMVR)
8 The data in these two figures is exactly the same as in Figure 1 and 3, but displayed in a different format.

43
Figure 22. Active OHV registrations (CEC)
5.1.2 Fuel prices Another potential factor affecting use patterns for OHVs and other types of recreational vehicles is the price of gas. As gas prices increase, so does the cost of operating an OHV. Over time, rising gas prices could be expected to have a suppressive effect on OHV sales and use. According to the US Energy Information Administration (EIA), the price of regular conventional gasoline has been steadily increasing from 2000 to 2015, with prices spiking in 2008 and then dropping in 2009. (EIA 2015) In Figure 23, EIA gas price data is compared to the registration trend for OHVs using data from the OHMVR. Registration trends are not be a complete and accurate reflection of use trends, as OHVs may be used be used without being registered. Registration data merely offers a method of checking for a correlation between these two trends.
No clear correlation between fuel prices and OHV registration is evident. From 2010 to 2012, when gas prices climbed, OHV registrations declined, which we might expect. Yet in other periods, the trends mirror each other, which is the opposite of what we expect. From 2006 to 2008, OHV registrations were increasing and so were gas prices; when gas prices declined in 2009 and from 2012 to 2014, so did OHV registrations. Therefore fuel prices are not expected to be a major factor suppressing or increasing OHV use.

44
Figure 23. Average Weekly Retail Price for Regular Conventional Gasoline on the West Coast (Dollars per gallon) (EIA)
5.1.3 Alternative fuel vehicles
One interesting innovation that may affect the design of OHVs in the future is the market addition of the electric OHV. The ‘Zoom’ 4WD vehicle has been available in Sweden, Spain, Italy, The Netherlands, Finland and Germany for approximately three years (Coxworth 2015). It contains two 48-volt lithium-iron-phosphate batteries provide power to four 1,000-watt hub motors, and the vehicle needs to be charged before use for several hours. It has also been made available to wounded US Army veterans via the The Independence Fund, a company launching a network of independent US sales representatives. The company also plans on expanding into other markets in the next couple of years (Coxworth 2015). While other electric OHVs have been available on the market, such as UNiMO, HexHog, Ziesel and Tomahawk, the Zoom is much more agile and less ‘tank-like’ than its predecessors (Coxworth 2015). These and similar OHVs have the potential to gain popularity in the OHV market, decreasing gasoline sales.
5.2 Growth of OHV users
5.2.1 OHV User Traditions There is a longstanding tradition among OHV users where families raised on OHVs tend to continue to use and raise their own kids on OHVs. For some, it is a family sport tradition that is passed down generation to generation, for example as illustrated on the cover of the 2014 OHMVR Commission Report. From an anthropological perspective, this ‘culture’ of OHV use is also closely tied to specific geographic areas in California, mainly rural and suburban areas near public lands. Unfortunately, academic literature is lacking, and there have been no studies to date—either quantitative surveys or qualitative oral history interviews—that attempt to measure

45
1) the current number of families engaged in OHV activity and 2) where geographically the majority of such users live and 3) the strength of ties between generations that pass on this tradition.
Until better information can be collected and analyzed with regard to this cultural phenomenon and how it affects future OHV use trends, more general inter-generational and demographics must suffice for estimating next generation OHV users.
5.2.2 Demographic shifts A national study of OHV users conducted by the US Forest Service described OHV recreational use, users, and trends. The report estimated there were 43 million OHV participants per year 1999 and 2007, an average of 18.6 percent of the U.S. population. It noted that “most participants have been and continue to be under 50, male, white and urban,” but that the composition may be changing over time (Forest Service 2008). In California, an estimated 17.6% of the population was estimated as participating in OHV recreation. American Indians had the highest participation among racial and ethnic groups (31%), with the lowest being Hispanics (14%) and Asian/Pacific Islander (11%). Middle income families (over $50,000) participated at higher rates (23 to 27 percent) than the lowest income class (12%).
The report also identified five ‘market segments’ of OHV users with similar demographic and recreational activity profiles. These OHV user segments were labeled as: Middle of the Roaders (27%), Middle Age Actives (24%), Young Adventure Seekers (24%), Upper Middle Class Nature Lovers (19%), and Seniors (7%) (Forest Service 2008). With an average age of 19, the young adventure seekers may most accurately reflect the future of OHV users. This group was lower income, but more racially diverse than all the others. The group with the second-lowest average age was middle of the roaders, at 32; this group was more likely to participate in family-oriented activities. About half of OHV users were in the other three groups, which had average ages of 43, 54, and 70, respectively. Therefore future growth depends most heavily on the younger groups.
Some attendance surveys at state and federal lands allowing OHV use have collected demographic information about OHV users. In 2014, an attendance study at California SVRA parks showed that the majority of OHV users were between 35-50 years old and male. (OHMVR 2014) Data from a more recent US Forest Service Report corroborated these findings. The report found that 64.4% of visitors to Forest Service OHV parks in the Pacific Southwest Region were male, and 35.6% of visitors were female. (USDA Forest Service 2015) Information about race, ethnicity, and age was also collected. The report found that 92.7% of visitors were Caucasian, 13.6% of visitors were Hispanic/Latino, 4.4% Native American, 4.1% Asian, 1.5% African American, and .9% were Hawaiian/Pacific Islander. In addition, the majority of users were between the ages of 30 and 60 (50.5%), with 17.8% of visitors under the age of 16.
This demographic user profile contrasts with demographic growth trends in the State of California. Historically, California’s population has grown steadily at a rate of approximately 1.2% per year. Since 1980, growth of the Hispanic/Latino population has accounted for two thirds of California’s population growth. As of early 2014, California is the first large state and only the third overall (after Hawaii and New Mexico), without a white, non-Hispanic plurality. The

46
Hispanic population is now the largest race or ethnic group in the state, with a population of over 15 million or 39 percent of California’s population; the white non-Hispanic population is just under 15 million (38 percent). Asians are the third largest race or ethnic group in California at over 5 million (13 percent) (Governor’s Budget Summary 2014-2015). The majority of this population group arrived in the US as new immigrants prior to the year 2000. It is important to note that while no studies have been done specifically looking at the tendency of new immigrant families to use OHVs, some studies have shown that immigrants have a lower level of auto use than US born residents even when controlling for socioeconomic characteristics and time in the US (Chatman et al. 2013).
5.2.3 Millennials Another rapidly growing demographic is young adults. Currently, the largest five-year cohort in California and in the U.S. is the 20 to 24 year-old age group, known as the ‘Millennials.’ (Governor’s Budget Summary 2014-2015). The ‘Millennial’ generation (also known as Generation Y), born between 1980 and 2000, is currently exhibiting different travel behavior than previous generations. As they are the largest generation since the baby boomers, understanding their different demographic characteristics and emerging travel behavior is key to forecasting future travel demand and OHV use. A study using data from the National Household Travel Survey (NHTS) revealed that Millennials are living with their parents longer, obtaining their driver’s licenses at older ages, and substituting long commutes with social media and telecommuting (Polzin et al. 2014). Similar studies have been conducted in Australia, Canada, Japan, South Korea, Sweden, and the United Kingdom, confirming that in every country, the Millennial generation is much less likely to learn to drive, own a car, and drive as much as previous generations (Davis et al., 2012; Delbosc and Currie, 2013; Kuhnimhof et al., 2012; Sivak and Schoettle, 2011; and Van Der Waard et al., 2013).
In addition to different travel behavior, the Millennial generation also possesses a different outlook on energy consumption and usage and show a market preference for ecological choices (Hopkins and Stephenson 2014). Millennials may show a low interest in purchasing OHVs due to the recreational nature of their fuel consumption as well as their impacts on air quality, wildlife habitat, vegetation quality and soil and watershed quality (Eubanks 2014; Ouren et al 2009).
Although no studies have directly assessed the correlation between the demand for OHV recreational activity among Millennials, their travel attributes and market preferences do not seem to favor OHV use. It is possible that as the current generation of OHV users ages, they will not be replaced by Millennials and interest in OHVs may decline.

47
Section 6.0: Conclusions
This report reviews the current methodology used for estimating the fuel tax transfer for the OHV Trust Fund in California. In addition, the report assessed recent trends in OHV attendance and registration OHMVR and CEC data to make recommendations for the State of California Department of Transportation in terms of the fuel tax transfer estimates.
In short, UCTC finds that the 2006 ICF International study is far superior than the Tyler and Associates study completed in 1990, due to the fact that is based on more recent data, and the methods are more rigorous. The 1990 Tyler and Associates report scored ‘mediocre’ in terms of research design and internal validity, and only ‘fair’ with respect to range and soundness of data examined, according to our assessment parameters.
This 2015 report also confirms that the way in which data has been classified by the DMV masks the way in which street-licensed/street-legal vehicles have been counted and used. The count methodology was flawed in the 1990 study, as some vehicle classifications were conflated and not categorized with a sufficient degree of detail. In addition, there was a major decrease in the unregistered to registered ratio of OHVs, and additional a decrease in fuel use per vehicle for unregistered OHVs from 1990 to 2006. Both of these factors tended to over-estimate the amount of fuel use by OHVs, and thus the amount of tax transfer to the OHVTF. According to the 2006 study, highway registered vehicles now use the most fuel, followed by registered non-highway registered vehicles. This was attributed to 1) the significant drop in unregistered to registered ratio of vehicles, 2) the correct classification of ATVs, and 3) reduced fuel use per vehicle for unregistered vehicles.
In addition to these key findings, new vehicle registration data from the OHMVR and CEC illustrates that OHV vehicle registration is not as popular as it once was. Vehicle registration counts for OHVs have been in decline since the economic recession began in 2008, and have not yet begun to increase again as the economy recovers. In addition, recent visitor attendance data from the Bureau of Land management (BLM) parks and the State Vehicle Recreation Areas (SVRAs) illustrates that attendance at OHV parks has also been trending downward. The declining attendance trends for OHV use on state and federal lands is not surprising, give the OHV registration trend. However, ‘driving for pleasure’ in highway licensed vehicles was one of the most popular activities and supports the 2006 finding that the majority of fuel use for off- highway recreation is by highway-registered vehicles. Indirect fuel use for the purpose of accessing recreation opportunities is estimated to be the majority of off-highway use, rather than directly by OHVs.
Two new trends were found in the CEC vehicle registration data. First, the proportion of motorcycles registered as OHVs rather than ‘street legal’ motorcycles has been declining. This trend has significant implications for fuel usage, as OHV motorcycles use nearly five times as much fuel as highway registered motorcycles for off-highway recreation annually. Secondly, the proportion of 4WD vehicle registrations has been increasing. However this does not necessarily mean that fuel use by 4WD vehicles for off-highway recreation is increasing. The majority of 4WD growth took place in the cross utility vehicle class, offsetting declines in the sports utility
48
vehicle class. Cross utility vehicles may have all-wheel drive, but they have a car body, lack high clearance, and are capable of only light off-road driving. More research is needed to update the model to account for the rise of cross utility vehicles.
The economic recession is the most likely reason that OHV registrations and use have been in decline. OHV sales and use are linked to the economic cycle. Under favorable economic conditions, when people have more disposable income, OHV sales and use rise. It is expected that OHV use will increase as the economy recovers, yet it is not yet evident that that OHV sales and use have begun to recover from a downturn.
The future outlook for OHV users depends on the youngest user groups, which account for about half of all users. However the traditional demographic of OHV users does not match the demographic growth trends of California, with the most rapid growth is among racial minorities with low rates of OHV use. Similarly, the largest generation of young people (Millennials) have much lower rates of driving and car ownership than previous generations. It is unclear whether new OHV users will replace those who age out at a sufficient rate to maintain past OHV user growth trends.
Overall, we find that the 1990 fuel tax estimation methodology is problematic and systematically overestimates the amount of fuel used by OHVs. The amount of error in the fuel tax transfer has only increased over the past ten years, based on the trends found in this 2015 report.

49
Works Cited
Chatman, Dan, “Why do Immigrants Drive Less? Confirmations, complications and new hypothesis from a qualitative study in New Jersey, USA” Transport Policy 30: 336-344, 2013.
Coxworth, Ben. “Electric 4WD vehicle allows users to "Zoom" off-road.” Gizmag, February 13th, 2015 <http://www.gizmag.com/zoomability-zoom-off-road-wheelchair/36082/>
CSUS, “Attendance Study 2012-2013,” California State University at Sacramento for the Off- Highway Motor Vehicle Recreation Division of the California Department of Parks & Recreation, August 2014.
Davis, B., Butzik, T. and Baxandall, P, “Transportation and the New Generation: Why Young People are Driving Less and What it Means for Transportation Policy.” Frontier Group: USA. 2012.
Delbosc, A. and G. Currie, “Causes of Youth Licensing: A Synthesis of Evidence”, Transport Reviews, 33: 271-290, 2013.
Egger, Ryan, California Energy Commission. Personal interview, September 17, 2015.
Energy Information Administration (EIA), “Gasoline and Diesel Fuel Update,” historic data http://www.eia.gov/oil_gas/petroleum/data_publications/wrgp/mogas_history.html, November, 2015.
Eubanks, Ellen, and Thomas Biebighauser, “Restoration of Forests, Grasslands, and Wetlands Damaged by Off-Highway Vehicles”, US Department of Agriculture, Forest Service, National Technology and Development Program: San Dimas, California, 2014.
Forest Service, “National Visitor Use Monitoring Report for the Pacific Southwest Region: National Forest Motorized Recreational Vehicle Use,” US Department of Agriculture, Forest Service, Final Draft Report, July 2015.
Forest Service, “Off-Highway Vehicle Recreation in the United States and its Regions and States: An Update National Report from the National Survey on Recreation and the Environment (NSRE),” February, 2008.
California Air Resources Board (CARB), “Emissions Estimation Methodology for Off-Highway Recreational Vehicles,” May 2013.
California Department of Finance (DOF), “Governor’s Budget Summary”, 2014-2015.
California Department of Transportation (Caltrans), “Transportation Funding in California,” 2014.
California Department of Parks & Recreation, Off-Highway Motor Vehicle Recreation Division (OHMVR). “Attendance Study 2012-13,” August 2014.

50
California Off-Highway Motor Vehicle Recreation (OHMVR) Commission, “Off-Highway Motor Vehicle Recreation Commission Program Report”, California State Parks OHV, January 2014.
George, Kathryn. California Air Resources Board (CARB). Personal email, October 8, 2015.
Hopkins, Debbie and Janet Stephenson, “Generation Y mobilities through the lens of energy cultures: a preliminary exploration of mobility cultures”, Journal of Transport Geography 38: 88- 91, 2014.
ICF International, “Estimating the State Fuel Tax Paid on Gasoline Used in the Off-Highway Operation of Vehicles for Recreation,” California Department of Parks & Recreation Report 06- 22082-1, September 2006.
Kuhnimhof, T, R. Buehler, M. Wirtz and D. Kalinowska, “Travel Trends Among Young Adults in Germany: Increasing Multi-Modality and Declining Car Use for Men”, Journal of Transport Geography, 24: 443-450, 2012.
Ouren, Douglas, Christopher Haas, Cynthia P.Melcher, Susan C. Stewart, Phadrea D. Ponds, Natalie R. Sexton, Lucy Burris, Tammy Fancher, and Zachary H. Bowen, “Environmental Effects of Off-Highway Vehicles”, New York: Nova Science Publishers, 2009.
Polzin, Steven E., Xuehao Chu, Jodi Godfrey, “The impact of millennials' travel behavior on future personal vehicle travel”, Energy Strategy Reviews 5: 59-65, 2014.
Sivak, M and Schoettle, B. “Recent Changes in the Age Composition of Drivers in 15 Countries Report no. UMTRI-2011-43”, The University of Michigan Transport Research Institute: Michigan, USA, 2011.
Smith, Karen and Tracy Brower, “Longitudinal Study of Green Marketing Strategies that Influence Millenials”, Journal of Strategic Marketing 20(6): 535-551, 2012.
Tyler & Associates, “A Study to Determine Fuel Tax Attributable to Off-Highway and Street Licensed Vehicles Used for Recreation Off-Highway,” for the California Department of Transportation in Cooperation with the Department of Parks and Recreation, Project #1001, November, 1990.
Van Der Waard et al, “New Drivers in Mobility: What moves the Dutch in 2012?”, Transport Review 33(3): 343-359, 2013.

51
Appendix A.
The 2014 OHV registration report produced by the California DMV is shown on the next two pages. It is a snapshot of the OHV registration database on May 31, 2014. OHV registration is broken down by county and by broad vehicle category: motorcycle, 3 or 4 wheel motorcycle (ATV), snowmobile, and others. The data is further categorized into active and inactive registrations. An ‘active’ registration means vehicles with an unexpired OHV sticker at the time of the report, and ‘inactive’ means previously registered vehicles with an expired OHV sticker. All OHV registrations expire annually on June 30, so this report included all vehicle registrations that were about to expire in 2014.

52
Appendix B.
The following page shows the vehicle classification system used by CEC. In order to estimate energy usage, CEC needs to know more specifics about registered vehicles, such as engine size and whether it is four wheel drive, than are collected by DMV during vehicle registration. Therefore CEC processes the raw DMV data using vehicle identification number (VIN) numbers to identify vehicle characteristics. Each VIN encodes the manufacturer, make, and model of the vehicle, allowing CEC to identify the exact engine and pollution system for each vehicle. For example the broad vehicle classifications used by the DMV, such as ‘pickup’ are refined into more specific categories such as ‘standard’ or ‘heavy’, based on the vehicle weight.


