final project international financial management -
TRANSCRIPT

1
FINA 7320 SECTION 070 International Financial Markets
Fall 2015
Professor Monika Miller
Final Project
Due: Wednesday, November 4, 2015
Fahad AlHamwah
Alaa Sulaiman
Abdullah Aljohani
Jose Quasar Elizundia Salcido

2
Item 1 a:
“ 09/02/2015 – 10/29/2015”
Name of firm% Change in stock
pricePurchase price $ Closing price $
Starbucks 16.37% $54.50 $63.42
Goldman Sachs 3.32% $184.87 $191.00
Yara International 7.79% $41.74 $44.99
Tata Motors Limited (ADR) 21.18% $24.41 $29.58
Table-1: Percentage change in stock price
The stock performance of Starbucks Corporation is impressive because the stock
increased by 16.37% during the time period of 2nd September 2015 to 29th October 2015. The
primary reason behind such stock performance is. “Coffee prices are suppressed and the business
has been performing well” (James Bartelloni, 2015). Also, the recent financial results of the
company are positive. The highlights of Q3 Fiscal 2015 are, “Consolidated net revenues
increased 18% over Q3 FY14 to a quarterly record $4.9 billion” (retrieved from Starbucks
newsroom). Starbucks strong Q3 fiscal results are the prime factors behind such an exceptional
stock performance. It should also be noted that the cash dividend paid by the company was
highest in 2014; hence buyers were encouraged to buy more stocks of the company.
The % change in stock price for Goldman Sachs during the time period of 2nd September
2015 to 29th October 2015 is 3.32%. The purchase price is $184.87; whereas, the closing price is
$191. The average performance of Goldman Sachs is primarily due to the decrease in net income
for Q2 of 2015 as compared to Q2 of the year 2014. The net income for Q2 of 2015 is $962

3
million as compared to $1,953 million in Q2 of 2014. It should also be noted that the basic EPS
for Q2, 2015 is $2.01 as compared $4.21 of Q2, 2014. Poor performance and low basic EPS have
discouraged investors to invest their money on Goldman Sachs’ shares.
The % change in stock price for Yara International during the time period of 2nd
September 2015 to 29th October 2015 is 7.79%. The purchase price is $41.74; whereas, the
closing price is $44.99. The company has done exceedingly well in recent times. There is a
308% ($376.46 million in Q2, 2015 as compared to $92.28 million in Q1, 2015) increase income
Before Extra ordinaries & Disc Operations interest for Q2, 2015 as compared to that of Q1,
2015. Also, Earnings per Share Diluted Net has increased from $.33 per share to $1.37 per share.
Outstanding financial results for Q2, 2015 over Q1, 2015 has encouraged investors to buy more
stocks of the company.
The % change in stock price for Tata motors during the time period of 2nd September
2015 to 29th October 2015 is 21.18%. The purchase price is $24.41; whereas, the closing price is
$29.58. One of the primary reasons behind exceptional performance of Tata motors’ stock is the
recent surge in sales in the high-end vehicles. According to money control (2015), “Shares of
Tata Motors have climbed 7.5 percent intraday Thursday after decent growth in Jaguar Land
Rover (JLR) September sales”. The increase in sales of high-end models has triggered the stock
price of the company.
Item 2
SBUX VS S&P500 “09/02/2015 – 10/29/2015”

4
Fig-1: Comparison between Starbucks’ stocks & US Index
The increase in Starbucks’ stock price was triggered by the growing market conditions of
the USA. It should also be noted that “The popularity of cold brew coffee in the United States
has exploded in the last year, according to new research from Mintel” (retrieved from
mintel.com, 2015). Therefore, there is a positive correlation between the growths is US economy
and the increase in the stock price of Starbucks. Therefore, the growth of Starbucks’s stock price
is due to the market conditions of USA.

5
GS VS S&P500 “ “09/02/2015 – 10/29/2015”
Fig-2: Comparison between Goldman Sachs’ stocks & US Index
Goldman Sachs operates as an investment banker; therefore, the stock price of Goldman
Sachs may not be so sensitive to the market conditions. The stock performance of Goldman
Sachs may have higher impact of the global business than the US economy. According to Richa
Naidu and Olivia Oran (2015), “Goldman Sachs Group Inc's profit plunged for the second
straight quarter as bond trading revenue fell by a third amid market turmoil stemming from
concerns about global growth”. Therefore, we can state that the fluctuations in Goldman Sach’s
stock price may have stemmed from the Global financial tensions.

6
Item 3a
YARO VS NOK “ 02/09/15 – 10/29/15”
Fig-3: Correlation between Yara International’s stocks & Dow Jones Norway Total Stock Market Index
The above figure shows a positive correlation between Yara International’s stock price
and Dow Jones Norway Total Stock Market Index (NOK). Yara is world’s largest supplier of
mineral fertilizers. “Yara grows knowledge to nurture life by delivering solutions for sustainable
agriculture and the environment” (retrieved from yara.com, 2015). Yara International is one of
the largest companies of Norway. The performance of Yara International’s stock is closely
associated with the market conditions of Norway.

7
Tata Motors VS BSE Sensex “ “09/02/15 – 10/29/15”
Fig-4: Correlation between Tata Motors Stock & BSE SENSEX
September-October months are celebrated throughout as festival months in India. During
this time, the mood of the investors is generally upbeat. Investors prefer to buy huge number of
shares; because they believe the time is auspicious and can bring a lot of fortune for them.
Hence, the overall economy grows during this time. One of the primary reasons behind the
exceptional performance of Tata motors’ stock is the festival season in India. Therefore, the
performance of Tata Motors’ stock is positively correlated with the market conditions of the
country.
8
Item 3b
Yara International VS Tata Motors “ “09/02/2015 – 10/29/2015”
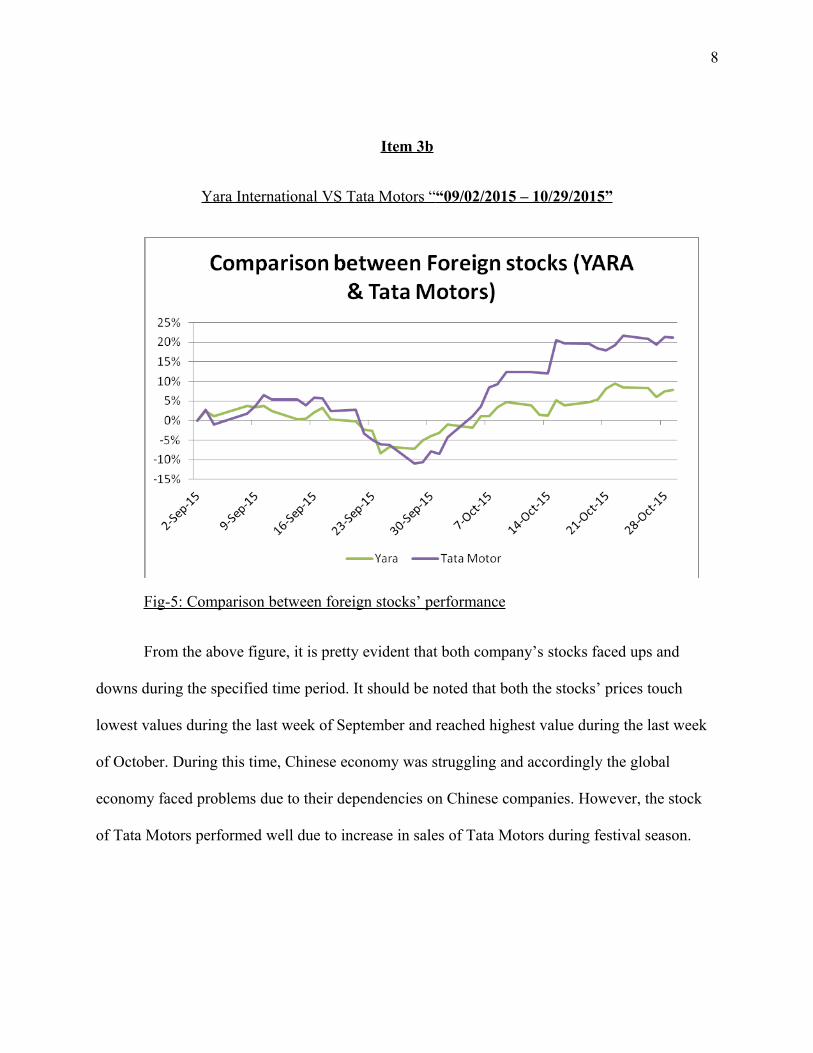
Fig-5: Comparison between foreign stocks’ performance
From the above figure, it is pretty evident that both company’s stocks faced ups and
downs during the specified time period. It should be noted that both the stocks’ prices touch
lowest values during the last week of September and reached highest value during the last week
of October. During this time, Chinese economy was struggling and accordingly the global
economy faced problems due to their dependencies on Chinese companies. However, the stock
of Tata Motors performed well due to increase in sales of Tata Motors during festival season.

9
Item 3c
Yara International VS S&P 500 “09/02/15 – 10/29/15”
Fig-6: Comparison between Yara International's stock and US Index (S&P 500)
The above figure shows the comparison between Yara International’s Stock performance
and the US Index. The above chart indicates relatively unstable stock price movement of Yara
International as compared to the US Index. The positive correlation found may be due to the fact
that Yara exports nutrient. Phosphorus and other fertilizer related products to the USA.
Therefore, it is obvious that there would be a positive correlation between USA index and Yara
International’s stock. The chart also indicates the impact of weak Chinese economy on both

10
Yara’s stock as well as on US Index. The correlation index between Yara’s stock price
movement and US Index movement is .85. It suggests a strong correlation.
Tata Motors versus S&P 500 “09/02/15 – 10/29/15”
Fig-7: Comparison between Tata Motors' stock and US Index (S&P 500)
The above chart indicates the fluctuations of Tata Motors’ stock that moves up to 20%
from initial price during the specified time period. Whereas, the US index moves up to 7%
during the same period. The fall in stock price is due to the inefficiencies in the Asian market.
From the above figure, it can be stated that there are strong correlation between the stock price of
Tata Motors and the US Index. The correlation index between Yara’s stock price movement and
US Index movement is .94. It suggests a strong correlation between them.

11
Item 4a
Starbucks Corporation
Fig-8: Comparison between USD & Japanese Yen (JPY)
According to Trefis Team (2014), “Currently, Japan is Starbucks’ second largest market
with over 1,000 restaurants”. Therefore, Starbucks is most exposed to the currency of Japan. The
correlation between USD and Japanese Yen is given in the above chart. It is evident from the
above chart that the USD has appreciated against JPY during the last week o October, 2015.
During the specified time, we can observe both the positive and negative correlation between
JPY and USD.

12
Item 4b
Goldman Sachs
Fig-9: Comparison between USD & Russian Rubel
According to Goldman Sachs’ Annual report (2014), “As of December 2014, our total credit
exposure to Russia was $416 million and was substantially all with non-sovereign counterparties
or borrowers”. Therefore, Goldman Sachs is most exposed to the currency of Russia. Russia’s
currency is known as Rubel. The correlation between Rubel and USD is given in the above chart.
The above chart shows that USD appreciates with respect to Rubek during the first week of
September 2015 and depreciates with respect to Rubel during the first week of October.

13
Item 5 a
Yara International
Fig-10: Comparison between USD & NOK
Yara International is a multinational firm. It is involve with several cross-border
transactions. In most of the business transactions with other countries, USD is used as the
currency as it is regarded as the global currency by most of the country. Therefore, profitability
of the company depends on the exchange rate. If the home currency becomes weaker as
compared to USD, across the border transactions become more and more expensive. The above
chart shows the fluctuations of JPY as compared to USD.

14
Item 5b
Tata Motors
Fig-11: Comparison between USD & INR
Tata Motors purchases several automobile parts from other countries. It also exports
vehicles. In both situations, Tata Motors completes the business transactions through USD.
Therefore, the exchange rates between INR and USD play an important role in deciding the
profitability of the company. The above chart gives the relationship between INR and USD. The
chart suggests that initially INR depreciated with respect to USD; however Indian rupee recovers
and appreciated during the first week of October 2015.

15
Reference
Bartelloni, J. (2015, October 30). How Much Higher Can Starbucks Stock Price Go? (SBUX).
Retrieved November 1, 2015, from http://www.seeitmarket.com/how-much-higher-can-
starbucks-stock-price-go-sbux-14924/
Starbucks Delivers Record Quarterly Revenue of $4.9 Billion and Record Q3 EPS. (2015, July
23). Retrieved November 1, 2015, from https://news.starbucks.com/news/starbucks-q3-
fy15-earnings-press-release
US cold brew coffee sales grow 115% from 2014-2015. (2015, September 18). Retrieved
November 2, 2015, from http://www.mintel.com/press-centre/food-and-drink/us-cold-
brew-coffee-sales-grow-115-from-2014-2015
Quarterly Report 3Q 2015. (2015). Retrieved November 2, 2015, from
http://yara.com/investor_relations/quarterly_report/
Tata Motors up 8% on JLR Sep sales, Macquarie says top pick. (2015, October 15). Retrieved
November 2, 2015, from http://www.moneycontrol.com/news/buzzingstocks/tata-
motors8jlr-sep-sales-macquarie-says-top-pick_3603441.html
Goldman profit plunges as market turmoil hits bond trading. (2015). Retrieved November 2,
2015, from https://in.finance.yahoo.com/news/goldman-profit-plunges-market-turmoil-
141349020.html
Team, T. (2014, September 30). Starbucks' Full Ownership Of Japan Unit To Boost International
Revenue Growth. Retrieved November 2, 2015, from
http://www.forbes.com/sites/greatspeculations/2014/09/30/starbucks-full-ownership-of-
japan-unit-to-boost-international-revenue-growth