final report ely kuo-vasher project coordinator
TRANSCRIPT

University of Michigan Comprehensive Cancer CenterClinic Patient Flow Study
Final Report
Project Client:
Ely Kuo-VasherUniversity of Michigan CCC Clinical Department Associate
Project Coordinator:
Mary DuckPrograms & Operations Analysis Senior Management Engineer
Project Team:
Christi BierengaKatie Cole
Angela Kvasnica
April 26, 1999

TABLE OF CONTENTS
Executive Summary. 1
Definitions 2
Introduction & Background 3
Approach & Methodology 4
Findings 7
Conclusions 8
Recommendations 10
Team 1 Findings (2.
Team 4 Findings 27
C Team 6 Findings 44
Appendix A: Gantt Chart
Appendix B: Data Collection Sheet
Bibliography 71

EXECUTIVE SUMMARY
The purpose of this project is to analyze patient flow for Clinic Teams 1, 4 and 6 in the ComprehensiveCancer Center at the University of Michigan Medical Center. Another group analyzed Clinic Teams 2, 3,and 5, and summarized their findings in a separate report. In response to the CCC specific goals ofcontinuous improvement, we analyzed the clinics’ perfonnance in order to recommend actions to:
• Increase examination room utilization• Decrease patient visit time, especially through reducing non-value added time• Develop an on-going monitoring system for internal performance evaluations
to create a “Balanced Scorecard”
In order to gain an understanding of clinic operations, we observed the clinic, interviewed key staff andcreated a flow chart of the current situation. It was determined that the most effective means to collectdata was through patient participation. A data collection sheet was designed and distributed to all patientsat Check-In for the duration of March 12, 1999 through April 6,1999.
Analysis of the collected data included stratification by patient type, physician, and session (mornings vs.afternoons). In certain instances, an insufficient volume of data was obtained, making it impossible tostratify the data to physician level or draw reasonable conclusions.
As a result of our observations and data analyses, we have determined that there are several areas ofambiguity in Clinic Teams 1,4, and 6, which should be clarified to improve service:
• Definition of Appointment Time• Order of Service• Patients’ Expectations of Clinic Visit• Exam Room Activity• Wait Time vs. Value-Added Time• Insufficient Data to Make Conclusions Regarding New Patients
We have found that there is an opportunity for continuous improvement in the areas of examination roomutilization, and patient wait time. We recommend that the CCC consider the following changes:
• Clarify Appointment Time• Serve Patients in Scheduled Order (except for late patients)• Communicate Pre- and Post-Clinic Activities to Patients• Utilize Vitals Station and Consult Rooms• Review Scheduling• Collect Additional Data from New Patients

DEFINITIONS
The following definitions are critical to understanding report content:
RV Return Visit
NP New Patient
Value-added time Time spent in all provider encounters, as well as Check In, Vitals &Check Out
Non-value-added time Time spent waiting between each encounter
Room utilization The percentage of time a patient is in the examination room, of thetime that room is allocated
Early (arrival) Patient arrival before, or exactly at, their scheduled appointment
Provider/Clinicians A faculty or staff member, including Physician, Resident/Fellow,Medical Assistant, Physician’s Assistant, Nurse, Clerk
Time with provider Time the patient is with a provider or team member
Time with physician Time the patient is seeing the physician they are scheduled to meet
Visit duration Amount of time the patient spends in the clinic; Check In untilCheck Out
Encounters When a patient sees a provider, or any combination of providers
Session A clinic’s morning or afternoon allocated time; generally 8 a.m. — 12p.m. and 1 p.m. to 5 p.m.
2

I. INTRODUCTION & BACKGROUND
A. Introduction
The Comprehensive Cancer Center (CCC) of the University of Michigan Medical Centerrequested a study to be done to determine room utilization and patient flow. The Departmentof Programs and Operations Analysis assigned two groups of three student consultants toconduct a patient flow analysis in the CCC outpatient clinics. Each consultant was assigned toone clinic team. The consultants analyzed room utilization, patient wait times, session timeduration, and other general statistics. This report focuses on Clinic Teams 1, 4, and 6. Thegoal will be to decrease patient wait times by increasing the amount of “value-added” activityduring clinic visits in order to improve room utilization and patient flow.
B. Background & Environment affecting the project
The Comprehensive Cancer Center requested this study done, in an effort to continuouslyimprove the care and resources provided at the CCC. Room utilization is of the utmostimportance, as patient volume has been increasing, while space has remained the same.Rooms are shared between some teams, creating a loss of available rooms for add-on patients,and heavily booked schedules. It is essential that the Clinic Coordinators and CCC staff knowwhich rooms are being utilized to more effectively schedule patients.
• Patient growth in the clinics has been about 29% over the last 2 years; withinthe same period, the same space has been allocated
• No clinic patient flow study has been conducted since the ComprehensiveCancer Center moved to its new facility 1- 1/2 years ago
C. Scope
This study focused on what activities the patient encounters during his/her visit. Itencompasses the patient’s visit spanning from the time he/she checks in to the CCC, to thetime he/she arrives at check-out. It does not include treatments, such as infusions, lab tests,and blood draws, if performed outside of the examination room. Both early and late arrivalsare included in th calculation of wait time. Because this study is to determine roomutilization and piiient wait times, material flow within the clinic is not addressed.
D. Purpose & Goals
In response to the CCC specific goals of continuous improvement, we analyzed the clinics’performance in order to recommend actions to:
• Increase examination room utilization.Room utilization is the percentage of time an allocated room is used. A room isconsidered used when a patient is in it regardless if the patient is with a provider.The following displays an example schematic for one room in a session:
Room #18am 12pm
Patient I Patient 2 :EipLJ Patient 3 73

The utilization in Room #1 is less than 100% because there is not a patient in the roomat all times. However, it is unreasonable to set a target greater than 60 to 70% forutilization. The next step at reviewing room utilization is to determine the “Effective”or “Value Added” Room Utilization. This determines how much of the sum ofpatients’ time in the room is spent with a provider. To increase room utilization thegaps between patients must be reduced. Eliminating wait time can reduce the amountof time a patient spends in the exam room, leaving the exam room available for morepatients.
• Decrease patient visit time, especially through reducing non-value added time.
Decreasing patient visit time has two benefits:• The patient is satisfied• Room time is made available
The following schematic displays an example of one patient in a session from Time intothe Exam Room until Time exit the Exam Room:
Patient #1I Wait I Provider 1
----. Itl
... Provider2 I Wat:I Provider 3
While increasing room utilization is important for the clinic, the patient will not seeany direct benefit. To improve the overall visit of the patient, the value-added timemust increase without increasing the time a patient stays in the exam room.
Develop an on-going monitoring system for internal performance evaluationsto create a “Balanced Scorecard”
II. Approach & Methodology
A. Phases, Steps, and Approaches• Phases: 1. Interviewing
— 2. Observation3. Data Collection4. Data Analysis5. Recommendations
• Steps are listed in the Gantt Chart (attached, Appendix A).
• Approaches: 1. Observation of clinic operations2. Interview key staff3. Flow chart the current situation4. Design data sheet for data collection
4

B. Methodology
• The General Method
The project consists of a patient flow study to determine room utilization andpatient wait times, and analysis of the data collected in order to formrecommendations for better use of examination rooms and improvedscheduling.
C. Key Steps
The following key steps were performed during the project:
• Interviews with staff• Literature Search• Benchmark• Meetings with Project Coordinator• Observation• Creation of Data Collection Form• Collection of Data• Analyze and Report Data
Information about these steps follow:
Interviews with StaffInterviews were conducted with the Clinic Coordinators, MedicalAssistants, Clerks and Physicians. The initial interviews were informalover the course of several days to assess the patient flow in the CCC.
Literature SearchSeveral time flow studies were previously performed with the CCC. Thesestudies include:
• 1995 Hemoc Study• 1998 Infusion Study
- 1997,1998 Nurse & MA Studies• Comprehensive Cancer Center Operations Plan
BenchmarkIn the analysis of the CCC, we are privileged to study several teamssimultaneously. Through the literature searches and interviews, it wasfound that Team 4, led by Robyn Napieraiski, has been used as abenchmark for check-in systems. We utilized Team 4’s previous exposureto data collection studies to aid in the development of our data collectionform.
Meetings with Project CoordinatorDuring this study, we met with our Project Coordinator, Mary Duck, forweekly progress reports. Ms. Duck provided literature, guidance, andsuggestions for the overall project, as well as aided in the clarification of the
5

current system at the CCC. She defined many of the relevant acronyms andterms used frequently in the University Hospital.
ObservationDuring observation the process flow was watched for bottlenecks andexcessive “non-value added time”. Several of the staff members madecomments during this time and offered suggestions for improvement. Itwas determined that a data collection form was the best method of gainingthe required patient visit information.
Creation of Data Collection FormThe form that was used in previous patient flow studies was revised andimplemented to fit the needs of this study. Times from patient check-in untilcheck-out, were recorded with a separate space for each encounter. Theform was reviewed and approved by the lead doctors before actual datacollection took place.
The Data Collection Form is attached as Appendix B.
Collection of DataData collection was performed March 12 through April 2, 1999, excludingweekends. Sample data was taken to insure clarity of the data collectionform before the final revision was implemented. The representative samplesize captured was 40% of the scheduled appointments.
• Results give:
• Session Time Duration• First Patient Wait Time• Examination Room Utilization• General Clinic Statistics
• New Patients vs. Routine Visits• Averages & Standard Deviationsa Provider Time• Examination Room Time• Average # of Clinicians Seen During Visit
D. LimitationsThere are limitations to any sampling collection method. Scheduled data was used toconfirm and supplement collected data. Limitations are a result of the data collectionform, the nature of the clinic, and additional patients.
• Patients filled out data collection forms. The limitations associated with thissampling collection method include:
1. Not all patients wanted to fill out the form2. Data may be incomplete, missing any of the following fields:
• Provider• Accurate times• Vitals
6

• Room number
Nature of Clinic
• Patients that came in every other day did not want to keep filling out forms• Rooms are shared with other teams so utilization is difficult to determine
• Add-On Patients, “Sick” Patients, New Patients
• New Patients may be intimidated by first visit, and primarily focused on health• Add-On Patients may not have received data collection form• “Sick” Patients may have been unable to physically complete form
Particular to this study there were several instances where the clinic staff was not clear onthe purpose of the research being done. This resulted in days with no data, extensions ofdata collection in some clinics, and less data due to patients who were advised not to fillthem out. The lack of communication in some clinics limited the amount of data collected.
III. Findings
A. Informal Interviews
During informal interviews the staff was very helpful in suggesting problems and potentialsolutions. They were receptive to suggestions of change and expressed an interest in how thisstudy would help them. Staff members confirmed our observation that patients desire shorter waittimes and more “value-added” time in their visit.
B. Observation — Overall Patient Flow
Teams operated in slightly varied ways, however the overall model is similar. Clinics opened at8:00 a.m., which means the first appointment is not scheduled until this time. Patients, however,arrived as early as 45 minutes before their scheduled appointment. Morning sessions arescheduled from 8:00 a.m. to 12:00 p.m., but may run longer based on the arrival of patients. Theafternoon session schedule begins at 1:00 p.m. and runs until 5:00 p.m. Upon arrival to the CCC,the patient checks iuwith the check-in clerk. Some patients may be scheduled for blood work,infusion, x-rays, or labs before or after the appointment with their provider. (If these activitiesfollow the appointment, patients check out before continuing on to these events.) After check-in,the MA takes vitals. The patient is then placed in the exam room to wait for their provider. Afterseeing their provider and his/her clinicians, the patient checks out. A more detailed description ofthe current situation is provided in the following team analysis and findings.
7

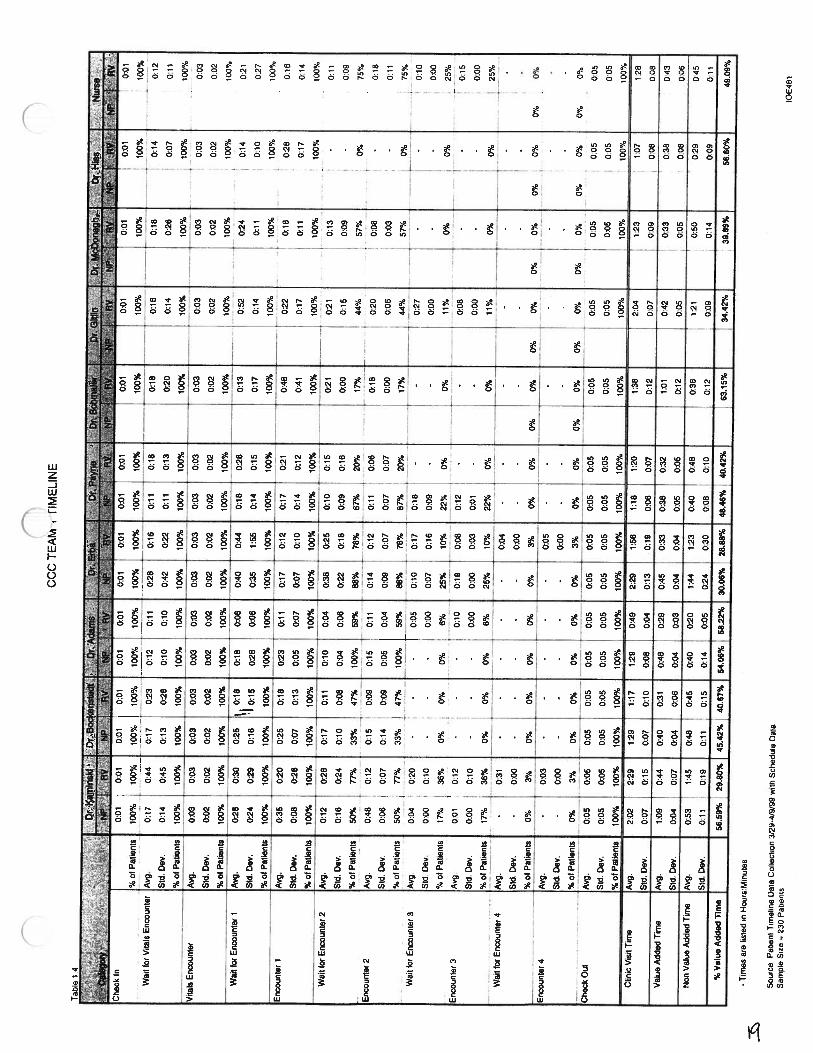
C. Data Analysis - Summary Statistics
Clinic Team 1 Team 4 Team 6Sample Size 230 304 110Physician Time 0:32 0:44 0:10ProviderTime 0:41 1:02 0:26Exam Room Time 1:12 1:00 0:47WaitTime 1:03 0:59 0:52Visit Time 1:40 1:36 1:18% Value Added Time 39% 57% 33%% Room Utilization 152% 28% 45%% Value Added Room
42% 94% 36%UtilizationTable Cl. CCC Teams 1,4,6 Summary Statistics
C
All times in Table Cl are listed in Hours:Minutes format, and represent averages only.
As seen from the Summary Statistics presented in Table Cl, there is little consistency amongTeams 1, 4, and 6 in any of the key timeline statistics:
• The physician time ranges from 10 minutes to 44 minutes, with Team 4 having the greatestduration.
• Provider time ranges from 26 minutes to 1 hour 2 minutes, with Team 4 again having thegreatest duration. Provider time is the time spent with any clinician, including the CheckIn and Check Out clerks, and Medical Assistants.
• The time the average patient spends in the exam room ranges from 47 minutes to 1 hour 12minutes, with Team 6 having the shortest duration. Short exam room durations arepreferable, especially when they are greater than the physician or provider times, because itindicates that patients are not “parked” in the rooms.
• Wait time is fairly consistent for the three teams, ranging from 52 minutes to 1 hour 3minutes. The total visit time ranges from 1 hour 18 minutes to 1 hour 40 minutes, withTeam 6 again having the shortest duration.
• Teams 1 and 6 have a close Value Added Time percentage, at 39% and 33% respectively.Team 4 has the highest Value Added Time percentage at 57%. Team 4 also has the highestValue Added Room Utilization percentage at 94%. Teams I and 6 have 42% and 36%,respectively.
Conclusions
As a result of our observations and data analyses, we have determined that there are several areasof ambiguity in Clinic Teams 1,4, and 6, which should be clarified to improve service.
8

A. Definition of Appointment Time
We believe that the hospital staff currently views appointment time as the time the patient isscheduled to be seen by the physician. However, patients understand appointment time as thetime he/she is to arrive at the clinic. This discrepancy might account for the large wait timesbefore the first physician encounter.
B. Order of Service
It was found both by observation and analysis of check-in times. patients who arrivesignificantly ahead of their scheduled appointment time are seen ahead of schedule.Therefore, patient flow is disrupted because patients are seen on a first-come, first-served basisrather than in order of scheduled appointment time.
C. Patients’ Expectations of Clinic Visit
Patients at the CCC may have a series of appointments that consists of procedures ortreatments. These activities may take place before or after the scheduled appointment withtheir physician. As a result, patients who mistakenly believe they have a procedure beforetheir appointment may show up significantly early. In contrast, patients who mistakenlybelieve they do not have a procedure may be sent out of the clinic causing schedule disruption.Overall, it was found that patients are not clear on the events they need to participate in whenthey come to the clinic. This miscommunication may be a source of non-value-added time.
D. Exam Room Activity
In addition to examination rooms, each clinic has a designated area for vitals. We found thatin many cases, blood draws and vitals were performed in the exam room rather than at theirappropriate locations. Educational activities such as viewing videos, and consulting with asocial worker or psychiatrist were found to take place in the examination room. Examinationroom availability and utilization is affected by these non-exam activities.
E. Wait Time vs. Value-Added Time
During a patienf’ visit, it is their expectation that the majority of their time will be spent witha health care provider. The current situations in the CCC clinics barely meet (on average) thisexpectation. We found that in a majority of the cases, patients are with a provider no morethan 50% of the total visit time. The time with provider includes both Check-In and CheckOut activities. The time spent with the physician is an even smaller percentage of the visitduration. Having a low percentage of value-added time during a visit can cause patientfrustration and restlessness. When patients are restless, they are more apt to wander aroundthe clinic, go to the bathroom, or leave the clinic, potentially affecting clinic performance.
F. Insufficient Data to Make Conclusions Regarding New Patients
We found, while compiling and analyzing the data, that a very low number of new patientscompleted the survey form. While this limitation of the study was described in the Approach& Methodology section earlier, it has particular importance at this point. On average, theclinic sees significantly fewer new patients than return patients. The duration of this study didnot allow us to capture a statistically significant number of new patients. Much new patient
9

analysis is missing due to the small sample, which did not allow us to make reasonableconclusions. A complete picture of clinic operations, especially room utilization and time withprovider. is not available due to this missing data.
G. Benchmark Team
When examining percent value-added time per team, we found Team 4 to have significantlybetter results, at 57%. This is very close to the University of Michigan Health Systemsbenchmark of 60%. Team 1 and Team 6 had percent value-added time 39% and 41%,respectively.
V. Recommendations
We have found that there is an opportunity for continuous improvement in the areas ofexamination room utilization, and patient wait time.
A. Redefine Appointment Time
To ensure that physicians are not delayed by waiting for patient arrival, it is suggested that acheck-in time be issued to each patient, including the durations of check-in time and vitals.This will allow patients to be in the exam room at their scheduled appointment time.
B. Serve Patients in Scheduled Order
It is recommended that patients should be served in the scheduled order, with the exception ofadd-ons. Redefining appointment time will aid in this process by reducing the number ofpatients who arrive at the clinic excessively early. Patients may have learned throughexperience that arriving early increases the likelihood that they will be seen before theirappointment time. Seeing patients in their scheduled order will condition them to arrive ontime.
C. Communicate Pre- and Post-Clinic Activities to Patients
While scheduling the next appointment patient should be advised as to what activities it willinclude. This will aid patients in estimating the time they should arrive to the clinic. Currentpractices of infoThuing patients about their next visit can be improved. Subsequent visitconfirmations should include activities outside of the clinic.
D. Utilize Vitals Station and Consult Rooms
One way to address exam room utilization is to perform vitals at the vitals station. Consultrooms can also be used to ease the current strain on exam rooms. Each of these will movenon-exam activities out of the examination room, allowing for better utilization of clinic space.A further study of consult and treatment rooms would be helpful to understand their currentand potential usage.
E. Review Scheduling
In order to reduce wait times, it may be necessary to review the clinic scheduling system. It isimportant that the time allotted per doctor for a patient visit represents approximately theaverage time they spend with the patient.
I 0

F. Collect Additional Data from New Patients
An additional study should be done, targeting new patients, to capture their specificexperiences. A data collection survey, similar to this one, could be included in the packetpatients receive upon check-in at the clinic. Duration of this study should span at least threemonths.
G. Benchmark Team
To use available resources, it is recommended that Team 4 be used as a benchmark for otherCCC teams. Closely examining Team 4 practices would allow other teams to adopt Team 4’ssuccessful aspects of clinic management.
I I

Team I Findings
Current SituationTeam 1 is the Adult Hematology/Cutaneous Lymphoma and the Multidisciplinary LyrnphomaClinic. The team leader is Dr. Kaminski. Dr. Adams, Dr. Bockenstedt, Dr. Bowen, Dr. HarryErba, Dr. Gribbin, Dr. Githn, Dr. Hiss, Dr. McDonagh, Dr. Petruzzelli and Dr. Schmaier supportthe team. The Adult Hematology Clinic sees approximately 519 patients per month, while theLymphoma Clinic sees approximately 35 patients per month.
Due to the data collection duration, data was not collected for Dr. Gribbin or Dr. Petruzzeli.Sufficient data regarding return patients was collected for Dr. Schmaier, Dr. Gitlin, Dr.McDonagh, Dr. Hiss, and the nursing team, but no new patient information was captured.Therefore, new patient data is only stratified for Dr. Kaminski, Dr. Bockenstedt, Dr. Adams, Dr.Erba, and Dr. Payne.
Room UtilizationExam room utilization of the allocated rooms for Team 1 averages to be 151.7%, with thecorresponding average value-added room utilization being 42.1%. The exam room utilization ofthe used rooms averages to be 118.3%, with a corresponding average value-added room utilizationof 37.5%. This utilization takes into account the number of rooms each doctor uses per session, aswell as the session duration (which may be different than the scheduled session length). RoomUtilizations are above 100% for several reasons:
(1) Team 1 is using more rooms than it is allocated(2) The sessions are lasting longer than their scheduled duration(3) Patients did not fill out room numbers, making it impossible to accurately know how
many rooms are being used by each doctor.
The best patient experience occurs when the room utilization and value-added room utilization arethe same, indicating that the patient does not have any wait time in the exam room. The CCC goalis to have 60% utilization for both exam room and value-added exam room utilization. Currently,there are no doctors on Team 1 who have both a room utilization and value-added room utilizationclose to 60%. (Table 1.1)
Reducing the amount of time a patient waits in an exam room can increase room utilization andvalue-added room ulilization. In particular, for Team 1, it is recommended that the number ofrooms allocated to each doctor be examined for possible improvements and that doctors examinetheir practice to possibly reduce the length of time each patient is in the exam room.
Visit & Timeline StatisticsA sample of 230 patients was collected for Team 1 over the 2-week data collection period. Earlyand on-time arrivals account for 80% of patients, as seen in Table 1.2. Early patients arrived 25minutes ahead of schedule, while late patients averaged 14 minutes behind schedule as in Figure1.3. Patients can expect their total visit time to be 1 hour 40 minutes. New patients can expect tobe in the clinic a slightly longer amount of time, at 1 hour 52 minutes. During this visit, patientssee a staff physician for 32 minutes and are in the exam room an average of 1 hour 12 minutes.New patients spend a significantly longer time with the staff physician than return visits do, withnew patients averaging 41 minutes and return visits with 12 minutes per visit. The provider andphysician times are fairly consistent throughout the team, with a standard deviation of 8 and 13minutes, respectively.
12

Team 1 is just off target for time spent between check-in and vitals. The CCC goal is 15 minutes.with Team 1 averaging 22 minutes. The standard deviation is quite high, at 27 minutes, indicatingthat there is little consistency between how long each patient waits. Check-in duration wasassumed to be 1 minute for all patients and check-out duration averaged 5 minutes as can be seenin Table 1.6.
Physician StratificationTable 1.5 reveals the variation in physician time:
• Doctors Kaminski, Bockenstedt, Payne, McDonagh, and Hiss spend approximately thesame amount of time with Return Visits, at an average of 25 minutes per patient.
• Doctors Adams and Erba spend approximately 11 minutes with Return Visit patients.Doctors Schmaier and Gitlin spend an average of 45 minutes with a Return Visit patient.
This data indicates that there is no standard practice for Team 1 governing how long thephysicians should spend with their patients. The table also shows that the physicians spendsignificantly less time with the New Patients than with Return Visits.
Value-added time is any time a patient is being seen by a provider or team member. Team 1averages 39% value-added time overall, with 50% for new patients and 37% for return visits, asseen in Table 1.6. Dr. Kaminski has the best value-added time at 70.65%, just above the 60%goal. Figure 1.7 and Table 1.4 show that Dr. Adams and Dr. Schmaier have over 60% value-added time with Return Visits. The figure also shows that the value-added time is fairly consistentfor all of the physicians, but that non-value-added time varies significantly.
Session DurationLooking at Table 1.8, actual session duration is greater than the scheduled duration, on average.For some physicians the abnormally high duration is due to the fact that patients are scheduledduring lunch (12 p.m. to 1 p.m.). Also, physicians are spending quite a bit longer with theirpatients than their schedule allocates. Overlapping the sessions increases exam room utilization,and can cause utilization greater than 100%.
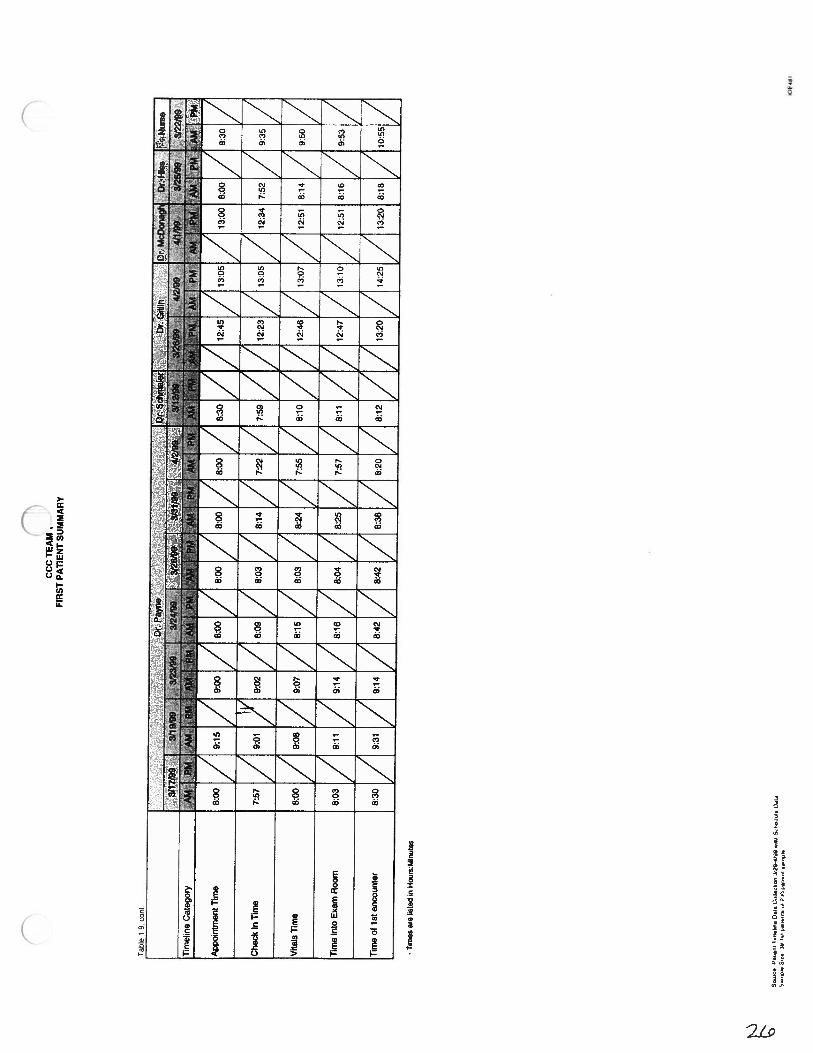
First Patient SummaryExamining the first patient of each session per doctor, per day shows that Team 1 physicians, onaverage, see patients.22 minutes after their scheduled appointment time. Patients, on the otherhand, arrive at the clinic an average of 21 minutes before their scheduled appointment time. It isoften the case that a patient scheduled in the afternoon session is placed into an exam room duringthe morning session. This can cause a disruption in the patient flow through the clinic, and causepatients who have arrived on time for their appointments to wait. See Table 1.9, Team I FirstPatient Summary.
13

TEAM 1— Adult Hematology/Cutaneous Lymphoma and MultidisciplinaryLymphoma Clinic

Th
4
4.50 4
6.48
9.78
25.7
8
143%
54%
99%
38%
4
4.50 6
5.45
10.4
0
38.6
3
215%
39%
118%
32%
3
4.00 3
4.25
8.93
23.1
0
193%
74%
181%
70%
Sou
rca
PaSe
rit
Tim
ehn.
Dat
aC
oii.c
tior
i3/2
9.4
/S5
wid
Sch
edrO
Dat
aS
arnA
.S
ila
3i,
2
4.00 4
4.53
6.32
23.3
3
292%
40%
129%
35%
CC
Clt
M1
RO
OM
UT
ILIZ
AT
ION
SUM
MA
RY
Tab
le1.
1
.1:.
— MO
ND
AY #
ofR
oom
sA
lloca
ted
Hou
rsA
vaila
ble
#ot
Roo
ms
Use
d
Ses
sion
Dur
atio
n(a
vg.)
Prov
ider
Tim
e(S
um)
Roo
mTi
me
(Sum
)
%R
oom
Util
izat
ion
(All
ocat
ed)
%V
AR
oom
Util
izat
ion
(Atlo
c.)
%R
oom
Util
izat
ion
(Use
d)
%V
AR
oom
Util
izat
ion
(Use
d)7U
ESD
AY #
01
Roo
ms
Allo
cate
d3
42
Hou
rsA
vaila
ble
4.00
4.00
4.00
#ot
Roo
ms
Use
d5
52
Ses
sion
Dur
atio
n(a
vg.)
4.63
4.15
3.93
Prov
ider
Tim
e(S
um)
5.83
6.30
5.18
Roo
mT
ime
(Sum
)20
.00
17.1
06.
90%
Roo
mU
tiliz
atio
n(A
lloca
ted)
167%
107%
86%
%V
AR
oom
Util
izat
ion
(Allo
c.)
29%
32%
65%
%R
oom
Util
izat
ion
(Use
d)86
%82
%88
%%
VA
Roo
mU
tiliz
atio
n(U
sed)
25%
30%
66%
WED
NES
DA
Y
#ot
Roo
ms
Allo
cate
d5
42.
5H
ours
Ava
ilabl
e4,
004.
004.
00#
ofR
oom
sU
sed
66
2S
essi
onD
urat
ion
(avg
.)5.
256.
154.
28Pr
ovid
erTi
me
(Sum
)6.
524.
176.
45R
oom
Tim
e)S
um)
24.7
024
.00
16.7
5%
Roo
mU
tiliz
atio
n(A
lloca
ted)
124%
150%
168%
%V
AR
oom
Util
izat
ion
(Atlo
c.)
27%
17%
81%
%R
oom
Util
izat
ion
(Use
d)78
%65
%19
6%%
VA
Roo
mU
tiliz
atio
n(U
sed)
21%
11%
75%
•P
rovi
der
Tim
ere
pres
ents
only
that
time
spen
tw
itha
prov
ider
inth
eex
amro
om-
TN
sda
tare
pres
ents
anav
erag
ese
ssio
n
ftft
48
i

In
n
CC
Cit
AM
iR
OO
MU
TIL
IZA
TIO
NSU
MM
AR
Y
Tab
le1.
1,co
nt.
>I.
111)
11)l
l1)
1ll
lIlf
ihIl
I4II
III
lIlt
!Il
lll
ll!l
lfll
j!lI
.Ill
lllJ
l)I)
tl.I
lJlI
l!l
llJhll
lljl
IIII
ltIli
liii
Ill
llIi
tutu
lilt
)tl
tltl
IIIl
ii,l
,itl
lill
Iil
ilil
iJ11
1111
1ll
tll
1111
1,11
1Ii
)lu
lll
III
IIM
XI.l
i,01
LIJ
.I)l
II)
.1
TH
UR
SDA
Y
#of
Roo
ms
Allo
cate
d3
42
Hou
rsA
vaila
ble
4.00
4.00
4.00
#oI
Roo
ms
Use
d3
22
Ses
sion
Dur
atio
n(a
vg.)
4.27
5.47
4.62
Prov
ider
Tim
e(S
um)
4.17
2.37
2.35
Roo
mT
ime
(Sum
)11
.00
13.3
04.
70%
Roo
mU
litiz
a8on
(Allo
cate
d)92
%83
%59
%%
VA
Roo
mU
tiliz
atio
n(A
tloc.
)35
%30
%29
%%
Roo
mU
tiliz
atio
n(U
sed)
86%
122%
51%
%V
AR
oom
Util
izat
ion
(Use
d)33
%22
%25
°!.,
FRID
AY
#01
Roo
ms
Allo
cate
d5
23
Hou
rsA
vaila
ble
4.00
4.00
4.00
#ol
Roo
ms
Use
d4
34
Ses
sion
Dur
atio
n(a
vg.)
3.83
4.07
5.07
Prov
ider
Tim
e(S
um)
8.53
4.47
4.92
Roo
mT
ime
(Sum
)50
.00
10.4
020
.20
%R
oom
Util
izat
ion
(Allo
cate
d)25
0%13
0%16
8%%
VA
Roo
mU
tiliz
atio
n(A
lloc.
)53
%37
%31
%%
Roo
mU
tiliz
atio
n(U
sed)
326%
85%
100%
%V
AR
oom
Util
izat
ion
(Use
d)56
%37
%24
%
-Pr
ovid
erT
ime
repr
esen
tson
lyth
attim
esp
ent
with
apr
ovid
erin
the
exam
room
-T
his
data
repr
esen
tsan
aver
age
sess
ion
Souue.
Pabe
uMT
irne
lin.
Dat
aO
dI.
cb
on
3t29
4/9/
99w
itu
Sd
edu
jeD
ata
Saa
-çta
Siz
e23
01r4
81

CC
CA
M1
SUM
MA
RY
STA
TIS
TIC
S
Tab
le1.
2
100%
#E
arly
Arr
ival
s18
580
%33
92%
159
82%
Ear
lyT
ime
0:25
0:20
0:24
0:17
0:25
0:21
#L
ate
Arr
ival
s45
20%
380
%35
18%
Lat
eTim
e0:
140:
110:
080:
050:
150:
12•
—---
.
,
-•
Key
Tim
esS
um
mar
y:
Phy
sici
anT
ime
*0:
320:
130:
410:
120:
120:
07
Pro
vide
rT
ime*
*0:
410:
080:
510:
080:
400:
08
Exa
mR
oom
Tim
e1:
121:
021:
250:
401:
101:
05rr
Clin
icT
ime
1:40
0:48
1:52
0:39
1:38
0:50
Not
es:
*P
hysi
cian
tim
eis
the
aver
age
tim
ew
ithth
est
aff
phys
icia
nper
visi
t.**
Pro
vide
rti
me
isth
eav
erag
eti
me
with
any
clin
icia
npe
rvi
sit.
-T
imes
are
list
edin
hours
:min
ute
s
Sou
rce:
Pat
ient
Tii
neli
neD
ata
Col
lect
ion
3/29
-4/
9/99
with
Sch
edu
leD
ata
Sam
ple
Siz
e=
230
Pat
ients
#P
atie
nts
230
100%
3610
0%
I%of
Pal
lønt
s--
r
194
10E
481

60> C
500
40
CC
CT
eam
1E
arly
/Lat
eP
atie
nt
Arr
ival
s10
0 90 80 70
I
30 20 10 0
B I
Fig
ure
1.3-1
40-1
20-1
00-8
0-6
0-4
0-2
00
2040
6080
100
120
140
Mor
e
Tim
e(m
inu
tes)
Sou
rce:
Pat
ient
Tim
etin
eD
ata
Col
lect
ion
3/29
-4/9
/99
Tab
le1 .
4
-T
imes
are
list
edin
Hou
rs:M
inut
es
Sou
rce
Pat
ient
Tim
elin
eD
ata
Col
lect
ion
3/29
-419
/99
with
Sch
edul
eD
ata
Sam
ple
Siz
e23
0P
atie
nis
CC
CTE
AM
iII
MEL
INE
Che
ckto
Wai
tto
tV
itals
Enc
ount
er
Vita
LsE
ncou
nter
0:01
0:01
0:01
0:01
%ofP
atie
nts
100%
100%
100%
100%
Avg
.0:
170:
440:
170:
23
Std
.0e
v.0:
140:
450:
130:
26
%ofP
atie
nts
lOO
j10
0%10
0%10
0%
Avg
.0:
03I
0:03
0:03
Std.
0ev.
0:02
0:02
0:02
%of
Pat
ient
s10
0%10
0%10
0%
0:01
100%
0:12
0:10
100%
0:01
100%
0:11
0:10
100%
Wai
lto
tE
ncou
nter
1
0:01
100%
0:28
0:42
100%
0:01
100%
0:16
0:22
100%
0:03
0:02
100%
Avg
.
Std
.0
ev.
%of
Pat
ient
s
Enc
ount
er1
0:03
0:02
100%
0:28
0:24
100%
0:03
0:02
100%
0:30
0:29
100%
0:03
0:02
100%
0:25
0:16
100%
0:03
0:02
100%
0:16
I0:
15
100%
Avg
.
Std
.0e
v.
%of
Pat
ient
s
0:18
0:28
100%
0:35
0:08
100%
0:06
0:06
100%
0:20
0:26
100%
0:40
0:35
100%
0:25
0:07
100%
0:44
1:55
100%
0:16
0:13
100%
0:23
0:05
100%
0:11
0:07
100%
0:17
0:07
100%
0:12
0:10
100%
Wai
tfo
rE
ncou
nter
2
Enc
ount
er2
Wai
tfo
rE
ncou
nter
3
Enc
ount
er3
Wai
tfor
Enc
ount
er4
nC
0unte
r4
Che
ckO
ut
0:12
0:28
0:16
0:24
50%
77%
0:48
0:12
0:06
0:07
50%
77%
0:04
02
0
0:00
0:10
17%
36%
001
0.12
0:00
0:10
17%
36%
•0:
31
-0:
00
0:17
0:11
0:10
0:08
33%
-47
%
0:15
0:09
014
0:09
33%
1...47
%—
0%0%
0%0%
0%0%
0:01
0:01
100%
100%
0:11
J0:
18
0:11
0:13
100%
100%
0:03
0:03
0:02
0:02
100%
J10
0%
0:18
0:26
01
40:
15
100%
100%
0:17
0:21
0:14
0:12
100%
100%
0:10
0:15
0:09
0:16
67%
20%
0:11
0:06
0:07
0:07
67%
20%
0:18
I
0:09
-
_2
2%
0%
0:12
-
0:01
-
22%
0%
0%0% 0%
0:05
0:05
0:05
0:05
100%
100%
Avg
.
Std
.0
ev.
%of
Pat
ient
s
Avg
.
Std.
0ev.
%of
Pat
ient
s
Avg
Std.
0ev.
%of
Pat
ient
s
Avg
.
Std
.0e
v.
%of
Pat
ient
s
Avg
.
Std.
0ev.
%of
Pat
ient
s
Avg
.
Std.
0ev.
%of
Pat
ient
s
Avg
.
Std
.0e
v.
%of
Pat
ient
s
0:10
0:04
0:04
0:06
100%
-
0:15
0:11
0:05
0:04
100%
459
%
-0:
05
-0:
00
0%6%
-
0:10
-0:
00
0%6%
0%0%
0:01
L100
%0:
18
0:20
L10
0%
0:03
0:02
100%
0:13
0:17
100%
0:48
0:41
L10
0% 0:21
0:00
17%
0:18
0:00
0% 0% 0% 0% 0:05
0:05
100%
0:01
100%
0:16
0:14
100%
0:03
0:02
100%
0:52
0:14
100%
0:22
0:17
100%
0.21
0:15
44%
0:20
0:06
44%
-
0:27
0:00
11%
0:08
0:00
11%
0% 0% 0:05
0:05
100%
0:01
100%
0:18
0:26
100%
0:03
0:02
100%
0:24
0:11
100%
0:18
0:11
100%
0.13
0:09
57%
0:08
0:03
1 0%-
0% 0% 0% 0:05
0:05
100%
0:38
0:22
88%
0:14
0:09
88%
0:10
0:07
25%
0:19
0:00
25%
0% 0% 0:05
0:05
100%
0:01
100%
0:14
0:07
-10
0%
0:03
0:02
100%
0:14
0.10
100%
0.26
0:17
100%
0% 0% 0% 0%
9%
0%
0%0% 0.
05
0:05
100%
0:25
0:16
78%
0:12
0:07
78%
0:17
0:16
10%
0:08
0:03
10%
0:04
0:00
3% 0:05
0:00
3% 0:05
0:05
100%
0.01
-10
0%
0:12
011
100%
003
0:02
100%
021
0:27
100%
016
014
100%
011
009
75%
0:18
0-11
75%
0:10
0.00
25%
0:15
0:00
25%
0%0%
0%0% 0:
05
0.05
100%
0% 0:05
0:05
100%
0:00
3% 0:05
0:05
100%
0% 0:05
0:05
100%
0% 0:05
0:05
100%
0% 0:05
0:05
100%
0% 0:05
0:05
100%
0% 0%
0% 0%
0% 0%
Ctin
icV
isit
Tim
eA
vg.
2:02
2:29
1:29
1:17
1:29
0:49
2:29
1:56
1:18
1:20
1:38
2:04
1:23
1:07
128
Std
.0e
v.0:
070:
150:
070:
100:
080:
040:
130:
190:
060:
070:
120:
070:
090:
06008
Val
ueA
dded
Tim
eA
vg.
1:09
0:44
0:40
0:31
0:48
0:29
0:45
0:33
0:38
0:32
1:01
0:42
0:33
038
04
3S
td.
0ev.
0:04
0:07
0:04
0:06
0:04
0:03
0:04
0:04
0:05
0:05
0:12
0.05
0:05
0:08
0:06
NonV
alu
eAd
ded
Tim
eA
vg.
0:53
1:45
0:48
0:45
0:40
0:20
1:44
1:23
0:40
0:48
0:36
1:21
0:50
029
04
5S
td.D
ev.
0:11
0:19
0:11
0:15
0:14
0:05
0:24
0:30
0:08
0:10
0:12
0:09
0:14
0:09
0.11
%V
aLueA
dded
Tim
e56
.59%
29.6
0%45
.42%
40.6
7%54
.06%
58.2
2%39
.06%
28.8
8%48
.46%
40.4
2%63
.15%
34.4
2%39
.89%
56.6
0%49
.09%
1064
81

CC
Cii
M1
VIS
ITS
TA
TIS
TIC
SSU
MM
AR
Y
Tab
le1.
5
Vrac
kim
isdt
irM
m[
tirti
ia1
mtt
[a8
aht
Iit
[N
re
_________}N
V1N
P__
NP
j1W
tG
ener
alS
tati
stic
s
Sam
ple
Siz
e6
399
474
178
409
206
97
54
%O
nT
ime/
Ear
lyA
rriv
als
100.
0089
.74
77.7
880
.85
100.
0088
.24
75.0
077
.50
33.3
380
.00
66.6
788
.89
71.4
310
0.00
50.0
0%
Lat
eArn
vals
0.00
10.2
622
.22
19.1
50.
0011
.76
25.0
022
.50
66.6
720
.00
33.3
311
.11
28.5
70,
0050
.00
Key
lim
eS
umm
ary
lim
ew
ithP
hysi
cian
(Avg
.)
Tim
ew
ithP
hysi
cian
(Std
.0e
v.)
0:48
0:24
0:40
0:26
0:38
0:11
0:14
0:12
0:28
0:21
0:48
0:43
0:26
0:28
0:16
0:06
0:05
0:10
0:11
0:05
0:04
0:09
0:07
0:11
0:12
0:41
0:11
0:07
0:17
0:14
Tim
ew
ithPr
ovid
er(A
vg.)
1:33
0:55
0:51
0:36
0:48
0:33
0:42
0:35
0:39
0:31
0:58
0:53
0:37
0:38
0:44
Tim
ew
ithPr
ovid
er(S
Id.
Dev
.)0:
090:
090:
070:
070:
040:
050:
060:
260:
070:
070:
160:
080:
050:
080:
08T
ime
inE
xam
Roo
m(A
vg.)
1:41
1:39
1:13
0:45
1:09
0:32
1:53
1:31
1:09
0:58
1:09
1:41
0:57
0:47
1:08
Tim
ein
Exa
mR
oom
(SId
.0e
v.)
0:10
0:49
0:47
0:22
0:19
0:12
0:49
1:58
0:28
0:26
0:28
0:23
0:16
0:23
0.37
Wai
tT
ime
(Avg
.)0:
582:
051:
000:
520:
400:
221:
571:
270:
400:
450:
321:
300:
550:
290:
45W
aitT
ime(
Std
.Dev
.)0:
180:
270:
130:
160:
140:
070:
260:
510:
110:
140:
180:
140:
150:
090:
16V
isit
Dur
atio
n(A
vg.)
2:11
2:33
1:40
1:17
1:28
0:52
2:30
1:39
1:27
1:24
1:36
2:03
1:24
1:10
Vis
itD
urat
ion
(S!d
.D
ev)
0:11
1:03
0:41
0:33
0:16
0:15
0:36
0:41
0:28
0:28
0:35
0:17
0:33
0:18
Oth
erS
tati
slic
s
Ave
rage
#C
linic
ians
per
Vis
it3
42
23
22
22
11
32
12
Ave
rage
#E
ncou
nter
spe
rV
isit
23
12
22
22
21
12
21
2
-li
mes
are
liste
din
Hou
rs:M
inut
es
So
wc.
Pat.
oiT
iw
Dei
Co
IIct
,,n
I2a-
4I9
Iciv
wih
Sch
oiu
ioJi
ioS
anpis
Siz
e2
30
Pai
lorb
1:29
0:51
0E48
1

nT
able
1.6
fl
*A
vera
geT
otal
Tim
e,V
alue
Add
edT
ime
and
Non
-Val
ueA
dded
Tim
e
CC
Ch
AM
1T
IME
LIN
ED
UR
AT
ION
SUM
MA
RY
ST
AT
lST
lC
are
the
sum
ofea
chev
ents
tim
em
ultip
lied
byth
e%
ofpa
tien
tsth
atex
peri
ence
dth
atev
ent.
-G
Mse
tsgo
alfo
rva
lue
added
%at
60%
.-
Tim
esar
eli
sted
inH
ours
:Min
utes
Sou
rce:
Pat
ient
Tim
elin
eD
ata
Col
lect
ion
3/29
-4/9
/99
with
Sch
edul
eD
ata
Sam
ple
Siz
e23
0P
atie
nts
Che
ckIn
V0:
0110
0%0:
0110
0%0:
0110
0%
Ret
urn
Pat
ients
St.D
ev.
%of
Pat
ient
s
Wai
tfo
rV
itals
NV
0:22
0:27
100%
0:17
0:22
100%
0:23
0:28
100%
Vita
lsE
ncou
nter
V0:
030:
0210
0%0:
030:
0210
0%0:
030:
0210
0%W
ait
for
Enc
ount
er1
NV
0:27
0:52
100%
0:26
0:23
100%
0:27
0:56
100%
Enc
ount
er1
V0:
190:
1710
0%0:
230:
1110
0%0:
180:
1810
0%W
ait
for
Enc
ount
er2
NV
0:20
0:18
56%
0:20
0:18
64%
0:20
0:18
55%
Enc
ount
er2
V0:
130:
0956
%0:
180:
1464
%0:
120:
0755
%W
ait
for
Enc
ount
er3
NV
0:17
0:10
12%
0:12
0:08
14%
0:19
0:11
12%
Enco
unte
r3V
0:11
0:08
12%
0:12
0:07
14%
0:10
0:08
12%
Wai
tfo
rE
ncou
nter
4N
V0:
170:
197%
0:17
0:19
1%E
ncou
nter
4V
0:04
0:01
7%0:
040:
011%
Che
ckO
utV
0:05
0:05
100%
0:05
0:05
100%
0:05
0:05
100%
Ave
rage
Tot
alV
isit
Tim
e*1:
340:
101:
290:
081:
330:
11
Val
ueA
dded
Tim
e*0:
360:
050:
450:
050:
340:
04
Non
-Val
ueA
dded
Tim
e*1:
030:
180:
570:
141:
030:
19
%V
alue
Add
edT
ime
39%
50%
37%
10E
481

nn
200
180
160
14
0
120
U)
100
C
80 60 40 20 0
..‘
‘&
V
Figu
re1.
7D
oct
or
&P
atie
nt
Ty
pe
Sou
rce:
Pat
ient
Tim
elin
eD
ata
Col
lect
ion
3/29
-4/9
/99
Val
ue-A
dded
vs.
Non
-Val
ue-A
dded
Tim
eof
Pat
ien
tV
isit

fln
Val
ue-A
dded
vs.
Non
-Val
ue-A
dded
Per
centa
ge
ofP
atie
nt
Vis
it
n
i--
;•ç,1,,//
C,
—,,
Fig
ure
1 .7B
Doc
tor
&P
atie
nt
Typ
e
0’ ‘I’ I”
—
100%
80%
60%
4.’ 0 C) I C) 0..
40%
20%
no,
U/0
0N
onV
alue
Add
edT
ime
Valu
eA
dded
Tim
e
Sou
rce:
Pat
ient
Tim
elin
eD
ata
Col
lect
ion
3/29
-4/9
/99
UM
HS
Val
ue-A
dded
Per
centa
ge
Goa
l=
60%

CC
CT
hAM
1S
ES
SIO
ND
UR
AT
ION
SU
MM
AR
Y
•i
PM
Dr.
McD
onaq
hD
r.H
iss
Nur
se
AM
PMA
MPM
AM
PM
4:00
3:57
TUES
DA
Y
Sch
edul
edD
urat
ion
4:00
4:00
4:00
4:00
4:00
Act
ual
Dur
atio
n4:
384:
454:
093:
033:
56W
EDN
ESD
AY Sch
edul
edD
urat
ion
4:00
4:00
4:00
Act
ual
Dur
atio
n5:
156:
094:
17T
HU
RSD
AY S
ched
uled
Dur
atio
n4:
004:
004:
004:
00
Act
ual
Dur
atio
n4:
164:
015:
284:
37FR
IDA
Y
Sch
edul
edD
urat
ion
4:00
4:00
4:00
Act
ual
Dur
atio
n3:
504:
04J5:
04
-T
imes
are
list
edin
i-lo
urs
:Min
ute
s
Sou
rce:
Pat
ient
Tim
elin
eD
ata
Col
lect
Ion
3/2
9-4
i/9
9w
ithS
ched
ule
Dat
aS
ampl
eSI
ze:
230
Sch
edul
edD
urat
ion
4:30
4:30
4:00
Act
ual
Dur
atio
n6:
295:
274:
15
rI
Dr.
Gitl
in
4:00
4:32
10E
481

CC
CT
EA
MFI
RST
PAT
IEN
TSU
MM
AR
Y
-T
,mes
are
list
edn
Hou
rs:M
inut
es
So
.r,.
sP
Mis
,,t
Tii
r.Iu
nsD
ala
Cull
ecli
on
29-4
J99
ScIi
aU
o(
flab
Sn
,pI.
So
,S
C’.
,b
ar.
’I,
b2i0
arrO
,ib
CC
CTE
AM
FIR
STPA
TIE
NT
SUM
MA
RY
Tab
le1
9,co
nI
App
oint
men
tTim
e
Che
ckln
Thn
eT
i57701/9
2/&
Q9
7&
O3
/8
14
/T
i2
2/7
59
7/i2
23
/3
O5
/i2
34
75
2/9
35
/
V8sT
ime
8:00/
9:08/
9:07/
8:15/
8:03/
8:24/
7:55/
8:10//
12:4
6/
13:0
7/
12:5
18:
14/
9:50/
Tim
ein
toE
xam
Roo
m8:
03/
9:11/
9:14/
8:16/
8:04/
8:25/
7:57/
8:11//
12:4
7
/13
:10/
12:5
18:
16/
9:53/
Tim
eot
1st
enco
unte
r8:
30/
9:31/
9:14/
8:42/
8:42/
8:38/
8:20/
8:12//
13:2
0
/14
:25/
13:2
08:
18/
10:5
5/
-T
imes
are
liste
din
t-to
urs:
Min
utes
Tim
elin
eC
ateg
ory
8:00/
9:15/
9:00/
8:00/
8:00
/8
:o
o/
oo’/a:ao//.45/
05/.00
80/9:30
So
urc
eP
.I!.
I1I
I,n
dl,n
UD
ata
CtI
IscIi
u,t
S29-4
I9w
hit
St
iisd
tiiu
Sain
pI*
Sq
.3C
ibi
Ilbi
131)
I,&
wib
aflI
,Ib

Team 4 Findings
Cu,:’ut SituationTeam 4 is headed by team coordinator Robin Napieraiski. It is divided into two specialties, BoneMarrow Transplant (BMT) and Pediatric Oncology (PHO). Patients in the BMT Clinic attendappointments every other day. The physician is determined the day of the appointment for thesepatients depending on patient arrival and physician availability. The following doctors areavailable in the BMT Clinic: Adams, Ayash, Hutchinson, Ratanatharathorn, Silver, Uberti, andYanik. The BMT Clinic sees 541 patients in a month. On the otherhand, PHO sees 398 patients amonth. Both units operate 4 days a week but schedule appointments on Wednesday if necessary.A patient maintains the same physician from appointment to appointment. The following doctorssee patients in the PHO speciality: Boxer, Castle, Hanash, Hutchinson, Levine, Pipe, Robertson,Weschler. and Yanik. The flowchart on page 9 outlines the current patient flow for both BMT andPHO.
Teani 4 AnalysisA high number of patients were willing to fill out the data collection forms, however most of thesepatients were returning patients. In addition, there was a lack of collection in the BMT clinic.This was due to the fact that patients returned every other day to the clinic and did not want to fillout the information again. This would be helpful to the study to see how times change over thedays of the week with the same type of patients. A further study could be done to collect newpatient information and more BMT clinic patients.
Room UtilizationFor Team 4 the room utilization was around 28% on average. This is due to the fact that Team 1and Team 4 share rooms. The average room utilization for Team 1 will show that they are usingrooms that are allocated to Team 4. For the “value added” room utilization, Team 4 has anaverage of 94%. This means that the time the patient spends in the room is mostly spent with aprovider. This is one of our goals: thus Team 4 can be used as a benchmark for the “value added”portion of room utilization. BMT had an overall average of 23% room utilization and 92% “valueadded” room utilization. PHO had an overall average of 30% room utilization and 96% “valueadded” room utilization. This information is shown in Table 4.1. Note that PHO does not runtheir clinic on Wednesdays. To improve upon these numbers Team 4 should give up some of theirrooms to Team 1. This will increase their room utilization and maintain their “value added” roomutilization.
Visit StatisticsThere were 304 usable data collection forms in Team 4. Sixty five percent of the patients wereearly or on time, leaving 35% of the patients late (Table 4.2). When patients arrived early theyarrived an average of 41 minutes early. When patients arrived late, they were late by 3 1 minutes,on average (Figure 4.3). For the entire team the patient spends 1 hour and 2 minutes with aprovider, 44 of those minutes are spent with a physician. For new patients, as would be expected,the patient spends a longer time with providers. New patients spend 1 hour and 46 minutes with aprovider and 1 hour and 24 minutes with the physician. Return patients spend fifty-nine minuteswith providers and forty-one minutes with the physician. The Table showing the time of thesession duration is found in Table 4.4.
Physician StraqficationPhysician information is shown in Tables 4.5, 4.6 and 4.7. Since there are so many doctors it ishard to make a generalization across the board. Overall, doctors are arriving late to the examroom by 48minutes, and are spending more time than allocated with their patients. The scheduleshould be changed to allow for more “value added” time between the patient and their physician.
27

Session DurationIn Team 4, 57% of the time a patient spends at the clinic is “value added’ time. The average timespent in the clinic is 1 hour and 36 minutes. This grows significantly when viewing new patienttimes, an average of 2 hours and 23 minutes. Return patients are close to the overall averagespending 1 hour and 33 minutes in the clinic. The average time spent in the room is 1 hour and 9minutes. New patients spend an average of 1 hour and 44 minutes, while return patients spend57minutes in the exam room. The large amount of blood draws and infusions that could havetaken place in other areas may explain longer times in the exam room. To reduce the overallsession duration the goal would be to increase the “value added” time and decrease the wait times.
First Patient SummaryThe first patient that arrives to the clinic is more likely to be early. The doctors are likely to belate for this visit. This discrepancy is due to the miscommunication of what the appointment timereally means. Improving this communication will dramatically change the arrival times of boththe patient and the doctor to the first scheduled visit.

Team 4— Adult & Pediatric BMT and Pediatric Hematology/Oncology
**Patjeflt sees appropriateprovider depending onspecialty.**
**BMT- Physician, Nurse
Practitioner, Psychiatrist, orSocial WorkerPHO — Physician, Fellow,Nurse Practitioner, or SocialWorker. or Fellow.**

CC
CT
EA
RO
OM
UT
lLZ
AT
lON
SUM
MA
RY
T&4.1
MO
ND
AY
#of
Roo
ms
All
ocat
edH
ours
Ava
ilabl
eP
hysi
cian
Tim
e(A
vera
ge)
Roo
mT
ime
(Ave
rage
)%
Roo
mU
tiliz
atio
n(A
lloca
ted)
%V
AR
oom
Util
izat
ion
(Allo
c.)
TU
ESD
AY
#of
Roo
ms
All
ocat
ed7
78
7H
ours
Ava
ilabl
e4.
54.
54.
54.
5P
hysi
cian
Tim
e(A
vera
ge)
2:20
1:13
3:03
2:40
Roo
mT
ime
(Ave
rage
)1:
121:
051:
021:
00%
Roo
mU
tiliz
atio
n(A
lloca
ted)
48.2
5%24
.44%
72.7
3%56
.57%
%V
AR
oom
Util
izat
ion
(Allo
c.)
97.3
0%88
.20%
98.4
1%95
.24%
WE
DN
ESD
AY
#of
Roo
ms
All
ocat
ed7
70
0H
ours
Ava
ilabl
e4.
54.
50
0P
hysi
cian
Tim
e(A
vera
ge)
0:27
0:19
0:00
0:00
Roo
mT
ime
(Ave
rage
)0:
431:
030:
000:
00%
Roo
mU
tiliz
atio
n(A
lloca
ted)
11.4
3%5.
71%
0.00
%0.
00%
%V
AR
oom
Util
izat
ion
(Allo
c.)
95.5
6%96
.92%
0.00
%0.
00%
TH
UR
SDA
Y#
ofR
oom
sA
lloc
ated
77
87
Hou
rsA
vaila
ble
4.5
4.5
4.5
4.5
Phy
sici
anT
ime
(Ave
rage
)0:
360:
261:
150:
17R
oom
Tim
e(A
vera
ge)
0:59
1:26
0:47
0:37
%R
oom
Util
izat
ion
(Allo
cate
d)9.
52%
2.86
%38
.64%
2.89
%%
VA
Roo
mU
tiliz
atio
n(A
lloc.
)96
.72%
97.7
3%95
.92%
94.8
7%FR
IDA
Y#
ofR
oom
sA
lloc
ated
70
84
Hou
rsA
vaila
ble
4.5
4.5
4.5
4.5
Phy
sici
anT
ime
(Ave
rage
)1:
450:
470:
360:
59R
oom
Tim
e(A
vera
ge)
1:13
1:32
0:42
1:11
%R
oom
Util
izat
ion
(Allo
cate
d)22
.22%
33.3
3%9.
09%
31.8
2%%
VA
Roo
mU
tiliz
atio
n(A
lloc.
)97
.33%
97.8
7%95
.45%
97.2
6%
-T
imes
are
list
edin
Hou
rs:M
inut
es
7 4.5
2:27
0:57
35.7
1%96
.61%
5 4.5
1:59
1:08
34.0
0%57
.14%
8 4.5
0:52
0:51
60.6
1%98
.08%
7 4.5
1:04
1:02
50.7
9%96
.88%
Sour
ca:
Patie
ntT
irne
tine
Dat
aC
olle
ctio
n3/
29-4
/919
9w
ithS
ched
ule
Dat
ao
,pI
‘I
401
I0

#E
arly
Arr
ival
s15
1r
50%
16r
Not
es:
*P
rovi
der
tim
eis
the
aver
age
tim
ew
ithan
ycl
inic
ian
per
visi
t.**
Phy
sici
anti
me
isth
eav
erag
eti
me
with
the
staf
fph
ysic
ian
per
visi
t.
-T
imes
are
liste
din
hour
s:m
inut
es
CC
CT
EA
MS
UM
MA
RIA
TIS
TIC
ST
able
4.2
5.26
%14
5
•..•.
..
.•.•
..
..
AU
Pat
ien
tsN
ewP
atie
nts
Ret
urn
Pat
ients
Cat
eø
9aØ
.StD
aera
iSD
vai
J,ep
ts.é
rag
%of
Pat
ients
I—
—
Gen
eral
Sta
tist
ics:
#P
atie
nts
304
100%
18_
—5.
92%
271
89.1
4%
Ear
lyT
ime
0:28
0:04
0:42
0:18
0:29
0:01
_—
#L
ate
Arr
ival
s10
6i
34.8
7%2
0.66
%10
434
.21%
Lat
eT
ime
0:19
0:03
0:09
0:02
0:25
0:03
rr—
..
Key
Tim
esS
umm
ary:
Prov
ider
Tim
e*1:
020:
061:
460:
050:
590:
05—
Phy
sici
anT
ime
**
0:44
0:02
1:24
0:07
0:41
0:01
Exa
mR
oom
Tim
e1:
000:
061:
440:
050:
570:
05
Clin
icT
ime
1:36
0:09
2:23
0:27
1:33
0:09
Er
47.7
0%
So
urc
e:P
ate
nT
lmeh
rie
Dat
aC
ofle
cton
3)12
-412
199
wIth
Sch
edu
leD
ata

Percent
Dr.BoxerNP
Dr.BoxerRV
Dr.WechslerNP
Dr.WechslerRV
Dr.RobertsonNP
Dr.RobertsonRV
Dr.CastleNP
Dr.CastleRV
Dr.YanikNP
Dr.YanikRV
Dr.AmeriNP
Dr.AmeriRV
Dr.PipeNP
Dr.PipeRV
Dr.HutchinsonNPw
Dr.HutchinsonRV
Dr.HanashNP
Dr.HanashRV-l
Dr.AyashNPCD
Dr.AyashRV
Dr.RatanatharathornNP
Dr.RatanatharathornRV
Dr.UbertiNP
Dr.UbertiRV
Dr.SilverNP
Dr.SilverRV
Dr.ReynoldsNP
Dr.ReynoldsRV
Dr.AdamsNP
Dr.AdamsRV
Team4Overall
ro.C)C)Cooo000
0 0o0
z
I““III”
“I’ll”
CD
I
ED
0-c0-CDCDCD
—
CDCD
3.CD
Cl,0
-ICD
3

‘CT
EA
M4
iSIO
ND
UR
AT
ION
SUM
MA
RY
Tab
le4.
4
Sch
edul
edD
urat
ion
Act
ual
Dur
atio
n
TU
ESD
AY
Sch
edul
edD
urat
ion
4:30
4:30
4:30
4:30
4:30
4:30
4:30
4:30
Act
ual
Dur
atio
n3:
001:
271:
200:
151:
200:
151:
043:
32
WE
DN
ESD
AY
Sch
edul
edD
urat
ion
4:00
Act
ual
Dur
atio
n2:
19
ThU
RS
DA
Y
Sch
edul
edD
urat
ion
4:30
4:30
4:00
Act
ual
Dur
atio
n2:
073:
351:
00
FRID
AY
Sch
edul
edD
urat
ion
4:30
4:30
4:00
4:30
4:30
Act
ual
Dur
atio
n4:
131:
130:
160:
150:
25
BM
T
.,
=,
MO
ND
AY
Sch
edul
edD
urat
ion
4:30
4:30
4:30
4:30
4:30
4:30
4:30
4:30
4:30
4:30
Act
ual
Dur
atio
n0:
501:
341:
360:
581:
340:
202:
153:
024:
434:
23T
UE
SDA
Y
Sch
edul
edD
urat
ion
4:30
4:30
4:30
4:30
4:30
4:30
4:30
4:30
4:30
Act
ual
Dur
atio
n3:
030:
463:
101:
090:
063:
440:
154:
223:
28W
ED
NE
SDA
Y
Sch
edul
edD
urat
ion
4:30
4:30
4:30
4:30
4:30
4:30
4:30
Act
ual
Dur
atio
n1:
221:
063:
251:
020:
102:
202:
59T
HU
RSD
AY
Sch
edul
edD
urat
ion
4:30
4:30
4:30
Act
ual
Dur
atio
n2:
461:
100:
15FR
IDA
Y
Sch
edul
edD
urat
ion
4:30
4:30
4:30
4:30
Act
ual
Dur
atio
n2:
120:
152:
261:
10
4:00
4:21
4:30
4:00
4:30
4:30
0:59
0:10
4:23
2:18
-T
imes
are
list
edin
Hou
rs:M
inut
esS
ourc
eP
atie
nt
Tim
elin
oflr
i(‘
otle
ctir
in‘V
t”/‘
cuith
OIr
,’rt
iito
fl.u

CC
CT
EA
M4
ITS
TA
TIS
TIC
SS
UM
MA
RY
e4.
5
Or
Bo
xr
creáieç
DrQ
bj’
.D
rças
tle
Dr
Yan
ikD
rA
men
Dr
Pip
e
J4:y;.
NP
RV
Gen
eral
Sta
tist
ics
Sam
ple
Siz
e0
81
Ii0
141
70
131
41
3
%O
nT
ime/
Ear
lyA
rriv
als
0.00
%50
%9.
09%
54.5
5%0.
00%
85.7
1%10
0.00
%42
.86%
0.00
%46
.15%
100.0
0%
50.0
0%0.
00%
33.3
3%
%L
ate
Arr
ival
s0.
00%
50%
0.00
%45
.45%
0.00
%35
.71%
0.00
%57
.14%
0.00
%54
.00%
0.00
%50
.00%
100.
00%
66.6
7%K
eyT
ime
Sum
mar
y
Tim
ew
ithP
hysi
cian
(Avg
.)0:
000:
510:
510:
200:
000:
511:
010:
470:
000:
290:
310:
190:
580:
19
Tim
ew
ithP
hysi
cian
(Std
.D
ev.)
0:00
0:52
0:00
0:10
0:00
0:43
0:00
L0:44
0:00
0:19
0:00
0:13
0:00
0:11
Tim
ew
ithP
rovi
der
(Avg
.)0.
00:
460:
590:
340:
001:
020:
510:
330:
000:
484:
030:
331:
301:
13
Tim
ew
ithP
rovi
der
(Std
.D
ev.)
0:00
0:30
0:00
0:16
0:00
0:43
0:00
0:14
0:00
0:17
0:00
0:07
0:00
0:42
Tim
ein
Exa
mR
oom
(Avg
.)0:
001:
001:
031:
160:
001:
552:
001:
280:
000:
464:
251:
171:
471:
31
Tim
ein
Exa
mR
oom
(Std
.D
ev.)
0:0
0J:3
10:
000:
460:
001:
040:
000:
480:
000:
170:
000:
490:
000:
57
Wai
tT
ime
(Avg
.)0:
000:
230:
100:
510:
001:
182:
181:
100:
000:
370:
391:
010:
290:
27
Wai
tT
ime
(Std
.D
ev.)
0:00
0:11
0:00
0:46
0:00
1:08
0:00
0:57
0:00
0:23
0:00
0:48
0:00
0:23
Vis
itD
urat
ion
(Avg
.)0:
001:
001:
031:
160:
001:
552:
001:
280:
001:
104:
271:
171:
471:
31
Vis
itD
urat
ion
(Std
.D
ev.)
0:00
0:30
0:00
0:16
0:00
0:43
0:00
0:14
0:00
0:16
0:00
0:07
0:00
0:42
Oth
erS
tati
stic
s
Ave
rage
#C
lini
cian
spe
rV
isit
01.
0625
01.
750
1.75
11
01.
731
11
1
Ave
rage
#E
nco
unte
rspe
rV
isit
01.
421
1.25
01.
251
1.25
01.
131
.1.
251
1.25
-T
imes
are
list
edin
Hou
rs:M
inut
es
Sou
rce:
Pat
ient
Tim
elin
eD
ata
Col
lect
ion
3/12
-4/2
/99
with
Sch
edule
Dat
aS
ampl
eS
ize
=30
4P
atie
nts
lOE
481

CC
CT
EA
M4
VIS
ITS
TIC
SSU
MM
AR
YP
HO
BM
T
/D
rH
utch
inso
nD
rH
anas
hD
rA
yash
Dr
Rat
anat
hara
thom
Dr
Ube
rtiDr
Sil
ver
Dr
Rey
nold
Dr
Ada
ms
NP
RV
NP
jR
VN
PG
ener
alS
tati
stic
s
Sam
ple
Siz
e0
241
84
291
82
110
83
105
8
%O
nT
ime/
Ear
lyA
rriv
als
0.00
%52
.17%
100.
00%
50.0
0%75
.00%
40.0
0%10
0.00
%50
.00%
100.
00%
50.0
0%10
0.00
%42
.00%
50.0
0%8000%
75.0
0%82
.00%
%L
ate
Arr
ival
s0.
00%
47.8
3%0.
00%
50.0
0%25
.00%
60.0
0%0.
00%
50.0
0%0.
00%
50.0
0%0.
00%
58.0
0%50
.00%
20.0
0%2500%
18.0
0%K
eyT
ime
Sum
mar
y-
-tT
ime
with
Phy
sici
an(A
vg.)
00:
300:
281:
341:
091:
091:
280:
371:
100:
490:
480:
321:
201:
200:
430:
41T
ime
with
Phy
sici
an(S
Id.
Dev
.)0
0:21
0:00
1:37
0:50
0:50
0:00
L0:
201:
340:
480:
090:
371:
13j
1:13
0:34
0:44
Tim
ew
ithP
rovi
der
(Avg
.)0
1:0
I2:
341:
151:
371:
376:
371:
541:
071:
061:
151:
091:
191:
199:
131:
04T
ime
with
Pro
vide
r(S
td.
0ev
.)0
0:43
0:00
1:29
1:03
1:03
0:00
1:10
1:26
0:43
0:44
0:37
0:47
0:47
13:4
30:
45T
ime
riE
xam
Roo
m(A
vg.)
01:
054:
023:
212:
00:
2:00
2:48
1:50
1:39
2:00
1:55
1:25
1:30
1:30
1:20
1:21
Tim
ein
Exa
mR
oom
(Std
.0ev
.)0
0:43
0:00
1:38
1:06
1:06
0:00
0:47
1:32
1:40
0:47
0:35
0:57
0:57
0:36
0:46
Wai
tT
ime
(Avg
.)0
0:42
2:03
2:22
0:40
0:40
0:22
1:12
0:54
1:03
0:55
0:30
0:22
0:22
0:34
0:31
Wai
tT
ime
(Std
.0ev
.)0
0:43
0:00
1:39
0:15
0:15
0:00
1:38
0:14
:1:
390:
050:
170:
180:
180:
320:
42
Vis
itD
urat
ion
(Avg
.)0
1:35
4:04
3:21
2:00
2:00
2:50
1:50
1:39
2:00
1:55
1:25
1:30
1:30
1:20
1:21
Vis
itD
urat
ion
(Std
.D
ev.)
00:
510:
001:
291:
031:
030:
000:
301:
260:
430:
440:
370:
470:
470:
300:
45O
ther
Sta
tist
ics
Ave
rage
#C
lini
cian
spe
rV
isit
01.
421
1.5
12
11
11.
251
1.75
11
11
Ave
rage
#E
nco
unte
rspe
rV
isit
01.
481
1.25
11
11.
251
1.25
11.
251
1.25
11
-T
imes
are
list
edin
Hou
rs:M
inut
es
Sou
rce:
Pat
ient
Tim
elin
eD
ata
Col
lect
ion
3/12
-4/2
/99
with
Sch
edule
Dat
aS
ampl
eS
ize
=30
4P
atie
nts
lOE
4Bt

CC
CT
EA
M4
FIR
ST
PA
TIE
NT
SU
MM
AR
YT
able
4.6
P1-1
0
Dr.
Box
erD
r.W
esch
lér
Dr
Rob
erts
on3/
1231
194/2
3/15
3/29
3/16
3/23
3)30
‘‘A
M’
Ap
po
intm
entT
ime
13:0
09:
0013
:30
10:0
08:
4510
:15
12:4
58:
3013
:30
8:30
13:3
08:
3013
:30
Chec
kIn
Tim
e13
:16
9:00
13:4
59:
428:
0010
:09
11:4
58:
2013
:25
8:30
13:2
98:
049:
37
Vit
aisT
ime
13:2
9:00
13:5
99:
548:
3010
:18
11:5
29:
0513
:28
8:33
13:3
28:
1410
:41
Tim
ein
toE
xam
Roo
m13
:30
9:03
14:0
29:
588:
4510
:24
13:3
49:
0713
:29
8:38
13:3
58:
3710
:45
Tim
eof
1st
enco
unte
r13
:31
9:14
14:0
210
:10
8:46
10:2
413
:34
9:07
13:2
98:
3813
:58
8:37
10:4
7P
HO
..
.
:..
.-.
::
Dr
Cas
tle
Dr
Yan
ikD
rA
men
N
-
4/1
3/23
3/30
4/1
3/16
3/23
3/30
...,..
..
.,
Tim
eith
eN
AM
PM
Pfr
MAM
PM
App
oint
men
tT
ime
9:00
13:0
09:
0013
:30
9:30
10:0
09:
109:
0010
:00
Chec
kin
Tim
e9:
2313
:14
9:25
12:2
510
:12
9:40
9:10
8:30
9:55
Vita
lsT
ime
9:23
13:2
09:
4012
:58
10:3
09:
519:
408:
4110
:10
Tim
ein
toE
xam
Roo
m9:
2513
:40
9:44
13:0
211
:03
9:56
9:43
8:44
10:1
4
Tim
eof
1st
enco
unte
r9:
3313
:40
9:55
13:2
011
:03
9:58
9:47
9:11
10:4
2
Souic
Pjt
iil
Itii
e(ii
eD
iCa
Co
tIc1
iui1
3I1
2-4
/2/)
wtt
Sch
tldu
l60aa
Sam
ple
Siz
e-
861
sIP
atie
nts
out
of‘5
)4P
atie
nts
10E
481
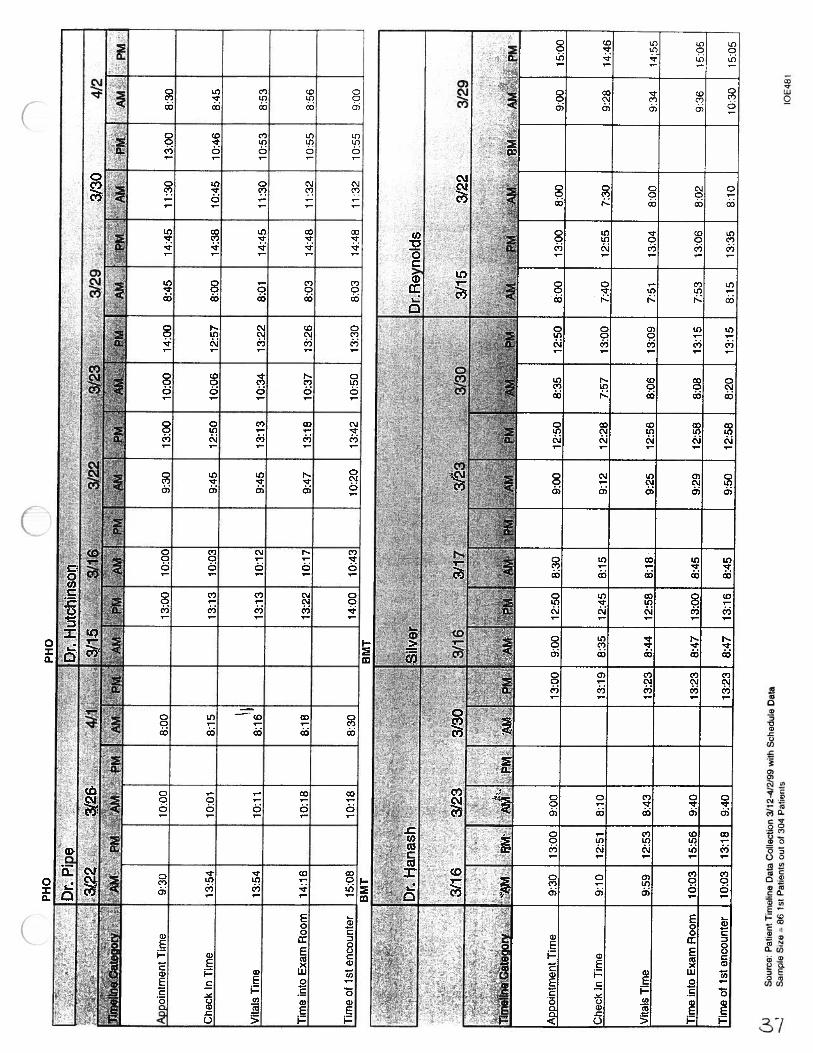
PH
OP
HO
Dr
Pip
eD
rH
utch
inso
n-
3/22
3/26
4)1
.%
.3/1
53/
163)
223/
233)
293)
304/
2:.
PM
A:
MA
M•‘
iit
PM
.M
:’•A
M.
PM:*
AM
.P
MA
M.
PM
Appoin
tmen
tTm
e9:
3010
:00
8:00
13:0
010
:00
9:30
13:0
010
:00
14:0
08:
4514
:45
11:3
013
:00
8:30
Che
ckIn
Tim
e13
:54
10:0
18:
1513
:13
10:0
39:
4512
:50
10:0
612
:57
8:00
14:3
810
:45
10:4
68:
45
Vit
aisT
ime
13:5
410
:11
8:16
13:1
310
:12
9:45
13:1
310
:34
13:2
28:
0114
:45
11:3
010
:53
8:53
Tim
ein
toE
xam
Roo
m14
:16
10:1
88:
1813
:22
10:1
79:
4713
:18
10:3
713
:26
8:03
14:4
811
:32
10:5
58:
56
Tim
eo
fist
encounte
r15
:08
10:1
88:
3014
:00
10:4
310
:20
13:4
210
:50
13:3
08:
0314
:48
11:3
210
:55
9:00
BM
TB
MT
-
‘
p—
Dr
Han
ash
‘S
aver
Dr
Rey
nold
s
-‘.-
3/16
3/23
—3/
303/
163/
17—
3/23
3/30
3/15
3/22
3/29
-c
LA
M.
PM’
AM
..
AM
‘:P
M.*4A
::M
IPM
App
oint
men
tT
ime
930
13:0
09:
0013
:00
9:00
12:5
08:
309:
0012
:50
8:35
12:5
08:
0013
:00
8:00
9:00
15:0
0
Chec
kln
Tim
e9:
1012
:51
8:10
13:1
98:
3512
:45
8:15
9:12
12:2
87:
5713
:00
7:40
12:5
57:
309:
2814
:46
Vita
lsT
ime
9:59
12:5
38:
4313
:23
8:44
12:5
88:
189:
2512
:56
8:06
13:0
97:
5113
:04
8:00
9:34
14;5
5
Tim
ein
toE
xam
Roo
m10
:03
15:5
69:
4013
:23
8:47
13:0
08:
459:
2912
:58
8:08
13:1
57:
5313
:06
8:02
9:36
15:0
5
Tim
eof
1st
enco
unte
r10
:03
13:1
89:
4013
:23
8:47
13:1
68:
459:
5012
:58
8:20
13:1
58:
1513
:35
8:10
10:3
015
.05
(JJ
Sou
rce:
Pat
ient
Tim
elir
ieD
ata
Col
lect
ion
3/12
-4/2
/99
with
Sch
edul
eD
ata
—J
Sam
ple
Siz
e86
is?
Pat
ient
sO
utol
304
Pat
ient
s10
E48
1

BM
T
Sou
rce:
Pat
ient
Tir
nelin
eD
ata
Col
lect
ion
3/12
-4/2
/99
with
Sch
edul
eD
ata
Sam
ple
Sit
e=
861s
tP
atie
nts
out
of30
4P
atie
nts
;;:
Dr
:Aya
sh.*
.:
3I17
4*3/19
3/2
24
S/2
S3
/24
3/26
3/30
4/2
rP
WP
MA
M..
PM
...
.A
MPM
AM
..PM
App
oint
men
tT
ime
8:30
10:0
09:
009:
309:
3010
:00
14:3
09:
009:
3013
:00
9:30
Che
ckIn
Tim
e8:
149:
559:
189:
339:
0310
:32
14:3
89:
309:
1512
:54
9:39
Vita
lsT
ime
8:14
10:0
59:
309:
509:
0510
:35
14:4
49:
409:
1613
:07
10:1
5
Tim
ein
toE
xam
Ro
om
8:17
10:0
79:
379:
549:
2110
:39
14:4
69:
439:
2013
:10
10:1
9
Tim
eof
1st
enco
unte
r8:
2010
:22
9:45
9:54
9:21
10:4
215
:30
10:0
09:
3813
:10
1019
BM
T
Dr
Rat
anat
hara
thor
n.
Ube
rti
.:;
•;.
:...
...•
..
‘r
—/
3/15
3/19
3I2
2.
3/2
33/
294/
13/
153/
163/
17.
*j
:..
LeairV
PM
J4W
rA
tP
M=A
MAM
PMAM
PMA
MPM
AM
PM
App
oint
men
tT
ime
13:0
013
:00
9:00
13:0
013
:00
8:30
13:0
08:
0015
:30
8:30
Che
ckIn
Tim
e13
:00
13:0
08:
4512
:56
12:0
28:
3012
:55
7:43
15:1
58:
20
Vita
lsT
ime
15:1
513
:10
8:45
13:0
013
:10
8:30
13:0
47:
5415
:30
8:20
Tim
ein
toE
xam
Roo
m15
:35
13:1
48:
4913
:26
13:2
08:
3213
:07
7:55
15:4
08
:24
Tim
eof
1st
enco
unte
r15
:35
13:4
58:
4913
:26
13:2
09:
5513
:17
7:56
15:4
09
:10 10
E48
1

Sou
ice:
Pat
ient
Tim
elin
eD
ata
Col
lect
ion
3112
-4/2
199
with
Sch
edul
eD
ata
Sam
ple
Size
=86
1st
Pat
ient
sou
t01
304
Pat
ient
s
--
App
oint
men
tT
ime
8:00
13:3
08:
009:
3013
:00
8:30
9:00
13:3
0
3/31
9:00
PM.
-A
MPM
AM4/
2
9:00
15:0
09:
0013
:30
9:00
PM
Che
ckIn
Tim
e7:
4512
:00
7:40
9:07
12:5
08:
378:
4013
:29
9:44
8:48
14:4
48:
2513
:15
8:45
Vit
als
Tim
e7:
5712
:45
8:17
9:15
13:0
08:
458:
4913
:37
10:0
58:
5014
:48
8:29
15:2
39:
02
Tim
ein
toE
xam
Roo
m8:
0012
:47
8:20
9:17
13:0
58:
508:
5113
:39
10:0
68:
5214
:55
8:33
15:2
69:
04
Tim
eof
1st
enco
unte
r8:
0012
:50
8:20
9:40
13:1
99:
008:
5113
:55
10:1
79:
2314
:55
8:42
15:3
09:
46 10E
481

CC
”T
EA
M4
TIM
EL
INE
PHO D
r.B
oxer
-T
imes
are
list
edin
Hou
rs:M
inut
es
Sou
rce:
Pat
ient
Tim
elin
eD
ata
Col
lect
ion
3/12
-4/2
)99
with
Sch
edul
eD
ata
Sam
ple
Siz
e=
304
Pat
ient
s
Ta
__
__
__
__________________
-,D
r.C
astle
.:.j.
Dr.
Am
arI
Dr.
lpe
Dr.
Hut
chin
s....
..
-..
.
.:•°)3
i
lp-
$i%
f4!
lRFV
.P
fIVN
PFW
NP
FfV
Che
ckIn
0:01
0:01
0:01
0:01
0:01
0:01
0:01
0:01
0:01
0.01
Wai
tfor
Vit
atsE
ncou
nter
Avg
.0:
070:
040:
070:
221:
070:
130:
130:
150:
070:
12S
td.D
ev.
0:05
0:08
0:26
0:10
0:10
0:08
0:08
0:11
Per
cent
age
100%
100%
100%
100%
100%
100%
100%
100%
100%
100%
Vita
lsE
ncou
nter
Avg
.0:
030:
020:
040:
020:
030:
020:
030:
030:
070:
06S
td.
Day
.0:
000:
040:
010:
000:
010:
010:
060:
15P
erce
nta
ge
100%
100%
100%
100%
100%
100%
100%
100%
100%
100%
Wai
tfo
rE
ncou
nter
1A
vg.
0:07
0:06
0:11
0:09
028
0:07
0:09
0:13
0:18
0:16
Std
.Dev
.0:
070:
130:
140:
070:
110:
120:
260:
30P
erce
ntag
e10
0%10
0%10
0%10
0%10
0%10
0%10
0%10
0%10
0%10
0%E
ncou
nter
1A
vg.
0:50
0:51
0:17
0:30
0:44
0:26
0:27
0:17
0:27
0:23
Std.
0ev.
0:4
l0:
080:
210:
170:
200:
080:
210:
18P
erce
nta
ge
ioo4
i10
0%10
0%10
0%10
0%10
0%10
0%10
0%10
0%10
0%W
ait
tor
Enc
ount
er2
Avg
.0:
050:
190:
050:
050:
200:
190:
030:
430:
24St
d.D
ev.
0:04
Q:2
20:
05-
0:28
0:05
-0:
04-
0:45
0:27
Per
cent
age
100%
20%
44%
100%
33%
15%
33%
40%
39%
Enc
ount
er2
Avg
.0:
130:
090:
450:
170:
210:
090:
040:
030:
17St
d.D
ev.
0:30
0:04
0:39
0:40
0:00
0:06
0:02
0:20
Per
centa
ge
100%
20%
44%
100%
33%
15%
33%
40%
39%
Wai
tfo
rE
ncou
nter
3A
vg.
0:01
0:01
0:00
0:02
0:34
Std
.0e
v.0:
48P
erce
nta
ge
7%10
0%22
%17
%13
%E
ncou
nter
3A
vg.
0:06
0:15
1:00
2:53
0:07
Std
.0ev
.0:
07P
erce
ntag
e7%
100%
22%
17%
13%
Wai
tfo
rE
ncou
nter
4A
vg.
0:00
SId.
Day
.
Per
centa
ge
7%
Enc
ount
er4
Avg
.0:
13
Std
.D
ev.
Per
centa
ge
..
Che
ckO
utA
vg.
0:05
0:05
0:05
0:05
0:05
0:05
0:05
0:05
0:05
0.05
Std.
0ev.
0:05
0:05
0:05
0:05
0:05
0:05
0:05
0:05
0:05
0.05
Per
centa
ge
100%
100%
100%
100%
100%
100%
100%
100%
100%
100%
Clin
icV
isit
Tim
e1:
311:
060:
531:
333:
051:
221:
031:
271:
241:
27
Val
ueA
dded
Tim
e1:
120:
580:
300:
581:
240:
550:
370:
560:
420:
44
Non
Val
ueA
dded
Tim
e0:
190:
100:
220:
341:
410:
260:
250:
300:
420:
42
%V
alue
Add
edT
ime
78.6
3%85
.43%
57.9
2%62
.80%
45.6
0%67
.17%
60.0
7%64
.75%
49.5
1%50
.80%
10E
481

n
-T
imes
are
liste
din
Hou
rs:M
inut
es
Sou
rce:
Pat
ient
Tim
elin
eD
ata
Cot
lect
ion
3/12
-4/2
/99
with
Sch
edul
eD
ata
Sam
ple
Size
=30
4P
atie
nts
nB
MT
Dr.
Han
ash
Dr.
Aya
sh-
DiR
-ll,om
Dr.
Sil
ver
Dr.
Rey
nold
sD
r.A
dam
s
-......
..
7’
Gaego’
NP
JWN
P-.
RVN
?N
L.R
VN
P.
liv
.>
NP
RVC
heck
In-
--
0:01
0:01
0:01
0:01
0:01
0:01
0:01
0:01
0:01
0:01
0:01
0:01
0:01
0:01
Wai
tfo
rV
itals
Enc
ount
erA
vg.
0:33
0:14
0:15
0:08
0:09
0:30
0:20
0:08
0:13
0:12
0:10
0:11
0:13
0:13
Std.
Dev
.0:
180:
060:
130:
470:
080:
080:
020:
080:
080:
080:
170:
17P
erce
nta
ge
100%
100%
100%
100%
100%
100%
100%
100%
100%
100%
100%
100%
100%
100%
Vita
lsE
ncou
nter
Avg
.0:
030:
020:
020:
020:
030:
030:
020:
040:
060:
020:
020:
020:
020:
02St
d.D
ev.
0:00
0:01
0:01
0:01
0:00
0:00
0:03
0:01
0:01
0:00
0:00
0:00
Per
centa
ge
100%
100%
100%
100%
100%
100%
100%
100%
100%
100%
100%
100%
100%
100%
Wai
tlo
tE
ncou
nter
1A
vg.
0:00
0:06
0:04
0:13
0:09
0:17
0:05
0:36
0:00
0:26
0:05
0:20
0:03
0.09
Std.
Dev
.0:
090:
080:
150:
290:
070:
070:
000:
430:
060:
180:
040:
04P
erce
nta
ge
100%
100%
100%
100%
100%
100%
100%
100%
100%
100%
100%
100%
1 00%
100%
Enc
ount
er1
Avg
.0:
150:
560:
450:
231:
100:
291:
100:
200:
310:
220:
470:
190:
380:
29
Std
.Dev
.4
1:31
0:43
0:13
0:25
1:34
-1:
340:
15-
0:19
0:33
0:08
0:26
0:26
Per
cent
age
100%
100%
100%
100%
100%
100%
100%
100%
100%
100%
100%
100%
100%
1000
/0W
ait
for
Enco
unte
r2A
vg1:
420:
320:
020:
050:
180:
410:
070:
000:
090:
320:
300:
01010
Std.
Dev
.0:
520:
020:
060:
020:
130:
510:
08P
erce
ntag
e10
0%38
%10
0%34
%10
0%25
%50
%50
%50
%67
%33
%20
%49
%E
ncou
nter
2A
vg.
0:13
0:38
0:23
0:53
0:18
0:31
0:53
0:35
0:22
0:49
0:21
0:25
0:23
Std.
Day
.1:
030:
221:
360:
020:
331:
050:
18P
erce
ntag
e10
0%38
%10
0%34
%10
0%25
%50
%50
%50
%67
%33
%20
%49
%W
ait
for
Enc
ount
er3
Avg
.0:
160:
000:
340:
070:
050:
150:
100:
020:
08S
td.D
ev.
0:14
Per
centa
ge
13%
20%
7%10
0%17
%50
%11
%7%
Enc
ount
er3
Avg
.0:
011:
150:
420:
330:
070:
300:
030:
23St
d.D
ev.
0:04
Per
cent
age
13%
20%
7%10
0%-
—17
%50
%11
%7%
Wai
tfo
rE
ncou
nter
4A
vg.
0:05
Std.
13ev
.
Per
cent
age
7%E
ncou
nter
4A
vg.
0:59
Std.
0ev.
Per
centa
ge
7%C
heck
Out
Avg
.0:
050:
050:
050:
050:
050:
050:
050:
050:
050:
050:
050:
050:
050:
05St
d.13
ev.
0:05
0:05
0:05
0:05
0:05
0:05
0:05
0:05
0:05
0:05
0:05
0:05
0:05
0:05
Per
centa
ge
100%
100%
100%
100%
100%
100%
100%
100%
100%
100%
100%
100%
1 00%
100%
Clin
icV
isit
Tim
e2:
511:
531:
531:
192:
521:
451:
431:
481:
361:
251:
591:
161:
081:
23
Val
ueA
dded
Tim
e0:
361:
181:
310:
522:
090:
461:
180:
581:
150:
411:
220:
340:
510:
55
Non
Val
ueA
dded
Tim
e2:
150:
350:
220:
260:
430:
580:
250:
500:
200:
430:
370:
420:
170:
28
%Y
atu
eAd
ded
Tim
e21
.35%
69.0
6%80
.47%
66.4
6%75
.13%
44.2
1%75
.77%
53.4
8%78
.68%
48.8
5%69
.08%
45.0
4%75
.17%
66.2
4%
05481

CC
CTE
AM
TIM
ELIN
EI
AT
ION
SUM
MA
RY
STA
TIS
TIC
ST
able
4.8
...,
..,.
All
Pati
ents
:.;.
...
.N
ewP
ati
eñtS
.;:,
‘.
..
..:...
J.
7C
ateg
ory
Ave
rage
St
Dey
%o
fP
atIe
nts
Ave
rage
StD
ev!f
otP
atl
ents
Ave
rage
)L
StD
ey%
ofkP
afle
nts
Tim
elin
e:C
heck
InV
0:01
100%
0:01
100%
0:01
100%
Wai
tfo
rV
itals
NV
0:26
0:09
100%
0:14
0:19
100%
0:13
0:14
100%
Vita
lsV
0:03
0:03
100%
0:02
0:01
100%
0:03
0:04
100%
Wai
tfo
rE
ncou
nter
1N
V0:
150:
0010
0%0:
140:
0710
0%0:
150:
0010
0%E
ncou
nter
1V
0:27
0:58
100%
0:51
0:02
100%
0:26
1:02
100%
Wai
tfo
rE
ncou
nter
2N
V0:
190:
5373
%0:
170:
247%
0:20
0:58
66%
Enc
ount
er2
V0:
160:
2373
%0:
310:
167%
0:15
0:24
66%
Wai
tfor
Enc
ount
er3
NV
0:13
0:05
18%
0:04
0:04
3%0:
140:
0615
%E
ncou
nter
3V
0:30
0:17
18%
0:30
0:17
3%0:
260:
2115
%W
ait
for
Enc
ount
er4
NV
0:29
0:08
4%0:
000:
000%
0:29
0:08
4%E
ncou
nter
4V
0:29
0:36
4%0:
000:
000%
0:29
0:36
4%C
heck
Out
V0:
050:
0510
0%0:
050:
0510
0%0:
050:
0510
0%
Ave
rage
Tot
alV
isit
Tim
e*1:
362:
221:
33
Val
ueA
dded
Tim
e*0:
541:
020:
49
Non
-Val
ueA
dded
Tim
e*0:
580:
290:
44
%V
alue
Add
edT
ime
57%
44%
54%
*_I
—*
Ave
rage
Tot
alT
ime,
Val
ueA
dded
Tim
ean
dN
on-V
alue
Add
edT
ime
are
the
sum
ofea
chev
ents
time
mul
tiplie
dby
the
%of
pati
ents
that
expe
rien
ced
that
even
t.
-G
Mse
tsgo
alfo
rva
lue
adde
d%
at60
%.
-T
imes
are
liste
din
Hou
rs:M
inut
es
.a
PaH
rn&
rno
DI
Co
flohon
3/12
-412
/99
wh
&he4uII)I
—30
4

n
Tea
m4
Arr
ival
Tim
eof
Pat
ients
14O
-
120
tfY
2fl
YJ
100-
C.)
QA
G)“1
a) LL.
2:
-
II
II
II
II
Arr
ival
Tim
e(m
inu
tes)
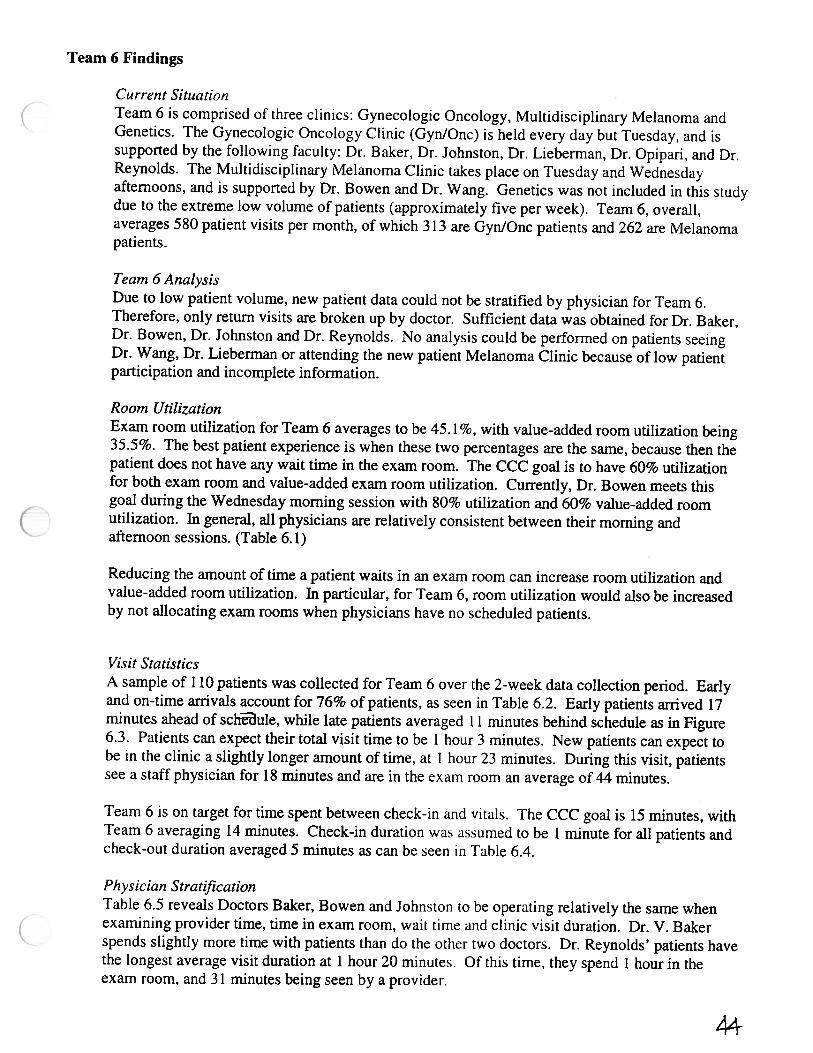
Team 6 Findings
Current SituationTeam 6 is comprised of three clinics: Gynecologic Oncology, Multidisciplinary Melanoma andGenetics. The Gynecologic Oncology Clinic (Gyn/Onc) is held every day but Tuesday, and issupported by the following faculty: Dr. Baker, Dr. Johnston, Dr. Lieberman, Dr. Opipari, and Dr.Reynolds. The Multidisciplinary Melanoma Clinic takes place on Tuesday and Wednesdayafternoons, and is supported by Dr. Bowen and Dr. Wang. Genetics was not included in this studydue to the extreme low volume of patients (approximately five per week). Team 6, overall,averages 580 patient visits per month, of which 313 are GynlOnc patients and 262 are Melanomapatients.
Team 6 AnalysisDue to low patient volume, new patient data could not be stratified by physician for Team 6.Therefore, only return visits are broken up by doctor. Sufficient data was obtained for Dr. Baker,Dr. Bowen, Dr. Johnston and Dr. Reynolds. No analysis could be performed on patients seeingDr. Wang, Dr. Lieberman or attending the new patient Melanoma Clinic because of low patientparticipation and incomplete information.
Room UtilizationExam room utilization for Team 6 averages to be 45.1%, with value-added room utilization being35.5%. The best patient experience is when these two percentages are the same, because then thepatient does not have any wait time in the exam room. The CCC goal is to have 60% utilizationfor both exam room and value-added exam room utilization. Currently, Dr. Bowen meets thisgoal during the Wednesday morning session with 80% utilization and 60% value-added roomutilization. In general, all physicians are relatively consistent between their morning andafternoon sessions. (Table 6.1)
Reducing the amount of time a patient waits in an exam room can increase room utilization andvalue-added room utilization. In particular, for Team 6, room utilization would also be increasedby not allocating exam rooms when physicians have no scheduled patients.
Visit StatisticsA sample of 110 patients was collected for Team 6 over the 2-week data collection period. Earlyand on-time arrivals account for 76% of patients, as seen in Table 6.2. Early patients arrived 17minutes ahead of schule, while late patients averaged 11 minutes behind schedule as in Figure6.3. Patients can expect their total visit time to be 1 hour 3 minutes. New patients can expect tobe in the clinic a slightly longer amount of time, at 1 hour 23 minutes. During this visit, patientssee a staff physician for 18 minutes and are in the exam room an average of 44 minutes.
Team 6 is on target for time spent between check-in and vitals. The CCC goal is 15 minutes, withTeam 6 averaging 14 minutes. Check-in duration was assumed to be 1 minute for all patients andcheck-out duration averaged 5 minutes as can be seen in Table 6.4.
Physician StratificationTable 6.5 reveals Doctors Baker, Bowen and Johnston to be operating relatively the same whenexamining provider time, time in exam room, wait time and clinic visit duration. Dr. V. Bakerspends slightly more time with patients than do the other two doctors. Dr. Reynolds’ patients havethe longest average visit duration at 1 hour 20 minutes. Of this time, they spend 1 hour in theexam room, and 31 minutes being seen by a provider.

Value-added time is any time a patient is being seen by a provider. Team 6 averages 41 % value-added time overall, with 25% for new patients and 56% for return visits, as seen in Table 6.6. Dr.Johnston has the best value-added time at 58.33%. just below the 60% goal. Figure 6.7 and Table6.4 shows Dr. Baker and Dr. Bowen to have very similar value and non-value added times. Dr.Reynolds has significantly more non-value-added time than the other physicians.
Session DurationLooking at Table 6.8, actual session duration is less than the scheduled duration, on average. Forsome physicians the abnormally low duration is due to the fact that patients are not scheduledduring the entire session. Because the exam room is allotted for the entire session, when thephysician only uses it for a portion of that session, exam room utilization tends to be low.
First Patient SummaryExamining the first patient of each session per doctor, per day shows that Team 6 physicians, onaverage, see patients 6 minutes after their scheduled appointment time with a standard deviation of15 minutes. See Table 6.9, Team 6 First Patient Summary.
4

TEAM 6— Gynecologic Oncology and Multidisciplinary Melanoma Clinic

CC
CT
EA
M6
RO
OM
UT
ILIZ
AT
ION
SUM
MA
RY
‘JUilZdLii.Iii
flh
iUU
.j—
--—
--
--
TU
ESD
AY
Uof
Roo
ms
Allo
cate
d4
Hou
rsA
vaila
ble
4
Pro
vide
rT
ime
(Sum
)8.
3R
oom
Tim
e(S
um)
8.8
%R
oom
Util
izat
ion
(Allo
cate
d)5
5.0
%
%V
AR
oom
Util
izat
ion
(Allo
c.)
51.6
%-___
WE
DN
ESD
AY
I
9of
Roo
ms
Allo
cate
d6
115
Hou
rSA
vaila
ble
44
4P
rosi
derT
ime
(Sum
)9.
312
.57.
5R
oom
Tim
a(S
um)
10
.82
0.0
8.0
%R
oom
Util
izat
ion
(Allo
cate
d)45
.0%
45.5
%40
.0%
%V
AR
oom
Util
izat
ion
(Allo
c.)
-
-36
.8%
-28
.4%
37.3
%T
HU
RSD
AY U
ofR
oom
sA
lloca
ted
Hou
rsA
velt
abte
Prov
Ider
Tim
e(S
um)
Roo
mT
ime
(Sum
)
%R
oom
Util
izat
ion
(Allo
cate
d)
%V
AR
oom
Util
Izat
ion
(Allo
c.)
FRID
AY
#ofR
oom
sAll
ocat
ed1
16
6H
ou
rsA
vail
able
44
44
Pro
vide
rTim
e(S
um)
2.4
1.7
4.5
-6
.6R
oo
mT
ime(
Su
m)
3.2
1.7
9.5
11.4
%R
oom
Util
izat
ion
(Allo
cate
d)80.0
%43
.3%
r39
.4%
47
5%
%V
AR
oom
Util
izat
ion
(Allo
c.)
60.0
%-
43.3
%1
8.8
%27.5
%
Sou
rce.
Pat
ient
Tlir
ielln
aD
ata
Co
llec
tio
n:3
/29
4/91
99W
ithS
ched
ule
Dat
aS
amp
leS
ize
=11
0P
atie
nts
Tim
esar
eli
sted
InH
ours
:Min
utea
MO
ND
AY
Uof
Roo
ms
Allo
cate
d
Hou
rsA
vail
able
Pro
vide
rT
ime
(Sum
)
Roo
mT
i’tje
(Sum
)
%R
oom
Util
izat
ion
(Allo
cate
d)
.V
AR
oom
6 4.5
7.1
7.9
29.4
%
2.2
%
6 4.5
6.3
7.0
25.9
%
29.2
°/
10F
481

Not
es:
*P
rovi
der
tim
eis
the
aver
age
tim
ew
ithan
ycl
inic
ian
per
visi
t.**
Phy
sici
anti
me
isth
eav
erag
eti
me
with
the
staf
fph
ysic
ian
per
visi
t.Si
xpat
ients
coul
dno
tbe
iden
tifi
edas
new
orre
turn
dat
afo
rman
dsc
hed
ule
.
-T
imes
are
list
edin
hours
:min
ute
s
Sou
rce:
Pat
ient
Tim
elin
eD
ata
Col
lect
ion
3/29
-4/9
/99
with
Sch
edule
Dat
aS
ampl
eS
Ize
=11
0P
atie
nts
Tab
le6.
2
CC
CT
EA
M6
SUM
MA
RY
STA
TIS
TIC
S
#P
atie
nts
”’11
010
0%24
Ret
urn
Pat
ients
St.,D
ev.
#E
arly
Arr
ival
s84
76%
1817
%61
Ear
lyT
ime
0:17
0:19
0:19
0:18
0:17
0:19
#L
ate
Arr
ival
s25
23%
65%
181 7
°,—
22%
%of
Pat
ient
s
80
Lat
eTim
e0:
110:
080:
080:
030:
12
73%
0:10
*W
.
.,.
Key
Tim
esS
um
mar
y:
Pro
vide
rT
ime*
0:26
0:20
0:21
0:20
0:32
0:17
Phy
sici
anT
ime
**
0:18
0:15
100%
0:21
0:15
22%
0:15
0:15
73%
Exa
mR
oom
Tim
e0:
440:
241:
040:
500:
210:
16
Clin
icT
ime
1:03
0:30
1:23
0:34
0:57
0:27
10E
481

60 40
>1
0 a) z30
a) I..
U-
20
Tea
m6
Ear
ly/L
ate
Pat
ient
Arr
ival
s
0
Fig
ure
6.3
-60
-20
4060
8010
0M
ore
50 10
-100
-80
-40
020
Tim
e(m
inute
s)
Sou
rce:
All
Pat
ients
ICE
481
Sou
rce:
Pat
ient
Tim
elin
eD
ata
Col
lect
ion
3/29
-4/9
/99
with
Sch
edul
eD
ata
Sam
ple
Siz
e=
110
Pat
ient
s
CC
CTE
AM
6T
IME
LIN
E
Che
ckIn
(100
%of
patie
nts)
Wai
tfo
rV
itals
Enc
ount
er
Vita
lsE
ncou
nter
(100
%of
patie
nA)
:Joh
flst
ofl
0:01
Avg
.
Std
.D
ev.
0:01
0:14
0:14
RV
Dr.
Rey
nold
s
Avg
.
Std
.D
ev.
0:14
0:14
0:04
0:05
Wai
tfo
rE
ncou
nter
1(1
00%
ofpa
tient
s)
Enc
ount
er1
(1O
0%of
patie
nts)
Wai
tfo
rE
ncou
nter
2(3
9%of
patie
nts)
Enc
ount
er2
(39%
ofpa
tient
s)
Che
ckO
ut(1
00%
ofpa
tient
s)
Avg
.
Std.
Dev
.
Avg
.
Std
.D
ev.
Avg
.
Std.
Dev
.
Avg
.
Std
.D
ev.
Avg
.
Std
.D
ev.
0:01
0:14
0:14
0:04
0:05
0:09
0:08
0:09
0:07
0:03
0:02
0:08
0:05
0:05
0:09
0:04
0:07
0:21
0:26
0:03
0:02
0:08
0:02
0:05
0:09
0:04
0:05
0:09
0:08
0:11
0:04
0:04
0:03
0:17
0:13
0:05
0:09
0:01
0:14
0:14
0:04
0:05
0:23
0:22
0:17
0:17
0:15
0:11
0:10
0:04
0:05
0:09
Clin
icV
isit
Tim
eA
vg.
0:53
0:51
0:48
1:20
Std
.Dev
.0:
240:
210:
170:
13V
alue
Add
edT
ime
Avg
.0:
250:
250:
280:
31S
td.D
ev.
0:21
0:12
0:11
0:23
Non
Val
ueA
dded
Tim
eA
vg.
0:28
0:26
0:20
0:49
Std
.D
ev.
0:17
0:17
0:15
0:16
%V
alue
Added
Tim
e47
.17%
49.0
2%58
.33%
38.7
5%
-T
imes
are
list
edin
Hou
rs:M
inut
es*
The
rew
asno
ten
ough
data
tost
ratif
yE
ncou
nter
3by
phys
icia
n
lOE
481

CC
CT
EA
M6
VIS
ITST
AT
IST
ICS
SUM
MA
RY
-T
imes
are
list
edin
Hou
rs:M
inut
es
Sou
rce:
Pat
ient
Tim
elin
eD
ata
Col
lect
ion
3/29
-4/9
/99
with
Sch
edule
Dat
aS
ampl
eS
ize
=11
0P
atie
nts
Tab
le6.
5
Gen
eral
stat
isti
cs
Sam
ple
Siz
e
%O
nT
ime/
Ear
lyA
rriv
als
%L
ate
Arr
ival
s
Key
Tim
eS
um
mar
y
Tim
ew
ithP
hysi
cian
(Avg
.)
Tim
ew
ithP
hysi
cian
(Std
.D
ev.)
Tim
ew
ithP
rovi
der
(Avg
.)
Tim
ew
ithP
rovi
der
(Std
.D
ev.)
Tim
ein
Exa
mR
oom
(Avg
.)
Tim
ein
Exa
mR
oom
(Std
.D
ev.)
Wai
tT
ime
(Avg
.)
Wai
tT
ime
(Ski
.D
ev.)
0:22
0:07
0:19
0:21
0:28
0:17
0:34
0:17
0:12
0:11
0:19
0:12
0:30
0:10
0:32
0:17
0:11
0:06
0:22
0:11
0:30
0:18
0:26
0:15
0:48
0:17
Vis
itD
urat
ion
(Avg
.)
Vis
itD
urat
ion
(Std
.D
ev.)
0:13
0:15
0:31
0:23
1:00
0:14
0:49
0:16
1:20
0:13
0:53
0:24
0:51
0:21
Oth
erS
tati
stic
s
Ave
rage
#C
lini
cian
spe
rV
isit
22
22
Ave
rage
#E
ncou
nter
spe
rV
isit
12
22
10E
481

CC
CT
EA
M6
TIM
EL
INE
DU
RA
TIO
NS
UM
MA
RY
ST
AT
IS
TiC
Table
6.6
IA
MPa
tIen
tsI
New
Paf
ient
sR
etur
nPa
tient
sC
ateg
ory
Avr
ag*
St. D
ev%
of
PtI
ent*
Aera
StD
ofP
ati
ents
Av*ra
9L
St
Dev
j%
of1a
Iief
ltaT
imeli
ne:
Ch
eck
hi
V0:0
11
00
%0
:01
10
0%
0:0
11
00
%W
ait
tor
Vit
als
NV
0:1
40:1
410
0%0:1
40:1
4100%
0:1
40:1
41
00
%V
itals
V0:
04I
0:0
5100%
0:0
40:0
51
00
%0:0
40:0
5100%
Wait
forE
ncounte
rl
NV
0:1
20:1
31
00
%0
:11
0:1
01
00
%0:1
20:1
5100%
Encounte
r1
V0:1
60:1
51
00
%0:1
90:1
61
00
%0
:12
0:1
5100%
Wait
for
En
co
un
ter
2N
V0:0
60:0
755%
0:0
30:0
315%
0:0
90:1
13
9%
Encounte
r2
V0:1
20
:11
55%
0:1
40
:11
15%
0:1
00:1
139%
Wait
for
En
co
un
ter
3N
V0:0
90:1
01
1%
0:1
10:1
07%
0:0
80
:09
4%
Encounte
r3
V0
:07
0:0
21
1%
0:0
70
:01
7%
0:0
70:0
34%
Wait
for_
En
co
un
ter
4N
V
Encounte
r4
V
Check
Out
V0
:05
0:0
91
00
%0:0
50:0
9100%
0:0
50:0
9100%
Avera
ge
Tota
lV
isit
Tim
e*
1:0
31
:23
0:5
7
Valu
eA
dded
me*
0:2
60
:21
0:3
2
Non-V
alu
eA
dded
Tim
e*
0:3
71:0
20:2
5
:;::::
::::::
::*
Av
era
ge
Tota
lT
ime,
Valu
eA
dded
Tim
eand
Non-V
alu
eA
dded
Tim
eare
the
su
mof
each
events
tim
em
ult
ipli
ed
by
the
%o
fpati
ents
that
ex
peri
en
ced
that
ev
en
t.
-G
Msets
goal
for
valu
eadded
%at
60%
.
So
urc
e:
Pati
ent
Tim
eli
ne
Data
Coll
ecti
on
3/29
-4/9
/99
wit
hS
chedule
Data
Sam
ple
Siz
e=
110
Pat
Ien
ts10
E48
1

90 80 70 60Cl
) a)5°
40
E I—30 0
Dr.
V.
Bak
erD
r.R
eyno
lds
Physi
cian
Fici
ure
6.7
Sou
rce:
AI
Pat
ients
Val
ue-A
dded
vs.
Non
-Val
ue-A
dded
Tim
eof
Pat
ient
Vis
it
add
edV
alue
-add
ed
20 10
Dr.
Bow
enD
r.Jo
hnst
on
IOE
481

Val
ue-A
dded
vs.
Non
-Val
ue-A
dded
Per
centa
ge
ofP
atie
nt
Vis
it
100% 90%
80%
70%
,60
%
Ezn
o/‘Jv/o
0 40% 30%
20%
10%
0N
on-v
alue
adde
dFJ
Val
ue-a
dded
t0/
V/0
Dr.
V.
Bak
erF
igur
e6.
7bP
hysi
cian
Dr.
Rey
nold
s
‘J)N
ote:
Ben
chm
ark
for
Val
ue-A
dded
=60
%..
Sou
rce:
All
Pat
ient
s
Dr.
Bow
enD
r.Jo
hnst
on

‘J] Lfl
nC
CC
TE
AM
6
SE
SS
ION
DU
RA
TIO
NSU
MM
AR
Y
Tab
le6.
8
C)
TU
ESD
AY
IS
ched
uled
Dur
atio
n4:
00
Act
ual
Dur
atio
n3:
39
WE
DN
ESD
AY
Sch
edul
edD
urat
ion
4:00
4:00
4:00
Act
ual
Dur
atio
n2:
504:
375:
04
TH
UR
SDA
Y
Sch
edul
edD
urat
ion
Act
ual
Dur
atio
n
FRID
AY
Sch
edul
edD
urat
ion
4:00
4:00
4:00
4:00
Act
ual
Dur
atio
n2:
262:
523:
544:
55
-T
imes
are
list
edin
Hou
rs:M
inut
es
Sou
rce:
Pat
ient
Tim
elin
eD
ata
Col
lect
ion
3/29
-4/9
/99
with
Sch
edul
eD
ata
Sam
ple
Siz
e=
110
Pat
ient
s
Sch
edul
edD
uati
on4:
304:
30
Act
ual
Dur
atio
n3:
544:
04
10E
481

CC
CT
EA
M6
FIR
ST
PAT
IEN
TSU
MM
AR
Y
Tab
le6.
9
.V
V>
.:.
..
...
...
..
Dr
VB
aker
Dr
Bow
enD
rJo
hnst
onD
rR
eyno
lds
CV
V
3115
/9943’f
3/3
OI99.
3131
/99
i4/
2/99
4/6
/99
3/31
/99
4/71
9931
12/9
9I
3/26
199
412/
99P
NMf
PM
PM
AM
App
oint
men
tTim
e8:
45/
9:1
51
3:4
5A
12:5
08:
5012
:50
9:00
2:20/
12:5
08:
40/
7:40//
1:0
09
:00
1:1
59:
302:
00
Che
ckIn
Tim
e8:
26/
8:15
12:3
2/
12:5
68:
4412
:40
9:24
1:57/
12:4
78:
38/
7:3
5//
12:3
48:
301:
159:
101:
41
Vit
als
me
8:36/
8:18
12:5
2/
1:10
8:49
12:4
69:
272:
00/
12:5
08:
42/
7:3
9//
12:4
68:
381:
189:
121:
41
Tim
ein
toE
xam
Roo
m8:
40/
8:22
12:5
6/
1:11
8:53
12:5
09:
322:
04/
12:5
48:
44/
7:42//
12:5
08:
421:
229:
131:
52
Tim
eof
1st
enco
unte
r8:
46/
8:22
n/a/
1:11
9:14
1:05
9:35
2:10/
12:5
78:
46/
7:4
5//
12:5
09:
051:
409:
301:
52
-T
imes
are
liste
din
Hou
rs:M
inut
es
Sou
rce:
Pat
ient
Tim
elin
eD
ata
Col
lect
ion
3/29
4/9/
99w
ithS
ched
ule
Dat
aS
ampl
eS
ize
=16
Firs
tP
atie
nts
of11
0S
ampl
eP
atie
nts
10E
481

APPENDIX A
GANTT CHART

Janu
ah,
1999
M1
TW
TF
.
11
&I.
.4.
.51
7
1112
..
13
.14
15P
roje
ctIn
trod
ucti
on,
20h
18:
....i:
..
..
..
.:....
20H.
2122
Coo
rd
Q&
A
Tou
r,4h
25,
2627
f28
29Fl
owA
naly
sis
Pro
ject
,20
h
,P
ropo
sal
draf
ting,
1w
Coo
rdin
ator
,8h

Presen
tation
Febru
aj
1999
Rep
ort
Gu
id
elin
es
22.
231
•24
25
12€
Status
Report
D
Fin
aliz
eD
ata
She
et,
1w
MT
TF
lj
:21.
4!
5
Hos
pita
lT
our,
16h
Coo
rdin
ator
,12
hP
ropo
sal
Out
line
&G
annt
Sch
edul
e,1w
Lit
erat
ure
Sea
rch,
1w
L
810.
111
12
Obs
erva
tion
,1w
Coo
rdin
ator
,8h
:D
raft
form
s,1 w
1516
18;
19S
tatu
sR
epor
ts&
Sam
ple
Dat
a,1w
Coo
rdin
ator
,8h
Coo
rdin
ator
,8h

Mar
ci19
99M
TW
TF
12t
34
SP
RIN
GB
RE
AK
,1w
89
:1
lij
12
Dat
aC
olle
ctio
n&
Rep
ort
Dra
ft,
1wC
oord
inat
or,
8h,
Sam
ple
Dat
aC
olle
ctio
n,1w
1516
1718
19D
ata
Col
lect
ion
&S
tatu
sR
eport
s
Coo
rdin
ator
,8h
22,
2324
251
2eE
ndD
ata
Col
lect
ion
&R
epor
tD
raft
ing,
2w
29!
30j
31.
End
Dat
aC
olle
ctio
n&
Rep
ort
Dra
ftin
g,2w

Apri
199
9M
—T
[______
TF
1,2
End
Dat
aC
olle
ctio
n&
Report
Drafti
ng,
2w
SI6i
78
9F
inis
hR
epo
rtan
dP
olis
h
Pre
sen
tati
on
s
Pre
senta
tions
Fin
alR
eport
sdL
Cli
ent
Pre
sen
tat

20h
Mon
1/11
/99
Wed
1/13
/99
Pro
fess
orC
offe
y,P
ac
2T
our
4hFr
i1/
22/9
9Fr
i1/
22/9
91
Ely
Kuo
-Vas
her
3C
oord
inat
or2h
Fri
1/22
/99
Fri
1/22
/99
2M
ary
Duc
k
4Fl
owA
naly
sis
Pro
ject
20h
Mon
1/25
/99
Wed
1/27
/99
Pac
h
5Q
&A
with
Clie
nt2h
Fri
1/22
/99
Fril/
22/99r2
Ely
SP
ropo
sal
draf
ting
1wM
on1/
25/9
9Fr
i1/
29/9
95
Tea
m11
&T
eam
4
7C
oord
inat
or8h
Fri1
/29/
99Fr
i11
29/9
9M
ary
8H
ospi
tal
Tou
r16
hM
on2/
1/99
Tue
2/2/
99P
rofe
ssor
Cof
fey
9C
oord
inat
or12
hW
ed2/
3/99
Thu
2/4/
99M
ary
10P
ropo
sal
Out
line
&G
ani
1wM
on2/
1/99
Fri
2/5/
996
Tea
m11
&4
11L
iter
atur
eS
earc
h1w
Mon
2/1/
99Fr
i2/
5/99
Tea
m11
12D
raft
form
s1w
Mon
2/8/
99Fr
i2/
12/9
9T
eam
11&
4
13P
rese
ntat
ion
8hM
on2/
8/99
Mon
2/8/
99T
eam
11
14O
bser
vati
on1w
Mon
2/8/
99Fr
i2/
12/9
910
Tea
m11
&El
y
15C
oord
inat
or8h
Fri
2/12
/99
Fri
2/12
/99
Mar
y
16S
tatu
sR
epor
ts&
Sam
pl1w
Mon
2/15
/99
Fri
2/19
/99
14T
eam
11
17C
oord
inat
orBh
Fri
2/19
/99
Fri
2/19
/99
Mar
y
18R
epor
tG
uide
line
s1w
Mon
2/15
/99
Fr1
2/19
/99
14T
eam
11
19S
tatu
sR
epor
tD
ue8h
Mon
2/22
/99
Mon
2/22
/99
Pro
fess
orC
offe
y
20Fi
naliz
eD
ata
She
et1w
Mon
2)22
/99
Fri
2/26
/99
18T
eam
11
21C
oord
inat
or8h
Fri
2/26
/99
Fri
2/26
/99
Mar
y
22SP
RIN
GB
RE
AK
1wM
on3/
1/99
Fri
3/5/
99T
eam
11
Inte
rim
Rep
ort
Pre
senta
8hM
on3/
8/99
Mon
3/8/
9920
Tea
m11
Tas
k—
Sum
mar
yR
olle
dU
pP
rogr
ess
Pro
ject
:P
roje
cti
.MPP
Dat
e:S
un4/
25/9
9P
rogr
ess
Rol
led
Up
Tas
k
Mil
esto
neR
olle
dU
pM
iles
tone
ID
n__
Task
Nam
e
Pro
ject
intr
oduc
tion
1D
urat
ion
Sta
rtP
redec
esso
rsF
inis
hJa
n10
.‘9
9Ja
nl7
,’9
9Ja
Res
ou
rce
Nam
esM
IT
WI
TF
IS[s
jM
JTW
T[jS
SIM
T
23
Pag
e1

Clie
ntP
rese
ntat
ion
Tas
k-
Sum
mar
yR
olle
dU
pP
rogr
ess
Pro
ject:
Pro
ect1
.M
PP
__
__
__
__
__
__
__
__
__
__
__
__
__
__
Dat
e:S
un4/
25/9
9P
rogr
ess
Rol
led
Up
Tas
k—
Mil
esto
neR
olle
dU
pM
iles
tone
ID
flT
ask
Nam
e
n24
Sam
ple
Dat
aC
olle
ctio
n1w
Mon
3/8/
99Fr
i3/
12/9
9T
eam
11
Dur
atio
nS
tart
Fin
ish
Pre
dec
esso
rsR
eso
urc
eN
ames
MjT
WIT
_IFj_
jS
MT
j WT
JF
SS
M1T
_____fl
__
Jan
lO,’
99
IJa
nl7
,’9
9Ja
25D
ata
Col
lect
ion
&R
epor
1wM
on3/
8/99
Fri
3/12
/99
22T
eam
11
26C
oord
inat
or8h
Fri
3/12
/99
Fri
3/12
/99
Mar
y
27D
ata
Col
lect
ion
&S
tatu
e1w
Mon
3/15
/99
Fri
3/19
/99
25T
eam
11
28C
oord
inat
or8h
Fri
3/19
/99
Fri
3/19
/99
Mar
y
29E
ndD
ata
Col
lect
ion
&R
2wM
on3/
22/9
9Fr
i4/
2199
27T
eam
11
30Fi
nish
Rep
ort
and
Pol
is[
1wM
oq4/
5/99
Fri
4/9/
9929
Tea
m11
&M
ary
131
Pre
sent
atio
ns8h
Mon
4/12
/99
Mon
4/12
/99
Cla
ss
32P
rese
ntat
ions
8[
Mon
4/19
/99
Mon
4/19
/99
Cla
ss
33Fi
nal
Rep
orts
due
8hM
on4/
19/9
9M
on4/
19/9
9T
eam
11
348h
Thu
4/22
199
Thu
4/22
/99
Tea
m11
&El
y
Pag
e2

__
____________n___________
n__
24
,’9
9Ja
n31,9
9F
eb7,’
99
Feb
14
,4
[F
eb2l,
’99
Feb
28’9
9—
Mar
7,’
99
WIT
IF
ISIS
IMIT
[WJT
IFIS
SIM
ITIW
ITI
FIS
SIM
ITIW
ITIF
ISIS
IMIT
IWIT
IFIS
SIM
ITIW
ITIF
ISS
IMIT
IWIT
IPac
hI
________
iim
—&
Tea
m4
—M
ary
—P
rofe
ssor
Cof
fey
—M
ary
Ttc
jm-
1&
4
Team
i
_____________
Team
ll&
4
42I8
Teafr
1&
EIy
Mar
y
—T
eam
11
—M
ary tem
11 Mar
y
Teanjf
____________________________________________________
3I8
Tas
kS
umm
ary
Rol
led
Up
Pro
gre
ssPr
ojec
t:P
roje
cti
MPP
_________________
_________________
Dat
e:S
un4/
25/9
9P
rogr
ess
Rol
led
Up
Tas
k
Mil
esto
neR
olle
dU
pM
iles
tone
Pag
e3
24,
‘99
Jan
31,
‘99
Feb
7,‘9
9I
Feb
14,‘9
..
fF
eb21
,‘9
9I
Feb
28,
‘99
IM
ar7,
‘99
WIT
IFIS
ISjM
ITIW
jTIF
jSIS
IMIT
IWIT
IFIS
ISIM
ITIW
ITIF
SS
IMIT
IWIT
jFIS
ISlM
ITIW
ITlF
ISIS
IM1T
)W1T
.
I
Tas
k—
Sum
mar
yR
olle
dU
pP
rogr
ess
—-‘
Pro
ject
:P
roje
ctl.
MP
P
__
__
__
__
__
__
__
__
__
__
__
__
__
__
Dat
e:S
un4/
25/9
9P
rogr
ess
Rol
led
Up
Tas
k
Mil
esto
neR
olle
dU
pM
iles
tone
Pag
e4

> . -
D D
0 0
ILw 0
0
tLr)
•3 .
cI)
0
C
Co
LL
I—
I—
C’,
C’)
LL
I—
I—
U)
0)
C
Co
U
I
I—
Co
Cl)
U
.
0)cg
F
Cl)
U,00)
0
0)0)
0
Co
U
I—
I—
a,
U)
U
I.
I-
Cl)
Cl)
U-

nn
__n
Mar
14.
‘99
Mar
21,
‘99
Mar
28
!19
Afl
r4
.19
Apri
l,‘9
9A
pr18’9
9
Tas
k—
Sum
mar
yR
olle
dU
pP
rogr
ess
Pro
ject
:P
roje
ctl.
MP
P
_______________
Dat
e:S
un4)
25/9
9P
rogr
ess
Rol
led
Up
Tas
k—
.
Mil
esto
neR
olle
dU
pM
iles
tone
FIS
ISIM
ITIW
ITI
FIS
jSlM
ITIW
lTIF
fSS
IMIT
IWjT
IF
ISL
SIM
ITIW
ITIF
ISS
IMIT
IWjT
FJS
ISIM
ftJW
1fJ
FIs
•T
eam
11
•Tcan9
11
•MarY
j •3115
Mar
Tean1
:+
41
12
•4/
19
4/19
.
I•4
12
2
Pag
e6

APPENDIX B
DATA COLLECTION SHEET
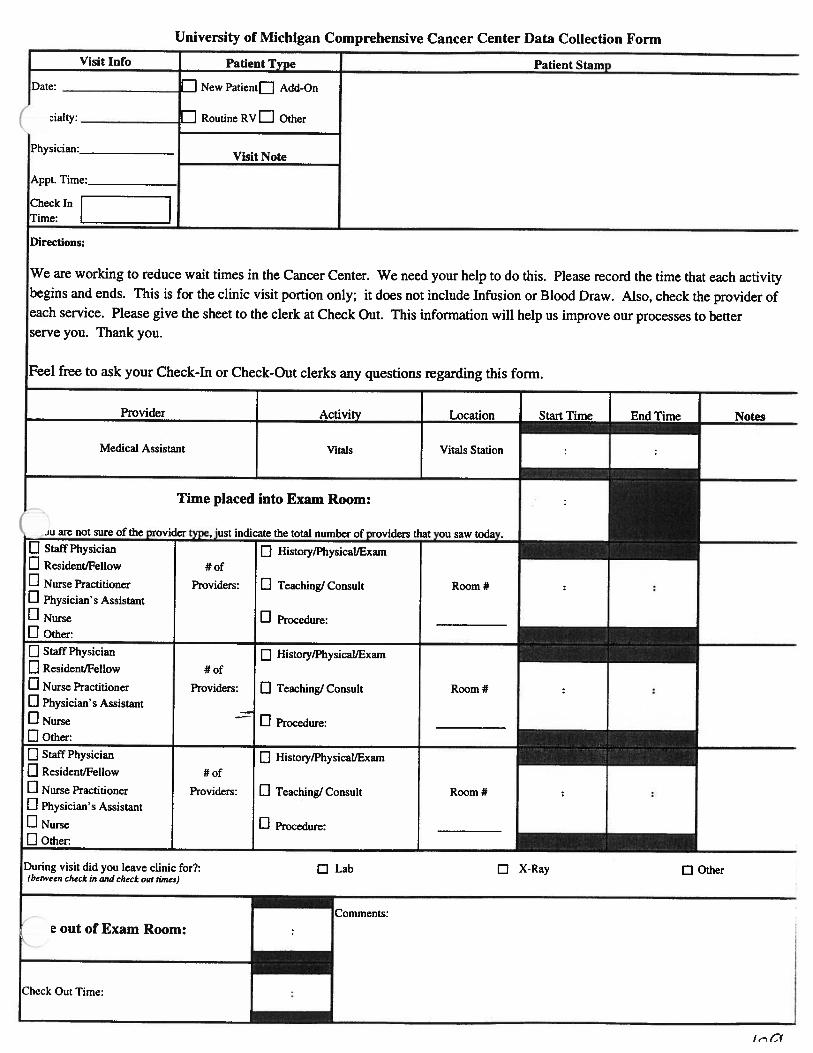
University of Michigan Comprehensive Cancer Center Data Collection Form
Visit Info Patient Type Patient Stamp
Date: ID New Patient ID Add-On
Dialty: IEJ Routine RVI:J Other
Physician:Visit Note
Appt. Time:______________
Check InTime:
Directions:
We are working to reduce wait times in the Cancer Center. We need your help to do this. Please record the time that each activitybegins and ends. This is for the clinic visit portion only; it does not include Infusion or Blood Draw. Also, check the provider ofeach service. Please give the sheet to the clerk at Check Out. This information will help us improve our processes to betterserve you. Thank you.
Feel free to ask your Check-In or Check-Out clerks any questions regarding this form.
During visit did you leave clinic for?:(between check in and check Out times)
Check Out Time:
Medical Assistant
Provider Activity Location Start Time End Time
Vitals Vitals Station
Notes
Time placed into Exam Room:
iu aie not sure of the provider type, just indicate the total number of providers that you saw today.El Staff Physician fl History/Physical/ExamEl ResidentlFelIow # ofEl Nurse Practitioner Providers: El Teaching! Consult Room #El Physician’s AssistantEl Nurse El Procedure:El Other:
El Staff Physician [] History/Physical/ExamEl Resident/Fellow # of
El Nurse Practitioner Providers: El Teaching! Consult Room #El Physician’s Assistant
El Nurse —- El Procedure:El Other:
El Staff Physician El History/Physical/ExamEl Resident/Fellow # of
El Nurse Practitioner Providers: El Teaching! Consult Room #El Physician’s Assistant
El Nurse El Procedure:El Other:
e out of Exam Room:
Q Lab Q X-Ray
Comments:
Q Other

BIBLIOGRAPHY

Bibliography
Bermudez, Cristina; Horvath, Katherine. Pinsky, Julie; & Roseinan, Seth; “PediatricHematology/Oncology Clinic”, TOE 481 Project, April 13, 1995.
Garrett, W. Patrick; Jones, Robert; & Rudin, Christopher; “Hematology/Oncology,Clinic Patient FlowAnalysis”, TOE 481 Project, Jan. 17, 1995.
Gory!, Susan; & Somershoe, Lauren; “Northville Health Center, Clinic Operations Analysis”, IOE 481Project, Dec. 9, 1996.
Israel, Taryn; Ross, Dawn; & Tawil, Andrea; “University Of Michigan Medical Center Pediatric PrimaryCare Clinic, Study of Patient Service and Wait Times”, TOE 481 Project, April 1996.
Lee, Bernard; Lum, Andrew; & Ng Lyman; “Check-In Analysis, Northville Health Center, University OfMichigan Health System”, JOE 481 Project, Dec. 5, 1997.