final report for the 2014 2015 outbreak of highly ... · final report for the 2014–2015 outbreak...
TRANSCRIPT

Final Report for the 2014–2015 Outbreakof Highly Pathogenic Avian Influenza (HPAI)
in the United States
1
USDA Animal and Plant Health Inspection Service Veterinary Services
National Preparedness and Incident Coordination
Revised August 11, 2016

Nature of Disease
• Avian influenza (AI) is a viral respiratory disease that
infects all avian species. – AI is a common disease, but it frequently changes.
• Based on the severity of illness, the disease is
classified as either HPAI or low pathogenicity avian
influenza (LPAI).
• AI viruses are named by two groups of proteins:– hemagglutinin ([HA] ranging from H1–H17), and
– neuraminidase (ranging from N1–N9), e.g., H5N2 or H5N8.
2

Incident Overview
• December 11, 2014–January 16, 2015: USDA received a total of 7 reports of HPAI H5N2 or H5N8 in captive wild birds and backyard flocks from the northwestern United States.– First HPAI detection in 10 years.
– Additional detections occurred in wild birds.
• January 23, 2015: 1st infected commercial flock identified in CA.• January–March 2015: HPAI spread slowly to multiple states.
– MN, MO, AR, and KS.
• April: Significant increase in HPAI H5N2 in turkey flocks occurred through early April in MN, followed by a rapid increase in IA in late April and May where large numbers of chicken layer flocks were affected.
• June 16, 2015: Last case of HPAI confirmed in the United States (commercial flock).
3

Numbers Overview• 211 detections on commercial operations and 21 detections on backyard
premises
– Includes premises designated as a Dangerous Contact (DC) Premises.
• Approximately 7.4 million turkeys and 43 million egg-layers and pullet chickens were affected by HPAI and died from the disease or were depopulated.
• This outbreak was the largest HPAI outbreak ever recorded in the United States and arguably the most significant animal health event in U.S. history.
• HPAI was detected in 21 States (includes all HPAI detections in any bird type, including wild birds).
4

Summary of H5 Positive Detections by State
5
State
Total
Commercial
H5 Positive
HPAI
Premises
Species Total
Backyard H5
Positive
HPAI
Premises
Total by StateTurkey
Chicken-
LayerOther
Minnesota 109 104 5 0 1 110
Iowa 71 35 36 0 6 77
South Dakota 10 9 1 0 0 10
Wisconsin 9 6 3 0 1 10
Nebraska 5 0 5 0 1 6
California 2 1 0 1 0 2
Missouri 2 2 0 0 1 3
North Dakota 2 2 0 0 0 2
Arkansas 1 1 0 0 0 1
Kansas 0 0 0 0 1 1
Washington 0 0 0 0 5 5
Oregon 0 0 0 0 2 2
Montana 0 0 0 0 1 1
Idaho 0 0 0 0 1 1
Indiana 0 0 0 0 1 1
Total 211 160 50 1 21 232

Total Incidence of HPAI in the United States by Week
6

HPAI Detections in the United States
7

First Detection by Flock Type in each State by National Veterinary Services Laboratories Confirmation Date
8

Approximate Percentage of U.S. Poultry Affected
The losses in commercial inventories for layer chickens, pullets, and
turkeys were substantial. This was the most significant HPAI outbreak
in U.S. history.
9
Flock Typea Percent Losses
Layer Chickensb 10.01% avg. U.S. inventory
Pullet Chickens 6.33% avg. U.S. inventory
Broiler Chickens <0.01% avg. U.S. inventory
Turkeys 3.16% annual production; 7.46% avg. U.S. inventory
a “ x ” .b “ ” “ .”

Transmission• Sharing equipment between farms, entry of wild birds into
barns, and farm workers/visitors all likely contributed to virus spread. – Other possible pathways included short-distance aerosol
spread, carcass disposal techniques, and other biosecurity breaches.
• Results indicated that HPAI can be aerosolized from infected flocks.– While possible that aerosol transmission was responsible for
disease spread, the USDA APHIS Epidemiological Analysis was “not able to determine with certainty whether aerosol transmission was responsible for a farm becoming infected.”
USDA APHIS CEAH. (2015). Epidemiologic and Other Analyses of HPAI-Affected Poultry Flocks: September 9, 2015 available at https://www.aphis.usda.gov/animal_health/animal_dis_spec/poultry/downloads/Epidemiologic-Analysis-Sept-2015.pdf.
10

Organizational Response• December 2014: APHIS National Incident Coordination Group (ICG)
was established and VS personnel deployed to the first HPAI case.• December 2014 to August 2015: VS National Incident Management
Teams (NIMTs) deployed. – Outbreak resulted in a new VS NIMT—Indigo.
• April 2015: The ICG was scaled up significantly to reflect the increasing number of detections and broadening response requirements.
• June 2015: An APHIS HPAI Multiagency Coordination (MAC) Group was formally established to coordinate resources across the agency.
• Over the course of the outbreak, there were over 1,200 deployments by APHIS personnel. – APHIS was on Mobility Level 2; VS initiated mandatory deployments. – The number of APHIS responders and contractors continued to
increase as the outbreak grew.– There were deployments from all APHIS programs.
11

12
Incident Management Structures and Key Events during the 2014–2015 Outbreak
December 2014
January 2015
February 2015
March 2015
April 2015
May 2015
June 2015
Dec 14 HPAI first detected in the United States
Dec 19 - First backyard flock
tests positive for HPAI - National ICG
established
Dec 24 First personnel deployed to the field
APHIS Leadership engaged for resource coordination
Jan 23 HPAI confirmed in a commercial flock in California
March 5 First detection in Minnesota
Apr 13 First detection in Iowa
Apr 22–28 Week with the most new cases (38)
Green IMT split into 2 teams
Blue IMT split into 2 teams
Jun 17 Last HPAI-confirmed premises
Jun 23 APHIS MAC Group formally established

Personnel
• At the height of response operations in June 2015, more than 3,400 personnel were deployed: – About 250 APHIS personnel, 180 State responders, and
over 3,000 support contractors.
• Over the course of the entire outbreak, there were 1,220 deployments by APHIS personnel, with 773 total individuals deployed. – After training, 69 National Animal Health Response Corps
(NAHERC) members deployed during the outbreak.
• Many APHIS personnel deployed twice, and some deployed 3–4 times.
• ~300 additional employees worked virtually or at an APHIS headquarters location as part of the ICG.
13

14
Total Number of APHIS Personnel Deployed by State of Incident
541
456
8451 31 29 13 10 5
0
100
200
300
400
500
600
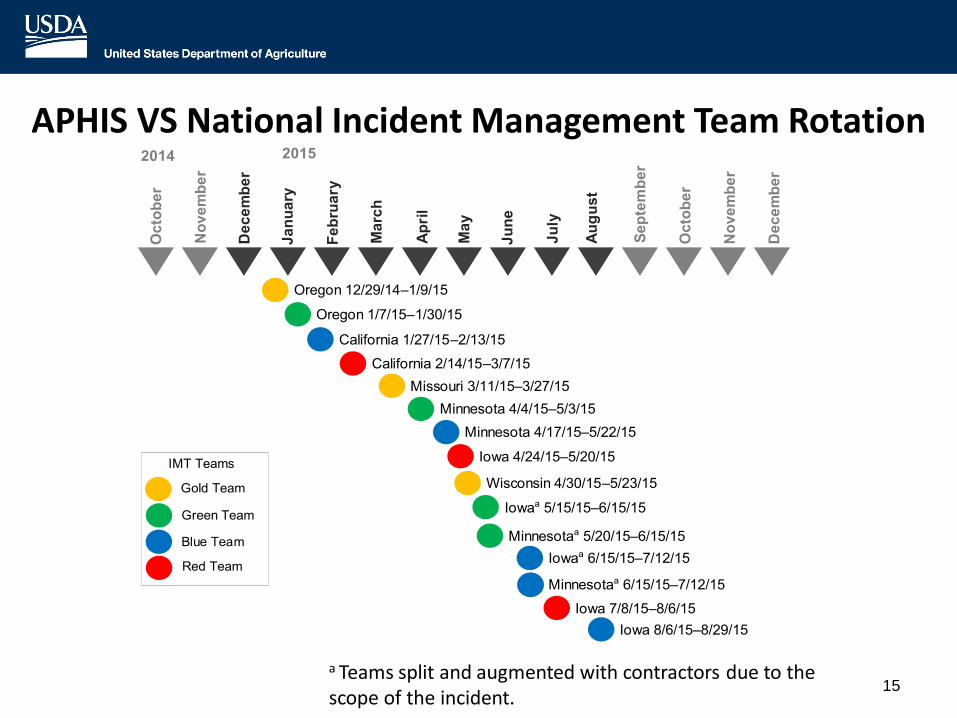
APHIS VS National Incident Management Team Rotation
15
–
–
–
–
–
–
–
–
–
–
–
–
–
–
–
a Teams split and augmented with contractors due to the scope of the incident.

Contractors
• The response to the outbreak quickly outpaced available resources once the outbreak accelerated in the Midwest, both at the ICG and NIMT levels.
• Contractors augmented both ICG and field responses.
– USDA APHIS contracted with a number of companies, large and small, to effectively execute response operations.
– Contractors worked in the field not only to provide services and materials related to depopulation, disposal, and disinfection, but to provide premises physical security services, credentialing assistance, and equipment rentals.
– More than 90 companies, individuals, and organizations were contracted to complete response operations successfully.
16

Number of Contractors Deployed during Outbreak
17
592
1,705
2,1972,432
2,7552,923
2,740
3,009
2,482
2,1822,185
1,9051,718
1,276
809
488
139 81 42110
0
500
1,000
1,500
2,000
2,500
3,000
3,500
5/13/2015 6/13/2015 7/13/2015 8/13/2015 9/13/2015
Total Number of Contractors (Field & ICG)

Logistics Overview
• The SPRS Logistics Center and the NVS led logistics for the 2014–2015 HPAI outbreak at the ICG-level, and also deployed personnel to support the APHIS VS NIMTs as required by the incident.
• The SPRS Logistics Center and NVS were responsible for contracting support for response activities.– Contractor support peaked in June, when over 3,000 personnel
in the field were responding to the incident.
• First activated on December 19, 2014, the NVS had over 2,700 requests for supplies through June 2015.– At a cost of over $2.9 million.
– Transportation costs, including for extraordinary rapid transit of diagnostic samples, totaled approximately $350,000.
18

Overview of Response Activities
• Depopulation, disposal, and virus elimination activities all posed significant challenges due to the number of affected premises and birds.– Foaming was the most common method of depopulation for
turkeys; CO2 in chicken layers.– Composting was the most common method of disposal. – Wet disinfectant was the most common mode of virus
elimination. • On average, it took commercial
premises about 111 days from NVSL disease confirmation to get restock approval. – Average of 104 days from
completion of depopulation to restock approval.
19

Surveillance and Diagnostics Summary
• In total, 16 National Animal Health Laboratory Network (NAHLN) laboratories, in addition to NVSL, were involved in testing to support HPAI response for either commercial, backyard, or wild bird surveillance.
20Table courtesy of VS NAHLN Coordinator

Appraisal and Compensation Summary
• In total, 232 appraisals and 44 trace outs were completed, with approximately $200 million paid for indemnity.
• Indemnity processes were cumbersome and led to delays.– New indemnity processes have been streamlined and
simplified.• Cooperative Compliance Agreements were used as the
mechanism to compensate producers for work they performed on their premises—such as disposal and virus elimination procedures. – Lessons learned from this experience resulted in new
appraisal and compensation processes, that eliminated the use of these agreements.
21

Permit and Movement Summary
• Permits issued for movements into, within, and out of regulatory
Control Areas for many different items (e.g., eggs, feed,
carcasses, etc.).
• Over 7,500 permits were issued (not including any revoked
permits).
– Most from Minnesota (36%) and Iowa (52%).
• Over 20,000 movements occurred.
– Many were for continuity of business movements, based on
the Secure Food Supply Plans.
• Required rapid permitting and data entry; National Permitting
Unit was established to support permitting processes.
• EMRS was successfully used to issue and record these permits.
22

End of Outbreak and Cost
• Although the outbreak ended in mid-June 2015, many response operations (e.g., cleaning and disinfection, environmental sampling, and restocking) continued throughout the fall.
• As of November 18, 2015, the United States sent a final report to the World Organization for Animal Health (the OIE).– At that time, the 2014–2015 outbreak in the United States was
considered closed. • Extensive planning and preparation efforts continued for the
possible reemergence of HPAI in the fall of 2015 and spring of 2016. • APHIS obligated nearly $850 million to respond to the 2014–2015
HPAI outbreak.• Further funds were spent on preparedness activities.• It was the most expensive animal health incident recorded in U.S.
history.
23

Summary of Key Events during the 2014–2015 HPAI Outbreak
24

Economic and Trade Impact
• Estimates suggest the 2014–2015 HPAI incident resulted in approximately $1.6 billion in direct losses from turkeys and egg-laying hens that had to be euthanized.
• When accounting for factors like restocking and lost future production, the impact to the U.S. economy is thought to be closer to $3.3 billion.
• As a result, consumers experienced wholesale egg prices reaching nearly $2.80 per dozen, more than doubling the previous 3-year average cost of large eggs. – Prices continually decreased throughout the remainder of 2015,
but costs sustained above the 3-year average.
25

Key Lessons Learned
• Depopulation needed to occur more rapidly to stop the amplification of virus and ongoing HPAI transmission.
• Financial processes were cumbersome and time consuming.
• Biosecurity measures must be improved on premises to not only stop HPAI transmission during an outbreak, but prevent HPAI introductions into commercial poultry flocks.
26

Policy Updates
• Policy guidance documents on issues like ventilation shutdown, heat treatment for virus elimination, and financial processes were developed and released to address the issues that occurred during the response to the incident.
• New biosecurity guidance was developed collaboratively by the industry, State, and Federal officials for implementation by producers.
• These documents are available at www.aphis.usda.gov/fadprep.
27

List of Policies & GuidanceFor example, the following policies and guidance were provided during the 2014–2015 HPAI outbreak (in alphabetical order):• Control Area Release• Financing the Response: State/Tribal
Information• General Resources and Information• H5/H7 Avian Influenza Case Definition• HPAI in the Live Bird Marketing System• HPAI Response Goals• HPAI Zones and Premises• Indemnity Procedures• Landfill Disposal Guidance—
Recommended Waste Acceptance Practices for Landfills
• Mortality Composting Protocol for AI Infected Flocks
• New State Checklist
28
• Post C&D Environmental Sampling Guide• PPE Recommendations for HPAI
Responders• Processing Indemnity Payments • Restocking Criteria for Previously Infected
Premises• Stamping Out and Depopulation Policy• Surveillance Activities around HPAI
Infected Backyard Flocks• Surveillance Sampling for Commercial
Premises in Control Area• Testing Requirements for Movement from
the Control Area• Timeline to Restocking and Environmental
Sampling Procedures • Use of the Antigen Capture Immunoassay• Using Heat Treatment for Virus
Elimination• Ventilation Shutdown Evidence and Policy.