final report nearshore eelgrass inventory - islands trust fund · final report nearshore eelgrass...
TRANSCRIPT
0
2012 - 2013
Final Report
Nearshore Eelgrass Inventory
Prepared for the Islands Trust and Islands Trust Fund by:
Nikki Wright, BA Executive Director SeaChange Marine Conservation Society
Leanna Boyer, BSc. MA Mayne Island Conservancy Society
Keith Erickson, R.P. Bio. Conservation Coordinator Galiano Conservancy Association
1
Table of Contents
1.0 Introduction 3 2.0 Importance of Eelgrass 4
2.1 Biodiversity 4 2.2 Blue Carbon 4 2.3 Ecosystem Services 5
3.0 Eelgrass Habitat Characteristics 5 3.1 Wildlife Corridors 6
4.0 Impacts from Human Activities 6 4.1 Removal and Burial 7 4.2 Pollution and Changes to Freshwater Input 7 4.3 Forestry Practices 8 4.4 Oil Spills 8 4.5 Shading by Overwater Structures 8
4.6 Effects of Boating 8 5.0 Eelgrass and Rising Sea Levels 9 6.0 Mapping Methodology 9
6.1 Distribution 10 6.2 Form 10 6.3 Sediment Types 10 6.4 Percent of Cover 11 6.5 Tidal Fluctuations 11 6.6 Presence of Other Vegetation 11 6.7 Visibility 11
7.0 Survey Limitations 12 8.0 2012 Inventory Findings 12
8.1 Gambier Island Local Trust Area 12 8.2 Lasqueti Island 15 8.3 North Pender Island 15 8.4 South Pender Island 16 8.5 Mayne Island 16 8.6 Thetis Island Local Trust Area 16
9.0 2013 Inventory Findings 19 9.1 Galiano Island Local Trust Area 20 9.2 Gabriola Island Local Trust Area 21 9.3 Denman Island Local Trust Area 23
9.4 Hornby Island Local Trust Area 23 9.5 Ballenas – Winchelsea (Executive Islands)
Local Trust Area 23 9.6 Bowen Island Municipality 24
10.0 Threats to Eelgrass Habitats 26 11.0 Opportunities for Eelgrass Restoration 26
11.1 History of Eelgrass Restoration 27
2
11.2 Criteria for Successful Restoration 27 12.0 Recommendations 27
12.1 Education 28 12.2 Regulatory and Enforcement 28 12.3 Opportunities to collaborate with other agencies 29
13.0 Conclusion 29 References 30
Eelgrass Maps
Map 1. Eelgrass Presence North Pender Island Map 2. Eelgrass Presence South Pender Island Map 3a. Eelgrass Presence Gambier Island Local Trust Area
Map 3b. Eelgrass Presence Gambier Local Trust Area Associated Islands Map 4a. Eelgrass Presence Thetis Island Local Trust Area Excluding Valdes Map 4b. Eelgrass Presence Valdes Island Map 5a. Eelgrass Presence Lasqueti Island – East Map 5b. Eelgrass Presence Lasqueti Island – West
Map 6. Eelgrass Presence Hornby Island Local Trust Area Map 7. Eelgrass Presence Mayne Island Map 8. Eelgrass Presence Ballenas – Winchelsea (Executive Islands) Local Trust Area Map 9a. Eelgrass Presence Bowen Island North and Bowyer Island Map 9b. Eelgrass Presence Bowen Island South and Passage Island Map 10. Eelgrass Presence Denman Island Local Trust Area Map 11a. Eelgrass Presence Gabriola Island Local Trust Area – Southeast Map 11b. Eelgrass Presence Gabriola Island Local Trust Area – Northwest
Map 12a. Eelgrass Presence Galiano Island Local Trust Area – South Map 12b. Eelgrass Presence Galiano Island Local Trust Area – North
Appendix A Mapping Methodology Appendix B Maps of Shoreline Units Appendix C Summary of Overwater Structures
SeaChange Marine Conservation Society acknowledges the Mayne Island Conservancy Society for the use of its software and computer for data management. Seachange would also like to acknowledge funding from the following sources, which has made this project possible: Islands Trust, Islands Trust Fund, the Capital Regional District, the Comox Valley Regional District, Metro Vancouver, the Greater Victoria Savings and Credit Union Legacy Foundation, Vancouver City Savings (Vancity), the Public Conservation Assistance Fund, Moonstone Enterprise, the Pacific Salmon Foundation and the Victoria Foundation.
Thank you.
3
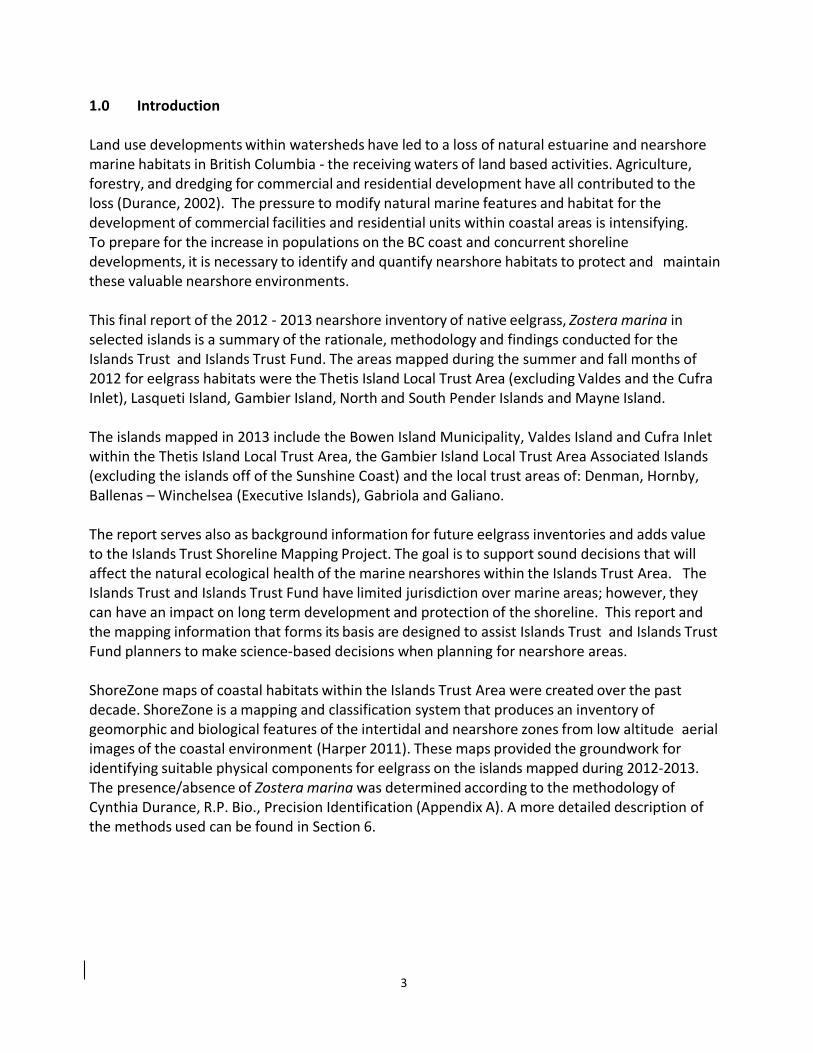
1.0 Introduction Land use developments within watersheds have led to a loss of natural estuarine and nearshore marine habitats in British Columbia - the receiving waters of land based activities. Agriculture, forestry, and dredging for commercial and residential development have all contributed to the loss (Durance, 2002). The pressure to modify natural marine features and habitat for the development of commercial facilities and residential units within coastal areas is intensifying. To prepare for the increase in populations on the BC coast and concurrent shoreline developments, it is necessary to identify and quantify nearshore habitats to protect and maintain these valuable nearshore environments. This final report of the 2012 - 2013 nearshore inventory of native eelgrass, Zostera marina in selected islands is a summary of the rationale, methodology and findings conducted for the Islands Trust and Islands Trust Fund. The areas mapped during the summer and fall months of 2012 for eelgrass habitats were the Thetis Island Local Trust Area (excluding Valdes and the Cufra Inlet), Lasqueti Island, Gambier Island, North and South Pender Islands and Mayne Island. The islands mapped in 2013 include the Bowen Island Municipality, Valdes Island and Cufra Inlet within the Thetis Island Local Trust Area, the Gambier Island Local Trust Area Associated Islands (excluding the islands off of the Sunshine Coast) and the local trust areas of: Denman, Hornby, Ballenas – Winchelsea (Executive Islands), Gabriola and Galiano. The report serves also as background information for future eelgrass inventories and adds value to the Islands Trust Shoreline Mapping Project. The goal is to support sound decisions that will affect the natural ecological health of the marine nearshores within the Islands Trust Area. The Islands Trust and Islands Trust Fund have limited jurisdiction over marine areas; however, they can have an impact on long term development and protection of the shoreline. This report and the mapping information that forms its basis are designed to assist Islands Trust and Islands Trust Fund planners to make science-based decisions when planning for nearshore areas. ShoreZone maps of coastal habitats within the Islands Trust Area were created over the past decade. ShoreZone is a mapping and classification system that produces an inventory of geomorphic and biological features of the intertidal and nearshore zones from low altitude aerial images of the coastal environment (Harper 2011). These maps provided the groundwork for identifying suitable physical components for eelgrass on the islands mapped during 2012-2013. The presence/absence of Zostera marina was determined according to the methodology of Cynthia Durance, R.P. Bio., Precision Identification (Appendix A). A more detailed description of the methods used can be found in Section 6.
4
2.0 Importance of Eelgrass Seagrasses are rooted aquatic plants that grow in estuaries and along low wave energy shorelines throughout the world. They have important influences on biogeochemical cycling, sediment stability, and food web support (McGlathery et al. 2007; Orth et al., 2006). Seagrasses can form extensive meadows supporting high biodiversity. The global species diversity of seagrasses is low (~60 species). Across the globe, however, seagrass meadows cover about 177,000 square kilometers of coastal waters – larger than the combined area of the Maritime Provinces (Short et al, 2007). British Columbia has about 400 km² of saltmarsh and eelgrass habitats (Campbell 2010).
2.1 Biodiversity
The complex and intricate food webs of an eelgrass (Zostera marina) meadow provide food and shelter for numerous fish and invertebrates. Meadows also serve as a nursery habitat and as a refuge from predation for juvenile fishes (Orth et al., 1984; Bostrom and Bonsdorff 2000; Duarte 2000).The productivity of native seagrasses rivals the world’s richest farmlands and tropical rainforests. From an unstructured muddy/sandy bottom grows a myriad pattern of leaves that supply nutrients to salmonids and other fish, shellfish, waterfowl and about 124 species of faunal invertebrates. The plants offer surface area for over 350 species of macroalgae and 91 species of epiphytic microalgae – the basis of the food web for juvenile salmon in marine waters (Phillips 1994). Often referred to as “salmon highways”, nearshore marine environments containing eelgrass beds (Zostera marina) are home to over 80% of commercially important fish and shellfish species, including all species of salmon, at some point in their life histories (Durance 2002). 2.2 Blue Carbon Like terrestrial forests, eelgrass habitats capture and store large amounts of carbon but at much more efficient rates - up to ninety times the uptake provided by equivalent areas of forest. This “Blue Carbon” is stored in sediments where it is stable for thousands of years. In B.C., roughly 400 km² of salt marsh and seagrass meadows sequester as much carbon as B.C.’s portion of the boreal forest, and the equivalent of the emissions of some 200,000 passenger cars (Campbell 2010). When eelgrass beds are restored, the rate of carbon sequestration appears to be rapid over the first few years and up to 40 years following restoration. The natural transport of eelgrass by currents and wave action to deeper waters in estuaries and the coastal ocean may further sequester more carbon (Thom 2011).
5
As ocean waters warm as a result of climate change (up to 5 C° during the spring), greater flowering as well as faster growth of eelgrass shoots has been observed. Both of these changes result in greater biomass. Like marshes, much of the eelgrass biomass is under the substrate, indicating that a warming environment may result in greater carbon accumulation rates (Thom 2011). 2.3 Ecosystem Services Ecosystem services are the benefits provided by the land, air, water and subsurface materials of the earth (Molnar et al 2012). Eelgrass habitats within the lower reaches of the Salish Sea provide carbon sequestration and storage, habitat refugia and nursery and nutrient cycling benefits to an approximated natural capital cost of $80,929 per hectare per year (Molnar et al., 2012). Within the Islands Trust Area, eelgrass habitats also provide revenue for commercial fisheries, recreational fishery, and revenue from tourism. Protecting and conserving, and in some instances restoring these critical habitats is a recommendation of the Islands Trust Fund’s Regional Conservation Plan. Mapping eelgrass is identified as a priority to meet the goal of conserving marine ecosystems and habitats. As well, accounting for these benefits in economic dollars and cents and factoring them into decision making policies would emphasize the economic, cultural and ecological values of nearshore habitats. 3.0 Eelgrass Habitat Characteristics Eelgrass meadows are found in most of the world’s coastal temperate regions except at extremely high latitudes. Physical and chemical factors affecting Zostera marina include temperature, light attenuation, elevation, substratum, wave action, salinity and pH. Worldwide, the plants survive under a wide range of water temperatures, from 0° to greater than 30°C. The optimum temperature for growth lies between 10° - 20° C in most areas (Phillips 1984). Eelgrass grows best within the Salish Sea in salinity ranges of 20 ppt - 32 ppt. Eelgrass can tolerate periods of freshwater inundation on a seasonal or daily basis (Durance 2002). Of all the above factors, light availability and elevation may be the most crucial. Light availability seems to be the primary factor limiting depth distribution, density, and productivity of eelgrass meadows within their salinity and temperature ranges. When the Coal Port was expanded in 1982-1983 in Roberts Bank, both species of eelgrass (Z. japonica and Z. marina) expanded. The construction of causeways across a broad intertidal zone directed the turbid Fraser River water offshore, improving the light regime and initiating higher productivity in the eelgrass beds (Harrison and Dunn 1999).
6
3.1 Wildlife Corridors Seagrasses are in decline throughout much of the world, with rates of loss accelerating from a median of 0.9% per year before 1940 to 7% per year since 1990 (Waycott et al., 2009). It has been estimated that 18% of coastal marine and nearshore wildlife habitat in the Salish Sea has been destroyed (British Columbia/Washington Marine Science Panel 1994). A large percentage of this decline is attributed to human impacts, including filling of shallow waters, dredging, and eutrophication (Short and Wyllie-Echeverria 1996). Often referred to as “salmon highways”, nearshore marine environments containing Z. marina beds are home to more than 80% of commercially important fish and shellfish species, including all species of salmon, at some point in their life histories (Durance 2002). Zostera marina beds are highways for Chinook, Coho, Pink, Chum, and Sockeye salmonid stocks (Thompson 1994). Great Blue Herons have been observed to feed in eelgrass beds within 3 km of their nesting colonies. Other important bird species using these habitats include Brant geese, Rhinoceros Auklets, cormorants and Western Grebes. E.O. Wilson proposed the importance of habitat corridors in the 1960s (MacArthur and Wilson 1967). Habitat reduction and fragmentation at a variety of spatial scales has been widely acknowledged as a primary cause of the decline of many species worldwide (Thompson 1994). Habitat fragmentation generally leads to smaller and more isolated animal populations. Smaller populations are more vulnerable to local extinction. To reduce the isolation of habitat fragments, many conservation biologists have recommended maintaining landscape "connectivity" - preserving habitat for movement of species between remaining fragments (BC/Washington Marine Science Panel 1994). Many nearshore environments on the islands inventoried in 2012 and 2013 indicated continuous fringing eelgrass beds. These beds are the connectivity for salmon and other marine wildlife for shelter, food and refugia. Although they may be less biomass than continuous flat beds of eelgrass plants, they serve an important function and should be protected. 4.0 Impacts from Human Activities
The majority of the earth’s population now lives within 10% of land defined as “coastal”. One of the results of this increased pressure on coastal shorelines has been the destruction of approximately 215,000,000 acres of estuarine habitat worldwide (BC/Washington Marine Science Panel 1994). Seagrasses are in decline throughout much of the world, with rates of loss accelerating from a median of 0.9% per year before 1940 to 7% per year since 1990 (Waycott et al., 2009).
7
It has been estimated that 18% of coastal marine and nearshore wildlife habitat in the Salish Sea has been destroyed (British Columbia/Washington Marine Science Panel 1994). A large percentage of this decline is attributed to human impacts, including filling of shallow waters, dredging, and eutrophication (Short and Wyllie-Echeverria 1996). With the population of the Georgia Basin/Puget Sound forecasted to exceed nine million people by 2020, nearshore critical habitat loss is likely to increase. The following is a description of some of the major impacts human coastal settlements have on eelgrass habitats and their functions. 4.1 Removal and Burial Dredging and filling associated with the construction of harbors and ports have been the major cause of the decline in eelgrass beds (Levings and Thom 1994). The plants themselves are removed and then the physical, chemical and biological composition of the system is altered. Sediments raised by dredging can also bury plants growing nearby and alter eelgrass density by affecting water clarity. The reduction in plant density can further increase silt load because it reduces the capacity of eelgrass beds to trap sediments. It can also increase the erosion of bottom sediments because of the reduced root mass available to hold sediments together. The ultimate result is the reversal of the entire nutrient-flow mechanics of the ecosystem. Dredging activities include hydraulic clam harvesting, bay scallop raking, oyster harvesting and maintenance dredging of harbors. Filling in shallow wetland areas with the debris from wood processing (e.g. log dumps and log booms), sediment runoff from agricultural land and logging severely impact eelgrass habitats as well (Phillips 1984). 4.2 Pollution and Changes to Freshwater Input Since estuaries are extremely vulnerable to changes in salinity and temperature, human activities affecting freshwater flows from streams heavily affect eelgrass meadows. Pristine watersheds surrounding estuaries provide steady supplies of fresh water and clean sediments to seagrass communities in the estuary. The opposite holds true as well: unhealthy watersheds increase the problems for seagrass distribution and productivity. Activities that cause increased nutrient loads in streams and rivers can result in overgrowth of algae that then die and deplete the oxygen from the bottom of poorly flushed bays. Chemical contaminants, such as fertilizers, pesticides and household hazardous wastes, runoff from streets and roads and runoff from industrial activities also add to the toxic composition of muddy bottoms of eelgrass meadows (BC /Washington Science Panel 1994). Quiescent waters are more susceptible to chronic contamination than areas with high energy water flows (Harrison and Dunn 1999). In the Salish Sea, more than 540 sq. kilometers of intertidal gravel, sand and mud habitat are closed for shellfish harvesting because of bacterial
8
contamination. More than 730 sq. kilometers of shallow water habitat are unusable for crab and shrimp because of dioxin contamination from pulp mills. More than 32% of classified commercial shellfish growing areas in Puget Sound and Juan de Fuca Strait are either restricted or prohibited for harvesting due to water quality issues (Levings and Thom 1994). The same activities that impact shellfish, crab and shrimp harvesting also impact the health of eelgrass meadows. Most toxic chemicals that accumulate in sediments in an inland sea such as the Salish Sea reside there for long periods of time unless they are physically removed. There is evidence that the roots of eelgrass take up a significant amount of heavy metals for long periods of time (e.g. lead, cadmium, zinc and chromium), thereby making up a large pool of heavy metals in coastal systems (Lyngby and Brix 1989). The consequences of toxic chemicals may have long term effects on eelgrass consumers, especially waterfowl and marine invertebrates. 4.3 Forestry Activities Logging may cause scouring of stream channels and thereby increase sedimentation in estuaries, limiting the light available for photosynthesis. Bark chips from log booms smother eelgrass beds and form a blanket on the substrate, which leads to anaerobic sediment devoid of life (BC/Washington Marine Science Panel 1994). 4.4 Oil Spills Oil spills pose serious threats to eelgrass communities growing in sheltered bays that are poorly flushed. These areas will tend to retain oil for long periods of time, becoming chronically contaminated. If spills happen in late summer or winter when leaf sloughing is at its peak, mats of drift blades will tend to catch and retain oil for later decomposition in the intertidal zone. Seed production and viability could be affected if a spill occurs in the spring (Beak Consultants 1975).
4.5 Shading by Overwater Structures The apparent increase in demand for overwater structures in the Howe Sound Islands can have deleterious and cumulative impacts on the nearshore system. Shading, disruption of nearshore marine water movement, damage to the shore and subtidal habitat and operational pollution from boats can be some of the impacts (Van der Slagt et al., 2003). 4.6 Effects of Boating Boat propeller cuts disturb eelgrass beds in shallow waters, both when boats are travelling through shallow areas and when they are approaching the shore to debark passengers, moor or anchor. The impacts from boating activities in eelgrass beds may be affecting waterfowl such as Black Brant, direct grazers on eelgrass. The Brant have been steadily decreasing in the Pacific Northwest since the 1940’s (Phillips 1994).
9
Conserving eelgrass habitats enhances the amount of high quality rearing habitat as well as increases the ecological services for human communities, including erosion control, sediment settling and food production (shellfish and fish). With the population of the Georgia Basin/Puget Sound forecasted to exceed nine million people by 2020, nearshore critical habitat loss is likely to increase. 5.0 Eelgrass and Rising Sea Levels Sea level rise and increased frequency and intensity of extreme weather are two expected and observed effects of climate change (IPCC, 2007, IPCC 2012). The Intergovernmental Panel on Climate Change warns that on small islands in particular, sea level rise is expected to exacerbate coastal hazards such as storm surges, floods and erosion (IPCC 2007). Impacts of rising sea level on the coastline of the Salish Sea will be more complicated than the inundation of low-lying areas. The effects will differ significantly between different shoreline features. Inland movement of sea water (Titus and Strange 2008), as well as erosion and re-deposition of sediment will reshape the coastal landscape where there is room for the shoreline to shift and sufficient sediment is available (Mumford 2007). Increasing sea levels are expected to shift the zone in which sunlight is available to eelgrass beds. As a result, eelgrass beds are expected to shift inland unless barriers impede this shift (Titus and Strange 2008). Eelgrass beds play a role in shoreline stability. Established eelgrass beds reduce currents, leading to increased sediment and organic detritus deposition (Durance 2002). Continuous dense eelgrass beds provide a buffer for incoming wave energy. The more the bed is fragmented by physical structures (e.g. boats, wharves, docks and overwater play structures), the less eelgrass beds function as an erosion buffer. Where shorelines are constrained by development or structures to prevent erosion (e.g. rip rap, sea walls), natural coastal features will be squeezed out and maintaining shoreline infrastructure and development will require increasingly expensive engineering measures (Mumford 2007). Pre-emptive planning for these changing conditions is necessary to protect settlement areas and shore features recognized for their natural and ecosystem services. This planning includes protection of natural buffers such as eelgrass beds. Preemptive planning for these changing conditions is necessary to protect settlement areas and shore features recognized for their natural and ecosystem services. 6.0 Mapping Methodology Identifying and monitoring the distribution of native eelgrass habitats supplies much needed information for regional planning for conservation purposes. Maps and associated outreach activities also may lead to improvements in land use practices from increased knowledge and awareness about the habitat. Locating areas suitable for eelgrass restoration will lead to rehabilitation of eelgrass meadows as funding opportunities become available.
10
The eelgrass inventory for this project entailed determining the presence or absence of Zostera marina with an underwater towed camera and a boat, except in the Cufra Inlet (Thetis Island) where mapping was done by kayak without a towed camera due to shallow tides. GPS hand held units were used to record waypoints at approximately 10 m intervals in 2012. Accuracy of the GPS readings was on average +/- 2.4 metres. In 2013, a Trimble Pathfinder ProXR GPS was used, except in the Cufra Inlet where a handheld GPS unit was used. A detailed description of the methods used to map eelgrass habitats can be found in Appendix A. The terms used to map eelgrass habitats are described below: 6.1 Distribution The distribution of eelgrass within the bed is described for this inventory as either patchy or continuous. Patchy beds are those that contain isolated groups or patches of plants. Beds which are not patchy are classified as continuous; a bed that contains bare patches surrounded by eelgrass is classified as continuous. The boundary of a bed is determined by a shoot density of less than 1 shoot per square meter (Durance, 2002). 6.2 Form There are two basic forms of eelgrass beds in the Pacific Northwest: fringing beds that occur as relatively narrow bands usually on gentle slopes, and more expansive beds that cover large areas such as tidal flats known as “flat” beds (Durance, 2002). Inter-annual variation within a bed is not well known, but appears to be less than ten percent (Dowty et al, 2005). Fringing beds are generally linear. Flat beds are areas of large eelgrass beds in embayments that extend deeper than fringing and more linear beds found along shorelines (Dowty et al. 2005). Distribution is often, but not solely, determined by aspect to dominant winds. Eelgrass distribution across a bathymetric gradient is limited at the upper boundary by the degree of exposure at low tide (desiccation) and by light limitations at the lower boundary. 6.3 Sediment Types When possible, field observers rated the primary, secondary and tertiary occurrence of substrate types: sand, mud, pebble and cobble. A subtidal environment dominated by cobble might indicate a habitat more suitable for large kelps, which would shade any eelgrass shoots growing between the cobble during the summer months. A predominately sandy muddy bottom would support continuous eelgrass meadows in most cases, unless other factors are present, such as exposure to strong waves or the interruption of habitat by boat mooring buoys. In some cases substrate characteristics change with increasing depth (e.g. cobble to sandy or mud to cobble).
11
6.4 Percent of Cover Percent cover was estimated in broad categories to increase accuracy of observation (<25%, 26- 75%, >75%). The coverage of an eelgrass meadow reflects both the substrate and the flow of water through it. A calm environment with a sandy mud substrate generally supports a dense, continuous eelgrass bed with virtually 100% cover. The cover of eelgrass in areas subjected to strong currents is typically patchy. Areas with heterogeneous substrate (mixture of fine and coarse) also tend to be patchy (Durance 2002). The percent of cover data collected from this inventory is based on subjective approximations as observed through the lens of an underwater camera. The approximate percent of cover does give important information on the density and productivity of a bed. 6.5 Tidal Fluctuations It was important to note whether the tide was running or slack at the time of the inventory. Eelgrass shoots will tend to bend towards the substrate during running tides; the accuracy of percent of cover is then very approximate. 6.6 Presence of Other Vegetation Other types of algae were documented as broad or tuft. Broad algae, such as kelps, sea lettuce and Sargassum muticum can blanket the ocean floor and make it difficult to characterize substrate. They can also shade eelgrass in mixed substrates as they anchor to hard surfaces. Tuft algae, such as brown and red algae do not shade eelgrass but indicate presence of hard surfaces for attachment. The presence of kelps, predominately large brown kelps, was noted, as was the presence of other types of smaller algae and Sargassum muticum. Sargassum is an exotic species of algae that can overshadow eelgrass if the substrate is a mix of sand and cobble. The presence of Sargassum was noted especially off the shores of Thetis and North and South Pender Islands. 6.7 Visibility Visibility was a subjective observation and was rated low, medium and high. The amount of visibility could impact in some instances the accuracy of the observations, namely characterization of substrate. For example, Gambier Island often had low visibility. This can be caused by winds, sediment flows from the lower reaches of watersheds, inputs from nearby streams and tidal/current movements. Low tide periods make for the best visibility. 7.0 Survey Limitations The range of accuracy for all the islands surveyed in 2012 was within +/- 2.4 metres. Visibility at times was poor, due to tidal influences, sedimentation in the water column from stream outflows, summer plankton blooms and wind. During the last day of mapping Gambier Island in August,
12
2012 the wind was too high to continue the inventory. The survey team returned to complete the inventory in September 2012. During the 2013 survey of islands within Howe Sound, the winds were often a factor in scheduling the inventories. The average horizontal precision for the GPS unit used for the 2013 eelgrass inventory was 0.814 m. Percent of cover of eelgrass shoots is difficult to assess accurately with an underwater camera but was deemed important to characterize. Areas of particular interest (e.g., impact of shoreline modifications, restoration potential) should be surveyed by SCUBA divers. Overall, this inventory is an indication of the presence or absence of eelgrass habitat and does not represent maps of the outer or shoreward edges of each bed, with the exception of Bowen, Passage and Bowyer Islands. Polygons were mapped for these islands where possible in 2013. 8.0 2012 Inventory Findings Eelgrass inventories were conducted using ShoreZone inventory maps which include presence of eelgrass where available and the ShoreZone shoreline classification types (available for all islands) as a reference. The Islands Trust eelgrass inventory is important, particularly on islands such as Gambier and Lasqueti, as the ShoreZone data was based on Orthophoto images alone. Valdes, Cufra Inlet (Thetis Island), Passage and Bowyer Islands were mapped in 2013, but are included here under the 2012 inventory, as they are within the Thetis Island and Gambier Island local trust areas which were surveyed in 2012. 8.1 Gambier Island Local Trust Area
Gambier Island was surveyed on August 21st-23rd and September 11th, 2012. This island has rugged shorelines, with steep slopes leading to the subtidal zone. Eelgrass habitat comprises approximately 8.3% of the island’s linear subtidal shoreline. The majority of the eelgrass beds are fringing, the significance of which has been described earlier in this report as important to wildlife corridors. Gambier Island has been highly impacted by historical log storage practices. Eight sites were identified as possible restoration areas starting with small eelgrass test plots (approximately 800 to 1000 shoots). Larger eelgrass restoration might occur if these test plots increase in shoot density and coverage and as funding opportunities arise. In some of these sites, backshore lands have been placed on the real estate market, which may impact future restoration efforts if docks and wharves are permitted as additions to upland development. Boat mooring buoys and recreational equipment on the water over eelgrass beds as well as derelict log booming cables and booms were observed. There were numerous docks and wharves within eelgrass habitats. Several large shoreline modifications were also noted. These changes to
13
the shore can have long term impacts on nearshore environments, including wave scouring, shading and interruptions to sediment transport. With the presence of active and retired log leases, the island would greatly benefit from an eelgrass restoration strategy plan to increase value for both biological diversity and ecological services. Bowyer Island was surveyed on October 11-12th, 2013 using the polygon mapping methodology. The west, north and east coasts of Bowyer Island are largely steep and rocky. The south shore is characterized by several coves, varying in substrate. Eelgrass was estimated to extend along 11.35% of the Bowyer Island shoreline, observed only in particular coves along the southern portion of the island. The area of polygons containing eelgrass was observed to total 3690 m2 and the length of mapped line features was observed to total 70 m. In addition to continuous beds, 4 individual patches of eelgrass were recorded, noted on the map as points. Eelgrass around Bowyer Island was similar in appearance and percent cover to that surrounding Bowen Island, i.e. patchy and sparse. Percent cover within the polygons was less than 25%. Docks were located in eelgrass depth in the bay on the central southern shore of Bowyer Island, within zone W2/W1a. Eelgrass beds in that bay were observed to extend as far as the docks. Several chains were located on the ocean floor in zone W2 on the southeast shore of the island, and a large dock is within or adjacent to the eelgrass bed. Large schools of small fish were frequently observed while circumnavigating Bowyer Island, particularly on the west, north and east coasts. Also observed were large numbers of pile perch (Rhacochilus vacca) and rockfish. Harbour seals were observed in several locations. Passage Island was surveyed on October 5th, 2103 using the polygon methodology. One of the most exposed islands of Howe Sound, this island is a good example of how people and eelgrass tend to occur within similar, sheltered environments. Most of the island is characterized by rocky cliffs, with a few beaches. Eelgrass was observed in sections of the east coast of the island, along 15.67% of the total shoreline of the island. The area of polygons containing eelgrass was observed to total 3718 m2 and the length of mapped line features was observed to total 40 m. Percent cover within the polygons was less than 25%. Ropes were observed on the sea floor in eelgrass depth in an area of the southeast coast of the island in the presence of patchy eelgrass. In this area was also located a floating dock within eelgrass depth and approximately 12 moorings in the eastern part of the area, where the eelgrass was very sparse and patchy. A floating dock and mooring was located at the south end of the more northerly eelgrass polygon on the east coast of the island. The islands west of Bowen Island were inventoried between August 4th - 6th, 2013. The linear shoreline extent of eelgrass habitat surrounding the associated islands within the Gambier Island Local Trust Area totals approximately 13.27%. Most of Keats Island contains flat or fringing beds of continuous eelgrass habitat on sandy/mud substrates, especially on the north and west facing shores. Patchy eelgrass beds were observed on the southeast shores, most likely due to exposure to predominant winds.
14
A high preponderance of single eelgrass patches lie on the southern tip of Keats Island, which may be caused by exposure to southerly winds, but also to the multiple locations of docks, especially on the southwestern shore. There is potential for eelgrass restoration on the northern end of the island at the eastern point of a log booming area if the log lease is retired in the future. This area has a rocky/cobble foreshore, forested backshore and water park with overwater floats. There are also many docks on the southwestern portion of the island, which may cause fragmentation of eelgrass beds. Where there were low rock/cobble substrates, no eelgrass was present. Anthropogenic Impacts include the construction of docks, presence of moored boats in eelgrass beds, removal of native backshore vegetation and recreational use of the nearshore (water park overwater play structures). Continuous flat eelgrass habitat was observed in the southeast and western shores of Shelter Island directly west of Keats Island. No eelgrass was found near Home Island south west of Keats Island. Preston Island south of Keats Island contains a small continuous eelgrass bed on the southeast shore. The backshore is forested. Ragged Islets contain mostly patchy eelgrass beds throughout most of the subtidal areas, except for the west facing side of the islets. Mooring buoys and docks were observed on the eastern shore and a float on the northern side of the islets. Most of the islets are forested and contain rocky substrate. The small islet to the northeast contains a fringing continuous eelgrass bed. The majority of eelgrass surrounding Pasley Island south of Ragged Islets is flat and continuous in sandy/shell hash substrate. Vegetation along the foreshore has been cleared near many residences. Retaining walls, docks and mooring buoy chains interrupt eelgrass continuity along the south and southeastern facing shores. There is potential for eelgrass restoration on the southeastern facing shore almost at the midpoint of the island where there is a gap in an otherwise flat continuous eelgrass bed. On the northeastern shore of Pasley there is a dense eelgrass bed that could serve as a possible harvesting site for restoration of lost or damaged eelgrass habitat. No eelgrass was noted off of Worlcombe Island southeast of Pasley Island. Mickey Island northeast of Pasley Island is surrounded on its western, southern and northern shores by mostly fringing patchy beds of eelgrass in sandy/shell substrate. Eelgrass is mostly likely limited on the eastern shores by low rock/boulder substrates. The rocky shores are surrounded by natural forests. Minimal anthropogenic impacts were observed. To the west lies Hermit Island. The majority of eelgrass habitat is flat and continuous in sandy/shell hash substrates. Most of the habitat is located on the east facing shoreline, though the foreshore is cobble or low rock. The majority of the backshore is forested. In some areas, dock construction interrupts eelgrass beds. Harlequin ducks were observed within an eelgrass area on the southwestern side of the island.
15
Little Popham Island south of Hermit Island has mostly continuous flat beds of eelgrass to the southwest and northeast next to rocky shores and forested backshores. It is very likely eelgrass is limited by the subtidal low rock/boulder substrate surrounding the remaining areas of the island. Most of the eelgrass around Popham Island lives on the northeastern portion of the island in sandy/shell substrate and consists mostly of continuous and flat beds along steep rocky shores. Grace Island southwest of Gambier Island contains mostly fringing continuous eelgrass habitats in shell/sand substrates next to steep rocky foreshores and forested backshores. A large school of fish was observed. Woolridge Island to the northwest of Gambier Island contains mostly flat continuous beds of eelgrass on its north facing shores. The beds are very robust, with a possible harvesting site on the east shore if restoration is undertaken in this area. There is woody debris noted near a breakwater on the north western facing shore of the island. The majority of eelgrass habitat surrounding Anvil Island northeast of Gambier Island lives on the southeastern shores and is characterized as fringing. Most of the island is classified as cliff or low rock/boulder which is limiting for eelgrass growth. The presence of numerous mooring buoys and retaining walls impact the habitat. One potential restoration site was identified on the eastern shore. The islands near the Sunshine Coast within the Gambier Island Local Trust Area were not mapped in 2013 due to poor mapping conditions and scheduling limitations. There are plans to inventory them in 2014, subject to funding and capacity. 8.2 Lasqueti Island
Lasqueti was surveyed from July 17th to July 19th 2012. This island’s shoreline is composed of substrate formed from shallow stony deposits over bedrock. Shallow sandy/muddy benches extend into the subtidal zones. Eelgrass comprises approximately 13.8% of the island’s linear intertidal and subtidal shoreline. The majority of the eelgrass habitat is flat, dense and continuous. Most of the backshore lands were naturalized with little development. Possible impacts that could be occurring would be from boat mooring buoys anchored within eelgrass habitats, grazing by Canada geese, historical damage from log booming practices, hardened shoreline modifications and site locations of some aquaculture enterprises. False Bay could benefit from more detailed eelgrass mapping, as the multiple mooring buoys might be impacting eelgrass habitats. 8.3 North Pender Island North Pender was inventoried on July 3rd, 4th and 6th 2012. Eelgrass comprises approximately 11.6% of the island’s linear intertidal and subtidal shoreline. The majority of the eelgrass beds are flat and continuous. The protected nature of North Pender results in a relatively high proportion of soft substrate in shallower areas.
16
Impacts include housing developments with accompanying tree and shrub clearings, rip rap and rock wall modifications, some of which were constructed below the high water line, direct raw sewage outfall at Port Washington which would directly affect the water quality for eelgrass productivity, the presence of Canada geese, direct grazers on eelgrass shoots during low tides, and mooring buoys within eelgrass beds. Port Browning might be an appropriate site for eelgrass restoration as the substrate is suitable and there is a small bed on the northeast side. 8.4 South Pender Island South Pender was surveyed on July 6th 2012. Eelgrass comprises approximately 8.5% of the island’s linear intertidal and subtidal shoreline. South Pender has more exposed shoreline therefore less eelgrass is to be expected. Roughly the same proportion of flat and fringing beds are present with slightly more than half of them being continuous. 8.5 Mayne Island Mayne Island was surveyed from 2009-2012 using two methodologies on a variety of platforms including: 1) delineation and creation of polygons (with towed underwater camera, on foot, by kayak, by free diver), 2) linear presence/absence (by kayak). Data was converted to presence/absence line format for incorporation into the 2012 Islands Trust Eelgrass Inventory. Mayne Island is mostly protected except on the Northeast side which is exposed to winds from the Strait of Georgia. Eelgrass comprises approximately 22% of the island’s linear intertidal and subtidal shoreline. The Mayne Island associated islands, Georgeson Island and Curlew Island, contain 15.7% and 24.8% respectively. Evidence from the Mayne Island Conservancy’s eelgrass monitoring program and historical anecdotal evidence has shown loss in intertidal eelgrass in Miners Bay and two Southeast facing bays on the Southeast side of Mayne. Reasons for loss are unknown, but ongoing monitoring will indicate natural variability in these eelgrass beds. Potential impacts include grazing from Canada geese, anchoring, mooring buoys, trampling by kayakers and damage from boats and propellers. Winter heavy rain events could be introducing increased sediment loads into eelgrass beds, but this would need to be studied. Gallagher Bay (on Navy Channel) and Conconi Reef Park are potential eelgrass restoration sites. They both have large bare areas adjacent to continuous eelgrass beds and have suitable substrate. 8.6 Thetis Island Local Trust Area Thetis and its associated islands were surveyed July 31st through August 3rd, 2012, except for the inside of Cufra Inlet which was inaccessible because of low tides, and Valdes Island. The Cufra Inlet survey was completed in the summer of 2013. Valdes Island was surveyed July 29th, and 30th, 2013.
17
Approximately 26.6% of the linear subtidal shoreline on Thetis Island is composed of eelgrass habitat, 72% of which is continuous. Fringing continuous eelgrass beds were observed off the western shore of Thetis where the ShoreZone map indicates a preponderance of low rock and boulder (not a typical shoreline type for eelgrass). North Cove is also rich with an abundance of eelgrass, except where it is shaded by overwater structures. Cufra Inlet contains dense (26-75% cover) flat continuous eelgrass beds. The inside of the inlet was surveyed during the summer of 2013 by local residents using kayaks and hand held GPS units but without the use of an underwater camera, as the water was shallow enough for eelgrass to be observed from the kayaks. Low tides in 2012 prevented an aluminum boat from approaching close to shore during the low tides occurring during the survey. The continuous bed begins on the western shore of Cufra Inlet as a narrow 1 m wide swath on the shoreward side and then widens out. An abundance of drifting sea lettuce (Ulva spp.) was observed within this area. Eelgrass became denser seaward in the muddy/shell hatch substrate. The substrate became sandier as the mappers traveled towards the mouth of the channel. Patches of sand dollars were noted as the inlet widens and the eelgrass extends towards the eastern shore. Diatoms were noted growing on the eelgrass blades. At the western edge of the mouth of the inlet eelgrass is patchy and sparse despite its ShoreZone classification of ‘cliff’. Clam Bay eelgrass was dense and continuous. Telegraph Harbour on Thetis Island had a preponderance of algae (Ulva spp.), Sargassum muticum and filamentous algae growth. Visibility was poor. Upland and shoreline development (rip rap, retaining walls and cement ramps) with accompanying vegetation clearing most probably has led to higher sedimentation in the nearshore waters. Understory kelps were observed at most sites, although no fish or crab species were present at the time of the survey in the majority of the survey area. Possible impacts from boat moorings within eelgrass beds (e.g. Ruxton Island had > 15 boats moored off shore in one small area), recreational overwater play structures, shoreline modifications and nutrient run-off could be impacting nearshore habitats. Where there was suitable substrate for eelgrass as indicated by the ShoreZone data, eelgrass was present, with the exception of the narrow channel between Thetis and Penelakut Islands. However a long-time resident remembers eelgrass presence there approximately 40-50 years ago. Islets and small islands are important refugia for wildlife and often are less impacted than the surrounding larger islands. A short description of the smaller islands and islets associated with Thetis Island are described below.
18
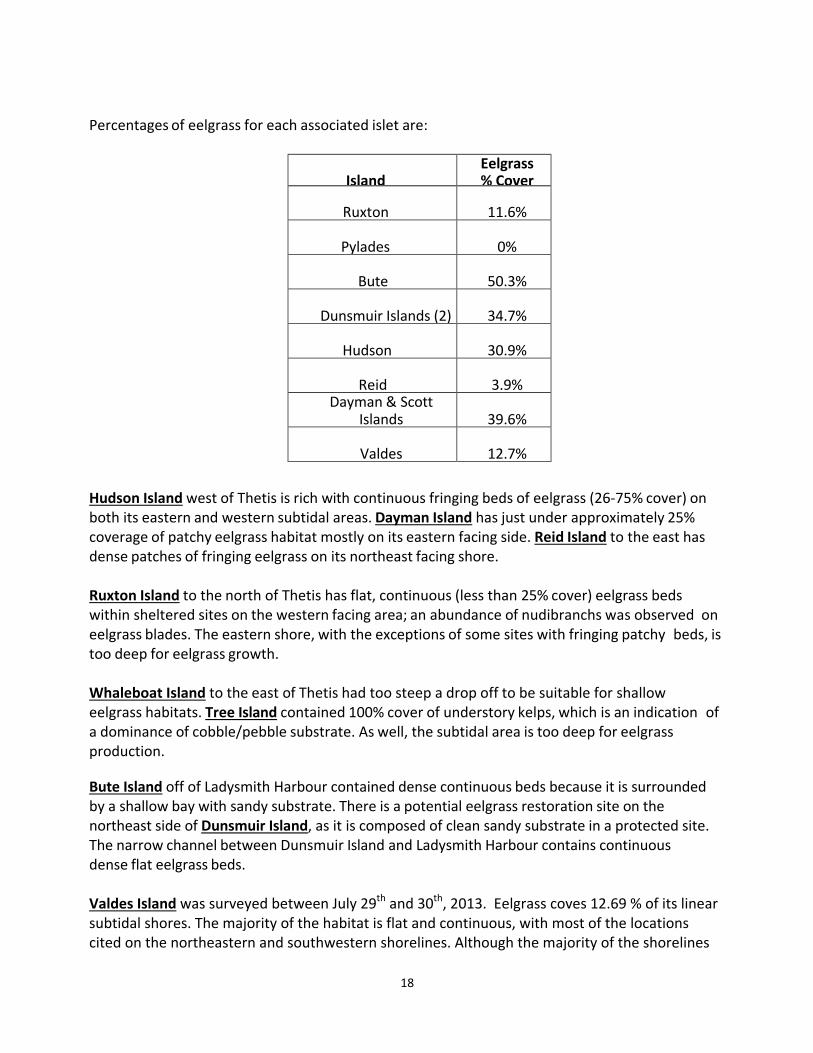
Percentages of eelgrass for each associated islet are:
Island
Eelgrass % Cover
Ruxton
11.6%
Pylades
0%
Bute
50.3%
Dunsmuir Islands (2)
34.7%
Hudson
30.9%
Reid
3.9%
Dayman & Scott Islands
39.6%
Valdes
12.7%
Hudson Island west of Thetis is rich with continuous fringing beds of eelgrass (26-75% cover) on both its eastern and western subtidal areas. Dayman Island has just under approximately 25% coverage of patchy eelgrass habitat mostly on its eastern facing side. Reid Island to the east has dense patches of fringing eelgrass on its northeast facing shore. Ruxton Island to the north of Thetis has flat, continuous (less than 25% cover) eelgrass beds within sheltered sites on the western facing area; an abundance of nudibranchs was observed on eelgrass blades. The eastern shore, with the exceptions of some sites with fringing patchy beds, is too deep for eelgrass growth. Whaleboat Island to the east of Thetis had too steep a drop off to be suitable for shallow eelgrass habitats. Tree Island contained 100% cover of understory kelps, which is an indication of a dominance of cobble/pebble substrate. As well, the subtidal area is too deep for eelgrass production. Bute Island off of Ladysmith Harbour contained dense continuous beds because it is surrounded by a shallow bay with sandy substrate. There is a potential eelgrass restoration site on the northeast side of Dunsmuir Island, as it is composed of clean sandy substrate in a protected site. The narrow channel between Dunsmuir Island and Ladysmith Harbour contains continuous dense flat eelgrass beds. Valdes Island was surveyed between July 29th and 30th, 2013. Eelgrass coves 12.69 % of its linear subtidal shores. The majority of the habitat is flat and continuous, with most of the locations cited on the northeastern and southwestern shorelines. Although the majority of the shorelines
19
on the western portion of Valdes are ShoreZone classified as low rock/boulder or cliff, the presence of flat continuous beds with bare patches was noted on the north and south western shores. Three potential restoration sites were identified; one on the central western side of the island, the second site on the northern tip of the island containing a small degraded eelgrass bed adjacent to the BC Parks dock, and the third is located on the southwestern shore which might have been historically impacted by log storage. The substrate at this site is suitable for a transplant; however Ulva spp. is present, which might be an indication of a high level of nutrient inputs.
The location of mooring buoys in eelgrass habitats with fifty-one buoys observed within beds and the interruption of eelgrass continuity by the construction of docks are the major anthropogenic impacts affecting eelgrass habitats on Valdes. The majority of the shoreline is naturally vegetated. 9.0 2013 Inventory Findings The islands mapped in 2013 for eelgrass (Zostera marina) within the Islands Trust Area Islands include:
• Denman Island Local Trust Area, • Hornby Island Local Trust Area, • Ballenas – Winchelsea (Executive Islands) Local Trust Area, • Gabriola Island Local Trust Area, • Galiano Island Local Trust Area, • Valdes Island and Cufra Inlet in the Thetis Island Local Trust Area • Bowen Island Municipality • Gambier Island Local Trust Area Associated Islands in the Howe Sound
(i.e. excluding the islands off of the Sunshine Coast)
The characteristics and locations of eelgrass habitats for each island are described below in order of the beginning dates eelgrass inventories occurred. Note that Valdes and Cufra Inlet are described in Section 8 above as they are in the Thetis Island Local Trust Area. Similarly the Gambier Island Local Trust Area Associated islands are also described in Section 8 as they are in the Gambier Local Trust Area. Both Thetis and Gambier Islands were mapped in 2012. 9.1 Galiano Island Local Trust Area Galiano and its associated islands were inventoried over seven days between June 26th and November 25th, 2013. Approximately 16.66 % of the linear subtidal shoreline of Galiano Island is eelgrass habitat.
20
ShoreZone maps indicate that most of the southwestern and northeastern shorelines of Galiano Island are not suitable substrates (coastal bluffs and low rock/boulder respectively), except where there are sheltered embayments. However there are notable exceptions over the north, south west, south and eastern areas of the entire island. The eelgrass distribution on Galiano is 88% continuous; 12% patchy. The placement of mooring buoys (at least 14 were noted within eelgrass beds, especially on the southwestern shores of the island), private docks (at least 12) and log storage have damaging effects on the habitat’s continuity and function as a wildlife corridor. The construction of retaining walls (rip rap, rock and wooden) and the removal of backshore vegetation (at least 10 sites were observed) are obstacles for eelgrass to flourish in certain sites. Most of the backshore on Galiano Island remains naturalized, with notable exceptions where trees and understory vegetation surrounding residences are removed and where shores are modified with retaining walls. Exotic invasive plants include English ivy, St John’s Wort and gorse. Heavy epiphytic algae growth on eelgrass blades were noted within Montague Harbour, a possible indication of a high level of non-point source pollution. Another site for pollution is the public dock in Whaler Bay where boats are worked upon. Best management practices are recommended for boat sewage disposal and using tarps for collection of boat paint chips at each location. There is the potential for eelgrass restoration within Whaler Bay, as the channel in front of the public dock contains a narrow band of eelgrass that could be expanded shoreward if log leases were retired in the future. In November, bufflehead and Barrow’s Goldeneye as well as schooling forage fish were observed. Patchy eelgrass beds were noted off the eastern shores of Galiano Island. This area is ShoreZone classified as low rock/boulder. Four mooring buoys were located with these beds. The eelgrass habitats covering the associated islands of Galiano comprise approximately 19.98% of the islands’ linear shorelines. Parker Island has extensive eelgrass on its northeastern shores (96% continuous). The construction of docks and the placement of mooring buoys within eelgrass beds, however, may be impacting the habitat. Most of the eelgrass surrounding Gossip Island lives on the island’s east facing shores is continuous (95%); however docks (7 were noted within the eelgrass beds) interrupt their form and function. Mooring buoys (3 observed) are situated within the existing beds on the south-western facing shores also disrupt the connectivity of eelgrass habitats. No eelgrass was observed on Ballingall and Lion Islets, Wise, Charles, Sphinx or Julia Islands.
21
9.2 Gabriola Island Local Trust Area Gabriola Island and associated islands were surveyed between July 8th and 21st, 2013. Gabriola Island’s linear shores are comprised of 24.8 % eelgrass, with 89% continuous distribution. Two potential eelgrass restoration sites were identified on this island. The first is on the southwestern shore facing Mudge Island near an active log booming site. When the log lease is retired at this site, a small eelgrass transplant (100-500 shoots) could indicate whether the area is suitable for a larger transplant. The second site is on the northeast tip of Gabriola Island where a small existing bed could be expanded. Wildlife in some areas abound, including Canada geese, an abundance of fish species, Great Blue Herons (22 at the southern channel entrance between Gabriola and Mudge Islands), sand dollars and Bald Eagles. Beaches that have suitable substrate for sand lance and surf smelt spawning were also noted. Healthy eelgrass beds near the Malaspina Galleries in Gabriola Sands Provincial Park are not surrounded by mooring buoys and docks and are thriving in in 4-5 metres water depth, although the area also contains rocky substrates. Possibly the biggest impacts to marine wildlife habitats on Gabriola and its associated islands are the locations of floats and mooring buoys (in one embayment on the northwestern shore of Gabriola, over 12 floats – moorings and/or crab traps – and 14 buoys were observed in a continuous eelgrass bed); construction of retaining walls (nine riprap or rock walls identified); and, the removal of native backshore vegetation (13 sites). Numerous moorings are located in an otherwise robust eelgrass bed in Degnen Bay. The eelgrass coverage for the Gabriola associated islands’ linear shorelines totals 19.98%. Near the eastern shore of DeCourcey Island south of a marine park there are many docks and boats. Poor water quality was noted, and there are no washroom facilities at this location. No marine life was observed growing on the seafloor. North of the marine park there is a potential restoration site facing a steep rock ramp foreshore and a steep grassy conifer backshore near a former log booming site. Snake Island has the potential for eelgrass restoration on its southern tip where there is a protected area with suitable subtidal sandy mud substrate, although this location may be too close to active boating. Seal pups and oyster catchers were cited near a large mussel bed. There was no eelgrass habitat observed on Hudson Rocks. Marine life there included seal pups hauled out, bird habitats, cormorants and oyster catchers. The shell hash substrate off of Five Finger Island was noted to be situated too deep for eelgrass growth. Mudge Island also has a potential eelgrass restoration site on its southeastern shore. Kelps are mixed with sandy/muddy/shell substrate. Most of the backshores are naturally vegetated, with exceptions near residential developments where mooring buoys are situated within eelgrass
22
beds (4 observed). The eelgrass habitat observed on Mudge was a mix of patchy/ continuous and flat / fringing beds on the eastern shores of the island. One bed in particular, located mid- island on the eastern side extended 100 metres shoreward beyond the waypoint, but the water depth was too shallow to delineate the bed.
Eelgrass on Link Island is characterized as flat continuous beds on its eastern shores. On the south shore of Link Island there are multiple docks (4) and mooring buoys (6).
Continuous fringing beds lie next to the northwest shores of Breakwater Island. Near Saturnina Island there are fringing continuous beds of eelgrass habitat on the western and northern shores. Bath Island has a wide rock ramp in front of a windblown forest with a patchy bed with two larger patches surrounded by kelp and Sargassum muticum on its northwestern shore, while on its western shore there was a flat continuous bed. Eelgrass habitat on Tugboat Island is characterized as narrow beds tucked between shore and wharf floats on the eastern side of the island and between the Tugboat Island and Sear Island to the south, which has flat continuous beds on its western shores. Continuous flat beds lie at the entrance to a marina on Vance Island. A rock/boulder shoreline with a, private dwelling with floating dock and several moorings are near flat continuous eelgrass habitat on Acorn Island. 9.3 Denman Island Local Trust Area Denman Island and its associated islands were inventoried on several boat expeditions between August 20th and September 15th, 2013. In the Denman Island Local Trust Area 33.24% of the linear shore contains eelgrass. In some areas, especially in eastern subtidal areas, patchy eelgrass was observed amongst broad leaf kelps and Sargassum muticum, where the substrate is classified as low rock/boulder. A potential restoration site is located on the southwest area of the island near Metcalf Bay and is close to a site that could be used for harvesting transplants. The substrate south of this site gradually changes to cobble and gravel. Most of the beds surrounding the island are fringing, most likely due to coarser substrate changes at depth. Eelgrass habitat is situated on the north eastern shores, classified by ShoreZone as sand/cobble and where numerous overwater structures are located and associated with industrial aquaculture activities. The eelgrass here was predominately patchy; most likely there are more patchy beds both shoreward and seaward of the mapped area. This area is the second most patchy eelgrass habitat observed, second only to areas in Howe Sound. The majority of the backshore is not heavily impacted by development; most of the residences had either forested or grassy areas between them, with a minimum of landscaping. Abundant species of birds including black legged kittiwakes, surf scoters, marbled murrelets, grebes, harlequin ducks, surf scoters, herring gulls, and other marine wildlife species such as hooded nudibranchs, sand dollars, sand lance juveniles and abundant schooling fish were observed.
23
Sandy Island north of Denman Island contains continuous (99%) eelgrass habitats although the southern shores are ShoreZone classified as sand/cobble and the northern areas are classified as altered. Sand dollars were observed on both eastern and western sides of the island. Seal Islets were surrounded by fringing continuous (81%) eelgrass habitats. Associated with these beds were observed marbled murrelets and rafts of harlequin ducks and surf scoters, kittiwakes, gulls and seals. The backshore consisted of flat shrub, herbaceous and grassy slopes. . No eelgrass habitat was observed near Chrome Island due to unsuitable rocky substrates. 9.4 Hornby Island Local Trust Area Eelgrass beds on Hornby Island were mapped over several days between August 21st and September 12th, 2013. The linear shoreline of the Hornby Island Local Trust Area is composed 31.70 % of eelgrass habitat. Large areas on both the western and northeastern shores of Hornby have continuous (90%) flat beds, although the classification by ShoreZone of these shorelines is low rock/boulder. The small areas of eelgrass found in these otherwise rocky cobble areas are valuable as critical habitat and corridors for marine life. Most of the backshore is naturalized, even where residential houses are situated. Suitable substrate for spawning sites for forage fish was identified on the north eastern shores. Three potential restoration sites were also noted; one near this area for potential forage fish spawning, the second within a sandy embayment on the eastern shore (if boat anchoring pressures were decreased), and the third near the Hornby Island ferry terminal on the western side of the island (eelgrass was noted just north of the terminal growing in pebbles). There is also an opportunity for a community clean-up of underwater debris near a breakwater and marina on the southern end of the island. On Toby Island dozens of seals were hauled out. 9.5 Ballenas – Winchelsea (Executive Islands) Local Trust Area The islands within the Ballenas – Winchelsea Local Trust Area were surveyed for eelgrass habitat between November 21st and 23rd, 2013. The total linear shoreline coverage of the Local Trust Area is 1.4%. Mistaken Island west of Parksville has two eelgrass sites, one fringing patchy bed and the second within a cove with a dock, both on the southwestern shore. A flat continuous bed lies between the channel separating the Ballenas Islands. A continuous bed also lives on the north shore of the south island, punctuated with rock substrate. A school of forage fish, possibly sand lance was observed at the time of the survey in the shallow subtidal zone. A small flat continuous bed on the west facing shores of the Ada Islands also may serve as suitable habitat for forage fish, prey for ancient murrelets, of which one was cited by field staff (unconfirmed). A second eelgrass bed is situated on the western shore of the west Ada Islands. The substrate at this location is primarily sandy with a secondary substrate of bedrock with associated intermixing rockweed and detritus. A seal haul out with 61 seals was noted near this site.
24
A small flat continuous eelgrass bed is located on the northeastern side of Southey Island. No eelgrass habitats were observed on Gerald, Yeo, Amelia, Ruth or Winchelsea Islands. 9.6 Bowen Island Municipality Bowen Island was surveyed between Aug 6th -11th and Oct 4th, 5th and 12th, 2013 using the polygon mapping methodology. The island is characterized by a mix of sandy bays and steep shorelines. Large homes are common, with docks constructed both in the bays and on the steep cliffs. Bays, which are areas in which eelgrass is expected to grow, were also the location of waterfront homes and associated docks (both land-based and floating), moorings and anchored boats. Eelgrass was estimated to extend along 11.6% of the shoreline of Bowen Island. The area of mapped eelgrass polygons was observed to total 41,917 m2 and the length of mapped line features was observed to total 958 meters. Percent cover was low, however, and in addition to continuous beds, 84 individual patches of eelgrass were recorded and noted on the map as points. Eelgrass was observed within bays and straight sections of coastline on the southwest, northwest, northeast tip, east (Mannion Bay and north) and southeast coasts. Around much of the island eelgrass was characterized by frequent individual patches, with each patch often consisting of very few shoots. Patches on the west coast were observed in areas that, from the shoreline or ShoreZone analyses, would not have been predicted, as the plants occurred seemingly opportunistically in patches of soft substrate located amid boulders and other coarser substrate. Percent cover even in continuous beds was consistently far less than 25% and noticeably sparser than other islands within the Islands Trust areas also surveyed during the 2013 mapping season. Docks in areas such as in Tunstall Bay were located in depths suitable for eelgrass growth. Distances between some points on the polygon mapped in Tunstall Bay are longer than 20 meters as the eelgrass field surveyors needed to navigate around swimmers, docks and moored boats. Large clusters of sunflower stars (Pycnopodia helianthoides) were observed in the bay on sandy bottoms that did not contain eelgrass. Docks and moorings were also located in eelgrass depth elsewhere on the west coast of Bowen Island (e.g. the relatively straight shoreline north of Bowen Bay, King Edward Bay, the shoreline north of King Edward Bay and Galbraith Bay). In some sites such as Galbraith Bay and Columbine Bay, eelgrass was only observed on one side of the bay despite suitable sandy substrate on the other side. For example, the substrate on the north side of Galbraith Bay was bare sand. There were several moorings in that bay. Eelgrass in Columbine Bay was sparse and appeared unhealthy; individual clumps were surrounded by bare sand. One hypothesis for this is that eelgrass may be impacted by boat wakes in the area. Boats were moored throughout eelgrass depth in Cates Bay.
25
Multiple beds of continuous eelgrass were identified throughout Mannion Bay between zero and more than 5 meter depth relative to chart datum. These beds, however, were not as dense as would be predicted given the soft substrate and sheltered environment. In the northeast side of the bay bare sandy fringing beds are interrupted by the construction of docks. Mannion Bay is heavily used for boat anchoring, mooring and docking within depths suitable for eelgrass growth. The construction of docks and floats and their associated chains are impediments for eelgrass productivity in this area. Multiple adjacent docks have been constructed within eelgrass depth Ropes and chains from docks, moorings or anchors had dragged on the sea floor, apparent due to the patterns they had created in the sand. The motion of the chains due to waves and currents can damage or uproot eelgrass. Eelgrass otherwise appeared healthy in Mannion Bay and there are opportunities to restore lost eelgrass habitat if boat anchoring were restricted to a defined area outside of the depth range for eelgrass growth, i.e. if they were limited to 6 m depth or deeper. Schools of fish were observed within the existing sparse eelgrass; therefore, restoring the eelgrass in the area would serve to enhance fish habitat. Although it was not included in the project deliverables, the research team had been requested to look for evidence of litter on the sea floor in this bay; however, only a few cans and the possible remnants of a shopping cart were observed. Some of the moorings and anchored boats appeared derelict. Many crabs were observed on the south side of the bay, but were not identified to species. No eelgrass was observed in Snug Cove including the head of the cove, near Crippen Park beach. Possible reasons include dredging, ferry wakes, eutrophication and boat traffic associated with the marina, and pollution of the substrate due to chipped wood debris. No flora was observed on the sea floor except for encrusting algae. There are restoration opportunities for the nearshore environment by Crippen Park beach if the historical and present impacts from the marina and former log booming site are addressed. The inner portion of the eastern cove of Konishi Bay on the south coast of the island appeared suitable for eelgrass due to the sandy substrate and sheltered cove with a sandy beach. The substrate was bare sand, however. Eelgrass was observed in deeper locations of that bay. Removal of native plants and retaining wall constructions were noted around residences. In another eelgrass location in the southern portion of Seymour Bay/Seymour Landing where an adjacent coastal lot was for sale, coastal vegetation had been cleared and there is already evidence of slope failure both at the top and foot of the slope, despite installation of riprap. Water flow had also been channeled in the area, which could intensify water and sediment flow into the nearshore environment. Slope failure is a possible threat to eelgrass through smothering by eroding sediments. Shoreline hardening also increases wave energy and wave deflection, which can scour shorelines (Lamont 2013).
26
The area around Cape Roger Curtis has been of concern to local residents due to the construction of large docks and potential for damage to submerged habitats. Eelgrass was not observed around the exposed cape, as the observed substrate was steep and rocky. Kelp was observed in the area, however. Chains from the new construction were observed on the ocean floor. Kelp beds are a major feature along the rocky parts of the Bowen Island shoreline. Several schools of small or juvenile fish were also observed around the island. 10.0 Threats to Eelgrass Habitats The impacts from human activities have been described previously (Section 4.0). Other field observations are described below. There seems to be an increase in the abundance and distribution range of the invasive seaweed, Sargassum muticum within the Islands Trust Area, although there is at present no research to substantiate this. Although the plant settles and grows on cobble, surrounding eelgrass in sandy/muddy sediment can be shaded out by its overarching canopy. The presence of Zostera japonica was noted on Lasqueti and Thetis Islands and other areas within the Islands Trust. This non-native species of eelgrass is not known to compete with Z. marina, though it can be found mixed with the native eelgrass in the lower reaches of the intertidal zone. Though there is some disagreement about the causes of epiphytic algae growth on eelgrass blades, it was noted within Telegraph Harbour on Thetis Island and Montague Harbour on Galiano Island. This could be an indication of excessive nutrients, causing an abundance of algae growth on the blades and blocking light, nutrients and gas exchange (Mumford 2007). Canada geese are infamous for their grazing on eelgrass shoots. They were noted in large numbers on Lasqueti, Gabriola, and North Pender and South Pender Islands. Overgrazing of shallow eelgrass beds might be a growing concern as the birds are increasing in range and numbers. As winter storms intensify, there might be an increase in burial of eelgrass shoots by sand over wash. Monitoring eelgrass habitats over time in selected locations vulnerable to storm events might shed light on the effects of climate changes upon the nearshore environment. Eelgrass Restoration 11.0 Opportunities for Eelgrass Restoration Thirteen areas in 2012 and nineteen in 2013 were identified as potential sites for eelgrass restoration as indicated in the legends on the maps produced by this project. When funding is available, these sites can be further investigated. The history of eelgrass transplants and their success in British Columbia to date is described below.
27
11.1 History of Eelgrass Restoration In the Pacific Northwest, the history of success for Zostera marina transplanting projects was dismal prior to 1985. Initially transplant techniques were developed and successful on the Atlantic coast. However, these techniques were not well suited to the Pacific north coast environment and eelgrass. Many of the early transplants were conducted without a thorough understanding of eelgrass physiology and ecology; the donor stock was not always well suited to the area where they were transplanted, and the biophysical conditions of the transplant site were not always appropriate for the species (Durance 2001). Since 1985, knowledge and experience from adaptive management practices have resulted in a higher success rate for focused mitigation and enhancement projects along the Pacific coast (Thom, Borde, Williams, Southard, Blanto and Woodruff 2001). Factors that led to a higher success rate include the correct selection of physical attributes for the restoration area, including elevation, substrate composition and light and current regime. The selection of the most suitable ecotype or genotype increased the likelihood for success and rate of production. The criteria for success included shoot density and area re-vegetated (Durance 2001). 11.2 Criteria for Successful Restoration
In British Columbia, the criterion for transplant success is based upon the mean shoot density being equal or greater than the area of adjacent natural beds and the area coverage. Projects are thus considered successful if the habitat that was created provided habitat equal in eelgrass productivity (shoot density) to that which it was designed to replace (Durance 2001). Site selection with the appropriate biophysical characteristics (salinity, sediment type, current velocity, light/depth, temperature, and pH), using suitable plant donor stock (ecotype), using an appropriate transplanting technique and handling the donor plants with care are necessary for successful transplants. Several restoration transplants have occurred in Squamish, the Sunshine Coast, Campbell River, Cowichan Bay and Saanich Inlet. Most of the locations have been impacted by historical log storage practices. The majority of these transplants are considered successful based on monitoring of shoot densities and area coverage post-transplant. They were completed under the supervision of a scientific advisor with community volunteer support and a Workers Compensation Board (WCB) certified team, with funds collected by environmental conservation groups. 12.0 Recommendations Globally, eelgrass has been used as an indicator of water quality (Neckles 1994). Often, a bed will decrease or increase in width and length dependent on light availability. The lower depth distribution of eelgrass is related to overall water clarity. Water quality, including water clarity, is affected by land practices and water uses. If, for example, a large scale development occurs on shore near an eelgrass bed, the bed may decrease in size because the water quality in the nearshore is consistently compromised by the increased pollution load, known as non-point source pollution, frequently delivered by the storm water system. When the amount of light reaching the
28
plants is limited by shading from increased sediment or plankton blooms associated with increased nutrients from land, eelgrass meadows adapt to the poor light availability through dieback, decreases in density or width and migration to shallower depths. The Islands Trust Area is home to more than 25,000 people and is located between the highly populated centres of Vancouver, Victoria and Nanaimo. However, only approximately 12.5 % of the marine environment has some type of protection. Most of this protection is in Rockfish Conservation Areas, with Provincial and Federal Marine Protected Areas accounting for only 1.53% (Islands Trust Fund Regional Conservation Plan 2011-2015). Sound decisions by local trustees and an educated public are necessary to protect the functions of the nearshore for all who benefit from their healthy ecology. A set of recommendations is listed below to contribute to the conservation work of the Islands Trust and Islands Trust Fund. 12.1 Education
1. Educate boaters and coastal residents about the presence and importance of eelgrass beds.
2. Encourage shoreline landowners to replace light-impenetrable docks with materials that allow light penetration.
3. Encourage signage at boat ramps reminding boaters to avoid eelgrass beds in shallow
water.
4. Build public awareness about the importance of reducing nutrient inputs in marine riparian areas; encourage protection and restoration of wetlands and the construction of retention ponds to filter land based pollutants; and encourage reduction in the use of fertilizers, pesticides and herbicides.
5. Develop a long term public outreach nearshore marine education strategy that includes
new shoreline property owners. 12.2 Regulatory and Enforcement
1. Limit dock development, particularly in established and potential eelgrass areas (i.e. areas where substrate is suitable for eelgrass growth).
2. Encourage creation of “No anchoring/mooring” zones in suitable eelgrass areas (based on substrate, depth and observed presence of eelgrass); encourage movement of moorings to areas that are too deep for eelgrass.
3. Limit shoreline development; maintain a coastal riparian zone that will enable inland shift of eelgrass beds as sea levels rise.
29
4. Create and implement appropriate setbacks for built structures from the nearshore.
5. Limit or reduce overwater structures; increase shared community docks and wharves when possible.
6. Require removal of illegal shoreline modifications; require restoration or removal of aged
derelict structures where possible.
12.3 Opportunities for collaboration with other agencies
1. Encourage and undertake as resources allow regularly scheduled monitoring of sensitive or vulnerable shorelines; make monitoring results readily accessible to all.
2. Where boat traffic must go through an eelgrass bed, encourage establishment of marked
boat channels so that the least damage is done to the habitat.
3. Create protected marine zones and encourage planned siting for mooring buoys for recreational boats around eelgrass beds.
4. Promote management strategies to mitigate conflicting uses in eelgrass habitat, such as
oyster and clam harvesting, boating and anchoring in meadows and near-shore development requiring dredging.
5. Promote restoration of natural hydrology when opportunities arise.
6. Promote restoration of eelgrass habitats where possible.
13.0 Conclusion
Changes from increased human population, more frequent and intense storms and changes in sea levels and pH of the oceans emphasize the need to monitor eelgrass habitat and protect it with sound science- based policies and regulations. Eelgrass meadows function as natural marine sanctuaries, as indicators of nearshore ecological health, and as sequesters of atmospheric carbon. As well, these valuable habitats are important sources of nutrients for local and off-shore marine and nearshore systems. The conservation, protection, monitoring and restoration of native eelgrasses within the Islands Trust Area is and will continue to be a long term smart investment in the social, cultural and biological vitality of the islands.
30
References
Beak Consultants. 1975. Biology oil impact literature review final report 1975. Baseline Study Program, North Puget Sound, Dept. of Ecology, Olympia Washington.
Bostrom C., Bonsdorff E. 2000. Zoobenthic community establishment and habitat complexity – the importance of seagrass shoot density, morphology and physical disturbance for faunal recruitment. Marine Ecology Progress Series 205:123-138.
British Columbia/Washington Marine Science Panel. 1994. The shared marine waters of British Columbia and Washington: A scientific assessment of current status and future trends in resource abundance and environmental quality in the Strait of Juan de Fuca, Strait of Georgia and Puget Sound of BC State of Washington. p 71.
Campbell, Colin (2010). Blue Carbon Report. Sierra Club BC.p.1. Dowty, P.B. Reeves, H. Berry, S. Wyllie-Echeverria, T. Mumford, A. Sewell, P. and Wright R. 2005. Puget Sound submerged vegetation monitoring project: 2003-2004 monitoring report. Nearshore Habitat Program, Aquatic Resources Division, Washington State Department of Natural Resources, Olympia, Washington. Duarte, C.M. 2000. Marine biodiversity and ecosystem services; an elusive link. Journal of Experimental Marine Biology and Ecology. 250:117-131.
Durance, C. 2001. A review and assessment of eelgrass transplant projects in British Columbia. Document prepared for Fisheries and Oceans, South Coast Area. 37.
Durance, C. 2002. Methods for mapping and monitoring eelgrass habitats in British Columbia. Funded by the Canadian Wildlife Service, Environment Canada.
Harper, J. 2011. Coastal habitat mapping program fact sheet. Coastal & Ocean Resources Inc. Harrison, P.G. and Dunn, M. 1999. The Fraser delta sea grass ecosystems: importance to migratory birds and changes in distribution. In: unpublished manuscript. p. 3-4. IPCC. 2007. Climate change 2007: synthesis report. An assessment of the Intergovernmental Panel on Climate Change. Adopted at IPCC Plenary XXVII, Valencia, Spain, 12-17 November 2007, 52pp.
31
IPCC. 2012. Managing the Risks of Extreme Events and Disasters to Advance Climate Change Adaptation. A Special Report of Working Groups I and II of the Intergovernmental Panel on Climate Change [Field, C.B., V. Barros, T.F. Stocker, D. Qin, D.J. Dokken, K.L. Ebi, M.D. Mastrandrea, K.J. Mach, G.-K. Plattner, S.K. Allen, M. Tignor, and P.M. Midgley (eds.)]. Cambridge University Press, Cambridge, UK, and New York, NY, USA, 582 pp.
Islands Trust Fund Regional Conservation Plan (2011-2015). Prepared for the Islands Trust Fund Board, November, 2010 and endorsed by Islands Trust Council December 8, 2010.
Lamont, G. SNC Lavalin. 2013. Presentation to Conference on Science and Stewardship – Addressing Rising Sea Level Impacts on Coastal Communities, Brackendale, BC, 30 November 2013. Levings, Colin; Jamieson, Glen. 1995. Marine and estuarine riparian habitats and their role in coastal ecosystems. Pacific Region. Canadian Science Advisory Secretariat.). Levings, C.D. and Thom, R.M. 1994. Habitat changes in Georgia basin: implications for resource management and restoration in: Proceedings of the BC/Washington Symposium on the Marine Environment. January 13th -14th, 1994. R.C.H. Wilson, R.J. Beamish, F. Aitkens, j. Bell, eds. Can. Tech. Pep. Fish. Aqua. Sci. 1948: 330-349. Lyngby, J.E. & Brix, H. 1989. Heavy metals in eelgrass (Zostera marina) during growth and decomposition. In: Hydrobiologist 176/177:189-196. Belgium.
MacArthur, R.H. and E.O. Wilson. 1967. The theory of island biogeography. Princeton University Press: Princeton, NJ.
McGlathery, K.J., J. Sundback, and I.C. Anderson. 2007. Eutrophication in shallow marine bays and lagoons; the role of plants in the coastal filter. Marine Ecology Progress Series 348:1-18.
Molnar, M., Kocian, M and Batker, D. Nearshore natural capital valuation. 2012. David Suzuki Foundation. p. 12.
Mumford, T.F. Jr. 2007. Kelp and eelgrass in Puget Sound. Prepared in support of the Puget Sound Nearshore Partnership. Washington Department of Natural Resources Aquatic Resources Division. Technical Report 2007-05.
Neckles, H.A. (ed.) 1994. Indicator development. Seagrass monitoring and research in the Gulf of Mexico. U.S.E.P.A.
Orth, R. J., T. J. B. Carruthers, W. C. Dennison, C. M. Duarte, J. W. Fourqurean, K. L.
Heck, A. R. Hughes, G. A. Kendrick, W. J. Kenworthy, S. Olyarnik, F. T. Short, M. 14 Waycott and S. L. Williams. 2006. A global crisis for seagrass ecosystems. BioScience 56:987-996.
32
Orth, R. J, Heck, Jr. K. L, and Monterans J. van. 1984. Faunal communities in sea grass beds: A review of the influence of plant structure and prey characteristics on predator-prey relationships. Estuaries 7:339-350.
Phillips, R.C. 1984. The ecology of eelgrass meadows in the Pacific northwest: A community profile. SCH. Nat. and Mathematical Sciences, Seattle Pacific University. Fish and Wildlife Service, U.S. Dept. of the Interior.
Short, F.T., and Wyllie-Echeverria, S. 1996. Natural and human induced disturbance of seagrasses. Environmental Conservation 23.
Short, F., Carruthers T., Dennison W., Waycott M. 2007. Global seagrass distribution and diversity: A bioregional model CA Department of Natural Resources, University of New Hampshire, Jackson Estuarine Laboratory, Durham, NH 03824, USA
Thom, R., Borde, A.B., Williams, G.D., Southard, J.A., Blanto, S.L. & Woodruff, D.L. 2001. Effects of multiple stressors on eelgrass restoration projects: Proceedings of Puget Sound/Georgia Strait Conference. p.5.
Thom, R., Diefenderfer, M., Vavrinec, J., Borde, A. 2011. Restoring resiliency: Case studies for Pacific Northwest estuarine eelgrass (Zostera marina L.) ecosystems.
Thompson, R.E. 1994. Physical oceanography of the Strait of Georgia-Puget Sound-Juan de Fuca system. Symposium on the Marine Environment, Institute of Ocean Sciences, Sidney, B.C. p.36.
Titus, J.G. and E.M. Strange. (eds.), 2008. Background Documents Supporting Climate Change Science Program Synthesis and Assessment. Product 4.1: Coastal Elevations and Sensitivity to Sea Level Rise, EPA 430R07004. U.S. EPA, Washington, DC.
Van der Slagt, G., Harlow, G., and Verge, M. (Coordinators) 2003. Coastal shore stewardship: A guide for planners, builders and developers on Canada’s pacific coast. The Stewardship Series. Stewardship Centre for BC. www.stewardshipcentre.bc.ca
Waycott, M., C. M. Duarte, T. J. B. Carruthers, R. J. Orth, W. C. Dennison, S. Olyarnik, A. Calladine, J. W. Fourqurean, K. L. Heck, A. R. Hughes, G. A. Kendrick, W. J. Kenworthy, F. T. Short, and S. L. Williams. 2009. Accelerating loss of seagrasses across the globe threatens coastal ecosystems. Proceedings of the National Academy of Science 106:19761- 19764.
Waycott and S. L. Williams. 2006. A global crisis for seagrass ecosystems. BioScience 56:987-996.
Wilson, E.O., and E.O. Willis. 1975. Applied biogeography in M.L. Cody and J.M. Diamond, editors. Ecology and evolution of communities. Harvard University Press, Cambridge, Massachusetts.
Appendix A
Mapping Methodology
2012 - 2013
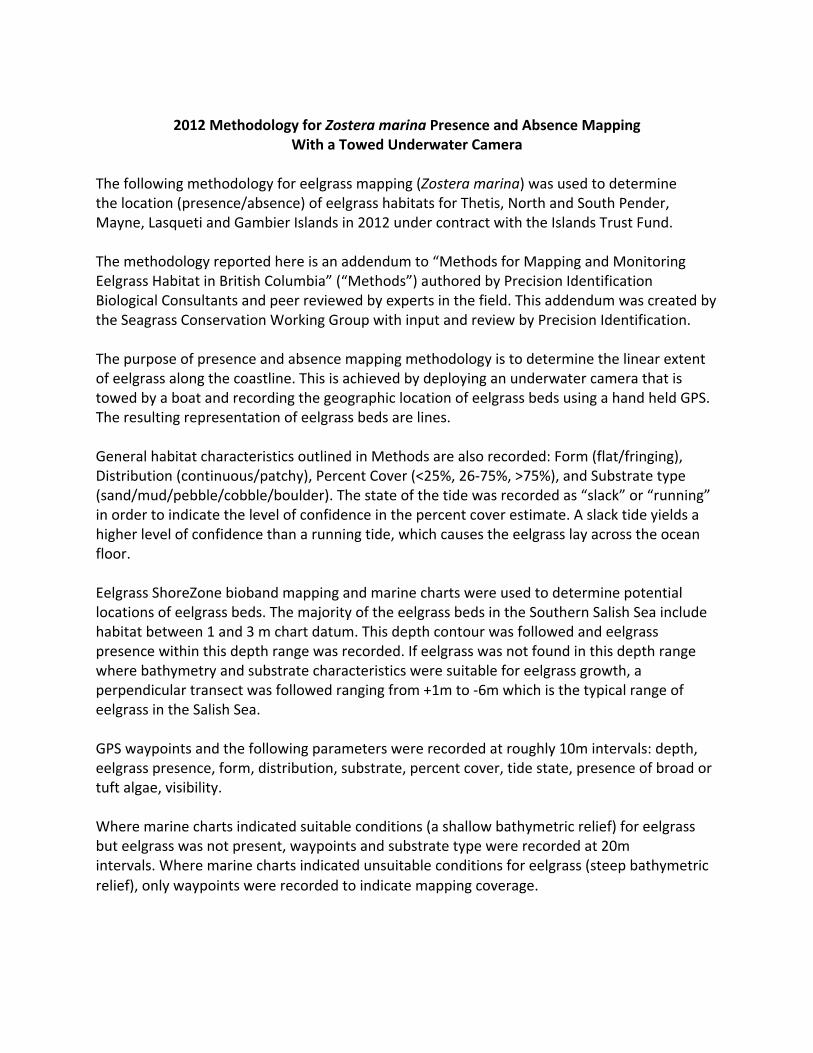
2012 Methodology for Zostera marina Presence and Absence Mapping
With a Towed Underwater Camera The following methodology for eelgrass mapping (Zostera marina) was used to determine the location (presence/absence) of eelgrass habitats for Thetis, North and South Pender, Mayne, Lasqueti and Gambier Islands in 2012 under contract with the Islands Trust Fund. The methodology reported here is an addendum to “Methods for Mapping and Monitoring Eelgrass Habitat in British Columbia” (“Methods”) authored by Precision Identification Biological Consultants and peer reviewed by experts in the field. This addendum was created by the Seagrass Conservation Working Group with input and review by Precision Identification. The purpose of presence and absence mapping methodology is to determine the linear extent of eelgrass along the coastline. This is achieved by deploying an underwater camera that is towed by a boat and recording the geographic location of eelgrass beds using a hand held GPS. The resulting representation of eelgrass beds are lines. General habitat characteristics outlined in Methods are also recorded: Form (flat/fringing), Distribution (continuous/patchy), Percent Cover (<25%, 26-75%, >75%), and Substrate type (sand/mud/pebble/cobble/boulder). The state of the tide was recorded as “slack” or “running” in order to indicate the level of confidence in the percent cover estimate. A slack tide yields a higher level of confidence than a running tide, which causes the eelgrass lay across the ocean floor. Eelgrass ShoreZone bioband mapping and marine charts were used to determine potential locations of eelgrass beds. The majority of the eelgrass beds in the Southern Salish Sea include habitat between 1 and 3 m chart datum. This depth contour was followed and eelgrass presence within this depth range was recorded. If eelgrass was not found in this depth range where bathymetry and substrate characteristics were suitable for eelgrass growth, a perpendicular transect was followed ranging from +1m to -6m which is the typical range of eelgrass in the Salish Sea. GPS waypoints and the following parameters were recorded at roughly 10m intervals: depth, eelgrass presence, form, distribution, substrate, percent cover, tide state, presence of broad or tuft algae, visibility. Where marine charts indicated suitable conditions (a shallow bathymetric relief) for eelgrass but eelgrass was not present, waypoints and substrate type were recorded at 20m intervals. Where marine charts indicated unsuitable conditions for eelgrass (steep bathymetric relief), only waypoints were recorded to indicate mapping coverage.
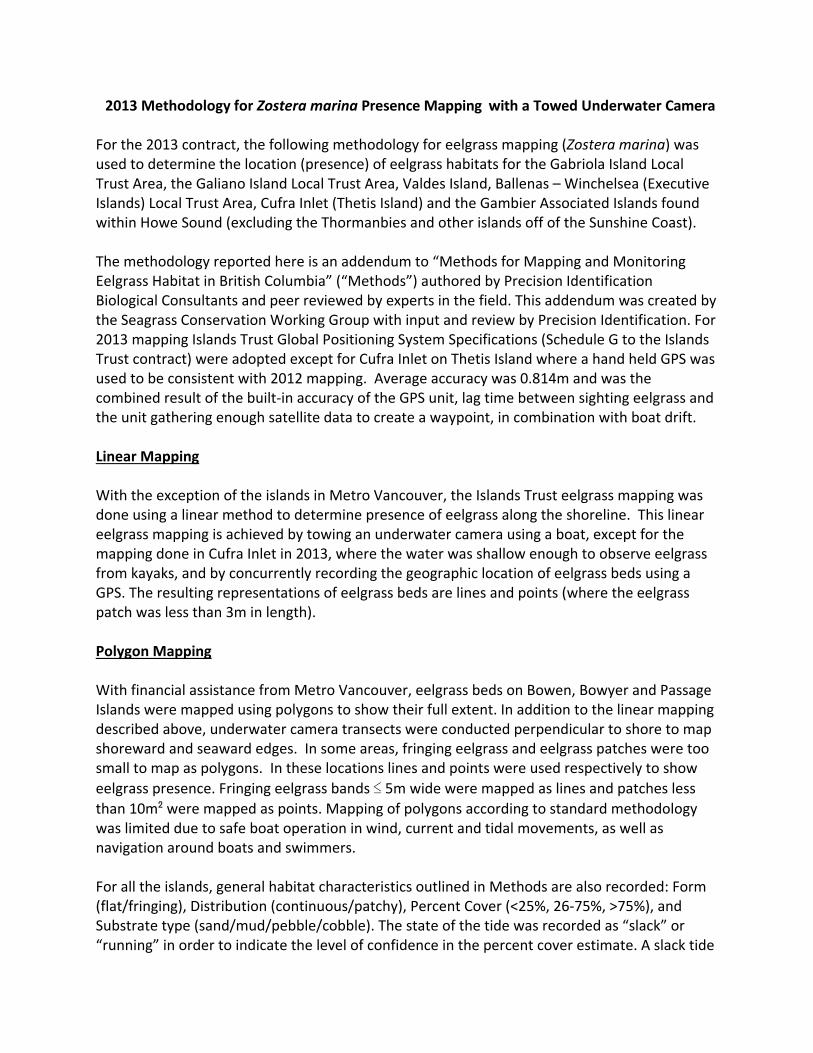
2013 Methodology for Zostera marina Presence Mapping with a Towed Underwater Camera
For the 2013 contract, the following methodology for eelgrass mapping (Zostera marina) was used to determine the location (presence) of eelgrass habitats for the Gabriola Island Local Trust Area, the Galiano Island Local Trust Area, Valdes Island, Ballenas – Winchelsea (Executive Islands) Local Trust Area, Cufra Inlet (Thetis Island) and the Gambier Associated Islands found within Howe Sound (excluding the Thormanbies and other islands off of the Sunshine Coast). The methodology reported here is an addendum to “Methods for Mapping and Monitoring Eelgrass Habitat in British Columbia” (“Methods”) authored by Precision Identification Biological Consultants and peer reviewed by experts in the field. This addendum was created by the Seagrass Conservation Working Group with input and review by Precision Identification. For 2013 mapping Islands Trust Global Positioning System Specifications (Schedule G to the Islands Trust contract) were adopted except for Cufra Inlet on Thetis Island where a hand held GPS was used to be consistent with 2012 mapping. Average accuracy was 0.814m and was the combined result of the built-in accuracy of the GPS unit, lag time between sighting eelgrass and the unit gathering enough satellite data to create a waypoint, in combination with boat drift. Linear Mapping With the exception of the islands in Metro Vancouver, the Islands Trust eelgrass mapping was done using a linear method to determine presence of eelgrass along the shoreline. This linear eelgrass mapping is achieved by towing an underwater camera using a boat, except for the mapping done in Cufra Inlet in 2013, where the water was shallow enough to observe eelgrass from kayaks, and by concurrently recording the geographic location of eelgrass beds using a GPS. The resulting representations of eelgrass beds are lines and points (where the eelgrass patch was less than 3m in length). Polygon Mapping With financial assistance from Metro Vancouver, eelgrass beds on Bowen, Bowyer and Passage Islands were mapped using polygons to show their full extent. In addition to the linear mapping described above, underwater camera transects were conducted perpendicular to shore to map shoreward and seaward edges. In some areas, fringing eelgrass and eelgrass patches were too small to map as polygons. In these locations lines and points were used respectively to show eelgrass presence. Fringing eelgrass bands ≤ 5m wide were mapped as lines and patches less than 10m² were mapped as points. Mapping of polygons according to standard methodology was limited due to safe boat operation in wind, current and tidal movements, as well as navigation around boats and swimmers. For all the islands, general habitat characteristics outlined in Methods are also recorded: Form (flat/fringing), Distribution (continuous/patchy), Percent Cover (<25%, 26-75%, >75%), and Substrate type (sand/mud/pebble/cobble). The state of the tide was recorded as “slack” or “running” in order to indicate the level of confidence in the percent cover estimate. A slack tide
yields a higher level of confidence than a running tide, which causes the eelgrass to lie across the ocean floor.
ShoreZone eelgrass bioband mapping and marine charts were used to determine potential locations of eelgrass beds. The majority of the eelgrass beds in the Southern Salish Sea are found between 1 and 3m chart datum. This depth contour was followed and eelgrass presence within this depth range was recorded. If eelgrass was not found in this depth range where bathymetry and substrate characteristics were suitable for eelgrass growth, a perpendicular transect was followed ranging from +1m to -6m which is the typical range of eelgrass in the Salish Sea. GPS waypoints and the following parameters were recorded at roughly 10m intervals with intervals no longer than 20m: depth, eelgrass presence, form, distribution, substrate, percent cover, tide state, presence of broad or tuft algae, visibility. The following section was removed from the methodology for 2013: Where marine charts indicated suitable conditions (a shallow bathymetric relief) for eelgrass but eelgrass was not present, waypoints and substrate type were recorded at 20 metre intervals. Where marine charts indicated unsuitable conditions for eelgrass (steep bathymetric relief), only waypoints were recorded to indicate mapping coverage.
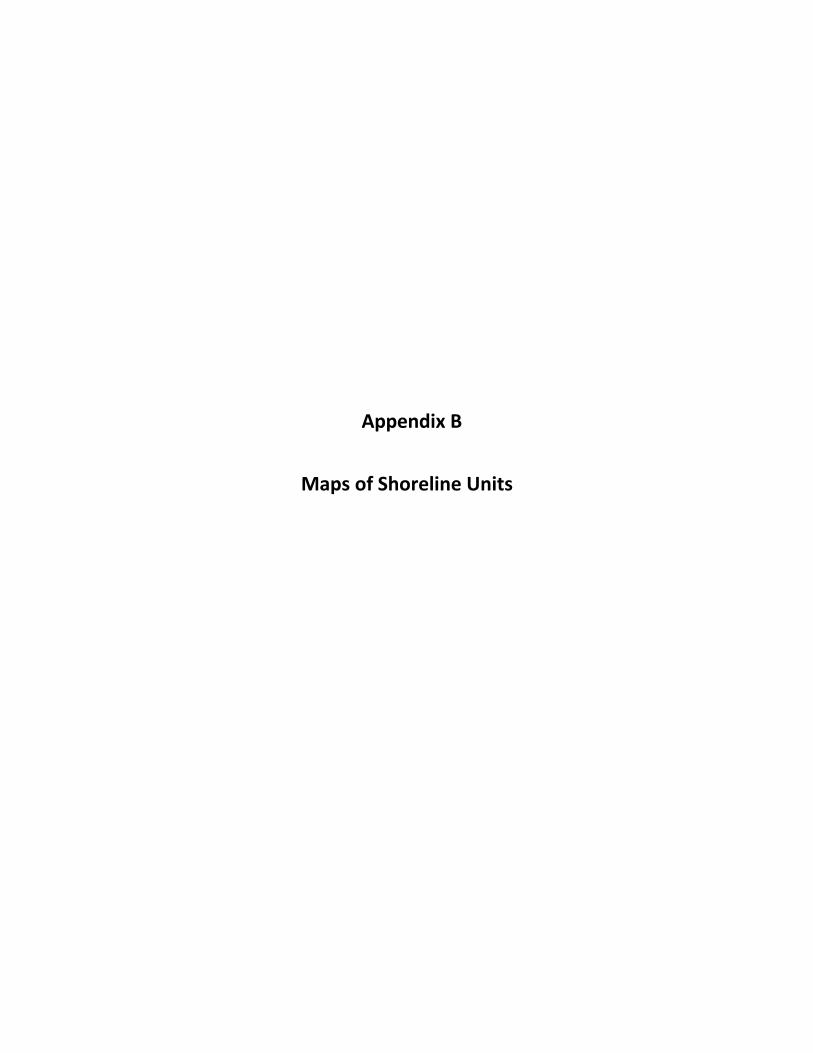
Appendix B
Maps of Shoreline Units
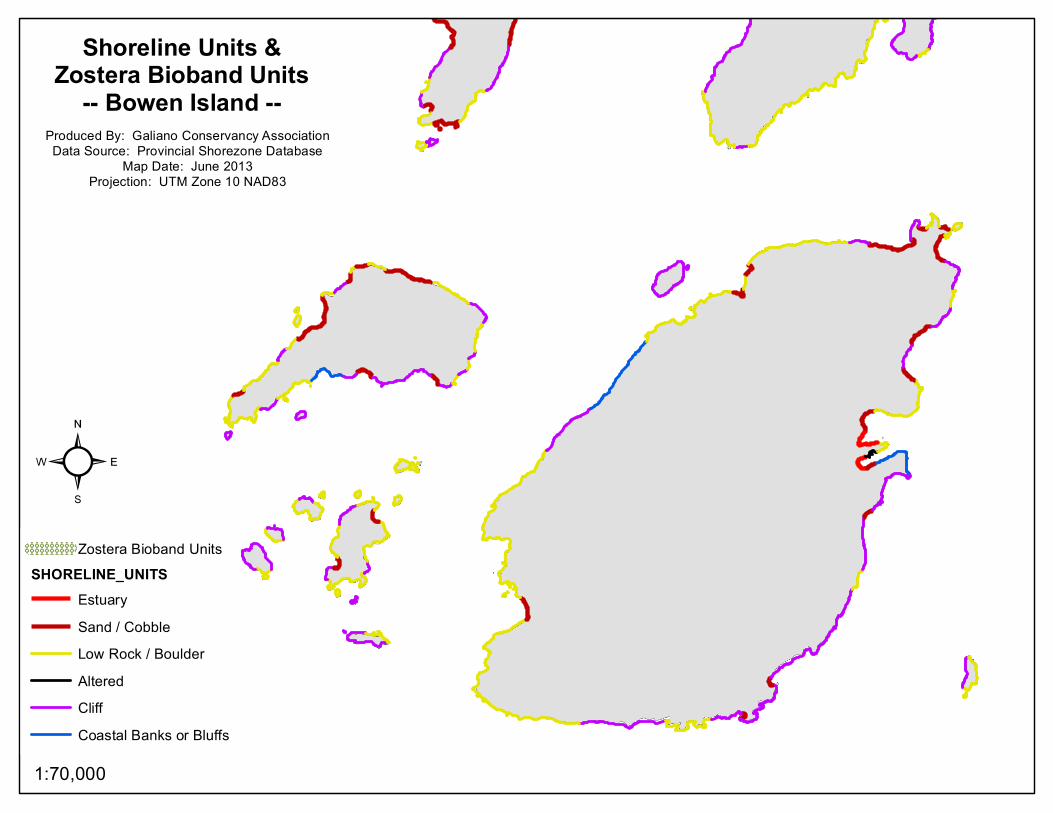
1:70,000
Zostera Bioband UnitsSHORELINE_UNITS
EstuarySand / CobbleLow Rock / BoulderAlteredCliffCoastal Banks or Bluffs
²
Shoreline Units &Zostera Bioband Units
-- Bowen Island --Produced By: Galiano Conservancy AssociationData Source: Provincial Shorezone Database
Map Date: June 2013Projection: UTM Zone 10 NAD83
1:70,000
Zostera Bioband UnitsSHORELINE_UNITS
EstuarySand / CobbleLow Rock / BoulderAlteredCliffCoastal Banks or Bluffs
²
Shoreline Units &Zostera Bioband Units
-- Denman Island --Produced By: Galiano Conservancy AssociationData Source: Provincial Shorezone Database
Map Date: June 2013Projection: UTM Zone 10 NAD83
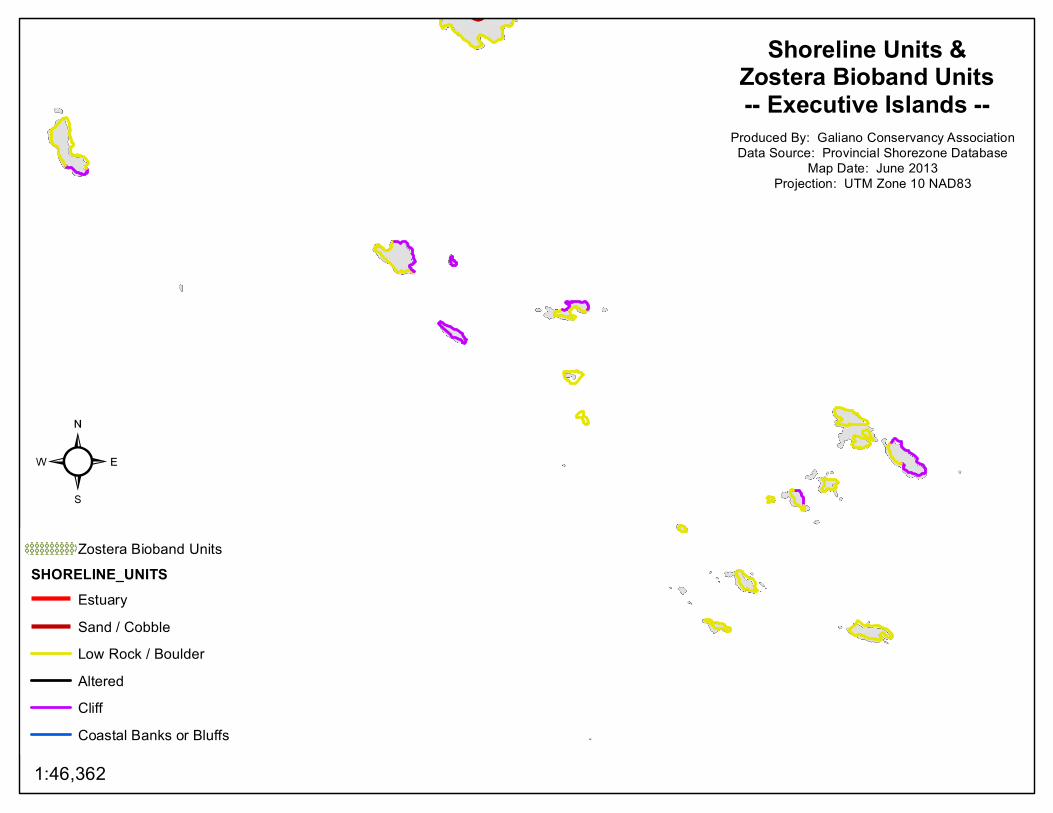
1:46,362
Zostera Bioband UnitsSHORELINE_UNITS
EstuarySand / CobbleLow Rock / BoulderAlteredCliffCoastal Banks or Bluffs
²
Shoreline Units &Zostera Bioband Units-- Executive Islands --
Produced By: Galiano Conservancy AssociationData Source: Provincial Shorezone Database
Map Date: June 2013Projection: UTM Zone 10 NAD83
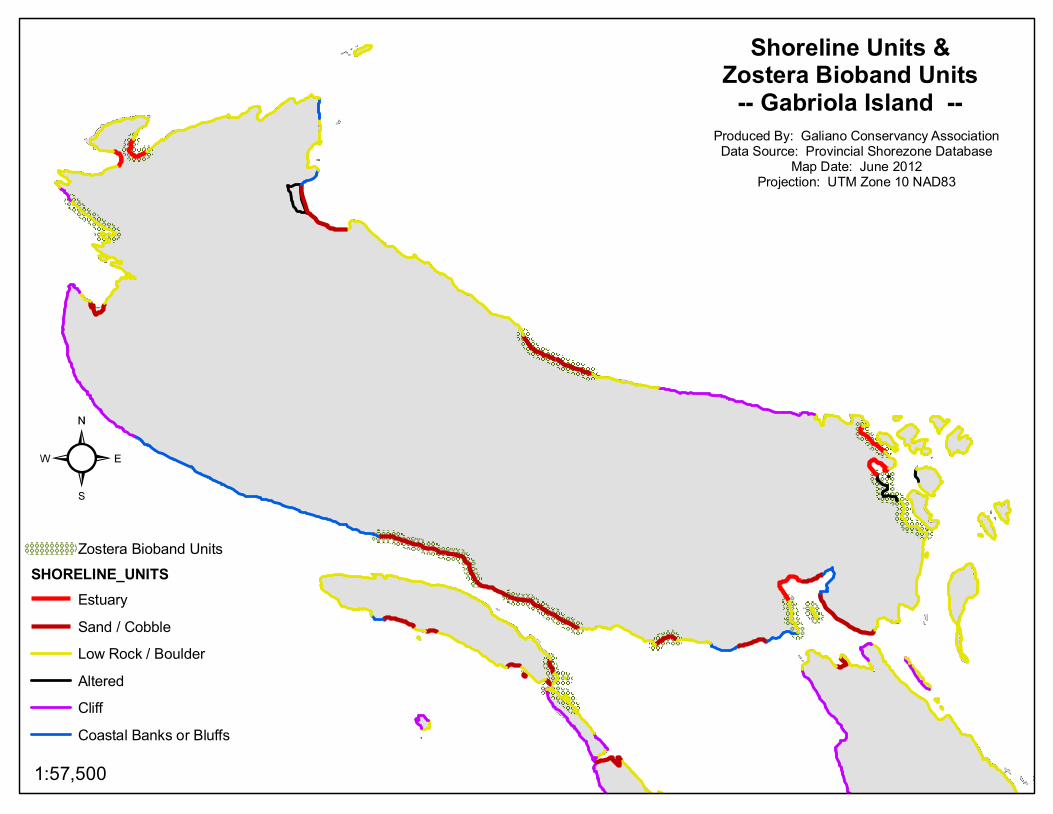
1:57,500
Zostera Bioband UnitsSHORELINE_UNITS
EstuarySand / CobbleLow Rock / BoulderAlteredCliffCoastal Banks or Bluffs
²
Shoreline Units &Zostera Bioband Units
-- Gabriola Island --Produced By: Galiano Conservancy AssociationData Source: Provincial Shorezone Database
Map Date: June 2012Projection: UTM Zone 10 NAD83
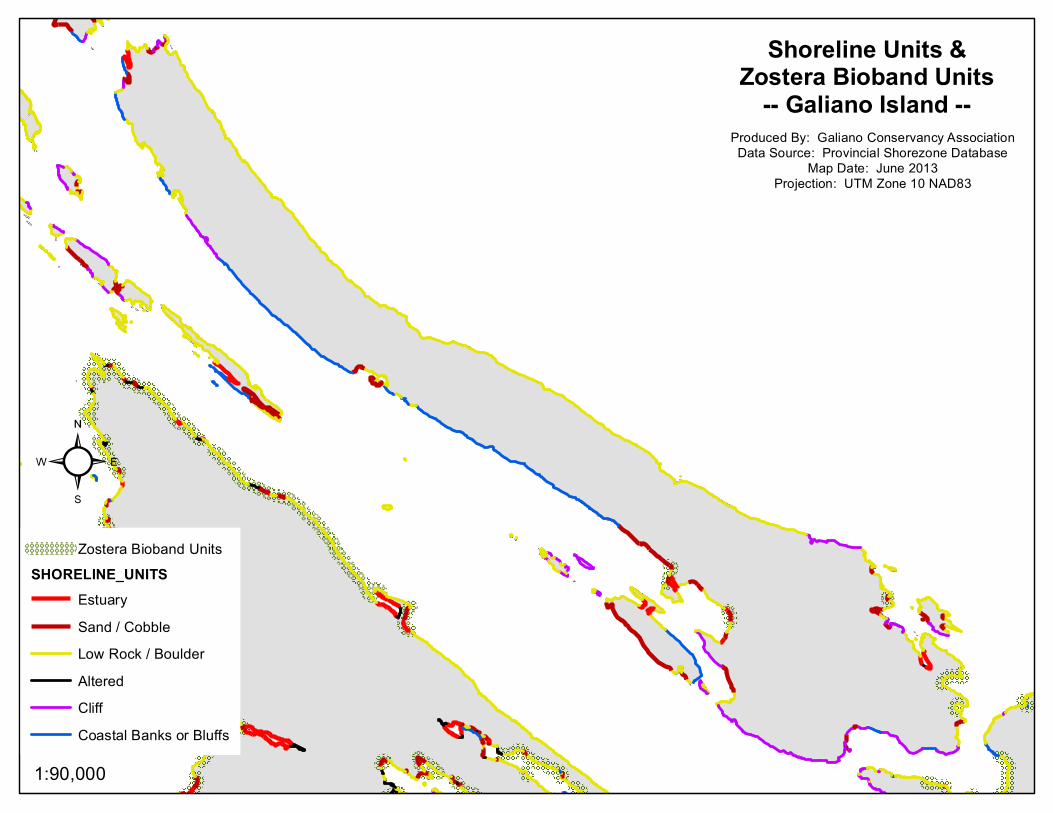
1:90,000
Zostera Bioband UnitsSHORELINE_UNITS
EstuarySand / CobbleLow Rock / BoulderAlteredCliffCoastal Banks or Bluffs
²
Shoreline Units &Zostera Bioband Units
-- Galiano Island --Produced By: Galiano Conservancy AssociationData Source: Provincial Shorezone Database
Map Date: June 2013Projection: UTM Zone 10 NAD83
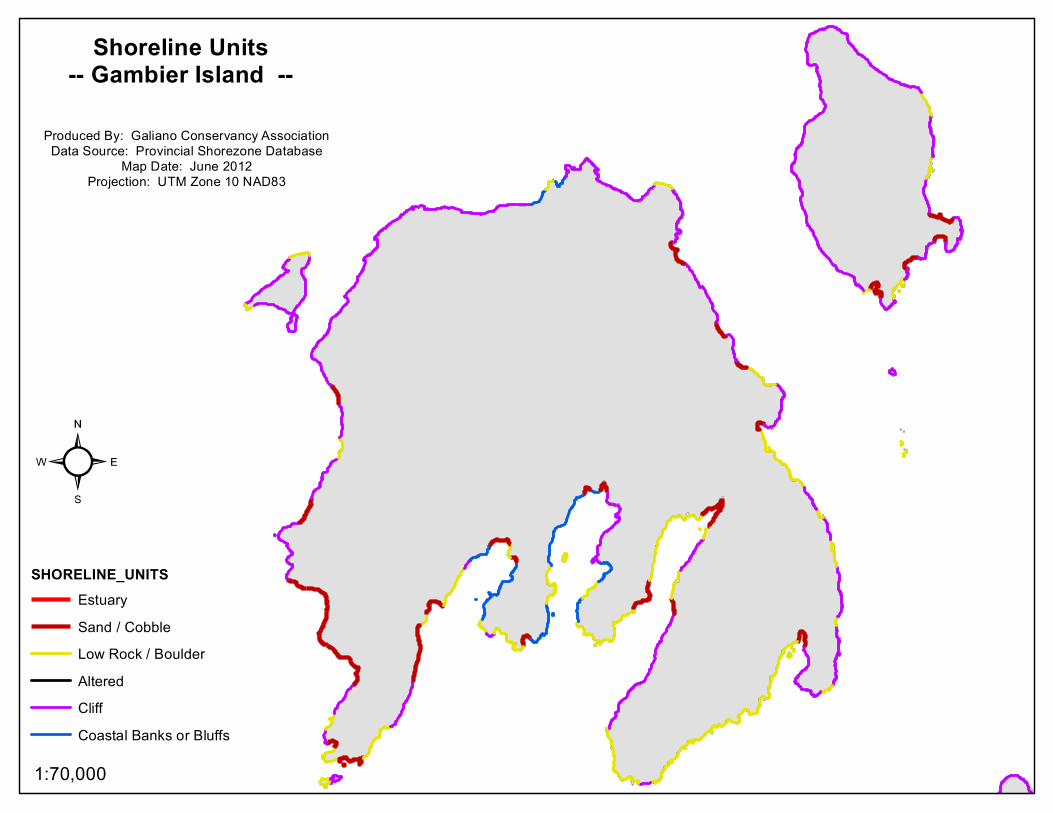
1:70,000
SHORELINE_UNITSEstuarySand / CobbleLow Rock / BoulderAlteredCliffCoastal Banks or Bluffs
²
Shoreline Units-- Gambier Island --
Produced By: Galiano Conservancy AssociationData Source: Provincial Shorezone Database
Map Date: June 2012Projection: UTM Zone 10 NAD83
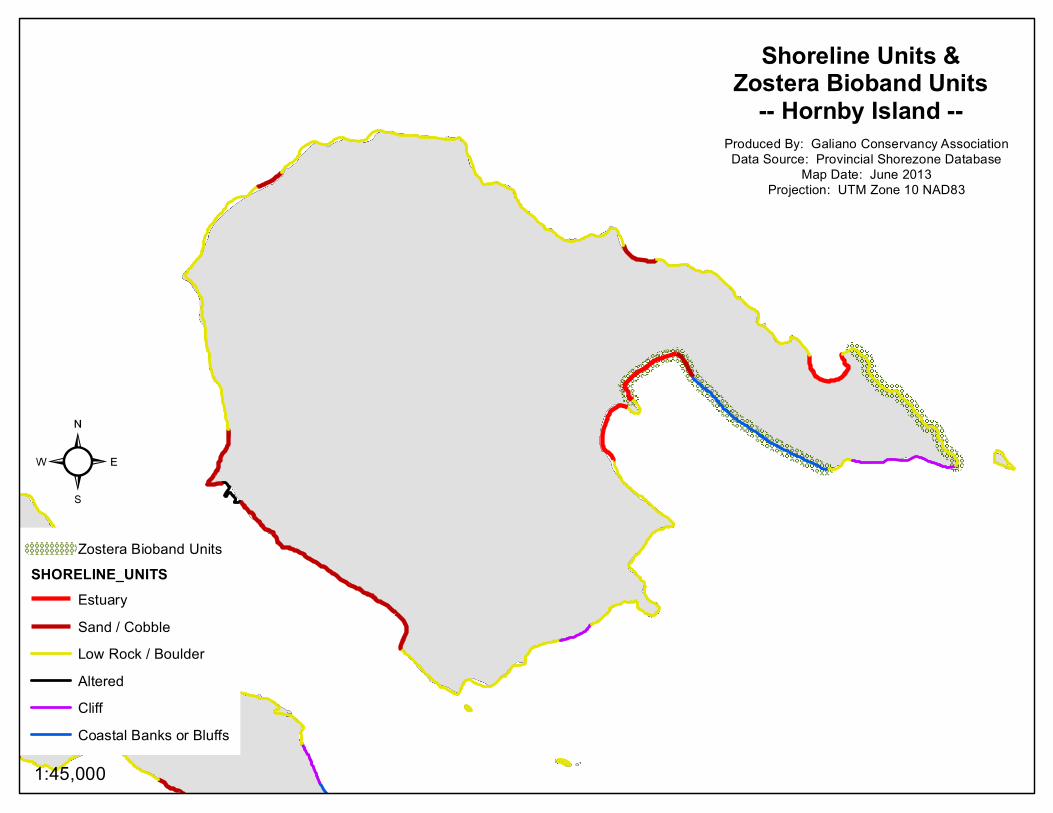
1:45,000
Zostera Bioband UnitsSHORELINE_UNITS
EstuarySand / CobbleLow Rock / BoulderAlteredCliffCoastal Banks or Bluffs
²
Shoreline Units &Zostera Bioband Units
-- Hornby Island --Produced By: Galiano Conservancy AssociationData Source: Provincial Shorezone Database
Map Date: June 2013Projection: UTM Zone 10 NAD83
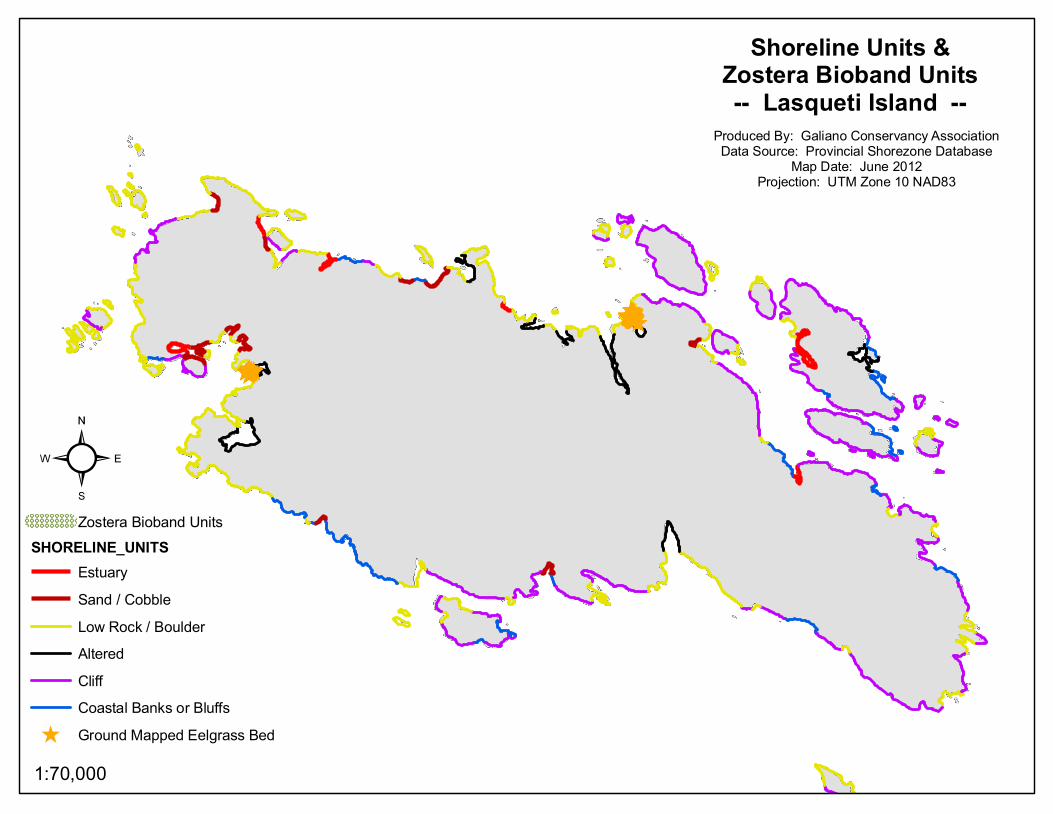
^̂̂̂̂̂̂̂̂̂̂̂̂̂̂̂̂̂̂̂̂̂̂̂̂̂̂̂̂̂̂̂̂̂̂̂̂̂̂̂̂̂̂̂̂̂̂̂̂̂̂̂̂̂̂̂̂̂̂̂̂̂̂̂̂̂̂̂̂̂̂̂̂
^̂̂̂̂̂̂̂̂̂̂̂̂̂̂̂
^̂̂̂̂̂̂̂̂̂̂̂̂̂̂̂̂̂̂̂̂̂̂̂̂̂̂̂̂̂̂̂̂̂̂̂̂
^̂̂̂̂̂̂̂̂̂̂̂̂̂̂̂
1:70,000
Zostera Bioband UnitsSHORELINE_UNITS
EstuarySand / CobbleLow Rock / BoulderAlteredCliffCoastal Banks or Bluffs
^ Ground Mapped Eelgrass Bed
²
Shoreline Units &Zostera Bioband Units-- Lasqueti Island --
Produced By: Galiano Conservancy AssociationData Source: Provincial Shorezone Database
Map Date: June 2012Projection: UTM Zone 10 NAD83
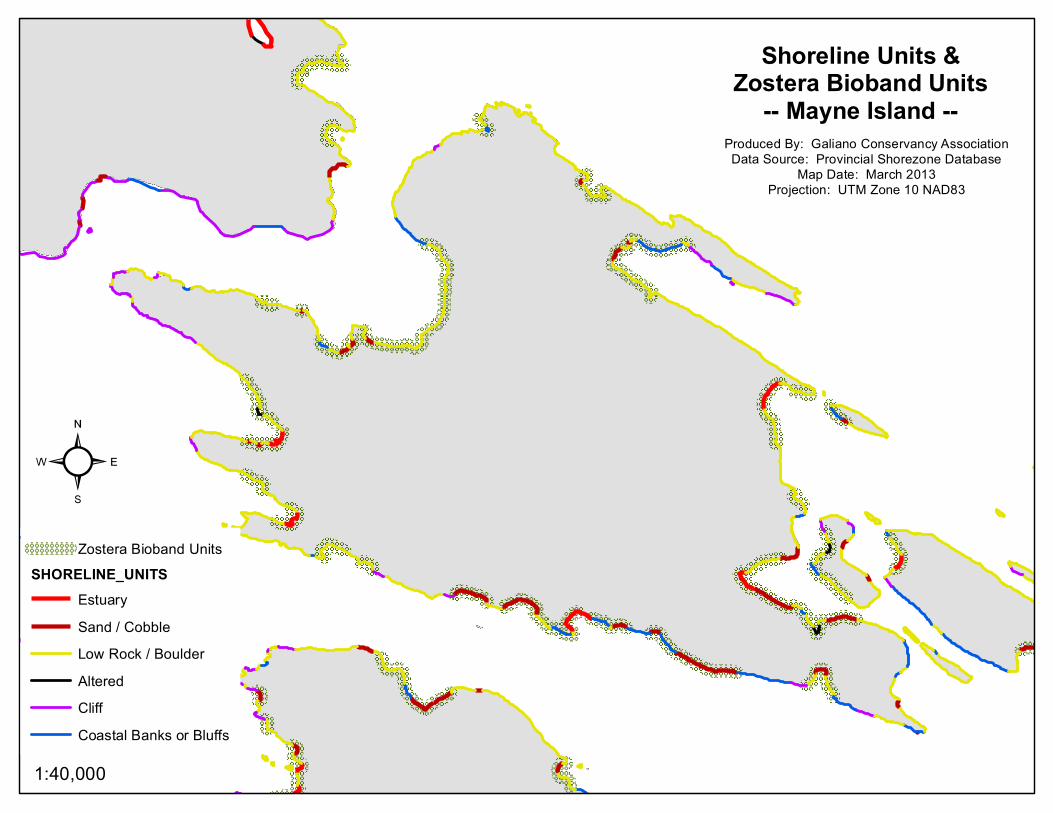
1:40,000
Zostera Bioband UnitsSHORELINE_UNITS
EstuarySand / CobbleLow Rock / BoulderAlteredCliffCoastal Banks or Bluffs
²
Shoreline Units &Zostera Bioband Units
-- Mayne Island --Produced By: Galiano Conservancy AssociationData Source: Provincial Shorezone Database
Map Date: March 2013Projection: UTM Zone 10 NAD83
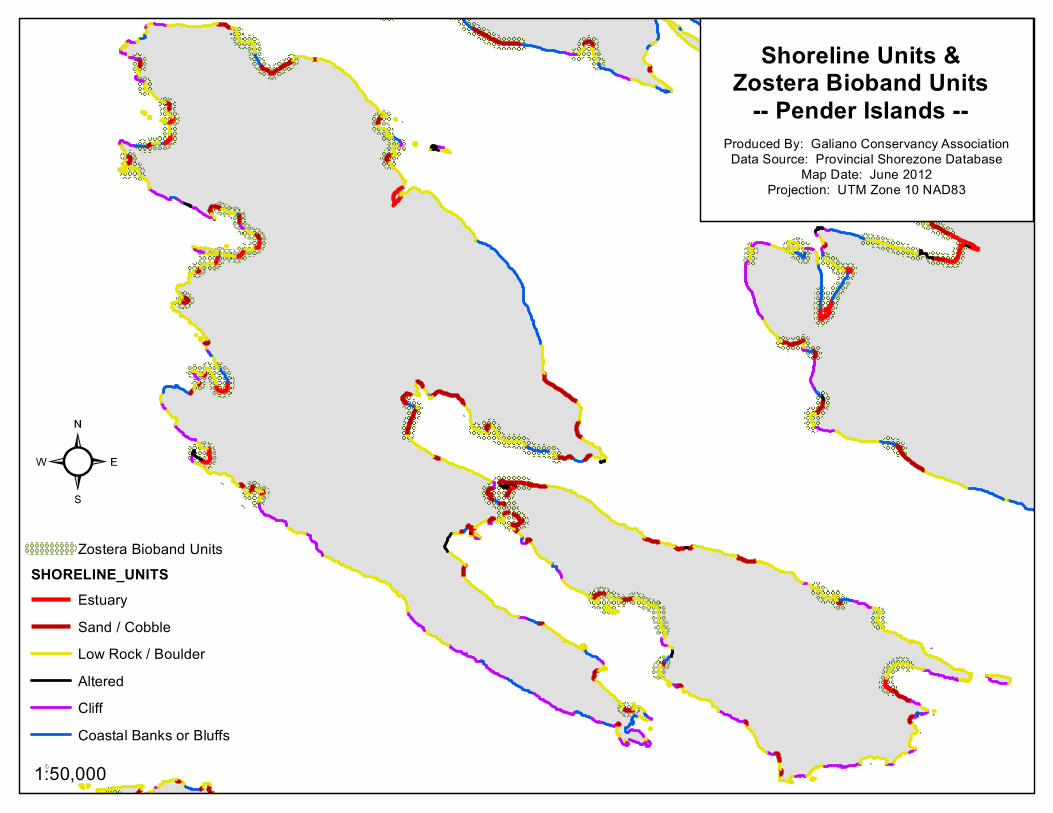
1:50,000
Zostera Bioband UnitsSHORELINE_UNITS
EstuarySand / CobbleLow Rock / BoulderAlteredCliffCoastal Banks or Bluffs
²
Shoreline Units &Zostera Bioband Units
-- Pender Islands --Produced By: Galiano Conservancy AssociationData Source: Provincial Shorezone Database
Map Date: June 2012Projection: UTM Zone 10 NAD83
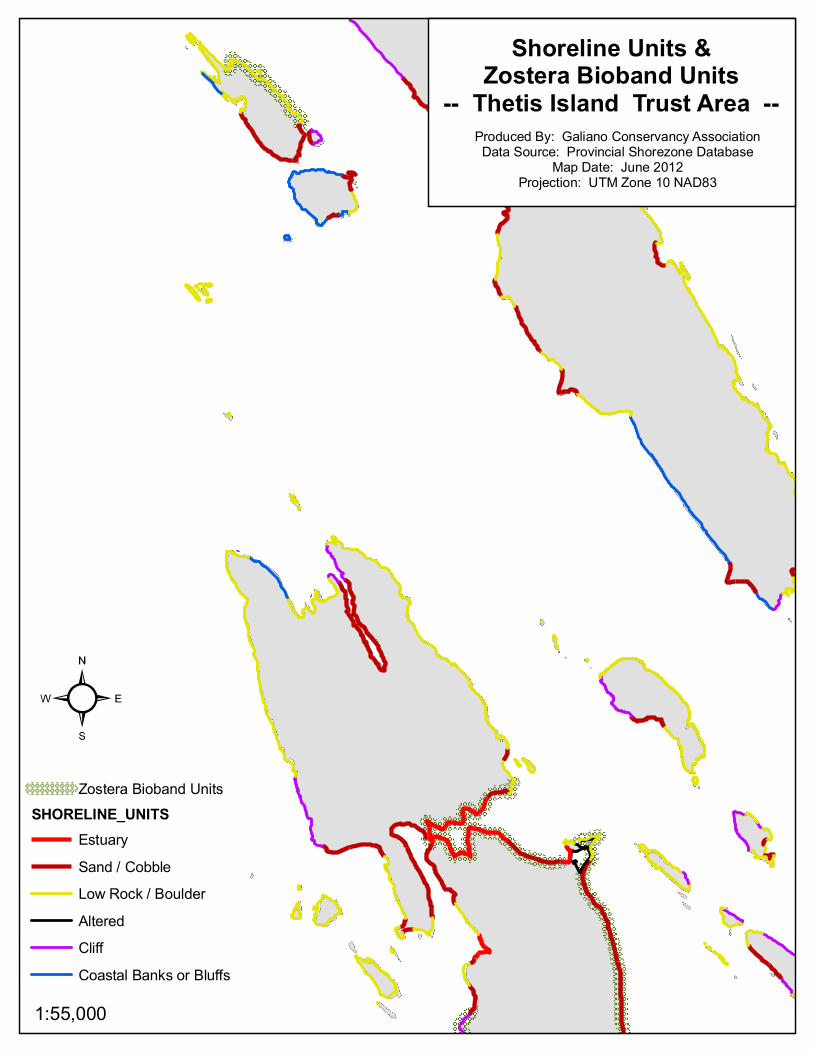
1:55,000
Zostera Bioband UnitsSHORELINE_UNITS
EstuarySand / CobbleLow Rock / BoulderAlteredCliffCoastal Banks or Bluffs
²
Shoreline Units &Zostera Bioband Units
-- Thetis Island Trust Area --Produced By: Galiano Conservancy AssociationData Source: Provincial Shorezone Database
Map Date: June 2012Projection: UTM Zone 10 NAD83
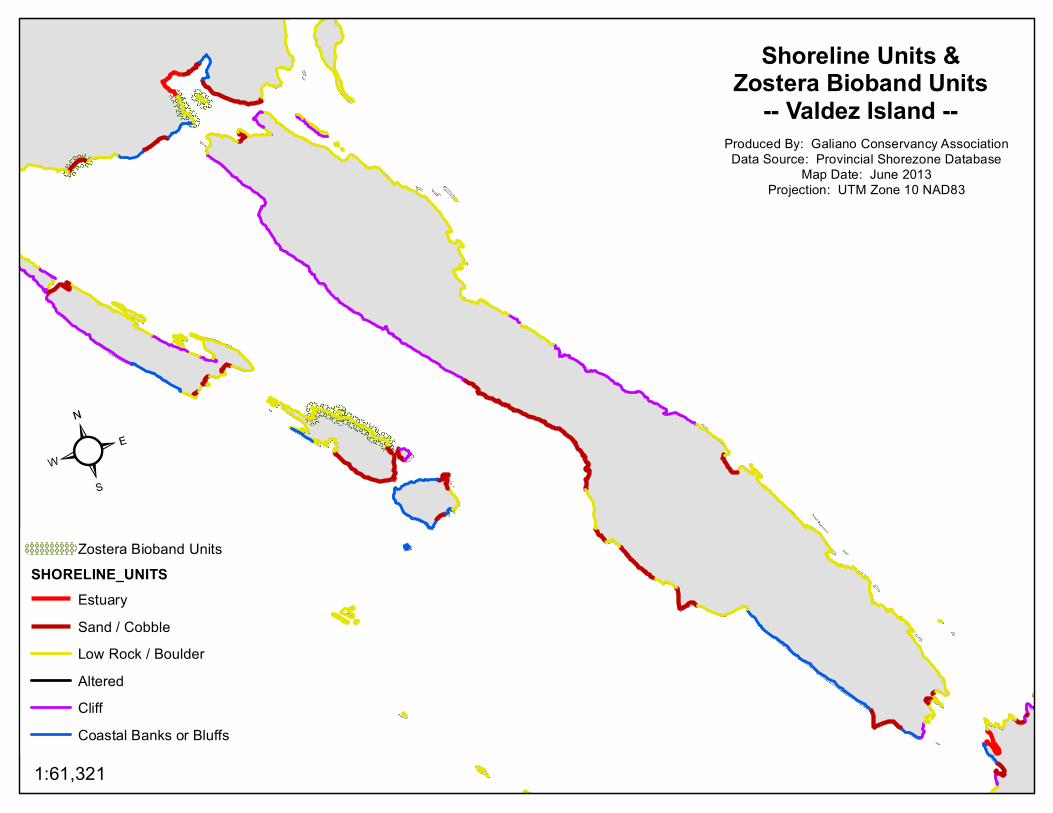
1:61,321
Zostera Bioband UnitsSHORELINE_UNITS
EstuarySand / CobbleLow Rock / BoulderAlteredCliffCoastal Banks or Bluffs
²
Shoreline Units &Zostera Bioband Units
-- Valdez Island --Produced By: Galiano Conservancy AssociationData Source: Provincial Shorezone Database
Map Date: June 2013Projection: UTM Zone 10 NAD83
Appendix C
Summary of Overwater Structures
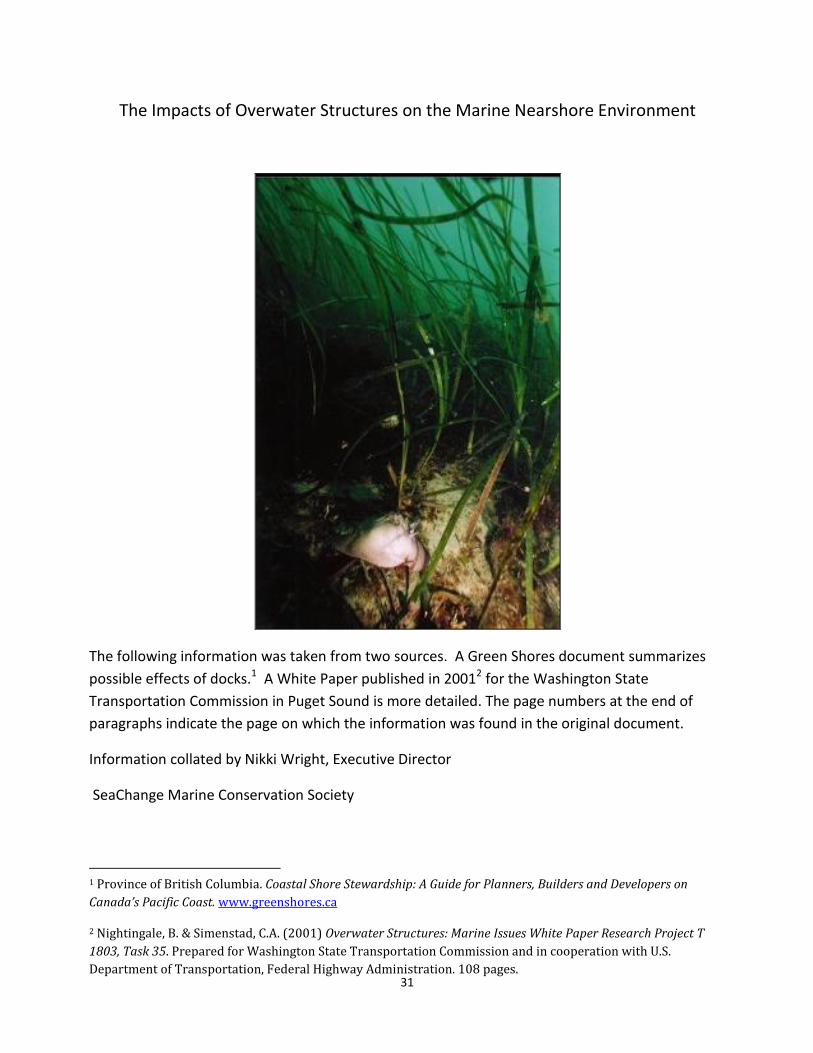
31
The Impacts of Overwater Structures on the Marine Nearshore Environment
The following information was taken from two sources. A Green Shores document summarizes
possible effects of docks.1 A White Paper published in 20012 for the Washington State
Transportation Commission in Puget Sound is more detailed. The page numbers at the end of
paragraphs indicate the page on which the information was found in the original document.
Information collated by Nikki Wright, Executive Director
SeaChange Marine Conservation Society
1 Province of British Columbia. Coastal Shore Stewardship: A Guide for Planners, Builders and Developers on
Canada’s Pacific Coast. www.greenshores.ca
2 Nightingale, B. & Simenstad, C.A. (2001) Overwater Structures: Marine Issues White Paper Research Project T
1803, Task 35. Prepared for Washington State Transportation Commission and in cooperation with U.S.
Department of Transportation, Federal Highway Administration. 108 pages.
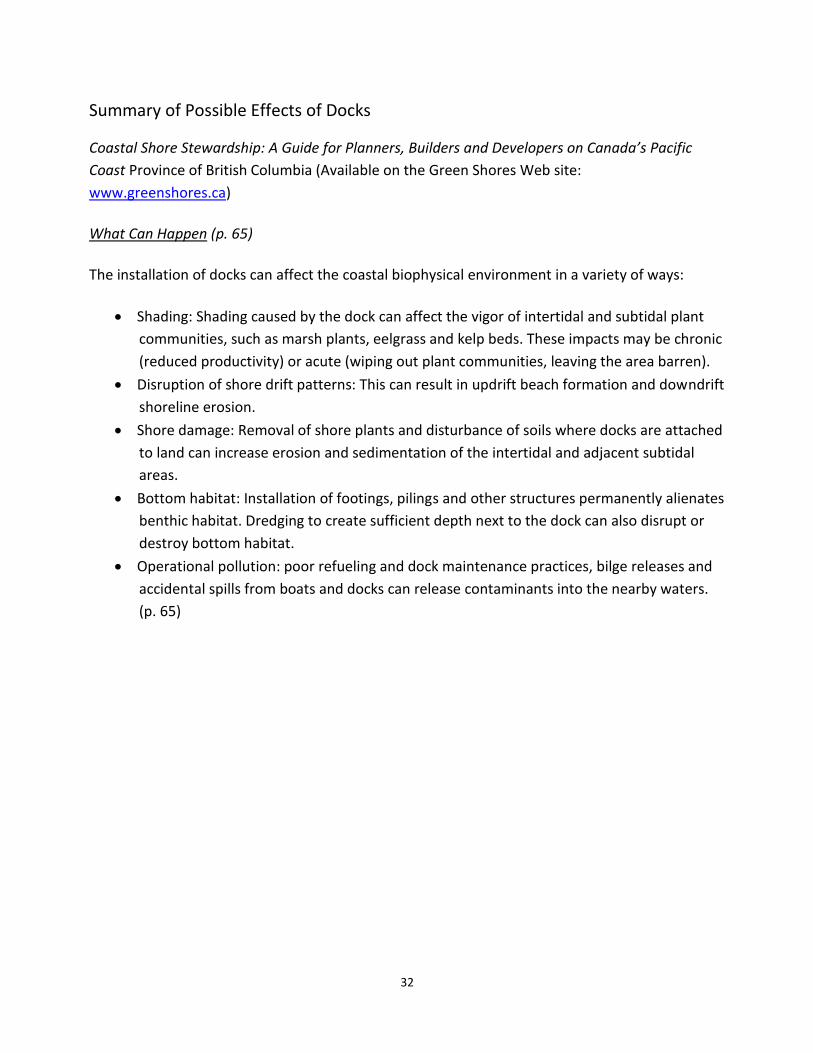
32
Summary of Possible Effects of Docks
Coastal Shore Stewardship: A Guide for Planners, Builders and Developers on Canada’s Pacific
Coast Province of British Columbia (Available on the Green Shores Web site:
www.greenshores.ca)
What Can Happen (p. 65)
The installation of docks can affect the coastal biophysical environment in a variety of ways:
Shading: Shading caused by the dock can affect the vigor of intertidal and subtidal plant
communities, such as marsh plants, eelgrass and kelp beds. These impacts may be chronic
(reduced productivity) or acute (wiping out plant communities, leaving the area barren).
Disruption of shore drift patterns: This can result in updrift beach formation and downdrift
shoreline erosion.
Shore damage: Removal of shore plants and disturbance of soils where docks are attached
to land can increase erosion and sedimentation of the intertidal and adjacent subtidal
areas.
Bottom habitat: Installation of footings, pilings and other structures permanently alienates
benthic habitat. Dredging to create sufficient depth next to the dock can also disrupt or
destroy bottom habitat.
Operational pollution: poor refueling and dock maintenance practices, bilge releases and
accidental spills from boats and docks can release contaminants into the nearby waters.
(p. 65)
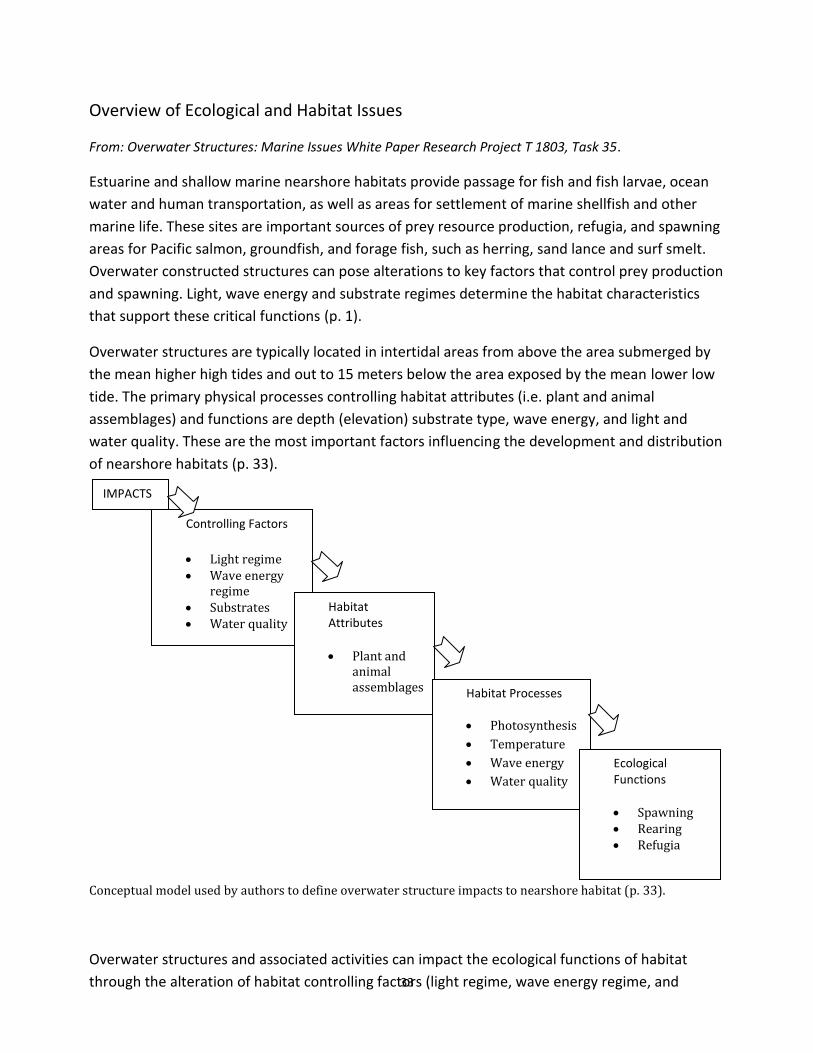
33
Overview of Ecological and Habitat Issues
From: Overwater Structures: Marine Issues White Paper Research Project T 1803, Task 35.
Estuarine and shallow marine nearshore habitats provide passage for fish and fish larvae, ocean
water and human transportation, as well as areas for settlement of marine shellfish and other
marine life. These sites are important sources of prey resource production, refugia, and spawning
areas for Pacific salmon, groundfish, and forage fish, such as herring, sand lance and surf smelt.
Overwater constructed structures can pose alterations to key factors that control prey production
and spawning. Light, wave energy and substrate regimes determine the habitat characteristics
that support these critical functions (p. 1).
Overwater structures are typically located in intertidal areas from above the area submerged by
the mean higher high tides and out to 15 meters below the area exposed by the mean lower low
tide. The primary physical processes controlling habitat attributes (i.e. plant and animal
assemblages) and functions are depth (elevation) substrate type, wave energy, and light and
water quality. These are the most important factors influencing the development and distribution
of nearshore habitats (p. 33).
Conceptual model used by authors to define overwater structure impacts to nearshore habitat (p. 33).
Overwater structures and associated activities can impact the ecological functions of habitat
through the alteration of habitat controlling factors (light regime, wave energy regime, and
IMPACTS
Controlling Factors
Light regime Wave energy
regime Substrates Water quality
Habitat Attributes
Plant and animal assemblages Habitat Processes
Photosynthesis
Temperature
Wave energy
Water quality
Ecological Functions
Spawning Rearing Refugia
34
substrate and water quality). These alterations can, in turn, interfere with habitat processes
supporting the key ecological functions of spawning, rearing and refugia. Whether any of these
impacts occur and to what degree they occur at any one site depend upon the nature of site-
specific habitat controlling factors and the type, characteristic, and use patterns of a given
overwater structure located at a specific site (p. 34).
In addition to impacts associated with overwater constructed structures, activities associated
with docks can also pose risks to the quality and quantity of habitat through prop scour,
groundings, contaminant introduction to the marine environment and structural interferences
with shallow nearshore habitats with the placement of ramps and haul-outs in nearshore areas.
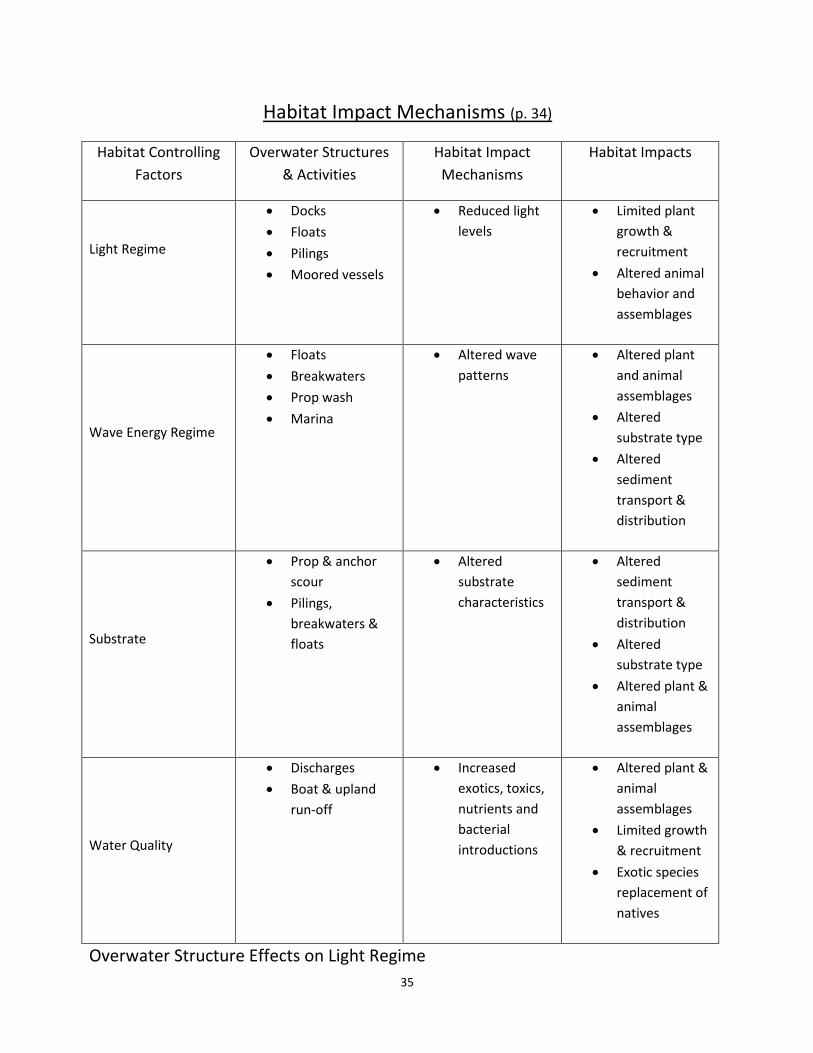
35
Habitat Impact Mechanisms (p. 34)
Habitat Controlling
Factors
Overwater Structures
& Activities
Habitat Impact
Mechanisms
Habitat Impacts
Light Regime
Docks
Floats
Pilings
Moored vessels
Reduced light
levels
Limited plant
growth &
recruitment
Altered animal
behavior and
assemblages
Wave Energy Regime
Floats
Breakwaters
Prop wash
Marina
Altered wave
patterns
Altered plant
and animal
assemblages
Altered
substrate type
Altered
sediment
transport &
distribution
Substrate
Prop & anchor
scour
Pilings,
breakwaters &
floats
Altered
substrate
characteristics
Altered
sediment
transport &
distribution
Altered
substrate type
Altered plant &
animal
assemblages
Water Quality
Discharges
Boat & upland
run-off
Increased
exotics, toxics,
nutrients and
bacterial
introductions
Altered plant &
animal
assemblages
Limited growth
& recruitment
Exotic species
replacement of
natives
Overwater Structure Effects on Light Regime
36
Effects on Underwater Vegetation
Without proper precautions, docks, piers, and pilings can cast shade upon the underwater water
environment thereby limiting light availability for plant photosynthesis. Distributions of
invertebrates, fishes, and plants have been found to be severely limited in under-dock
environments when compared to adjacent vegetated habitat in the Pacific Northwest not shaded
by overwater structures (p. 38).
Each dock defines a shade footprint specific to its structural specifications. Dock height, width,
construction materials, and the dock’s orientation to the arc of the sun are primary factors in
determining the shade footprint that a given dock casts over the submerged substrates.
Researchers found underwater light availability and eelgrass bed quality under docks to be
primarily dependent upon dock height, followed in importance by dock width and dock
orientation to the arc of the sun. Light is the most important variable affecting canopy structure
(i.e. shoot density and height) and eelgrass bed quality. To the degree that a shade footprint limits
plant photosynthesis, it decreases the extent and quality of habitat that support a wide variety of
fish and shellfish populations. Construction of even partially shading types of structures, floating
or on pilings, could be expected to largely eliminate existing eelgrass and other macroflora with
little chance for replacement plant growth (p. 39).
Effects on Fish
Overwater structures can create sharp underwater light contrasts by casting shade in ambient
daylight conditions. They can also produce sharp underwater light contrasts by casting artificial
light in ambient nighttime conditions. Changes to ambient underwater light environments pose a
risk of altering fish migration behavior and increasing mortality risks. Findings have demonstrated
that fish responses to piers are ambiguous with some individuals passing under the dock, some
pausing and going around the dock, schools breaking up upon encountering docks, and some
pausing and eventually going under the dock (p. 43).
Light is considered to be the primary factor limiting the survival and distribution of eelgrass. Given
the strong association of important fish prey resources with eelgrass, limitations in the extent of
eelgrass pose a potential risk of reduced prey resources. Prey resource limitations likely impact
migration patterns and the survival of many juvenile fish species. For smaller fish less than 50 mm
in length, residence times along particular shorelines are thought to be a function of prey
abundance. Research in the Hood Canal demonstrated that outmigrating juvenile chum fry (30-45
mm) feed extensively upon small, densely distributed harpacticoid copepods selecting for the
largest copepods available. As the fish grew in size, their diet content became composed more of
larger epibenthos and pelagic crustaceans. Consistent with other studies, the highest densities of
harpacticoid copepods occurred in magnitudes 4-5 times higher in eelgrass stands than in sand
37
habitat without eelgrass. Similarly, the largest abundance of first post-larval stage crabs of 0+ age
are found in eelgrass beds (p. 45).
Impacts on Wave Energy
Wave energy and water transport alterations imposed by docks, bulkheads, breakwaters, ramps
and associated activities alter the size, distribution, and abundance of substrate and detrital
materials required to maintain the nearshore detrital-based food web. Alteration of sediment
transport patterns can present potential barriers to the natural processes that build spits and
beaches and provide substrates required for plant propagation, fish and shellfish settlement and
rearing, and forage fish spawning. Although the specific characteristics of the factors at play vary
with the geology of each region or subsystem, changing the type and distribution of sediment will
likely alter key plant and animal assemblages. Wave and current interactions in shallow water (i.e.
depths <1.0m) are particularly important to intertidal flora and fauna (p. 48).
Dock pilings have also been found to alter adjacent substrates with increased shell hash
deposition from piling communities and changes to substrate bathymetry. Similarly, dock uses
and construction activities are known to limit underwater light and redistribute sediments
through prop scouring, vessel shading, and pile driving. These changes in substrate type can
change the nature of the flora and fauna native to a given site. In the case of pilings, native
dominant communities typically associated with sand, gravel, mud, sand, and seagrass substrates
are replaced by those communities associated with shell hash substrates (p. 49).
Cumulative Effects
Given the apparent increasing demand for overwater structures, structural design to allow
maximum light transmission and to mitigate energy and substrate changes is required to protect
the ecosystems marine fishes rely upon. Given what is known concerning overwater structure
impacts in marine and estuarine ecosystems, we conclude that multiple placements of overwater
structures in marine waters can pose substantive risks of significant changes to the immediate
and surrounding marine and estuarine ecosystems. These risks require the assessment of existing
cumulative light limitation effects and wave energy and substrate effects to the shoreline
environment. These risks require assessment at the drift cell before considering the addition of
new structures (p. 91).